upper waypoint

Using Infographics to Make Sense of COVID-19 Vaccines

Save ArticleSave Article
Failed to save article

Please try again

An infographic created by one of Merek Chang's students explaining how the Johnson & Johnson COVID-19 vaccine works.

Merek Chang is a high school chemistry and engineering teacher in Southern Califronia and is a KQED Media Literacy Innovator. Learn how to incorporate infographics into your STEM classroom at our workshop on April 29 at 4pm PT: Infographics to Strengthen Data Literacy and Student Voice in Science.

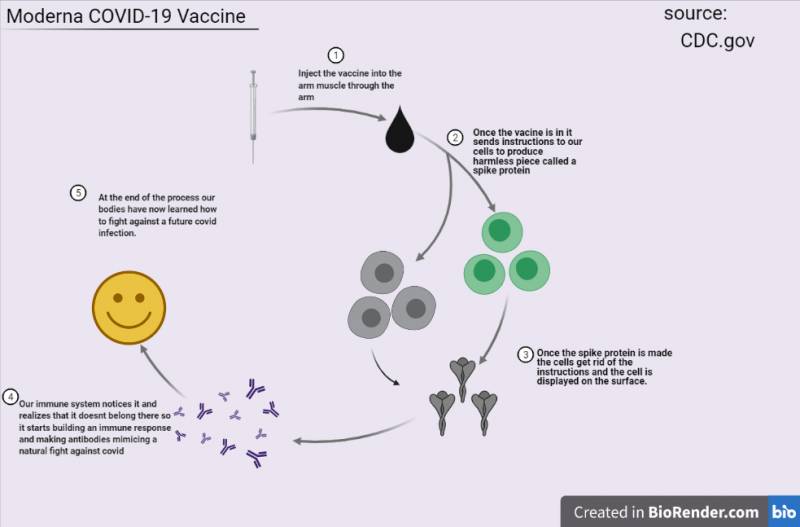
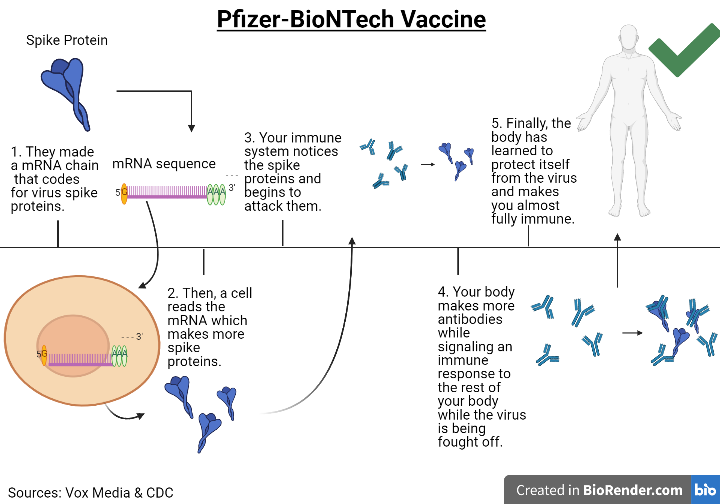
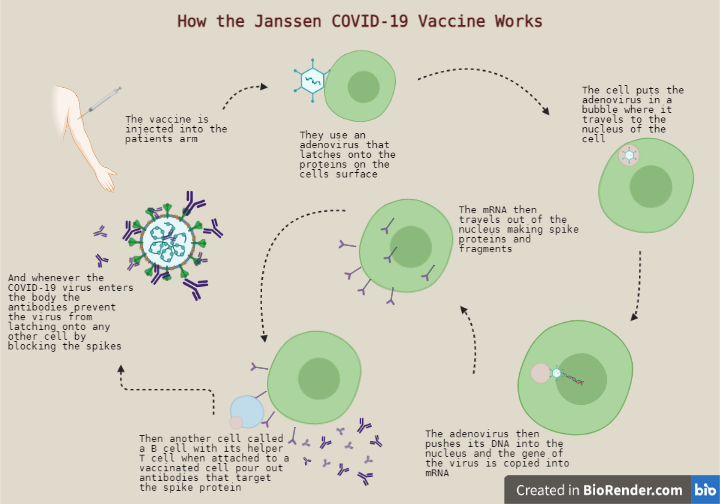
If you’re a high school biology teacher like me, transcription and translation (also known as protein synthesis or the central dogma of DNA) are not necessarily the most exciting material. But with viral vector and mRNA COVID-19 vaccines in the forefront of the daily news cycle, it gave me an idea on how to make protein synthesis more relevant to my freshman students. Both mRNA (used in the Pfizer-BioNTech and Moderna vaccines) and DNA (used in the Johnson and Johnson vaccine) are key pieces in the process of protein synthesis. To help them learn this process, I had them create an infographic on how the various COVID-19 vaccines work.

During distance learning, measuring student understanding of content through traditional multiple choice and free response exams has been difficult. Instead, I have turned to media making projects where students have to demonstrate their mastery of the content through their ability to present and communicate what they have learned with others. Through the process of creating their COVID-19 infographics, students had to evaluate online sources, analyze different forms of media and present information in a manner which made sense to them.

For this project I used BioRender, a free infographic and poster generator to be used specifically for science projects. I gave my students some basic infographic templates, video and online resources on the different COVID-19 vaccines, and a rubric to follow to generate their infographics. Students used existing sources to research their infographics, but independently wrote the steps and chose the images for their infographic through BioRender.

An infographic created by one of Merek Chang’s students explaining how the Moderna COVID-19 vaccine works. (Image courtesy of Merek Chang)


An infographic created by one of Merek Chang’s students explaining how the Pfizer-BioNTech COVID-19 vaccine works. (Image courtesy of Merek Chang)

Sponsored

Then I asked my students to share their infographic with a family member or friend and write a reflection on their experience doing so. This was the part of the project I enjoyed the most. By having students present their work to their family members and friends, students worked with the content in an authentic setting. In reading the student reflections on their experience with sharing their infographics with others, many of them identified how they felt nervous as many of them (high school freshman) have never done something like this before. Many students also wrote that after sharing their work with others, they felt a sense of empowerment and that they had, hopefully, made a genuine impact on the people they presented to. Here are some excerpts from their reflections:

“Sharing my own work to one of my family members was a different experience. I hardly ever had to share any projects with someone I know but it wasn’t that bad, it was actually pretty easy and fun to present to [my grandma].Since she doesn’t really know anything about the vaccines, I feel like my infographic helped her understand it better in my words than in other sources she was reading about.”

“I shared my infographic with my dad. When I was sharing my work I got kind of nervous because I don’t really like showing my work, but it boosted my confidence. I feel like my dad learned something from my infographic because before he didn’t know how the covid vaccines really work and he doesn’t really know which one to get, so my infographic gave him a better understanding of the Pfizer vaccine.”

“When I shared my own work it felt nice since it was good work and I was happy with it. My brother actually seemed to learn a lot about it and felt more comfortable with the idea of the vaccine since no one else prior had even bothered to teach us anything about the vaccine in our household.”

As an educator during this unprecedented school year, I have had countless lessons and activities fall flat on their face. However, this particular lesson was something that I was extremely happy.  It was clear that most of my students took something away from this experience. I am looking forward to continuing to use infographics in my classroom and finding relevant content for my students to create and share with authentic audiences.

Learn how to incorporate infographics into your STEM classroom at our workshop on April 29 at 4pm PT: Infographics to Strengthen Data Literacy and Student Voice in Science

lower waypoint
next waypoint