Students’ race and ethnicity affect their chances of earning a college degree, according to several new reports on higher education released in January and February 2023. However, the picture that emerges depends on the lens you use. College degrees are increasing among all racial and ethnic groups, but white and Asian Americans are far more likely to hold a college degree or earn one than Black, Hispanic or Native Americans.
Earning a college degree involves two steps: starting college and finishing college. Before the pandemic, white, Black and Hispanic Americans were enrolling in college at about the same rates, especially when unemployment was high and jobs were hard to find. (Asian Americans enrolled in college at much higher rates.) The bigger distinction is that once a student has started college, the likelihood of making it through the coursework and tuition payments and ultimately earning a degree varies so much by race and ethnicity.
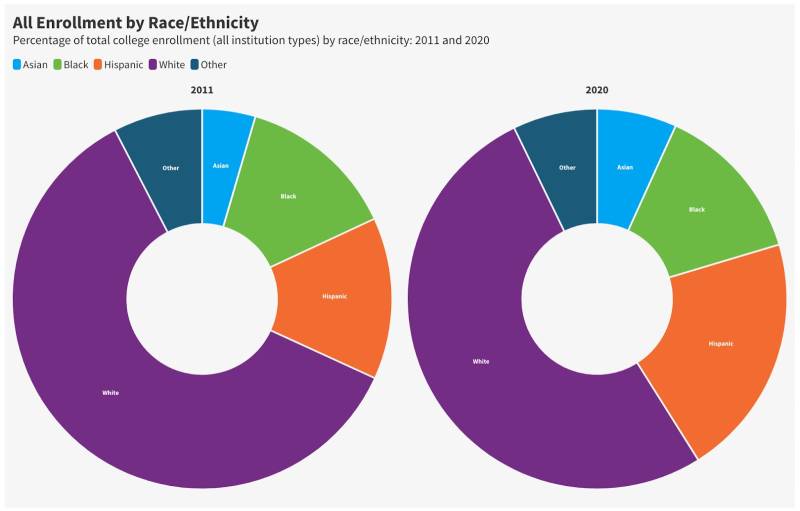
First, let’s begin with enrollment. There are two ways to look at this. One is to see how the demographic makeup of college campuses has changed over time, becoming less white and more Hispanic. The pie charts below were produced in January by the National Student Clearinghouse, a nonprofit organization that provides data reporting services to colleges. In conjunction with these services, it monitors trends in higher education by aggregating the data submitted by more than 3,600 institutions, representing 97 percent of the students at the nation’s degree-granting colleges and universities. Earlier this year, the organization launched a DEI Data Lab site to put a spotlight on how college enrollment, persistence and completion vary by race and ethnicity.
In 2011, as the pie chart on the left shows, more than 60 percent of the nation’s 20.6 million college students were white, according to an estimate by the National Student Clearinghouse. By 2020, the year represented by the pie chart on the right, the total number of college students had fallen to 17.8 million and the share of white students had dropped by almost 9 percentage points to 52 percent, still a majority. During the same period, the share of Hispanic students grew from 14 percent to 21 percent, and the share of Black students remained constant at just under 14 percent. Asian students increased from 5 to 7 percent of the college population. This represents all undergraduate college students, both younger students entering straight after high school and older nontraditional students, studying full-time and part-time, and attending both four-year universities and two-year colleges.
The 2011 figures are rough estimates because only one out of five colleges reported race and ethnicity of students to the Clearinghouse. Today, more than three out of five colleges report on the race and ethnicity of their students to the Clearinghouse. (For the original version of this pie chart, click here.)
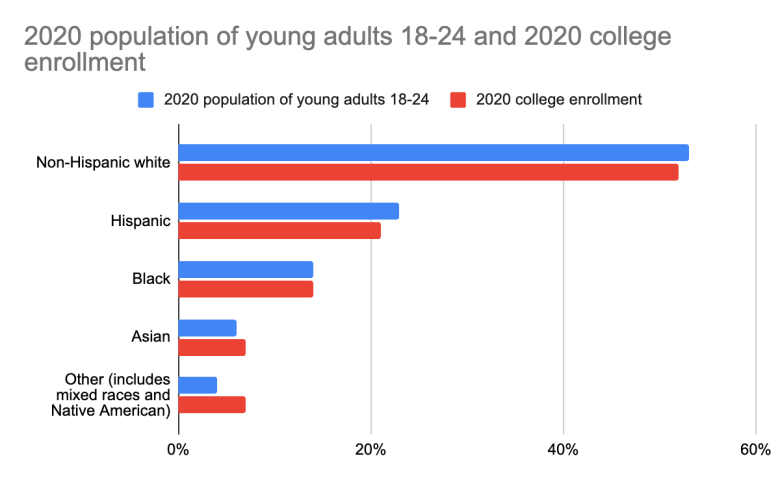
How should we think about these college enrollment numbers? Do they largely mirror each racial and ethnic group’s share of the population? I was surprised to learn that the answer is yes – with a few caveats. Asian Americans are slightly overrepresented on college campuses and Hispanic Americans are slightly underrepresented.
I created this chart below, comparing the National Student Clearinghouse’s college enrollment data for 2020 with the young adult population, as reported by the U.S Census, so you can see how closely college enrollment tracks actual demographics.
Chart created by Jill Barshay/The Hechinger Report. Data sources: Adult population collected by the Annie E. Casey Foundation’s Kids Count Data Center, originating from the U.S. Census Bureau. College enrollment from the National Student Clearinghouse’s DEI Data Lab.
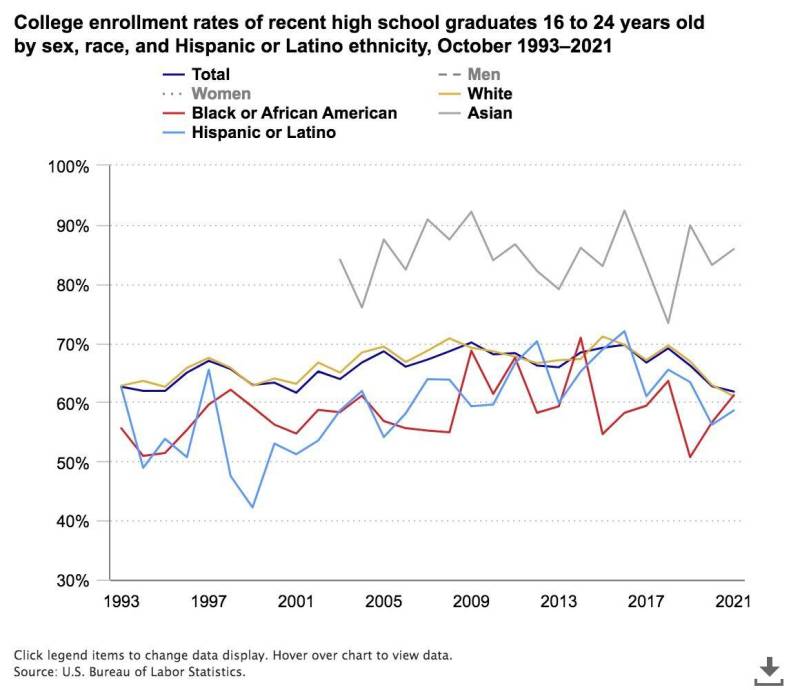
Another way to look at college enrollment is to see how many young adults enroll in college. The chart below, by the U.S. Bureau of Labor Statistics, shows that the college enrollment rates of Black and Hispanic young adults improved after the 2008 recession, and approached the college going rate of white Americans. Roughly 60 percent of young Black, Hispanic and white Americansare trying for a college degree. The college going rate for Asian Americans is much higher; more than 80 percent enroll. The zigs and zags in this chart show how college going among Hispanic and Black Americans is influenced by business cycles.
The Bureau of Labor Statistics obtains enrollment data from the Current Population Survey (CPS), a monthly survey of households conducted by the Bureau of Census. (Here is the chart on the BLS site.)
When jobs are plentiful, many low-income students may join the labor force and defer their higher education. That especially reduces enrollments among Black and Hispanic young adults, among whom poverty rates are higher. When unemployment is high, more young adults enroll at college, particularly at two-year community colleges. Most recently, during the pandemic, many young Americans deferred college to help support or take care of their families. Some students chose to wait until in-person classes resumed.
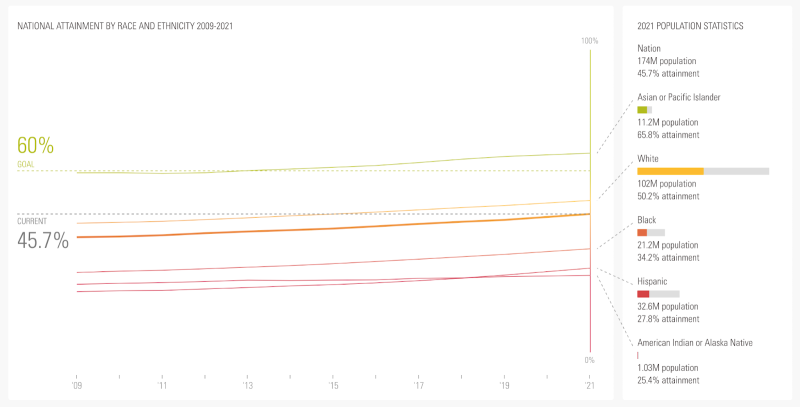
Going to college is one thing; finishing it is another. This fourth chart, produced by the Lumina Foundation, shows that over time, more Americans of every race and ethnicity are earning college degrees. The Lumina Foundation is a private foundation that seeks to increase the number of adults with college degrees and other credentials, and was formed through the sale to Sallie Mae of USA Group's assets that were used to create and collect monthly payments on student loans.* It is also among the many funders of The Hechinger Report.
Share of adult population, ages 25-64, with college degrees
This chart above, originally published here on Jan. 31, is based on data from the U.S. Census Bureau’s American Community Survey. It tracks the percentage of adults 25 to 64 with two-year associate and four-year bachelor’s degrees. The share of Americans with a college degree rose from 38 percent in 2009 to nearly 46 percent in 2021 – an increase of eight percentage points.
Every race and ethnicity saw gains. The eight-percentage point gain was the same for both Black and white adults.
But racial gaps continue. In 2021, there remained an enormous 40 percentage point difference between Asian American adults, among whom 66 percent have a college degree, and Native American adults, among whom only 25 percent have a college degree. Among Black adults, 34 percent have college degrees. Among Hispanic adults, it’s 28 percent and among white adults, it’s 50 percent.
Improvements in college attainment can seem slow because graduation rates are much lower among Americans over 35. It takes years for higher college graduation rates among younger adults to raise overall college numbers. College attainment rates have jumped the fastest among young Hispanic adults under age 35, rising from below 20 percent in 2009 to above 30 percent in 2021. Courtney Brown, the chief data and research officer at Lumina, credits a variety of support programs, from tutoring to food pantries, and the convenience of online courses to explain why more young people are graduating, despite rising tuition costs. “Colleges are trying to serve students better,” said Brown. “Even the way they staff colleges, not all on getting enrollments but having more success coaches available and counselors helping students get to the finish line.”
Still, Brown acknowledges that it’s been difficult to make a dent in the stubborn gaps in college attainment between people of different races and ethnicities. “Unfortunately, everyone is increasing,” Brown said. “And so we are not seeing those gaps reduced.”
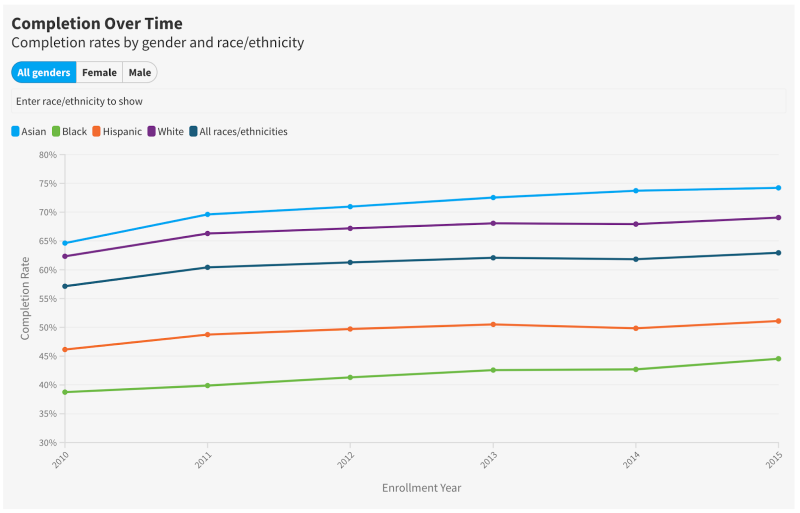
The National Student Clearinghouse’s DEI Data Lab also shows this completion problem starkly.
Credit: National Student Clearinghouse’s DEI Data Lab 2023
This chart tracks cohorts of students who began college at the same time and calculates how many of them earned any college degree within six years. Among students who started college in the fall of 2010, 62 percent of white students completed a degree by the summer of 2016, compared with only 39 percent of Black students. That’s a giant 23 percentage point gap, and a sign that a disproportionate number of Black students are dropping out of college in debt. Completion rates improved considerably for students who started college in 2015, but large gaps remain. Almost 70 percent of white students completed a degree by the summer of 2021, but only 45 percent of Black students hit this milestone. The Black-white college completion gap actually widened slightly from 23 to 24 percentage points.
The reasons for why completion rates remain much lower for Black, Hispanic and Native American students are complex. These students are more likely to attend community colleges, which have lower funding per student and fewer support services. Many students weren’t adequately prepared in high schools to handle college-level coursework, especially in math.
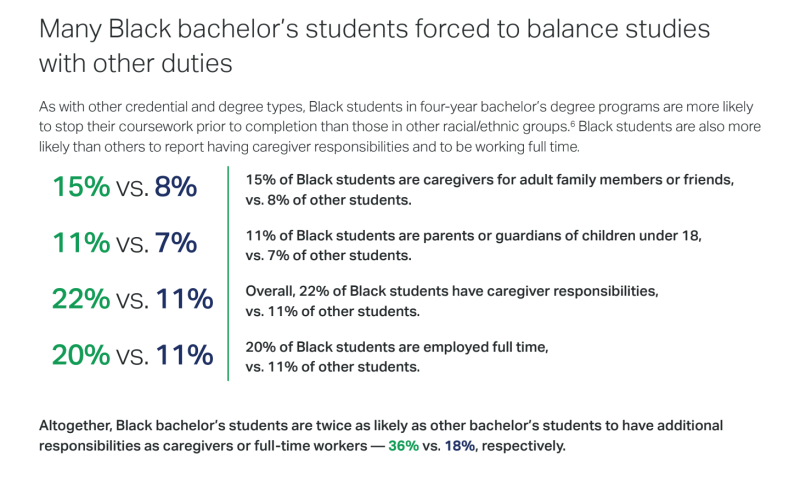
A poll of Black college students by Gallup-Lumina, released on Feb. 9, found that 21 percent of Black students report feeling discriminated against frequently or occasionally at the college they are attending, and that 45 percent have considered dropping out in the past six months. Black students in bachelor’s programs are far more likely to juggle family and work responsibilities alongside their studies.
“Black students are encountering so much more discrimination, and they have multiple responsibilities that no other race or ethnicity really has,” said Lumina’s Brown. “A lot of it is that Black students are more likely to have children. Working full time, having children and trying to get a bachelor’s degree at the same time is just obviously overwhelming.”
Credit: Excerpt from Balancing Act, Gallup and the Lumina Foundation, 2023, p. 6.
On Feb. 2, the National Student Clearinghouse Research Center released the most recent college enrollment numbers for 2022. Undergraduate enrollment for both white and Black students fell for the fifth straight year, while enrollment of Hispanic and Asian students at public two-year colleges improved. However, their numbers are below pre-pandemic levels. For example, there were roughly 975,000 Hispanic students enrolled in public two-year colleges, also called community colleges, in the fall of 2022, up from 944,000 in the fall of 2021, but considerably down from 1.14 million in 2019. (Click here and navigate to the demographics tab for these fall 2022 charts.)
And here’s a startling data point: Black student enrollment at two-year community colleges declined by a staggering 44 percent, from 1.2 million in 2010 to 670,000 in 2020, according to a Sept. 2022 report by the Joint Center for Political and Economic Studies, a think tank that studies policy issues affecting Black Americans.
Fewer students at college now certainly means fewer college-educated adults in the years ahead. And that is not a promising future.
* Correction: An earlier version incorrectly said that Lumina was founded through the sale of Sallie Mae, instead of USA Group’s sale of assets to Sallie Mae. USA Group was sold, not Sallie Mae.
This story about higher ed data was written by Jill Barshay and produced by The Hechinger Report, a nonprofit, independent news organization focused on inequality and innovation in education. Sign up for the Hechinger newsletter.
lower waypointnext waypoint
Player sponsored by
window.__IS_SSR__=true
window.__INITIAL_STATE__={
"attachmentsReducer": {
"audio_0": {
"type": "attachments",
"id": "audio_0",
"imgSizes": {
"kqedFullSize": {
"file": "https://ww2.kqed.org/news/wp-content/themes/KQED-unified/img/audio_bgs/background0.jpg"
}
}
},
"audio_1": {
"type": "attachments",
"id": "audio_1",
"imgSizes": {
"kqedFullSize": {
"file": "https://ww2.kqed.org/news/wp-content/themes/KQED-unified/img/audio_bgs/background1.jpg"
}
}
},
"audio_2": {
"type": "attachments",
"id": "audio_2",
"imgSizes": {
"kqedFullSize": {
"file": "https://ww2.kqed.org/news/wp-content/themes/KQED-unified/img/audio_bgs/background2.jpg"
}
}
},
"audio_3": {
"type": "attachments",
"id": "audio_3",
"imgSizes": {
"kqedFullSize": {
"file": "https://ww2.kqed.org/news/wp-content/themes/KQED-unified/img/audio_bgs/background3.jpg"
}
}
},
"audio_4": {
"type": "attachments",
"id": "audio_4",
"imgSizes": {
"kqedFullSize": {
"file": "https://ww2.kqed.org/news/wp-content/themes/KQED-unified/img/audio_bgs/background4.jpg"
}
}
},
"placeholder": {
"type": "attachments",
"id": "placeholder",
"imgSizes": {
"thumbnail": {
"file": "https://cdn.kqed.org/wp-content/uploads/2024/12/KQED-Default-Image-816638274-2000x1333-1-160x107.jpg",
"width": 160,
"height": 107,
"mimeType": "image/jpeg"
},
"medium": {
"file": "https://cdn.kqed.org/wp-content/uploads/2024/12/KQED-Default-Image-816638274-2000x1333-1-800x533.jpg",
"width": 800,
"height": 533,
"mimeType": "image/jpeg"
},
"medium_large": {
"file": "https://cdn.kqed.org/wp-content/uploads/2024/12/KQED-Default-Image-816638274-2000x1333-1-768x512.jpg",
"width": 768,
"height": 512,
"mimeType": "image/jpeg"
},
"large": {
"file": "https://cdn.kqed.org/wp-content/uploads/2024/12/KQED-Default-Image-816638274-2000x1333-1-1020x680.jpg",
"width": 1020,
"height": 680,
"mimeType": "image/jpeg"
},
"1536x1536": {
"file": "https://cdn.kqed.org/wp-content/uploads/2024/12/KQED-Default-Image-816638274-2000x1333-1-1536x1024.jpg",
"width": 1536,
"height": 1024,
"mimeType": "image/jpeg"
},
"fd-lrg": {
"file": "https://cdn.kqed.org/wp-content/uploads/2024/12/KQED-Default-Image-816638274-2000x1333-1-1536x1024.jpg",
"width": 1536,
"height": 1024,
"mimeType": "image/jpeg"
},
"fd-med": {
"file": "https://cdn.kqed.org/wp-content/uploads/2024/12/KQED-Default-Image-816638274-2000x1333-1-1020x680.jpg",
"width": 1020,
"height": 680,
"mimeType": "image/jpeg"
},
"fd-sm": {
"file": "https://cdn.kqed.org/wp-content/uploads/2024/12/KQED-Default-Image-816638274-2000x1333-1-800x533.jpg",
"width": 800,
"height": 533,
"mimeType": "image/jpeg"
},
"post-thumbnail": {
"file": "https://cdn.kqed.org/wp-content/uploads/2024/12/KQED-Default-Image-816638274-2000x1333-1-672x372.jpg",
"width": 672,
"height": 372,
"mimeType": "image/jpeg"
},
"twentyfourteen-full-width": {
"file": "https://cdn.kqed.org/wp-content/uploads/2024/12/KQED-Default-Image-816638274-2000x1333-1-1038x576.jpg",
"width": 1038,
"height": 576,
"mimeType": "image/jpeg"
},
"xxsmall": {
"file": "https://cdn.kqed.org/wp-content/uploads/2024/12/KQED-Default-Image-816638274-2000x1333-1-160x107.jpg",
"width": 160,
"height": 107,
"mimeType": "image/jpeg"
},
"xsmall": {
"file": "https://cdn.kqed.org/wp-content/uploads/2024/12/KQED-Default-Image-816638274-2000x1333-1-672x372.jpg",
"width": 672,
"height": 372,
"mimeType": "image/jpeg"
},
"small": {
"file": "https://cdn.kqed.org/wp-content/uploads/2024/12/KQED-Default-Image-816638274-2000x1333-1-672x372.jpg",
"width": 672,
"height": 372,
"mimeType": "image/jpeg"
},
"xlarge": {
"file": "https://cdn.kqed.org/wp-content/uploads/2024/12/KQED-Default-Image-816638274-2000x1333-1-1020x680.jpg",
"width": 1020,
"height": 680,
"mimeType": "image/jpeg"
},
"full-width": {
"file": "https://cdn.kqed.org/wp-content/uploads/2024/12/KQED-Default-Image-816638274-2000x1333-1-1920x1280.jpg",
"width": 1920,
"height": 1280,
"mimeType": "image/jpeg"
},
"guest-author-32": {
"file": "https://cdn.kqed.org/wp-content/uploads/2025/01/KQED-Default-Image-816638274-1333x1333-1-160x160.jpg",
"width": 32,
"height": 32,
"mimeType": "image/jpeg"
},
"guest-author-50": {
"file": "https://cdn.kqed.org/wp-content/uploads/2025/01/KQED-Default-Image-816638274-1333x1333-1-160x160.jpg",
"width": 50,
"height": 50,
"mimeType": "image/jpeg"
},
"guest-author-64": {
"file": "https://cdn.kqed.org/wp-content/uploads/2025/01/KQED-Default-Image-816638274-1333x1333-1-160x160.jpg",
"width": 64,
"height": 64,
"mimeType": "image/jpeg"
},
"guest-author-96": {
"file": "https://cdn.kqed.org/wp-content/uploads/2025/01/KQED-Default-Image-816638274-1333x1333-1-160x160.jpg",
"width": 96,
"height": 96,
"mimeType": "image/jpeg"
},
"guest-author-128": {
"file": "https://cdn.kqed.org/wp-content/uploads/2025/01/KQED-Default-Image-816638274-1333x1333-1-160x160.jpg",
"width": 128,
"height": 128,
"mimeType": "image/jpeg"
},
"detail": {
"file": "https://cdn.kqed.org/wp-content/uploads/2025/01/KQED-Default-Image-816638274-1333x1333-1-160x160.jpg",
"width": 160,
"height": 160,
"mimeType": "image/jpeg"
},
"kqedFullSize": {
"file": "https://cdn.kqed.org/wp-content/uploads/2024/12/KQED-Default-Image-816638274-2000x1333-1.jpg",
"width": 2000,
"height": 1333
}
}
},
"mindshift_61048": {
"type": "attachments",
"id": "mindshift_61048",
"meta": {
"index": "attachments_1716263798",
"site": "mindshift",
"id": "61048",
"found": true
},
"parent": 61037,
"imgSizes": {
"twentyfourteen-full-width": {
"file": "https://ww2.kqed.org/app/uploads/sites/23/2023/02/a_image-1038x576.jpe",
"width": 1038,
"mimeType": "image/jpeg",
"height": 576
},
"thumbnail": {
"file": "https://ww2.kqed.org/app/uploads/sites/23/2023/02/a_image-160x102.jpe",
"width": 160,
"mimeType": "image/jpeg",
"height": 102
},
"post-thumbnail": {
"file": "https://ww2.kqed.org/app/uploads/sites/23/2023/02/a_image-672x372.jpe",
"width": 672,
"mimeType": "image/jpeg",
"height": 372
},
"kqedFullSize": {
"file": "https://ww2.kqed.org/app/uploads/sites/23/2023/02/a_image.jpe",
"width": 1600,
"height": 1021
},
"large": {
"file": "https://ww2.kqed.org/app/uploads/sites/23/2023/02/a_image-1020x651.jpe",
"width": 1020,
"mimeType": "image/jpeg",
"height": 651
},
"1536x1536": {
"file": "https://ww2.kqed.org/app/uploads/sites/23/2023/02/a_image-1536x980.jpe",
"width": 1536,
"mimeType": "image/jpeg",
"height": 980
},
"medium": {
"file": "https://ww2.kqed.org/app/uploads/sites/23/2023/02/a_image-800x511.jpe",
"width": 800,
"mimeType": "image/jpeg",
"height": 511
},
"medium_large": {
"file": "https://ww2.kqed.org/app/uploads/sites/23/2023/02/a_image-768x490.jpe",
"width": 768,
"mimeType": "image/jpeg",
"height": 490
}
},
"publishDate": 1676767905,
"modified": 1676767979,
"caption": "National Student Clearinghouse DEI Data Lab 2023",
"description": null,
"title": "a_image",
"credit": null,
"status": "inherit",
"altTag": null,
"isLoading": false,
"fetchFailed": false
}
},
"audioPlayerReducer": {
"postId": "stream_live",
"isPaused": true,
"isPlaying": false,
"pfsActive": false,
"pledgeModalIsOpen": true,
"playerDrawerIsOpen": false,
"liveAudioPlayStartedAt": 0,
"liveAudioPlayContext": ""
},
"authorsReducer": {
"byline_mindshift_61037": {
"type": "authors",
"id": "byline_mindshift_61037",
"meta": {
"override": true
},
"slug": "byline_mindshift_61037",
"name": "Jill Barshay, \u003ca href=\"https://hechingerreport.org/\" target=\"_blank\">The Hechinger Report\u003c/a>",
"isLoading": false
}
},
"pagesReducer": {},
"pfsSessionReducer": {},
"postsReducer": {
"stream_live": {
"type": "live",
"id": "stream_live",
"audioUrl": "https://streams.kqed.org/kqedradio",
"title": "Live Stream",
"excerpt": "Live Stream information currently unavailable.",
"link": "/radio",
"featImg": "",
"label": {
"name": "KQED Live",
"link": "/"
}
},
"stream_kqedNewscast": {
"type": "posts",
"id": "stream_kqedNewscast",
"audioUrl": "https://www.kqed.org/.stream/anon/radio/RDnews/newscast.mp3?_=1",
"title": "KQED Newscast",
"featImg": "",
"label": {
"name": "88.5 FM",
"link": "/"
}
},
"mindshift_61037": {
"type": "posts",
"id": "mindshift_61037",
"meta": {
"index": "posts_1716263798",
"site": "mindshift",
"id": "61037",
"found": true
},
"articlePosition": 0,
"parent": 0,
"labelTerm": {
"site": "mindshift"
},
"blocks": [],
"publishDate": 1676890844,
"format": "standard",
"title": "College completion rates are up for all Americans, but racial gaps persist",
"headTitle": "MindShift | KQED News",
"content": "\u003cp>\u003cspan style=\"font-weight: 400\">Students’ race and ethnicity affect their chances of earning a college degree, according to several new reports on higher education released in January and February 2023. However, the picture that emerges depends on the lens you use. College degrees are increasing among all racial and ethnic groups, but white and Asian Americans are far more likely to hold a college degree or earn one than Black, Hispanic or Native Americans. \u003c/span>\u003c/p>\n\u003cp>\u003cspan style=\"font-weight: 400\">Earning a college degree involves two steps: starting college and finishing college. Before the pandemic, white, Black and Hispanic Americans were enrolling in college at about the same rates, especially when unemployment was high and jobs were hard to find. (Asian Americans enrolled in college at much higher rates.) The bigger distinction is that once a student has started college, the likelihood of making it through the coursework and tuition payments and ultimately earning a degree varies so much by race and ethnicity. \u003c/span>\u003c/p>\n\u003cp>\u003cspan style=\"font-weight: 400\">First, let’s begin with enrollment. There are two ways to look at this. One is to see how the demographic makeup of college campuses has changed over time, becoming less white and more Hispanic. The pie charts below were produced in January by the National Student Clearinghouse, a nonprofit organization that provides data reporting services to colleges. In conjunction with these services, it monitors trends in higher education by aggregating the data submitted by more than 3,600 institutions, representing 97 percent of the students at the nation’s degree-granting colleges and universities. Earlier this year, the organization launched a \u003c/span>\u003ca href=\"https://www.studentclearinghouse.org/dei-data-lab/\" target=\"_blank\" rel=\"noopener\">\u003cspan style=\"font-weight: 400\">DEI Data Lab\u003c/span>\u003c/a>\u003cspan style=\"font-weight: 400\"> site to put a spotlight on how college enrollment, persistence and completion vary by race and ethnicity.\u003c/span>\u003c/p>\n\u003cfigure id=\"attachment_61048\" class=\"wp-caption alignnone\" style=\"max-width: 800px\">\u003cimg decoding=\"async\" loading=\"lazy\" class=\"size-medium wp-image-61048\" src=\"https://ww2.kqed.org/app/uploads/sites/23/2023/02/a_image-800x511.jpe\" alt=\"\" width=\"800\" height=\"511\" srcset=\"https://ww2.kqed.org/app/uploads/sites/23/2023/02/a_image-800x511.jpe 800w, https://ww2.kqed.org/app/uploads/sites/23/2023/02/a_image-1020x651.jpe 1020w, https://ww2.kqed.org/app/uploads/sites/23/2023/02/a_image-160x102.jpe 160w, https://ww2.kqed.org/app/uploads/sites/23/2023/02/a_image-768x490.jpe 768w, https://ww2.kqed.org/app/uploads/sites/23/2023/02/a_image-1536x980.jpe 1536w, https://ww2.kqed.org/app/uploads/sites/23/2023/02/a_image.jpe 1600w\" sizes=\"(max-width: 800px) 100vw, 800px\">\u003cfigcaption class=\"wp-caption-text\">National Student Clearinghouse \u003ca href=\"https://www.studentclearinghouse.org/dei-data-lab/research-data/enrollment/\" target=\"_blank\" rel=\"noopener\">DEI Data Lab\u003c/a> 2023\u003c/figcaption>\u003c/figure>\n\u003cp>\u003cspan style=\"font-weight: 400\">In 2011, as the pie chart on the left shows, more than 60 percent of the nation’s 20.6 million college students were white, according to an estimate by the National Student Clearinghouse. By 2020, the year represented by the pie chart on the right, the total number of college students had fallen to 17.8 million and the share of white students had dropped by almost 9 percentage points to 52 percent, still a majority. During the same period, the share of Hispanic students grew from 14 percent to 21 percent, and the share of Black students remained constant at just under 14 percent. Asian students increased from 5 to 7 percent of the college population. This represents all undergraduate college students, both younger students entering straight after high school and older nontraditional students, studying full-time and part-time, and attending both four-year universities and two-year colleges. \u003c/span>\u003c/p>\n\u003cp>\u003cspan style=\"font-weight: 400\">The 2011 figures are rough estimates because only one out of five colleges reported race and ethnicity of students to the Clearinghouse. Today, more than three out of five colleges report on the race and ethnicity of their students to the Clearinghouse. (For the original version of this pie chart, \u003c/span>\u003ca href=\"https://www.studentclearinghouse.org/dei-data-lab/research-data/enrollment/\" target=\"_blank\" rel=\"noopener\">\u003cspan style=\"font-weight: 400\">click here\u003c/span>\u003c/a>\u003cspan style=\"font-weight: 400\">.)\u003c/span>\u003c/p>\n\u003cp>[ad fullwidth]\u003c/p>\n\u003cp>\u003cspan style=\"font-weight: 400\">How should we think about these college enrollment numbers? Do they largely mirror each racial and ethnic group’s share of the population? I was surprised to learn that the answer is yes – with a few caveats. Asian Americans are slightly overrepresented on college campuses and Hispanic Americans are slightly underrepresented. \u003c/span>\u003c/p>\n\u003cp>\u003cspan style=\"font-weight: 400\">I created this chart below, comparing the National Student Clearinghouse’s college enrollment data for 2020 with the young adult population, as reported by the U.S Census, so you can see how closely college enrollment tracks actual demographics.\u003c/span>\u003c/p>\n\u003cfigure id=\"attachment_61044\" class=\"wp-caption alignnone\" style=\"max-width: 780px\">\u003cimg decoding=\"async\" loading=\"lazy\" class=\"size-full wp-image-61044\" src=\"https://ww2.kqed.org/app/uploads/sites/23/2023/02/image4.png\" alt=\"\" width=\"780\" height=\"482\" srcset=\"https://ww2.kqed.org/app/uploads/sites/23/2023/02/image4.png 780w, https://ww2.kqed.org/app/uploads/sites/23/2023/02/image4-160x99.png 160w, https://ww2.kqed.org/app/uploads/sites/23/2023/02/image4-768x475.png 768w\" sizes=\"(max-width: 780px) 100vw, 780px\">\u003cfigcaption class=\"wp-caption-text\">Chart created by Jill Barshay/The Hechinger Report. Data sources: Adult population collected by the Annie E. Casey Foundation’s \u003ca href=\"https://datacenter.kidscount.org/data/tables/11207-young-adult-population-ages-18-to-24-by-race-and-ethnicity#detailed/1/any/false/2048,574,1729,37,871,870,573,869,36,868/68,69,67,12,70,66,71,7983/21595,21596\" target=\"_blank\" rel=\"noopener\">Kids Count Data Center\u003c/a>, originating from the U.S. Census Bureau. College enrollment from the National Student Clearinghouse’s \u003ca href=\"https://www.studentclearinghouse.org/dei-data-lab/research-data/enrollment/\" target=\"_blank\" rel=\"noopener\">DEI Data Lab\u003c/a>.\u003c/figcaption>\u003c/figure>\n\u003cp>\u003cspan style=\"font-weight: 400\">Another way to look at college enrollment is to see how many young adults enroll in college. The chart below, by the U.S. Bureau of Labor Statistics, shows that the college enrollment rates of Black and Hispanic young adults improved after the 2008 recession, and approached the college going rate of white Americans. Roughly 60 percent of young Black, Hispanic and white Americans\u003c/span> \u003cspan style=\"font-weight: 400\">are trying for a college degree. The college going rate for Asian Americans is much higher; more than 80 percent enroll. The zigs and zags in this chart show how college going among Hispanic and Black Americans is influenced by business cycles. \u003c/span>\u003c/p>\n\u003cp>\u003cimg decoding=\"async\" loading=\"lazy\" class=\"alignnone size-medium wp-image-61043\" src=\"https://ww2.kqed.org/app/uploads/sites/23/2023/02/image3-800x690.jpg\" alt=\"\" width=\"800\" height=\"690\" srcset=\"https://ww2.kqed.org/app/uploads/sites/23/2023/02/image3-800x690.jpg 800w, https://ww2.kqed.org/app/uploads/sites/23/2023/02/image3-1020x879.jpg 1020w, https://ww2.kqed.org/app/uploads/sites/23/2023/02/image3-160x138.jpg 160w, https://ww2.kqed.org/app/uploads/sites/23/2023/02/image3-768x662.jpg 768w, https://ww2.kqed.org/app/uploads/sites/23/2023/02/image3.jpg 1160w\" sizes=\"(max-width: 800px) 100vw, 800px\">\u003c/p>\n\u003cp>\u003cspan style=\"font-weight: 400\">The Bureau of Labor Statistics obtains enrollment data from the Current Population Survey (CPS), a monthly survey of households conducted by the Bureau of Census. (Here is the \u003c/span>\u003ca href=\"https://www.bls.gov/opub/ted/2022/61-8-percent-of-recent-high-school-graduates-enrolled-in-college-in-october-2021.htm\" target=\"_blank\" rel=\"noopener\">\u003cspan style=\"font-weight: 400\">chart on the BLS site\u003c/span>\u003c/a>\u003cspan style=\"font-weight: 400\">.)\u003c/span>\u003c/p>\n\u003cp>\u003cspan style=\"font-weight: 400\">When jobs are plentiful, many low-income students may join the labor force and defer their higher education. That especially reduces enrollments among Black and Hispanic young adults, among whom poverty rates are higher. When unemployment is high, more young adults enroll at college, particularly at two-year community colleges. Most recently, during the pandemic, many young Americans deferred college to help support or take care of their families. Some students chose to wait until in-person classes resumed. \u003c/span>\u003c/p>\n\u003cp>\u003cspan style=\"font-weight: 400\">Going to college is one thing; finishing it is another. This fourth chart, produced by the Lumina Foundation, shows that over time, more Americans of every race and ethnicity are earning college degrees. \u003c/span>The Lumina Foundation is a private foundation that seeks to increase the number of adults with college degrees and other credentials, and was formed through the sale to Sallie Mae of USA Group's assets that were used to create and collect monthly payments on student loans.* It is also among the many funders of The Hechinger Report.\u003c/p>\n\u003cp>\u003cb>Share of adult population, ages 25-64, with college degrees\u003c/b>\u003c/p>\n\u003cfigure id=\"attachment_61040\" class=\"wp-caption alignnone\" style=\"max-width: 800px\">\u003cimg decoding=\"async\" loading=\"lazy\" class=\"size-medium wp-image-61040\" src=\"https://ww2.kqed.org/app/uploads/sites/23/2023/02/image6-800x407.png\" alt=\"\" width=\"800\" height=\"407\" srcset=\"https://ww2.kqed.org/app/uploads/sites/23/2023/02/image6-800x407.png 800w, https://ww2.kqed.org/app/uploads/sites/23/2023/02/image6-1020x518.png 1020w, https://ww2.kqed.org/app/uploads/sites/23/2023/02/image6-160x81.png 160w, https://ww2.kqed.org/app/uploads/sites/23/2023/02/image6-768x390.png 768w, https://ww2.kqed.org/app/uploads/sites/23/2023/02/image6-1536x780.png 1536w, https://ww2.kqed.org/app/uploads/sites/23/2023/02/image6.png 1600w\" sizes=\"(max-width: 800px) 100vw, 800px\">\u003cfigcaption class=\"wp-caption-text\">Credit: The Lumina Foundation’s \u003ca href=\"https://www.luminafoundation.org/stronger-nation/report/#/progress/racial_equity\" target=\"_blank\" rel=\"noopener\">A Stronger Nation\u003c/a>, 2023 update\u003c/figcaption>\u003c/figure>\n\u003cp>\u003cspan style=\"font-weight: 400\">This chart above, originally published \u003c/span>\u003ca href=\"https://www.luminafoundation.org/stronger-nation/report/#/progress/racial_equity\" target=\"_blank\" rel=\"noopener\">\u003cspan style=\"font-weight: 400\">here\u003c/span>\u003c/a>\u003cspan style=\"font-weight: 400\"> on Jan. 31, is based on data from the U.S. Census Bureau’s American Community Survey. It tracks the percentage of adults 25 to 64 with two-year associate and four-year bachelor’s degrees. The share of Americans with a college degree rose from 38 percent in 2009 to nearly 46 percent in 2021 – an increase of eight percentage points.\u003c/span>\u003c/p>\n\u003cp>\u003cspan style=\"font-weight: 400\">Every race and ethnicity saw gains. The eight-percentage point gain was the same for both Black and white adults. \u003c/span>\u003c/p>\n\u003cp>\u003cspan style=\"font-weight: 400\">But racial gaps continue. In 2021, there remained an enormous 40 percentage point difference between Asian American adults, among whom 66 percent have a college degree, and Native American adults, among whom only 25 percent have a college degree. Among Black adults, 34 percent have college degrees. Among Hispanic adults, it’s 28 percent and among white adults, it’s 50 percent. \u003c/span>\u003c/p>\n\u003cp>\u003cspan style=\"font-weight: 400\">Improvements in college attainment can seem slow because graduation rates are much lower among Americans over 35. It takes years for higher college graduation rates among younger adults to raise overall college numbers. College attainment rates have jumped the fastest among young Hispanic adults under age 35, rising from below 20 percent in 2009 to above 30 percent in 2021. Courtney Brown, the chief data and research officer at Lumina, credits a variety of support programs, from tutoring to food pantries, and the convenience of online courses to explain why more young people are graduating, despite rising tuition costs. “Colleges are trying to serve students better,” said Brown. “Even the way they staff colleges, not all on getting enrollments but having more success coaches available and counselors helping students get to the finish line.”\u003c/span>\u003c/p>\n\u003cp>\u003cspan style=\"font-weight: 400\">Still, Brown acknowledges that it’s been difficult to make a dent in the stubborn gaps in college attainment between people of different races and ethnicities. “Unfortunately, everyone is increasing,” Brown said. “And so we are not seeing those gaps reduced.”\u003c/span>\u003c/p>\n\u003cp>\u003cspan style=\"font-weight: 400\">The National Student Clearinghouse’s DEI Data Lab also shows this completion problem starkly. \u003c/span>\u003c/p>\n\u003cfigure id=\"attachment_61045\" class=\"wp-caption alignnone\" style=\"max-width: 800px\">\u003cimg decoding=\"async\" loading=\"lazy\" class=\"size-medium wp-image-61045\" src=\"https://ww2.kqed.org/app/uploads/sites/23/2023/02/image5-800x513.png\" alt=\"\" width=\"800\" height=\"513\" srcset=\"https://ww2.kqed.org/app/uploads/sites/23/2023/02/image5-800x513.png 800w, https://ww2.kqed.org/app/uploads/sites/23/2023/02/image5-1020x654.png 1020w, https://ww2.kqed.org/app/uploads/sites/23/2023/02/image5-160x103.png 160w, https://ww2.kqed.org/app/uploads/sites/23/2023/02/image5-768x492.png 768w, https://ww2.kqed.org/app/uploads/sites/23/2023/02/image5-1536x985.png 1536w, https://ww2.kqed.org/app/uploads/sites/23/2023/02/image5.png 1600w\" sizes=\"(max-width: 800px) 100vw, 800px\">\u003cfigcaption class=\"wp-caption-text\">Credit: National Student Clearinghouse’s\u003ca href=\"https://www.studentclearinghouse.org/dei-data-lab/research-data/enrollment/\" target=\"_blank\" rel=\"noopener\"> DEI Data Lab\u003c/a> 2023\u003c/figcaption>\u003c/figure>\n\u003cp>\u003cspan style=\"font-weight: 400\">This chart tracks cohorts of students who began college at the same time and calculates how many of them earned any college degree within six years. Among students who started college in the fall of 2010, 62 percent of white students completed a degree by the summer of 2016, compared with only 39 percent of Black students. That’s a giant 23 percentage point gap, and a sign that a disproportionate number of Black students are dropping out of college in debt. Completion rates improved considerably for students who started college in 2015, but large gaps remain. Almost 70 percent of white students completed a degree by the summer of 2021, but only 45 percent of Black students hit this milestone. The Black-white college completion gap actually widened slightly from 23 to 24 percentage points.\u003c/span>\u003c/p>\n\u003cp>\u003cspan style=\"font-weight: 400\">The reasons for why completion rates remain much lower for Black, Hispanic and Native American students are complex. These students are more likely to attend community colleges, which have lower funding per student and fewer support services. Many students weren’t adequately prepared in high schools to handle college-level coursework, especially in math. \u003c/span>\u003c/p>\n\u003cp>\u003cspan style=\"font-weight: 400\">A \u003c/span>\u003ca href=\"https://news.gallup.com/poll/469292/one-five-black-students-report-discrimination-experiences.aspx\" target=\"_blank\" rel=\"noopener\">\u003cspan style=\"font-weight: 400\">poll of Black college students by Gallup-Lumina\u003c/span>\u003c/a>\u003cspan style=\"font-weight: 400\">, released on Feb. 9, found that 21 percent of Black students report feeling discriminated against frequently or occasionally at the college they are attending, and that 45 percent have considered dropping out in the past six months. Black students in bachelor’s programs are far more likely to juggle family and work responsibilities alongside their studies. \u003c/span>\u003c/p>\n\u003cp>\u003cspan style=\"font-weight: 400\">“Black students are encountering so much more discrimination, and they have multiple responsibilities that no other race or ethnicity really has,” said Lumina’s Brown. “A lot of it is that Black students are more likely to have children. Working full time, having children and trying to get a bachelor’s degree at the same time is just obviously overwhelming.”\u003c/span>\u003c/p>\n\u003cfigure id=\"attachment_61041\" class=\"wp-caption alignnone\" style=\"max-width: 800px\">\u003cimg decoding=\"async\" loading=\"lazy\" class=\"size-medium wp-image-61041\" src=\"https://ww2.kqed.org/app/uploads/sites/23/2023/02/image1-800x484.png\" alt=\"\" width=\"800\" height=\"484\" srcset=\"https://ww2.kqed.org/app/uploads/sites/23/2023/02/image1-800x484.png 800w, https://ww2.kqed.org/app/uploads/sites/23/2023/02/image1-1020x617.png 1020w, https://ww2.kqed.org/app/uploads/sites/23/2023/02/image1-160x97.png 160w, https://ww2.kqed.org/app/uploads/sites/23/2023/02/image1-768x465.png 768w, https://ww2.kqed.org/app/uploads/sites/23/2023/02/image1.png 1458w\" sizes=\"(max-width: 800px) 100vw, 800px\">\u003cfigcaption class=\"wp-caption-text\">Credit: Excerpt from \u003ca href=\"https://www.luminafoundation.org/resource/balancing-act-the-tradeoffs-and-challenges-facing-black-students-in-higher-education/\" target=\"_blank\" rel=\"noopener\">Balancing Act\u003c/a>, Gallup and the Lumina Foundation, 2023, p. 6.\u003c/figcaption>\u003c/figure>\n\u003cp>\u003cspan style=\"font-weight: 400\">On Feb. 2, the National Student Clearinghouse Research Center released the most recent college enrollment numbers for 2022. Undergraduate enrollment for both white and Black students fell for the fifth straight year, while enrollment of Hispanic and Asian students at public two-year colleges improved. However, their numbers are below pre-pandemic levels. For example, there were roughly 975,000 Hispanic students enrolled in public two-year colleges, also called community colleges, in the fall of 2022, up from 944,000 in the fall of 2021, but considerably down from 1.14 million in 2019. (Click \u003c/span>\u003ca href=\"https://nscresearchcenter.org/current-term-enrollment-estimates/\" target=\"_blank\" rel=\"noopener\">\u003cspan style=\"font-weight: 400\">here\u003c/span>\u003c/a>\u003cspan style=\"font-weight: 400\"> and navigate to the demographics tab for these fall 2022 charts.) \u003c/span>\u003c/p>\n\u003cp>\u003cspan style=\"font-weight: 400\">And here’s a startling data point: Black student enrollment at two-year community colleges declined by a staggering 44 percent, from 1.2 million in 2010 to 670,000 in 2020, according to a \u003c/span>\u003ca href=\"https://jointcenter.org/wp-content/uploads/2022/09/The-State-of-Black-Students-at-Community-Colleges.pdf\" target=\"_blank\" rel=\"noopener\">\u003cspan style=\"font-weight: 400\">Sept. 2022 report\u003c/span>\u003c/a>\u003cspan style=\"font-weight: 400\"> by the Joint Center for Political and Economic Studies, a think tank that studies policy issues affecting Black Americans.\u003c/span>\u003c/p>\n\u003cp>\u003cspan style=\"font-weight: 400\">Fewer students at college now certainly means fewer college-educated adults in the years ahead. And that is not a promising future. \u003c/span>\u003c/p>\n\u003cp>\u003cem>* Correction: An earlier version incorrectly said that Lumina was founded through the sale of Sallie Mae, instead of USA Group’s sale of assets to Sallie Mae. USA Group was sold, not Sallie Mae. \u003c/em>\u003c/p>\n\u003cp>[ad floatright]\u003c/p>\n\u003cp>\u003ci>\u003cspan style=\"font-weight: 400\">This story about \u003c/span>\u003c/i>\u003ca href=\"https://hechingerreport.org/proof-points-new-higher-ed-data-by-race-and-ethnicity/\" target=\"_blank\" rel=\"noopener\">\u003ci>\u003cspan style=\"font-weight: 400\">higher ed data\u003c/span>\u003c/i>\u003c/a>\u003ci>\u003cspan style=\"font-weight: 400\"> was written by Jill Barshay and produced by \u003c/span>\u003c/i>\u003cspan style=\"font-weight: 400\">The Hechinger Report\u003c/span>\u003ci>\u003cspan style=\"font-weight: 400\">, a nonprofit, independent news organization focused on inequality and innovation in education. Sign up for the \u003c/span>\u003c/i>\u003ca href=\"http://hechingerreport.us2.list-manage1.com/subscribe?u=66c306eebb323868c3ce353c1&id=d3ee4c3e04\" target=\"_blank\" rel=\"noopener\">\u003ci>\u003cspan style=\"font-weight: 400\">Hechinger newsletter\u003c/span>\u003c/i>\u003c/a>\u003cspan style=\"font-weight: 400\">.\u003c/span>\u003c/p>\n\n",
"stats": {
"hasVideo": false,
"hasChartOrMap": false,
"hasAudio": false,
"hasPolis": false,
"wordCount": 1935,
"hasGoogleForm": false,
"hasGallery": false,
"hasHearkenModule": false,
"iframeSrcs": [],
"paragraphCount": 30
},
"modified": 1677027495,
"excerpt": "Recent reports document rise in college going and degrees across race and ethnicity, but there could be trouble ahead.",
"headData": {
"twImgId": "",
"twTitle": "",
"ogTitle": "",
"ogImgId": "",
"twDescription": "",
"description": "College attainment rates have jumped the fastest among young Hispanic adults under age 35.",
"title": "College completion rates are up for all Americans, but racial gaps persist | KQED",
"ogDescription": "",
"schema": {
"@context": "https://schema.org",
"@type": "Article",
"headline": "College completion rates are up for all Americans, but racial gaps persist",
"datePublished": "2023-02-20T03:00:44-08:00",
"dateModified": "2023-02-21T16:58:15-08:00",
"image": "https://ww2.kqed.org/app/uploads/sites/23/2023/02/a_image-1020x651.jpe"
},
"authorsData": [],
"tagData": []
},
"guestAuthors": [],
"slug": "college-completion-rates-are-up-for-all-americans-but-racial-gaps-persist",
"status": "publish",
"nprByline": "Jill Barshay, \u003ca href=\"https://hechingerreport.org/\" target=\"_blank\">The Hechinger Report\u003c/a>",
"excludeFromSiteSearch": "Include",
"showOnAuthorArchivePages": "No",
"articleAge": "0",
"path": "/mindshift/61037/college-completion-rates-are-up-for-all-americans-but-racial-gaps-persist",
"audioTrackLength": null,
"parsedContent": [
{
"type": "contentString",
"content": "\u003cdiv class=\"post-body\">\u003cp>\u003cp>\u003cspan style=\"font-weight: 400\">Students’ race and ethnicity affect their chances of earning a college degree, according to several new reports on higher education released in January and February 2023. However, the picture that emerges depends on the lens you use. College degrees are increasing among all racial and ethnic groups, but white and Asian Americans are far more likely to hold a college degree or earn one than Black, Hispanic or Native Americans. \u003c/span>\u003c/p>\n\u003cp>\u003cspan style=\"font-weight: 400\">Earning a college degree involves two steps: starting college and finishing college. Before the pandemic, white, Black and Hispanic Americans were enrolling in college at about the same rates, especially when unemployment was high and jobs were hard to find. (Asian Americans enrolled in college at much higher rates.) The bigger distinction is that once a student has started college, the likelihood of making it through the coursework and tuition payments and ultimately earning a degree varies so much by race and ethnicity. \u003c/span>\u003c/p>\n\u003cp>\u003cspan style=\"font-weight: 400\">First, let’s begin with enrollment. There are two ways to look at this. One is to see how the demographic makeup of college campuses has changed over time, becoming less white and more Hispanic. The pie charts below were produced in January by the National Student Clearinghouse, a nonprofit organization that provides data reporting services to colleges. In conjunction with these services, it monitors trends in higher education by aggregating the data submitted by more than 3,600 institutions, representing 97 percent of the students at the nation’s degree-granting colleges and universities. Earlier this year, the organization launched a \u003c/span>\u003ca href=\"https://www.studentclearinghouse.org/dei-data-lab/\" target=\"_blank\" rel=\"noopener\">\u003cspan style=\"font-weight: 400\">DEI Data Lab\u003c/span>\u003c/a>\u003cspan style=\"font-weight: 400\"> site to put a spotlight on how college enrollment, persistence and completion vary by race and ethnicity.\u003c/span>\u003c/p>\n\u003cfigure id=\"attachment_61048\" class=\"wp-caption alignnone\" style=\"max-width: 800px\">\u003cimg decoding=\"async\" loading=\"lazy\" class=\"size-medium wp-image-61048\" src=\"https://ww2.kqed.org/app/uploads/sites/23/2023/02/a_image-800x511.jpe\" alt=\"\" width=\"800\" height=\"511\" srcset=\"https://ww2.kqed.org/app/uploads/sites/23/2023/02/a_image-800x511.jpe 800w, https://ww2.kqed.org/app/uploads/sites/23/2023/02/a_image-1020x651.jpe 1020w, https://ww2.kqed.org/app/uploads/sites/23/2023/02/a_image-160x102.jpe 160w, https://ww2.kqed.org/app/uploads/sites/23/2023/02/a_image-768x490.jpe 768w, https://ww2.kqed.org/app/uploads/sites/23/2023/02/a_image-1536x980.jpe 1536w, https://ww2.kqed.org/app/uploads/sites/23/2023/02/a_image.jpe 1600w\" sizes=\"(max-width: 800px) 100vw, 800px\">\u003cfigcaption class=\"wp-caption-text\">National Student Clearinghouse \u003ca href=\"https://www.studentclearinghouse.org/dei-data-lab/research-data/enrollment/\" target=\"_blank\" rel=\"noopener\">DEI Data Lab\u003c/a> 2023\u003c/figcaption>\u003c/figure>\n\u003cp>\u003cspan style=\"font-weight: 400\">In 2011, as the pie chart on the left shows, more than 60 percent of the nation’s 20.6 million college students were white, according to an estimate by the National Student Clearinghouse. By 2020, the year represented by the pie chart on the right, the total number of college students had fallen to 17.8 million and the share of white students had dropped by almost 9 percentage points to 52 percent, still a majority. During the same period, the share of Hispanic students grew from 14 percent to 21 percent, and the share of Black students remained constant at just under 14 percent. Asian students increased from 5 to 7 percent of the college population. This represents all undergraduate college students, both younger students entering straight after high school and older nontraditional students, studying full-time and part-time, and attending both four-year universities and two-year colleges. \u003c/span>\u003c/p>\n\u003cp>\u003cspan style=\"font-weight: 400\">The 2011 figures are rough estimates because only one out of five colleges reported race and ethnicity of students to the Clearinghouse. Today, more than three out of five colleges report on the race and ethnicity of their students to the Clearinghouse. (For the original version of this pie chart, \u003c/span>\u003ca href=\"https://www.studentclearinghouse.org/dei-data-lab/research-data/enrollment/\" target=\"_blank\" rel=\"noopener\">\u003cspan style=\"font-weight: 400\">click here\u003c/span>\u003c/a>\u003cspan style=\"font-weight: 400\">.)\u003c/span>\u003c/p>\n\u003cp>\u003c/p>\u003c/div>",
"attributes": {
"named": {},
"numeric": []
}
},
{
"type": "component",
"content": "",
"name": "ad",
"attributes": {
"named": {
"label": "fullwidth"
},
"numeric": [
"fullwidth"
]
}
},
{
"type": "contentString",
"content": "\u003cdiv class=\"post-body\">\u003cp>\u003c/p>\n\u003cp>\u003cspan style=\"font-weight: 400\">How should we think about these college enrollment numbers? Do they largely mirror each racial and ethnic group’s share of the population? I was surprised to learn that the answer is yes – with a few caveats. Asian Americans are slightly overrepresented on college campuses and Hispanic Americans are slightly underrepresented. \u003c/span>\u003c/p>\n\u003cp>\u003cspan style=\"font-weight: 400\">I created this chart below, comparing the National Student Clearinghouse’s college enrollment data for 2020 with the young adult population, as reported by the U.S Census, so you can see how closely college enrollment tracks actual demographics.\u003c/span>\u003c/p>\n\u003cfigure id=\"attachment_61044\" class=\"wp-caption alignnone\" style=\"max-width: 780px\">\u003cimg decoding=\"async\" loading=\"lazy\" class=\"size-full wp-image-61044\" src=\"https://ww2.kqed.org/app/uploads/sites/23/2023/02/image4.png\" alt=\"\" width=\"780\" height=\"482\" srcset=\"https://ww2.kqed.org/app/uploads/sites/23/2023/02/image4.png 780w, https://ww2.kqed.org/app/uploads/sites/23/2023/02/image4-160x99.png 160w, https://ww2.kqed.org/app/uploads/sites/23/2023/02/image4-768x475.png 768w\" sizes=\"(max-width: 780px) 100vw, 780px\">\u003cfigcaption class=\"wp-caption-text\">Chart created by Jill Barshay/The Hechinger Report. Data sources: Adult population collected by the Annie E. Casey Foundation’s \u003ca href=\"https://datacenter.kidscount.org/data/tables/11207-young-adult-population-ages-18-to-24-by-race-and-ethnicity#detailed/1/any/false/2048,574,1729,37,871,870,573,869,36,868/68,69,67,12,70,66,71,7983/21595,21596\" target=\"_blank\" rel=\"noopener\">Kids Count Data Center\u003c/a>, originating from the U.S. Census Bureau. College enrollment from the National Student Clearinghouse’s \u003ca href=\"https://www.studentclearinghouse.org/dei-data-lab/research-data/enrollment/\" target=\"_blank\" rel=\"noopener\">DEI Data Lab\u003c/a>.\u003c/figcaption>\u003c/figure>\n\u003cp>\u003cspan style=\"font-weight: 400\">Another way to look at college enrollment is to see how many young adults enroll in college. The chart below, by the U.S. Bureau of Labor Statistics, shows that the college enrollment rates of Black and Hispanic young adults improved after the 2008 recession, and approached the college going rate of white Americans. Roughly 60 percent of young Black, Hispanic and white Americans\u003c/span> \u003cspan style=\"font-weight: 400\">are trying for a college degree. The college going rate for Asian Americans is much higher; more than 80 percent enroll. The zigs and zags in this chart show how college going among Hispanic and Black Americans is influenced by business cycles. \u003c/span>\u003c/p>\n\u003cp>\u003cimg decoding=\"async\" loading=\"lazy\" class=\"alignnone size-medium wp-image-61043\" src=\"https://ww2.kqed.org/app/uploads/sites/23/2023/02/image3-800x690.jpg\" alt=\"\" width=\"800\" height=\"690\" srcset=\"https://ww2.kqed.org/app/uploads/sites/23/2023/02/image3-800x690.jpg 800w, https://ww2.kqed.org/app/uploads/sites/23/2023/02/image3-1020x879.jpg 1020w, https://ww2.kqed.org/app/uploads/sites/23/2023/02/image3-160x138.jpg 160w, https://ww2.kqed.org/app/uploads/sites/23/2023/02/image3-768x662.jpg 768w, https://ww2.kqed.org/app/uploads/sites/23/2023/02/image3.jpg 1160w\" sizes=\"(max-width: 800px) 100vw, 800px\">\u003c/p>\n\u003cp>\u003cspan style=\"font-weight: 400\">The Bureau of Labor Statistics obtains enrollment data from the Current Population Survey (CPS), a monthly survey of households conducted by the Bureau of Census. (Here is the \u003c/span>\u003ca href=\"https://www.bls.gov/opub/ted/2022/61-8-percent-of-recent-high-school-graduates-enrolled-in-college-in-october-2021.htm\" target=\"_blank\" rel=\"noopener\">\u003cspan style=\"font-weight: 400\">chart on the BLS site\u003c/span>\u003c/a>\u003cspan style=\"font-weight: 400\">.)\u003c/span>\u003c/p>\n\u003cp>\u003cspan style=\"font-weight: 400\">When jobs are plentiful, many low-income students may join the labor force and defer their higher education. That especially reduces enrollments among Black and Hispanic young adults, among whom poverty rates are higher. When unemployment is high, more young adults enroll at college, particularly at two-year community colleges. Most recently, during the pandemic, many young Americans deferred college to help support or take care of their families. Some students chose to wait until in-person classes resumed. \u003c/span>\u003c/p>\n\u003cp>\u003cspan style=\"font-weight: 400\">Going to college is one thing; finishing it is another. This fourth chart, produced by the Lumina Foundation, shows that over time, more Americans of every race and ethnicity are earning college degrees. \u003c/span>The Lumina Foundation is a private foundation that seeks to increase the number of adults with college degrees and other credentials, and was formed through the sale to Sallie Mae of USA Group's assets that were used to create and collect monthly payments on student loans.* It is also among the many funders of The Hechinger Report.\u003c/p>\n\u003cp>\u003cb>Share of adult population, ages 25-64, with college degrees\u003c/b>\u003c/p>\n\u003cfigure id=\"attachment_61040\" class=\"wp-caption alignnone\" style=\"max-width: 800px\">\u003cimg decoding=\"async\" loading=\"lazy\" class=\"size-medium wp-image-61040\" src=\"https://ww2.kqed.org/app/uploads/sites/23/2023/02/image6-800x407.png\" alt=\"\" width=\"800\" height=\"407\" srcset=\"https://ww2.kqed.org/app/uploads/sites/23/2023/02/image6-800x407.png 800w, https://ww2.kqed.org/app/uploads/sites/23/2023/02/image6-1020x518.png 1020w, https://ww2.kqed.org/app/uploads/sites/23/2023/02/image6-160x81.png 160w, https://ww2.kqed.org/app/uploads/sites/23/2023/02/image6-768x390.png 768w, https://ww2.kqed.org/app/uploads/sites/23/2023/02/image6-1536x780.png 1536w, https://ww2.kqed.org/app/uploads/sites/23/2023/02/image6.png 1600w\" sizes=\"(max-width: 800px) 100vw, 800px\">\u003cfigcaption class=\"wp-caption-text\">Credit: The Lumina Foundation’s \u003ca href=\"https://www.luminafoundation.org/stronger-nation/report/#/progress/racial_equity\" target=\"_blank\" rel=\"noopener\">A Stronger Nation\u003c/a>, 2023 update\u003c/figcaption>\u003c/figure>\n\u003cp>\u003cspan style=\"font-weight: 400\">This chart above, originally published \u003c/span>\u003ca href=\"https://www.luminafoundation.org/stronger-nation/report/#/progress/racial_equity\" target=\"_blank\" rel=\"noopener\">\u003cspan style=\"font-weight: 400\">here\u003c/span>\u003c/a>\u003cspan style=\"font-weight: 400\"> on Jan. 31, is based on data from the U.S. Census Bureau’s American Community Survey. It tracks the percentage of adults 25 to 64 with two-year associate and four-year bachelor’s degrees. The share of Americans with a college degree rose from 38 percent in 2009 to nearly 46 percent in 2021 – an increase of eight percentage points.\u003c/span>\u003c/p>\n\u003cp>\u003cspan style=\"font-weight: 400\">Every race and ethnicity saw gains. The eight-percentage point gain was the same for both Black and white adults. \u003c/span>\u003c/p>\n\u003cp>\u003cspan style=\"font-weight: 400\">But racial gaps continue. In 2021, there remained an enormous 40 percentage point difference between Asian American adults, among whom 66 percent have a college degree, and Native American adults, among whom only 25 percent have a college degree. Among Black adults, 34 percent have college degrees. Among Hispanic adults, it’s 28 percent and among white adults, it’s 50 percent. \u003c/span>\u003c/p>\n\u003cp>\u003cspan style=\"font-weight: 400\">Improvements in college attainment can seem slow because graduation rates are much lower among Americans over 35. It takes years for higher college graduation rates among younger adults to raise overall college numbers. College attainment rates have jumped the fastest among young Hispanic adults under age 35, rising from below 20 percent in 2009 to above 30 percent in 2021. Courtney Brown, the chief data and research officer at Lumina, credits a variety of support programs, from tutoring to food pantries, and the convenience of online courses to explain why more young people are graduating, despite rising tuition costs. “Colleges are trying to serve students better,” said Brown. “Even the way they staff colleges, not all on getting enrollments but having more success coaches available and counselors helping students get to the finish line.”\u003c/span>\u003c/p>\n\u003cp>\u003cspan style=\"font-weight: 400\">Still, Brown acknowledges that it’s been difficult to make a dent in the stubborn gaps in college attainment between people of different races and ethnicities. “Unfortunately, everyone is increasing,” Brown said. “And so we are not seeing those gaps reduced.”\u003c/span>\u003c/p>\n\u003cp>\u003cspan style=\"font-weight: 400\">The National Student Clearinghouse’s DEI Data Lab also shows this completion problem starkly. \u003c/span>\u003c/p>\n\u003cfigure id=\"attachment_61045\" class=\"wp-caption alignnone\" style=\"max-width: 800px\">\u003cimg decoding=\"async\" loading=\"lazy\" class=\"size-medium wp-image-61045\" src=\"https://ww2.kqed.org/app/uploads/sites/23/2023/02/image5-800x513.png\" alt=\"\" width=\"800\" height=\"513\" srcset=\"https://ww2.kqed.org/app/uploads/sites/23/2023/02/image5-800x513.png 800w, https://ww2.kqed.org/app/uploads/sites/23/2023/02/image5-1020x654.png 1020w, https://ww2.kqed.org/app/uploads/sites/23/2023/02/image5-160x103.png 160w, https://ww2.kqed.org/app/uploads/sites/23/2023/02/image5-768x492.png 768w, https://ww2.kqed.org/app/uploads/sites/23/2023/02/image5-1536x985.png 1536w, https://ww2.kqed.org/app/uploads/sites/23/2023/02/image5.png 1600w\" sizes=\"(max-width: 800px) 100vw, 800px\">\u003cfigcaption class=\"wp-caption-text\">Credit: National Student Clearinghouse’s\u003ca href=\"https://www.studentclearinghouse.org/dei-data-lab/research-data/enrollment/\" target=\"_blank\" rel=\"noopener\"> DEI Data Lab\u003c/a> 2023\u003c/figcaption>\u003c/figure>\n\u003cp>\u003cspan style=\"font-weight: 400\">This chart tracks cohorts of students who began college at the same time and calculates how many of them earned any college degree within six years. Among students who started college in the fall of 2010, 62 percent of white students completed a degree by the summer of 2016, compared with only 39 percent of Black students. That’s a giant 23 percentage point gap, and a sign that a disproportionate number of Black students are dropping out of college in debt. Completion rates improved considerably for students who started college in 2015, but large gaps remain. Almost 70 percent of white students completed a degree by the summer of 2021, but only 45 percent of Black students hit this milestone. The Black-white college completion gap actually widened slightly from 23 to 24 percentage points.\u003c/span>\u003c/p>\n\u003cp>\u003cspan style=\"font-weight: 400\">The reasons for why completion rates remain much lower for Black, Hispanic and Native American students are complex. These students are more likely to attend community colleges, which have lower funding per student and fewer support services. Many students weren’t adequately prepared in high schools to handle college-level coursework, especially in math. \u003c/span>\u003c/p>\n\u003cp>\u003cspan style=\"font-weight: 400\">A \u003c/span>\u003ca href=\"https://news.gallup.com/poll/469292/one-five-black-students-report-discrimination-experiences.aspx\" target=\"_blank\" rel=\"noopener\">\u003cspan style=\"font-weight: 400\">poll of Black college students by Gallup-Lumina\u003c/span>\u003c/a>\u003cspan style=\"font-weight: 400\">, released on Feb. 9, found that 21 percent of Black students report feeling discriminated against frequently or occasionally at the college they are attending, and that 45 percent have considered dropping out in the past six months. Black students in bachelor’s programs are far more likely to juggle family and work responsibilities alongside their studies. \u003c/span>\u003c/p>\n\u003cp>\u003cspan style=\"font-weight: 400\">“Black students are encountering so much more discrimination, and they have multiple responsibilities that no other race or ethnicity really has,” said Lumina’s Brown. “A lot of it is that Black students are more likely to have children. Working full time, having children and trying to get a bachelor’s degree at the same time is just obviously overwhelming.”\u003c/span>\u003c/p>\n\u003cfigure id=\"attachment_61041\" class=\"wp-caption alignnone\" style=\"max-width: 800px\">\u003cimg decoding=\"async\" loading=\"lazy\" class=\"size-medium wp-image-61041\" src=\"https://ww2.kqed.org/app/uploads/sites/23/2023/02/image1-800x484.png\" alt=\"\" width=\"800\" height=\"484\" srcset=\"https://ww2.kqed.org/app/uploads/sites/23/2023/02/image1-800x484.png 800w, https://ww2.kqed.org/app/uploads/sites/23/2023/02/image1-1020x617.png 1020w, https://ww2.kqed.org/app/uploads/sites/23/2023/02/image1-160x97.png 160w, https://ww2.kqed.org/app/uploads/sites/23/2023/02/image1-768x465.png 768w, https://ww2.kqed.org/app/uploads/sites/23/2023/02/image1.png 1458w\" sizes=\"(max-width: 800px) 100vw, 800px\">\u003cfigcaption class=\"wp-caption-text\">Credit: Excerpt from \u003ca href=\"https://www.luminafoundation.org/resource/balancing-act-the-tradeoffs-and-challenges-facing-black-students-in-higher-education/\" target=\"_blank\" rel=\"noopener\">Balancing Act\u003c/a>, Gallup and the Lumina Foundation, 2023, p. 6.\u003c/figcaption>\u003c/figure>\n\u003cp>\u003cspan style=\"font-weight: 400\">On Feb. 2, the National Student Clearinghouse Research Center released the most recent college enrollment numbers for 2022. Undergraduate enrollment for both white and Black students fell for the fifth straight year, while enrollment of Hispanic and Asian students at public two-year colleges improved. However, their numbers are below pre-pandemic levels. For example, there were roughly 975,000 Hispanic students enrolled in public two-year colleges, also called community colleges, in the fall of 2022, up from 944,000 in the fall of 2021, but considerably down from 1.14 million in 2019. (Click \u003c/span>\u003ca href=\"https://nscresearchcenter.org/current-term-enrollment-estimates/\" target=\"_blank\" rel=\"noopener\">\u003cspan style=\"font-weight: 400\">here\u003c/span>\u003c/a>\u003cspan style=\"font-weight: 400\"> and navigate to the demographics tab for these fall 2022 charts.) \u003c/span>\u003c/p>\n\u003cp>\u003cspan style=\"font-weight: 400\">And here’s a startling data point: Black student enrollment at two-year community colleges declined by a staggering 44 percent, from 1.2 million in 2010 to 670,000 in 2020, according to a \u003c/span>\u003ca href=\"https://jointcenter.org/wp-content/uploads/2022/09/The-State-of-Black-Students-at-Community-Colleges.pdf\" target=\"_blank\" rel=\"noopener\">\u003cspan style=\"font-weight: 400\">Sept. 2022 report\u003c/span>\u003c/a>\u003cspan style=\"font-weight: 400\"> by the Joint Center for Political and Economic Studies, a think tank that studies policy issues affecting Black Americans.\u003c/span>\u003c/p>\n\u003cp>\u003cspan style=\"font-weight: 400\">Fewer students at college now certainly means fewer college-educated adults in the years ahead. And that is not a promising future. \u003c/span>\u003c/p>\n\u003cp>\u003cem>* Correction: An earlier version incorrectly said that Lumina was founded through the sale of Sallie Mae, instead of USA Group’s sale of assets to Sallie Mae. USA Group was sold, not Sallie Mae. \u003c/em>\u003c/p>\n\u003cp>\u003c/p>\u003c/div>",
"attributes": {
"named": {},
"numeric": []
}
},
{
"type": "component",
"content": "",
"name": "ad",
"attributes": {
"named": {
"label": "floatright"
},
"numeric": [
"floatright"
]
}
},
{
"type": "contentString",
"content": "\u003cdiv class=\"post-body\">\u003cp>\u003c/p>\n\u003cp>\u003ci>\u003cspan style=\"font-weight: 400\">This story about \u003c/span>\u003c/i>\u003ca href=\"https://hechingerreport.org/proof-points-new-higher-ed-data-by-race-and-ethnicity/\" target=\"_blank\" rel=\"noopener\">\u003ci>\u003cspan style=\"font-weight: 400\">higher ed data\u003c/span>\u003c/i>\u003c/a>\u003ci>\u003cspan style=\"font-weight: 400\"> was written by Jill Barshay and produced by \u003c/span>\u003c/i>\u003cspan style=\"font-weight: 400\">The Hechinger Report\u003c/span>\u003ci>\u003cspan style=\"font-weight: 400\">, a nonprofit, independent news organization focused on inequality and innovation in education. Sign up for the \u003c/span>\u003c/i>\u003ca href=\"http://hechingerreport.us2.list-manage1.com/subscribe?u=66c306eebb323868c3ce353c1&id=d3ee4c3e04\" target=\"_blank\" rel=\"noopener\">\u003ci>\u003cspan style=\"font-weight: 400\">Hechinger newsletter\u003c/span>\u003c/i>\u003c/a>\u003cspan style=\"font-weight: 400\">.\u003c/span>\u003c/p>\n\n\u003c/div>\u003c/p>",
"attributes": {
"named": {},
"numeric": []
}
}
],
"link": "/mindshift/61037/college-completion-rates-are-up-for-all-americans-but-racial-gaps-persist",
"authors": [
"byline_mindshift_61037"
],
"categories": [
"mindshift_21504"
],
"tags": [
"mindshift_68"
],
"featImg": "mindshift_61048",
"label": "mindshift",
"isLoading": false,
"hasAllInfo": true
}
},
"podcastsReducer": {
"isFetching": false,
"fetchFailed": false,
"hasFetched": false,
"podcasts": {}
},
"radioProgramsReducer": {
"isFetching": false,
"fetchFailed": false,
"hasFetched": false,
"radioPrograms": {}
},
"programsReducer": {
"all-things-considered": {
"id": "all-things-considered",
"title": "All Things Considered",
"info": "Every weekday, \u003cem>All Things Considered\u003c/em> hosts Robert Siegel, Audie Cornish, Ari Shapiro, and Kelly McEvers present the program's trademark mix of news, interviews, commentaries, reviews, and offbeat features. Michel Martin hosts on the weekends.",
"airtime": "MON-FRI 1pm-2pm, 4:30pm-6:30pm\u003cbr />SAT-SUN 5pm-6pm",
"imageSrc": "https://cdn.kqed.org/wp-content/uploads/2024/04/All-Things-Considered-Podcast-Tile-360x360-1.jpg",
"officialWebsiteLink": "https://www.npr.org/programs/all-things-considered/",
"meta": {
"site": "news",
"source": "npr"
},
"link": "/radio/program/all-things-considered"
},
"american-suburb-podcast": {
"id": "american-suburb-podcast",
"title": "American Suburb: The Podcast",
"tagline": "The flip side of gentrification, told through one town",
"info": "Gentrification is changing cities across America, forcing people from neighborhoods they have long called home. Call them the displaced. Now those priced out of the Bay Area are looking for a better life in an unlikely place. American Suburb follows this migration to one California town along the Delta, 45 miles from San Francisco. But is this once sleepy suburb ready for them?",
"imageSrc": "https://cdn.kqed.org/wp-content/uploads/2024/04/American-Suburb-Podcast-Tile-703x703-1.jpg",
"officialWebsiteLink": "/news/series/american-suburb-podcast",
"meta": {
"site": "news",
"source": "kqed",
"order": 19
},
"link": "/news/series/american-suburb-podcast/",
"subscribe": {
"npr": "https://rpb3r.app.goo.gl/RBrW",
"apple": "https://itunes.apple.com/WebObjects/MZStore.woa/wa/viewPodcast?mt=2&id=1287748328",
"tuneIn": "https://tunein.com/radio/American-Suburb-p1086805/",
"rss": "https://ww2.kqed.org/news/series/american-suburb-podcast/feed/podcast",
"google": "https://podcasts.google.com/feed/aHR0cHM6Ly9mZWVkcy5tZWdhcGhvbmUuZm0vS1FJTkMzMDExODgxNjA5"
}
},
"baycurious": {
"id": "baycurious",
"title": "Bay Curious",
"tagline": "Exploring the Bay Area, one question at a time",
"info": "KQED’s new podcast, Bay Curious, gets to the bottom of the mysteries — both profound and peculiar — that give the Bay Area its unique identity. And we’ll do it with your help! You ask the questions. You decide what Bay Curious investigates. And you join us on the journey to find the answers.",
"imageSrc": "https://cdn.kqed.org/wp-content/uploads/2024/04/Bay-Curious-Podcast-Tile-703x703-1.jpg",
"imageAlt": "KQED Bay Curious",
"officialWebsiteLink": "/news/series/baycurious",
"meta": {
"site": "news",
"source": "kqed",
"order": 3
},
"link": "/podcasts/baycurious",
"subscribe": {
"apple": "https://podcasts.apple.com/us/podcast/bay-curious/id1172473406",
"npr": "https://www.npr.org/podcasts/500557090/bay-curious",
"rss": "https://ww2.kqed.org/news/category/bay-curious-podcast/feed/podcast",
"amazon": "https://music.amazon.com/podcasts/9a90d476-aa04-455d-9a4c-0871ed6216d4/bay-curious",
"stitcher": "https://www.stitcher.com/podcast/kqed/bay-curious",
"spotify": "https://open.spotify.com/show/6O76IdmhixfijmhTZLIJ8k"
}
},
"bbc-world-service": {
"id": "bbc-world-service",
"title": "BBC World Service",
"info": "The day's top stories from BBC News compiled twice daily in the week, once at weekends.",
"airtime": "MON-FRI 9pm-10pm, TUE-FRI 1am-2am",
"imageSrc": "https://cdn.kqed.org/wp-content/uploads/2024/04/BBC-World-Service-Podcast-Tile-360x360-1.jpg",
"officialWebsiteLink": "https://www.bbc.co.uk/sounds/play/live:bbc_world_service",
"meta": {
"site": "news",
"source": "BBC World Service"
},
"link": "/radio/program/bbc-world-service",
"subscribe": {
"apple": "https://itunes.apple.com/us/podcast/global-news-podcast/id135067274?mt=2",
"tuneIn": "https://tunein.com/radio/BBC-World-Service-p455581/",
"rss": "https://podcasts.files.bbci.co.uk/p02nq0gn.rss"
}
},
"californiareport": {
"id": "californiareport",
"title": "The California Report",
"tagline": "California, day by day",
"info": "KQED’s statewide radio news program providing daily coverage of issues, trends and public policy decisions.",
"imageSrc": "https://cdn.kqed.org/wp-content/uploads/2024/04/The-California-Report-Podcast-Tile-703x703-1.jpg",
"imageAlt": "KQED The California Report",
"officialWebsiteLink": "/californiareport",
"meta": {
"site": "news",
"source": "kqed",
"order": 8
},
"link": "/californiareport",
"subscribe": {
"apple": "https://podcasts.apple.com/us/podcast/kqeds-the-california-report/id79681292",
"amazon": "https://music.amazon.com/podcasts/26099305-72af-4542-9dde-ac1807fe36d5/kqed-s-the-california-report",
"npr": "https://www.npr.org/podcasts/432285393/the-california-report",
"stitcher": "https://www.stitcher.com/podcast/kqedfm-kqeds-the-california-report-podcast-8838",
"rss": "https://ww2.kqed.org/news/tag/tcram/feed/podcast"
}
},
"californiareportmagazine": {
"id": "californiareportmagazine",
"title": "The California Report Magazine",
"tagline": "Your state, your stories",
"info": "Every week, The California Report Magazine takes you on a road trip for the ears: to visit the places and meet the people who make California unique. The in-depth storytelling podcast from the California Report.",
"airtime": "FRI 4:30pm-5pm, 6:30pm-7pm, 11pm-11:30pm",
"imageSrc": "https://cdn.kqed.org/wp-content/uploads/2024/04/The-California-Report-Magazine-Podcast-Tile-703x703-1.jpg",
"imageAlt": "KQED The California Report Magazine",
"officialWebsiteLink": "/californiareportmagazine",
"meta": {
"site": "news",
"source": "kqed",
"order": 10
},
"link": "/californiareportmagazine",
"subscribe": {
"apple": "https://podcasts.apple.com/us/podcast/the-california-report-magazine/id1314750545",
"google": "https://podcasts.google.com/feed/aHR0cHM6Ly9mZWVkcy5tZWdhcGhvbmUuZm0vS1FJTkM3NjkwNjk1OTAz",
"npr": "https://www.npr.org/podcasts/564733126/the-california-report-magazine",
"stitcher": "https://www.stitcher.com/podcast/kqed/the-california-report-magazine",
"rss": "https://ww2.kqed.org/news/tag/tcrmag/feed/podcast"
}
},
"city-arts": {
"id": "city-arts",
"title": "City Arts & Lectures",
"info": "A one-hour radio program to hear celebrated writers, artists and thinkers address contemporary ideas and values, often discussing the creative process. Please note: tapes or transcripts are not available",
"imageSrc": "https://ww2.kqed.org/radio/wp-content/uploads/sites/50/2018/05/cityartsandlecture-300x300.jpg",
"officialWebsiteLink": "https://www.cityarts.net/",
"airtime": "SUN 1pm-2pm, TUE 10pm, WED 1am",
"meta": {
"site": "news",
"source": "City Arts & Lectures"
},
"link": "https://www.cityarts.net",
"subscribe": {
"tuneIn": "https://tunein.com/radio/City-Arts-and-Lectures-p692/",
"rss": "https://www.cityarts.net/feed/"
}
},
"closealltabs": {
"id": "closealltabs",
"title": "Close All Tabs",
"tagline": "Your irreverent guide to the trends redefining our world",
"info": "Close All Tabs breaks down how digital culture shapes our world through thoughtful insights and irreverent humor.",
"imageSrc": "https://cdn.kqed.org/wp-content/uploads/2025/02/CAT_2_Tile-scaled.jpg",
"imageAlt": "KQED Close All Tabs",
"officialWebsiteLink": "/podcasts/closealltabs",
"meta": {
"site": "news",
"source": "kqed",
"order": 1
},
"link": "/podcasts/closealltabs",
"subscribe": {
"apple": "https://podcasts.apple.com/us/podcast/close-all-tabs/id214663465",
"rss": "https://feeds.megaphone.fm/KQINC6993880386",
"amazon": "https://music.amazon.com/podcasts/92d9d4ac-67a3-4eed-b10a-fb45d45b1ef2/close-all-tabs",
"spotify": "https://open.spotify.com/show/6LAJFHnGK1pYXYzv6SIol6?si=deb0cae19813417c"
}
},
"code-switch-life-kit": {
"id": "code-switch-life-kit",
"title": "Code Switch / Life Kit",
"info": "\u003cem>Code Switch\u003c/em>, which listeners will hear in the first part of the hour, has fearless and much-needed conversations about race. Hosted by journalists of color, the show tackles the subject of race head-on, exploring how it impacts every part of society — from politics and pop culture to history, sports and more.\u003cbr />\u003cbr />\u003cem>Life Kit\u003c/em>, which will be in the second part of the hour, guides you through spaces and feelings no one prepares you for — from finances to mental health, from workplace microaggressions to imposter syndrome, from relationships to parenting. The show features experts with real world experience and shares their knowledge. Because everyone needs a little help being human.\u003cbr />\u003cbr />\u003ca href=\"https://www.npr.org/podcasts/510312/codeswitch\">\u003cem>Code Switch\u003c/em> offical site and podcast\u003c/a>\u003cbr />\u003ca href=\"https://www.npr.org/lifekit\">\u003cem>Life Kit\u003c/em> offical site and podcast\u003c/a>\u003cbr />",
"airtime": "SUN 9pm-10pm",
"imageSrc": "https://cdn.kqed.org/wp-content/uploads/2024/04/Code-Switch-Life-Kit-Podcast-Tile-360x360-1.jpg",
"meta": {
"site": "radio",
"source": "npr"
},
"link": "/radio/program/code-switch-life-kit",
"subscribe": {
"apple": "https://podcasts.apple.com/podcast/1112190608?mt=2&at=11l79Y&ct=nprdirectory",
"google": "https://podcasts.google.com/feed/aHR0cHM6Ly93d3cubnByLm9yZy9yc3MvcG9kY2FzdC5waHA_aWQ9NTEwMzEy",
"spotify": "https://open.spotify.com/show/3bExJ9JQpkwNhoHvaIIuyV",
"rss": "https://feeds.npr.org/510312/podcast.xml"
}
},
"commonwealth-club": {
"id": "commonwealth-club",
"title": "Commonwealth Club of California Podcast",
"info": "The Commonwealth Club of California is the nation's oldest and largest public affairs forum. As a non-partisan forum, The Club brings to the public airwaves diverse viewpoints on important topics. The Club's weekly radio broadcast - the oldest in the U.S., dating back to 1924 - is carried across the nation on public radio stations and is now podcasting. Our website archive features audio of our recent programs, as well as selected speeches from our long and distinguished history. This podcast feed is usually updated twice a week and is always un-edited.",
"airtime": "THU 10pm, FRI 1am",
"imageSrc": "https://cdn.kqed.org/wp-content/uploads/2024/04/Commonwealth-Club-Podcast-Tile-360x360-1.jpg",
"officialWebsiteLink": "https://www.commonwealthclub.org/podcasts",
"meta": {
"site": "news",
"source": "Commonwealth Club of California"
},
"link": "/radio/program/commonwealth-club",
"subscribe": {
"apple": "https://itunes.apple.com/us/podcast/commonwealth-club-of-california-podcast/id976334034?mt=2",
"google": "https://podcasts.google.com/feed/aHR0cDovL3d3dy5jb21tb253ZWFsdGhjbHViLm9yZy9hdWRpby9wb2RjYXN0L3dlZWtseS54bWw",
"tuneIn": "https://tunein.com/radio/Commonwealth-Club-of-California-p1060/"
}
},
"forum": {
"id": "forum",
"title": "Forum",
"tagline": "The conversation starts here",
"info": "KQED’s live call-in program discussing local, state, national and international issues, as well as in-depth interviews.",
"airtime": "MON-FRI 9am-11am, 10pm-11pm",
"imageSrc": "https://cdn.kqed.org/wp-content/uploads/2024/04/Forum-Podcast-Tile-703x703-1.jpg",
"imageAlt": "KQED Forum with Mina Kim and Alexis Madrigal",
"officialWebsiteLink": "/forum",
"meta": {
"site": "news",
"source": "kqed",
"order": 9
},
"link": "/forum",
"subscribe": {
"apple": "https://podcasts.apple.com/us/podcast/kqeds-forum/id73329719",
"google": "https://podcasts.google.com/feed/aHR0cHM6Ly9mZWVkcy5tZWdhcGhvbmUuZm0vS1FJTkM5NTU3MzgxNjMz",
"npr": "https://www.npr.org/podcasts/432307980/forum",
"stitcher": "https://www.stitcher.com/podcast/kqedfm-kqeds-forum-podcast",
"rss": "https://feeds.megaphone.fm/KQINC9557381633"
}
},
"freakonomics-radio": {
"id": "freakonomics-radio",
"title": "Freakonomics Radio",
"info": "Freakonomics Radio is a one-hour award-winning podcast and public-radio project hosted by Stephen Dubner, with co-author Steve Levitt as a regular guest. It is produced in partnership with WNYC.",
"imageSrc": "https://ww2.kqed.org/news/wp-content/uploads/sites/10/2018/05/freakonomicsRadio.png",
"officialWebsiteLink": "http://freakonomics.com/",
"airtime": "SUN 1am-2am, SAT 3pm-4pm",
"meta": {
"site": "radio",
"source": "WNYC"
},
"link": "/radio/program/freakonomics-radio",
"subscribe": {
"npr": "https://rpb3r.app.goo.gl/4s8b",
"apple": "https://itunes.apple.com/us/podcast/freakonomics-radio/id354668519",
"tuneIn": "https://tunein.com/podcasts/WNYC-Podcasts/Freakonomics-Radio-p272293/",
"rss": "https://feeds.feedburner.com/freakonomicsradio"
}
},
"fresh-air": {
"id": "fresh-air",
"title": "Fresh Air",
"info": "Hosted by Terry Gross, \u003cem>Fresh Air from WHYY\u003c/em> is the Peabody Award-winning weekday magazine of contemporary arts and issues. One of public radio's most popular programs, Fresh Air features intimate conversations with today's biggest luminaries.",
"airtime": "MON-FRI 7pm-8pm",
"imageSrc": "https://cdn.kqed.org/wp-content/uploads/2024/04/Fresh-Air-Podcast-Tile-360x360-1.jpg",
"officialWebsiteLink": "https://www.npr.org/programs/fresh-air/",
"meta": {
"site": "radio",
"source": "npr"
},
"link": "/radio/program/fresh-air",
"subscribe": {
"npr": "https://rpb3r.app.goo.gl/4s8b",
"apple": "https://itunes.apple.com/WebObjects/MZStore.woa/wa/viewPodcast?s=143441&mt=2&id=214089682&at=11l79Y&ct=nprdirectory",
"tuneIn": "https://tunein.com/radio/Fresh-Air-p17/",
"rss": "https://feeds.npr.org/381444908/podcast.xml"
}
},
"here-and-now": {
"id": "here-and-now",
"title": "Here & Now",
"info": "A live production of NPR and WBUR Boston, in collaboration with stations across the country, Here & Now reflects the fluid world of news as it's happening in the middle of the day, with timely, in-depth news, interviews and conversation. Hosted by Robin Young, Jeremy Hobson and Tonya Mosley.",
"airtime": "MON-THU 11am-12pm",
"imageSrc": "https://cdn.kqed.org/wp-content/uploads/2024/04/Here-And-Now-Podcast-Tile-360x360-1.jpg",
"officialWebsiteLink": "http://www.wbur.org/hereandnow",
"meta": {
"site": "news",
"source": "npr"
},
"link": "/radio/program/here-and-now",
"subsdcribe": {
"apple": "https://itunes.apple.com/WebObjects/MZStore.woa/wa/viewPodcast?mt=2&id=426698661",
"tuneIn": "https://tunein.com/radio/Here--Now-p211/",
"rss": "https://feeds.npr.org/510051/podcast.xml"
}
},
"hidden-brain": {
"id": "hidden-brain",
"title": "Hidden Brain",
"info": "Shankar Vedantam uses science and storytelling to reveal the unconscious patterns that drive human behavior, shape our choices and direct our relationships.",
"imageSrc": "https://ww2.kqed.org/radio/wp-content/uploads/sites/50/2018/05/hiddenbrain.jpg",
"officialWebsiteLink": "https://www.npr.org/series/423302056/hidden-brain",
"airtime": "SUN 7pm-8pm",
"meta": {
"site": "news",
"source": "NPR"
},
"link": "/radio/program/hidden-brain",
"subscribe": {
"apple": "https://itunes.apple.com/us/podcast/hidden-brain/id1028908750?mt=2",
"tuneIn": "https://tunein.com/podcasts/Science-Podcasts/Hidden-Brain-p787503/",
"rss": "https://feeds.npr.org/510308/podcast.xml"
}
},
"how-i-built-this": {
"id": "how-i-built-this",
"title": "How I Built This with Guy Raz",
"info": "Guy Raz dives into the stories behind some of the world's best known companies. How I Built This weaves a narrative journey about innovators, entrepreneurs and idealists—and the movements they built.",
"imageSrc": "https://ww2.kqed.org/news/wp-content/uploads/sites/10/2018/05/howIBuiltThis.png",
"officialWebsiteLink": "https://www.npr.org/podcasts/510313/how-i-built-this",
"airtime": "SUN 7:30pm-8pm",
"meta": {
"site": "news",
"source": "npr"
},
"link": "/radio/program/how-i-built-this",
"subscribe": {
"npr": "https://rpb3r.app.goo.gl/3zxy",
"apple": "https://itunes.apple.com/us/podcast/how-i-built-this-with-guy-raz/id1150510297?mt=2",
"tuneIn": "https://tunein.com/podcasts/Arts--Culture-Podcasts/How-I-Built-This-p910896/",
"rss": "https://feeds.npr.org/510313/podcast.xml"
}
},
"hyphenacion": {
"id": "hyphenacion",
"title": "Hyphenación",
"tagline": "Where conversation and cultura meet",
"info": "What kind of no sabo word is Hyphenación? For us, it’s about living within a hyphenation. Like being a third-gen Mexican-American from the Texas border now living that Bay Area Chicano life. Like Xorje! Each week we bring together a couple of hyphenated Latinos to talk all about personal life choices: family, careers, relationships, belonging … everything is on the table. ",
"imageSrc": "https://cdn.kqed.org/wp-content/uploads/2025/03/Hyphenacion_FinalAssets_PodcastTile.png",
"imageAlt": "KQED Hyphenación",
"officialWebsiteLink": "/podcasts/hyphenacion",
"meta": {
"site": "news",
"source": "kqed",
"order": 15
},
"link": "/podcasts/hyphenacion",
"subscribe": {
"apple": "https://podcasts.apple.com/us/podcast/hyphenaci%C3%B3n/id1191591838",
"spotify": "https://open.spotify.com/show/2p3Fifq96nw9BPcmFdIq0o?si=39209f7b25774f38",
"youtube": "https://www.youtube.com/c/kqedarts",
"amazon": "https://music.amazon.com/podcasts/6c3dd23c-93fb-4aab-97ba-1725fa6315f1/hyphenaci%C3%B3n",
"rss": "https://feeds.megaphone.fm/KQINC2275451163"
}
},
"jerrybrown": {
"id": "jerrybrown",
"title": "The Political Mind of Jerry Brown",
"tagline": "Lessons from a lifetime in politics",
"info": "The Political Mind of Jerry Brown brings listeners the wisdom of the former Governor, Mayor, and presidential candidate. Scott Shafer interviewed Brown for more than 40 hours, covering the former governor's life and half-century in the political game – and Brown has some lessons he'd like to share. ",
"imageSrc": "https://cdn.kqed.org/wp-content/uploads/2024/04/The-Political-Mind-of-Jerry-Brown-Podcast-Tile-703x703-1.jpg",
"imageAlt": "KQED The Political Mind of Jerry Brown",
"officialWebsiteLink": "/podcasts/jerrybrown",
"meta": {
"site": "news",
"source": "kqed",
"order": 18
},
"link": "/podcasts/jerrybrown",
"subscribe": {
"npr": "https://www.npr.org/podcasts/790253322/the-political-mind-of-jerry-brown",
"apple": "https://itunes.apple.com/us/podcast/id1492194549",
"rss": "https://ww2.kqed.org/news/series/jerrybrown/feed/podcast/",
"tuneIn": "http://tun.in/pjGcK",
"stitcher": "https://www.stitcher.com/podcast/kqed/the-political-mind-of-jerry-brown",
"spotify": "https://open.spotify.com/show/54C1dmuyFyKMFttY6X2j6r?si=K8SgRCoISNK6ZbjpXrX5-w",
"amazon": "https://music.amazon.com/podcasts/44420f75-3b0e-4301-ab3b-16da6b09e543/the-political-mind-of-jerry-brown"
}
},
"latino-usa": {
"id": "latino-usa",
"title": "Latino USA",
"airtime": "MON 1am-2am, SUN 6pm-7pm",
"info": "Latino USA, the radio journal of news and culture, is the only national, English-language radio program produced from a Latino perspective.",
"imageSrc": "https://ww2.kqed.org/radio/wp-content/uploads/sites/50/2018/04/latinoUsa.jpg",
"officialWebsiteLink": "http://latinousa.org/",
"meta": {
"site": "news",
"source": "npr"
},
"link": "/radio/program/latino-usa",
"subscribe": {
"npr": "https://rpb3r.app.goo.gl/xtTd",
"apple": "https://itunes.apple.com/WebObjects/MZStore.woa/wa/viewPodcast?s=143441&mt=2&id=79681317&at=11l79Y&ct=nprdirectory",
"tuneIn": "https://tunein.com/radio/Latino-USA-p621/",
"rss": "https://feeds.npr.org/510016/podcast.xml"
}
},
"marketplace": {
"id": "marketplace",
"title": "Marketplace",
"info": "Our flagship program, helmed by Kai Ryssdal, examines what the day in money delivered, through stories, conversations, newsworthy numbers and more. Updated Monday through Friday at about 3:30 p.m. PT.",
"airtime": "MON-FRI 4pm-4:30pm, MON-WED 6:30pm-7pm",
"imageSrc": "https://cdn.kqed.org/wp-content/uploads/2024/04/Marketplace-Podcast-Tile-360x360-1.jpg",
"officialWebsiteLink": "https://www.marketplace.org/",
"meta": {
"site": "news",
"source": "American Public Media"
},
"link": "/radio/program/marketplace",
"subscribe": {
"apple": "https://itunes.apple.com/WebObjects/MZStore.woa/wa/viewPodcast?s=143441&mt=2&id=201853034&at=11l79Y&ct=nprdirectory",
"tuneIn": "https://tunein.com/radio/APM-Marketplace-p88/",
"rss": "https://feeds.publicradio.org/public_feeds/marketplace-pm/rss/rss"
}
},
"masters-of-scale": {
"id": "masters-of-scale",
"title": "Masters of Scale",
"info": "Masters of Scale is an original podcast in which LinkedIn co-founder and Greylock Partner Reid Hoffman sets out to describe and prove theories that explain how great entrepreneurs take their companies from zero to a gazillion in ingenious fashion.",
"airtime": "Every other Wednesday June 12 through October 16 at 8pm (repeats Thursdays at 2am)",
"imageSrc": "https://cdn.kqed.org/wp-content/uploads/2024/04/Masters-of-Scale-Podcast-Tile-360x360-1.jpg",
"officialWebsiteLink": "https://mastersofscale.com/",
"meta": {
"site": "radio",
"source": "WaitWhat"
},
"link": "/radio/program/masters-of-scale",
"subscribe": {
"apple": "http://mastersofscale.app.link/",
"rss": "https://rss.art19.com/masters-of-scale"
}
},
"mindshift": {
"id": "mindshift",
"title": "MindShift",
"tagline": "A podcast about the future of learning and how we raise our kids",
"info": "The MindShift podcast explores the innovations in education that are shaping how kids learn. Hosts Ki Sung and Katrina Schwartz introduce listeners to educators, researchers, parents and students who are developing effective ways to improve how kids learn. We cover topics like how fed-up administrators are developing surprising tactics to deal with classroom disruptions; how listening to podcasts are helping kids develop reading skills; the consequences of overparenting; and why interdisciplinary learning can engage students on all ends of the traditional achievement spectrum. This podcast is part of the MindShift education site, a division of KQED News. KQED is an NPR/PBS member station based in San Francisco. You can also visit the MindShift website for episodes and supplemental blog posts or tweet us \u003ca href=\"https://twitter.com/MindShiftKQED\">@MindShiftKQED\u003c/a> or visit us at \u003ca href=\"/mindshift\">MindShift.KQED.org\u003c/a>",
"imageSrc": "https://cdn.kqed.org/wp-content/uploads/2024/04/Mindshift-Podcast-Tile-703x703-1.jpg",
"imageAlt": "KQED MindShift: How We Will Learn",
"officialWebsiteLink": "/mindshift/",
"meta": {
"site": "news",
"source": "kqed",
"order": 12
},
"link": "/podcasts/mindshift",
"subscribe": {
"apple": "https://podcasts.apple.com/us/podcast/mindshift-podcast/id1078765985",
"google": "https://podcasts.google.com/feed/aHR0cHM6Ly9mZWVkcy5tZWdhcGhvbmUuZm0vS1FJTkM1NzY0NjAwNDI5",
"npr": "https://www.npr.org/podcasts/464615685/mind-shift-podcast",
"stitcher": "https://www.stitcher.com/podcast/kqed/stories-teachers-share",
"spotify": "https://open.spotify.com/show/0MxSpNYZKNprFLCl7eEtyx"
}
},
"morning-edition": {
"id": "morning-edition",
"title": "Morning Edition",
"info": "\u003cem>Morning Edition\u003c/em> takes listeners around the country and the world with multi-faceted stories and commentaries every weekday. Hosts Steve Inskeep, David Greene and Rachel Martin bring you the latest breaking news and features to prepare you for the day.",
"airtime": "MON-FRI 3am-9am",
"imageSrc": "https://cdn.kqed.org/wp-content/uploads/2024/04/Morning-Edition-Podcast-Tile-360x360-1.jpg",
"officialWebsiteLink": "https://www.npr.org/programs/morning-edition/",
"meta": {
"site": "news",
"source": "npr"
},
"link": "/radio/program/morning-edition"
},
"onourwatch": {
"id": "onourwatch",
"title": "On Our Watch",
"tagline": "Deeply-reported investigative journalism",
"info": "For decades, the process for how police police themselves has been inconsistent – if not opaque. In some states, like California, these proceedings were completely hidden. After a new police transparency law unsealed scores of internal affairs files, our reporters set out to examine these cases and the shadow world of police discipline. On Our Watch brings listeners into the rooms where officers are questioned and witnesses are interrogated to find out who this system is really protecting. Is it the officers, or the public they've sworn to serve?",
"imageSrc": "https://cdn.kqed.org/wp-content/uploads/2024/04/On-Our-Watch-Podcast-Tile-703x703-1.jpg",
"imageAlt": "On Our Watch from NPR and KQED",
"officialWebsiteLink": "/podcasts/onourwatch",
"meta": {
"site": "news",
"source": "kqed",
"order": 11
},
"link": "/podcasts/onourwatch",
"subscribe": {
"apple": "https://podcasts.apple.com/podcast/id1567098962",
"google": "https://podcasts.google.com/feed/aHR0cHM6Ly9mZWVkcy5ucHIub3JnLzUxMDM2MC9wb2RjYXN0LnhtbD9zYz1nb29nbGVwb2RjYXN0cw",
"npr": "https://rpb3r.app.goo.gl/onourwatch",
"spotify": "https://open.spotify.com/show/0OLWoyizopu6tY1XiuX70x",
"tuneIn": "https://tunein.com/radio/On-Our-Watch-p1436229/",
"stitcher": "https://www.stitcher.com/show/on-our-watch",
"rss": "https://feeds.npr.org/510360/podcast.xml"
}
},
"on-the-media": {
"id": "on-the-media",
"title": "On The Media",
"info": "Our weekly podcast explores how the media 'sausage' is made, casts an incisive eye on fluctuations in the marketplace of ideas, and examines threats to the freedom of information and expression in America and abroad. For one hour a week, the show tries to lift the veil from the process of \"making media,\" especially news media, because it's through that lens that we see the world and the world sees us",
"airtime": "SUN 2pm-3pm, MON 12am-1am",
"imageSrc": "https://ww2.kqed.org/radio/wp-content/uploads/sites/50/2018/04/onTheMedia.png",
"officialWebsiteLink": "https://www.wnycstudios.org/shows/otm",
"meta": {
"site": "news",
"source": "wnyc"
},
"link": "/radio/program/on-the-media",
"subscribe": {
"apple": "https://itunes.apple.com/us/podcast/on-the-media/id73330715?mt=2",
"tuneIn": "https://tunein.com/radio/On-the-Media-p69/",
"rss": "http://feeds.wnyc.org/onthemedia"
}
},
"pbs-newshour": {
"id": "pbs-newshour",
"title": "PBS NewsHour",
"info": "Analysis, background reports and updates from the PBS NewsHour putting today's news in context.",
"airtime": "MON-FRI 3pm-4pm",
"imageSrc": "https://cdn.kqed.org/wp-content/uploads/2024/04/PBS-News-Hour-Podcast-Tile-360x360-1.jpg",
"officialWebsiteLink": "https://www.pbs.org/newshour/",
"meta": {
"site": "news",
"source": "pbs"
},
"link": "/radio/program/pbs-newshour",
"subscribe": {
"apple": "https://itunes.apple.com/us/podcast/pbs-newshour-full-show/id394432287?mt=2",
"tuneIn": "https://tunein.com/radio/PBS-NewsHour---Full-Show-p425698/",
"rss": "https://www.pbs.org/newshour/feeds/rss/podcasts/show"
}
},
"perspectives": {
"id": "perspectives",
"title": "Perspectives",
"tagline": "KQED's series of daily listener commentaries since 1991",
"info": "KQED's series of daily listener commentaries since 1991.",
"imageSrc": "https://cdn.kqed.org/wp-content/uploads/2025/01/Perspectives_Tile_Final.jpg",
"imageAlt": "KQED Perspectives",
"officialWebsiteLink": "/perspectives/",
"meta": {
"site": "radio",
"source": "kqed",
"order": 14
},
"link": "/perspectives",
"subscribe": {
"apple": "https://podcasts.apple.com/us/podcast/id73801135",
"npr": "https://www.npr.org/podcasts/432309616/perspectives",
"rss": "https://ww2.kqed.org/perspectives/category/perspectives/feed/",
"google": "https://podcasts.google.com/feed/aHR0cHM6Ly93dzIua3FlZC5vcmcvcGVyc3BlY3RpdmVzL2NhdGVnb3J5L3BlcnNwZWN0aXZlcy9mZWVkLw"
}
},
"planet-money": {
"id": "planet-money",
"title": "Planet Money",
"info": "The economy explained. Imagine you could call up a friend and say, Meet me at the bar and tell me what's going on with the economy. Now imagine that's actually a fun evening.",
"airtime": "SUN 3pm-4pm",
"imageSrc": "https://ww2.kqed.org/radio/wp-content/uploads/sites/50/2018/04/planetmoney.jpg",
"officialWebsiteLink": "https://www.npr.org/sections/money/",
"meta": {
"site": "news",
"source": "npr"
},
"link": "/radio/program/planet-money",
"subscribe": {
"npr": "https://rpb3r.app.goo.gl/M4f5",
"apple": "https://itunes.apple.com/us/podcast/planet-money/id290783428?mt=2",
"tuneIn": "https://tunein.com/podcasts/Business--Economics-Podcasts/Planet-Money-p164680/",
"rss": "https://feeds.npr.org/510289/podcast.xml"
}
},
"politicalbreakdown": {
"id": "politicalbreakdown",
"title": "Political Breakdown",
"tagline": "Politics from a personal perspective",
"info": "Political Breakdown is a new series that explores the political intersection of California and the nation. Each week hosts Scott Shafer and Marisa Lagos are joined with a new special guest to unpack politics -- with personality — and offer an insider’s glimpse at how politics happens.",
"airtime": "THU 6:30pm-7pm",
"imageSrc": "https://cdn.kqed.org/wp-content/uploads/2024/04/Political-Breakdown-2024-Podcast-Tile-703x703-1.jpg",
"imageAlt": "KQED Political Breakdown",
"officialWebsiteLink": "/podcasts/politicalbreakdown",
"meta": {
"site": "radio",
"source": "kqed",
"order": 5
},
"link": "/podcasts/politicalbreakdown",
"subscribe": {
"apple": "https://podcasts.apple.com/us/podcast/political-breakdown/id1327641087",
"amazon": "https://music.amazon.com/podcasts/e0c2d153-ad36-4c8d-901d-f1da6a724824/political-breakdown",
"npr": "https://www.npr.org/podcasts/572155894/political-breakdown",
"stitcher": "https://www.stitcher.com/podcast/kqed/political-breakdown",
"spotify": "https://open.spotify.com/show/07RVyIjIdk2WDuVehvBMoN",
"rss": "https://ww2.kqed.org/news/tag/political-breakdown/feed/podcast"
}
},
"possible": {
"id": "possible",
"title": "Possible",
"info": "Possible is hosted by entrepreneur Reid Hoffman and writer Aria Finger. Together in Possible, Hoffman and Finger lead enlightening discussions about building a brighter collective future. The show features interviews with visionary guests like Trevor Noah, Sam Altman and Janette Sadik-Khan. Possible paints an optimistic portrait of the world we can create through science, policy, business, art and our shared humanity. It asks: What if everything goes right for once? How can we get there? Each episode also includes a short fiction story generated by advanced AI GPT-4, serving as a thought-provoking springboard to speculate how humanity could leverage technology for good.",
"airtime": "SUN 2pm",
"imageSrc": "https://cdn.kqed.org/wp-content/uploads/2024/04/Possible-Podcast-Tile-360x360-1.jpg",
"officialWebsiteLink": "https://www.possible.fm/",
"meta": {
"site": "news",
"source": "Possible"
},
"link": "/radio/program/possible",
"subscribe": {
"apple": "https://podcasts.apple.com/us/podcast/possible/id1677184070",
"spotify": "https://open.spotify.com/show/730YpdUSNlMyPQwNnyjp4k"
}
},
"pri-the-world": {
"id": "pri-the-world",
"title": "PRI's The World: Latest Edition",
"info": "Each weekday, host Marco Werman and his team of producers bring you the world's most interesting stories in an hour of radio that reminds us just how small our planet really is.",
"airtime": "MON-FRI 2pm-3pm",
"imageSrc": "https://cdn.kqed.org/wp-content/uploads/2024/04/The-World-Podcast-Tile-360x360-1.jpg",
"officialWebsiteLink": "https://www.pri.org/programs/the-world",
"meta": {
"site": "news",
"source": "PRI"
},
"link": "/radio/program/pri-the-world",
"subscribe": {
"apple": "https://itunes.apple.com/us/podcast/pris-the-world-latest-edition/id278196007?mt=2",
"tuneIn": "https://tunein.com/podcasts/News--Politics-Podcasts/PRIs-The-World-p24/",
"rss": "http://feeds.feedburner.com/pri/theworld"
}
},
"radiolab": {
"id": "radiolab",
"title": "Radiolab",
"info": "A two-time Peabody Award-winner, Radiolab is an investigation told through sounds and stories, and centered around one big idea. In the Radiolab world, information sounds like music and science and culture collide. Hosted by Jad Abumrad and Robert Krulwich, the show is designed for listeners who demand skepticism, but appreciate wonder. WNYC Studios is the producer of other leading podcasts including Freakonomics Radio, Death, Sex & Money, On the Media and many more.",
"airtime": "SUN 12am-1am, SAT 2pm-3pm",
"imageSrc": "https://ww2.kqed.org/radio/wp-content/uploads/sites/50/2018/04/radiolab1400.png",
"officialWebsiteLink": "https://www.wnycstudios.org/shows/radiolab/",
"meta": {
"site": "science",
"source": "WNYC"
},
"link": "/radio/program/radiolab",
"subscribe": {
"apple": "https://itunes.apple.com/us/podcast/radiolab/id152249110?mt=2",
"tuneIn": "https://tunein.com/radio/RadioLab-p68032/",
"rss": "https://feeds.wnyc.org/radiolab"
}
},
"reveal": {
"id": "reveal",
"title": "Reveal",
"info": "Created by The Center for Investigative Reporting and PRX, Reveal is public radios first one-hour weekly radio show and podcast dedicated to investigative reporting. Credible, fact based and without a partisan agenda, Reveal combines the power and artistry of driveway moment storytelling with data-rich reporting on critically important issues. The result is stories that inform and inspire, arming our listeners with information to right injustices, hold the powerful accountable and improve lives.Reveal is hosted by Al Letson and showcases the award-winning work of CIR and newsrooms large and small across the nation. In a radio and podcast market crowded with choices, Reveal focuses on important and often surprising stories that illuminate the world for our listeners.",
"airtime": "SAT 4pm-5pm",
"imageSrc": "https://ww2.kqed.org/radio/wp-content/uploads/sites/50/2018/04/reveal300px.png",
"officialWebsiteLink": "https://www.revealnews.org/episodes/",
"meta": {
"site": "news",
"source": "npr"
},
"link": "/radio/program/reveal",
"subscribe": {
"apple": "https://itunes.apple.com/us/podcast/reveal/id886009669",
"tuneIn": "https://tunein.com/radio/Reveal-p679597/",
"rss": "http://feeds.revealradio.org/revealpodcast"
}
},
"rightnowish": {
"id": "rightnowish",
"title": "Rightnowish",
"tagline": "Art is where you find it",
"info": "Rightnowish digs into life in the Bay Area right now… ish. Journalist Pendarvis Harshaw takes us to galleries painted on the sides of liquor stores in West Oakland. We'll dance in warehouses in the Bayview, make smoothies with kids in South Berkeley, and listen to classical music in a 1984 Cutlass Supreme in Richmond. Every week, Pen talks to movers and shakers about how the Bay Area shapes what they create, and how they shape the place we call home.",
"imageSrc": "https://cdn.kqed.org/wp-content/uploads/2024/04/Rightnowish-Podcast-Tile-500x500-1.jpg",
"imageAlt": "KQED Rightnowish with Pendarvis Harshaw",
"officialWebsiteLink": "/podcasts/rightnowish",
"meta": {
"site": "arts",
"source": "kqed",
"order": 16
},
"link": "/podcasts/rightnowish",
"subscribe": {
"npr": "https://www.npr.org/podcasts/721590300/rightnowish",
"rss": "https://ww2.kqed.org/arts/programs/rightnowish/feed/podcast",
"apple": "https://podcasts.apple.com/us/podcast/rightnowish/id1482187648",
"stitcher": "https://www.stitcher.com/podcast/kqed/rightnowish",
"google": "https://podcasts.google.com/feed/aHR0cHM6Ly9mZWVkcy5tZWdhcGhvbmUuZm0vS1FJTkMxMjU5MTY3NDc4",
"spotify": "https://open.spotify.com/show/7kEJuafTzTVan7B78ttz1I"
}
},
"science-friday": {
"id": "science-friday",
"title": "Science Friday",
"info": "Science Friday is a weekly science talk show, broadcast live over public radio stations nationwide. Each week, the show focuses on science topics that are in the news and tries to bring an educated, balanced discussion to bear on the scientific issues at hand. Panels of expert guests join host Ira Flatow, a veteran science journalist, to discuss science and to take questions from listeners during the call-in portion of the program.",
"airtime": "FRI 11am-1pm",
"imageSrc": "https://cdn.kqed.org/wp-content/uploads/2024/04/Science-Friday-Podcast-Tile-360x360-1.jpg",
"officialWebsiteLink": "https://www.wnycstudios.org/shows/science-friday",
"meta": {
"site": "news",
"source": "npr"
},
"link": "/radio/program/science-friday",
"subscribe": {
"apple": "https://itunes.apple.com/WebObjects/MZStore.woa/wa/viewPodcast?s=143441&mt=2&id=73329284&at=11l79Y&ct=nprdirectory",
"tuneIn": "https://tunein.com/radio/Science-Friday-p394/",
"rss": "http://feeds.wnyc.org/science-friday"
}
},
"snap-judgment": {
"id": "snap-judgment",
"title": "Snap Judgment",
"tagline": "Real stories with killer beats",
"info": "The Snap Judgment radio show and podcast mixes real stories with killer beats to produce cinematic, dramatic radio. Snap's musical brand of storytelling dares listeners to see the world through the eyes of another. This is storytelling... with a BEAT!! Snap first aired on public radio stations nationwide in July 2010. Today, Snap Judgment airs on over 450 public radio stations and is brought to the airwaves by KQED & PRX.",
"airtime": "SAT 1pm-2pm, 9pm-10pm",
"imageSrc": "https://cdn.kqed.org/wp-content/uploads/2024/05/Snap-Judgment-Podcast-Tile-703x703-1.jpg",
"imageAlt": "KQED Snap Judgment",
"officialWebsiteLink": "https://snapjudgment.org",
"meta": {
"site": "arts",
"source": "kqed",
"order": 4
},
"link": "https://snapjudgment.org",
"subscribe": {
"apple": "https://podcasts.apple.com/us/podcast/snap-judgment/id283657561",
"npr": "https://www.npr.org/podcasts/449018144/snap-judgment",
"stitcher": "https://www.pandora.com/podcast/snap-judgment/PC:241?source=stitcher-sunset",
"spotify": "https://open.spotify.com/show/3Cct7ZWmxHNAtLgBTqjC5v",
"rss": "https://snap.feed.snapjudgment.org/"
}
},
"soldout": {
"id": "soldout",
"title": "SOLD OUT: Rethinking Housing in America",
"tagline": "A new future for housing",
"info": "Sold Out: Rethinking Housing in America",
"imageSrc": "https://cdn.kqed.org/wp-content/uploads/2024/04/Sold-Out-Podcast-Tile-703x703-1.jpg",
"imageAlt": "KQED Sold Out: Rethinking Housing in America",
"officialWebsiteLink": "/podcasts/soldout",
"meta": {
"site": "news",
"source": "kqed",
"order": 13
},
"link": "/podcasts/soldout",
"subscribe": {
"npr": "https://www.npr.org/podcasts/911586047/s-o-l-d-o-u-t-a-new-future-for-housing",
"apple": "https://podcasts.apple.com/us/podcast/introducing-sold-out-rethinking-housing-in-america/id1531354937",
"rss": "https://feeds.megaphone.fm/soldout",
"spotify": "https://open.spotify.com/show/38dTBSk2ISFoPiyYNoKn1X",
"stitcher": "https://www.stitcher.com/podcast/kqed/sold-out-rethinking-housing-in-america",
"tunein": "https://tunein.com/radio/SOLD-OUT-Rethinking-Housing-in-America-p1365871/"
}
},
"spooked": {
"id": "spooked",
"title": "Spooked",
"tagline": "True-life supernatural stories",
"info": "",
"imageSrc": "https://cdn.kqed.org/wp-content/uploads/2024/10/Spooked-Podcast-Tile-703x703-1.jpg",
"imageAlt": "KQED Spooked",
"officialWebsiteLink": "https://spookedpodcast.org/",
"meta": {
"site": "news",
"source": "kqed",
"order": 7
},
"link": "https://spookedpodcast.org/",
"subscribe": {
"apple": "https://podcasts.apple.com/us/podcast/spooked/id1279361017",
"npr": "https://www.npr.org/podcasts/549547848/snap-judgment-presents-spooked",
"spotify": "https://open.spotify.com/show/76571Rfl3m7PLJQZKQIGCT",
"rss": "https://feeds.simplecast.com/TBotaapn"
}
},
"tech-nation": {
"id": "tech-nation",
"title": "Tech Nation Radio Podcast",
"info": "Tech Nation is a weekly public radio program, hosted by Dr. Moira Gunn. Founded in 1993, it has grown from a simple interview show to a multi-faceted production, featuring conversations with noted technology and science leaders, and a weekly science and technology-related commentary.",
"airtime": "FRI 10pm",
"imageSrc": "https://cdn.kqed.org/wp-content/uploads/2024/04/Tech-Nation-Radio-Podcast-Tile-360x360-1.jpg",
"officialWebsiteLink": "http://technation.podomatic.com/",
"meta": {
"site": "science",
"source": "Tech Nation Media"
},
"link": "/radio/program/tech-nation",
"subscribe": {
"rss": "https://technation.podomatic.com/rss2.xml"
}
},
"ted-radio-hour": {
"id": "ted-radio-hour",
"title": "TED Radio Hour",
"info": "The TED Radio Hour is a journey through fascinating ideas, astonishing inventions, fresh approaches to old problems, and new ways to think and create.",
"airtime": "SUN 3pm-4pm, SAT 10pm-11pm",
"imageSrc": "https://ww2.kqed.org/radio/wp-content/uploads/sites/50/2018/04/tedRadioHour.jpg",
"officialWebsiteLink": "https://www.npr.org/programs/ted-radio-hour/?showDate=2018-06-22",
"meta": {
"site": "news",
"source": "npr"
},
"link": "/radio/program/ted-radio-hour",
"subscribe": {
"npr": "https://rpb3r.app.goo.gl/8vsS",
"apple": "https://itunes.apple.com/WebObjects/MZStore.woa/wa/viewPodcast?s=143441&mt=2&id=523121474&at=11l79Y&ct=nprdirectory",
"tuneIn": "https://tunein.com/radio/TED-Radio-Hour-p418021/",
"rss": "https://feeds.npr.org/510298/podcast.xml"
}
},
"thebay": {
"id": "thebay",
"title": "The Bay",
"tagline": "Local news to keep you rooted",
"info": "Host Devin Katayama walks you through the biggest story of the day with reporters and newsmakers.",
"imageSrc": "https://cdn.kqed.org/wp-content/uploads/2024/04/The-Bay-Podcast-Tile-703x703-1.jpg",
"imageAlt": "KQED The Bay",
"officialWebsiteLink": "/podcasts/thebay",
"meta": {
"site": "radio",
"source": "kqed",
"order": 2
},
"link": "/podcasts/thebay",
"subscribe": {
"apple": "https://podcasts.apple.com/us/podcast/the-bay/id1350043452",
"amazon": "https://music.amazon.com/podcasts/d800ea4c-7a2c-42f2-b861-edaf78a5db0b/the-bay",
"npr": "https://www.npr.org/podcasts/586725995/the-bay",
"stitcher": "https://www.stitcher.com/podcast/kqed/the-bay",
"spotify": "https://open.spotify.com/show/4BIKBKIujizLHlIlBNaAqQ",
"rss": "https://feeds.megaphone.fm/KQINC8259786327"
}
},
"thelatest": {
"id": "thelatest",
"title": "The Latest",
"tagline": "Trusted local news in real time",
"info": "",
"imageSrc": "https://cdn.kqed.org/wp-content/uploads/2025/05/The-Latest-2025-Podcast-Tile-703x703-1.jpg",
"imageAlt": "KQED The Latest",
"officialWebsiteLink": "/thelatest",
"meta": {
"site": "news",
"source": "kqed",
"order": 6
},
"link": "/thelatest",
"subscribe": {
"apple": "https://podcasts.apple.com/us/podcast/the-latest-from-kqed/id1197721799",
"npr": "https://www.npr.org/podcasts/1257949365/the-latest-from-k-q-e-d",
"spotify": "https://open.spotify.com/show/5KIIXMgM9GTi5AepwOYvIZ?si=bd3053fec7244dba",
"rss": "https://feeds.megaphone.fm/KQINC9137121918"
}
},
"theleap": {
"id": "theleap",
"title": "The Leap",
"tagline": "What if you closed your eyes, and jumped?",
"info": "Stories about people making dramatic, risky changes, told by award-winning public radio reporter Judy Campbell.",
"imageSrc": "https://cdn.kqed.org/wp-content/uploads/2024/04/The-Leap-Podcast-Tile-703x703-1.jpg",
"imageAlt": "KQED The Leap",
"officialWebsiteLink": "/podcasts/theleap",
"meta": {
"site": "news",
"source": "kqed",
"order": 17
},
"link": "/podcasts/theleap",
"subscribe": {
"apple": "https://podcasts.apple.com/us/podcast/the-leap/id1046668171",
"npr": "https://www.npr.org/podcasts/447248267/the-leap",
"stitcher": "https://www.stitcher.com/podcast/kqed/the-leap",
"spotify": "https://open.spotify.com/show/3sSlVHHzU0ytLwuGs1SD1U",
"rss": "https://ww2.kqed.org/news/programs/the-leap/feed/podcast"
}
},
"the-moth-radio-hour": {
"id": "the-moth-radio-hour",
"title": "The Moth Radio Hour",
"info": "Since its launch in 1997, The Moth has presented thousands of true stories, told live and without notes, to standing-room-only crowds worldwide. Moth storytellers stand alone, under a spotlight, with only a microphone and a roomful of strangers. The storyteller and the audience embark on a high-wire act of shared experience which is both terrifying and exhilarating. Since 2008, The Moth podcast has featured many of our favorite stories told live on Moth stages around the country. For information on all of our programs and live events, visit themoth.org.",
"airtime": "SAT 8pm-9pm and SUN 11am-12pm",
"imageSrc": "https://ww2.kqed.org/radio/wp-content/uploads/sites/50/2018/04/theMoth.jpg",
"officialWebsiteLink": "https://themoth.org/",
"meta": {
"site": "arts",
"source": "prx"
},
"link": "/radio/program/the-moth-radio-hour",
"subscribe": {
"apple": "https://itunes.apple.com/us/podcast/the-moth-podcast/id275699983?mt=2",
"tuneIn": "https://tunein.com/radio/The-Moth-p273888/",
"rss": "http://feeds.themoth.org/themothpodcast"
}
},
"the-new-yorker-radio-hour": {
"id": "the-new-yorker-radio-hour",
"title": "The New Yorker Radio Hour",
"info": "The New Yorker Radio Hour is a weekly program presented by the magazine's editor, David Remnick, and produced by WNYC Studios and The New Yorker. Each episode features a diverse mix of interviews, profiles, storytelling, and an occasional burst of humor inspired by the magazine, and shaped by its writers, artists, and editors. This isn't a radio version of a magazine, but something all its own, reflecting the rich possibilities of audio storytelling and conversation. Theme music for the show was composed and performed by Merrill Garbus of tUnE-YArDs.",
"airtime": "SAT 10am-11am",
"imageSrc": "https://cdn.kqed.org/wp-content/uploads/2024/04/The-New-Yorker-Podcast-Tile-360x360-1.jpg",
"officialWebsiteLink": "https://www.wnycstudios.org/shows/tnyradiohour",
"meta": {
"site": "arts",
"source": "WNYC"
},
"link": "/radio/program/the-new-yorker-radio-hour",
"subscribe": {
"apple": "https://itunes.apple.com/us/podcast/id1050430296",
"tuneIn": "https://tunein.com/podcasts/WNYC-Podcasts/New-Yorker-Radio-Hour-p803804/",
"rss": "https://feeds.feedburner.com/newyorkerradiohour"
}
},
"the-sam-sanders-show": {
"id": "the-sam-sanders-show",
"title": "The Sam Sanders Show",
"info": "One of public radio's most dynamic voices, Sam Sanders helped launch The NPR Politics Podcast and hosted NPR's hit show It's Been A Minute. Now, the award-winning host returns with something brand new, The Sam Sanders Show. Every week, Sam Sanders and friends dig into the culture that shapes our lives: what's driving the biggest trends, how artists really think, and even the memes you can't stop scrolling past. Sam is beloved for his way of unpacking the world and bringing you up close to fresh currents and engaging conversations. The Sam Sanders Show is smart, funny and always a good time.",
"airtime": "FRI 12-1pm AND SAT 11am-12pm",
"imageSrc": "https://cdn.kqed.org/wp-content/uploads/2025/11/The-Sam-Sanders-Show-Podcast-Tile-400x400-1.jpg",
"officialWebsiteLink": "https://www.kcrw.com/shows/the-sam-sanders-show/latest",
"meta": {
"site": "arts",
"source": "KCRW"
},
"link": "https://www.kcrw.com/shows/the-sam-sanders-show/latest",
"subscribe": {
"rss": "https://feed.cdnstream1.com/zjb/feed/download/ac/28/59/ac28594c-e1d0-4231-8728-61865cdc80e8.xml"
}
},
"the-splendid-table": {
"id": "the-splendid-table",
"title": "The Splendid Table",
"info": "\u003cem>The Splendid Table\u003c/em> hosts our nation's conversations about cooking, sustainability and food culture.",
"imageSrc": "https://cdn.kqed.org/wp-content/uploads/2024/04/The-Splendid-Table-Podcast-Tile-360x360-1.jpg",
"officialWebsiteLink": "https://www.splendidtable.org/",
"airtime": "SUN 10-11 pm",
"meta": {
"site": "radio",
"source": "npr"
},
"link": "/radio/program/the-splendid-table"
},
"this-american-life": {
"id": "this-american-life",
"title": "This American Life",
"info": "This American Life is a weekly public radio show, heard by 2.2 million people on more than 500 stations. Another 2.5 million people download the weekly podcast. It is hosted by Ira Glass, produced in collaboration with Chicago Public Media, delivered to stations by PRX The Public Radio Exchange, and has won all of the major broadcasting awards.",
"airtime": "SAT 12pm-1pm, 7pm-8pm",
"imageSrc": "https://ww2.kqed.org/radio/wp-content/uploads/sites/50/2018/04/thisAmericanLife.png",
"officialWebsiteLink": "https://www.thisamericanlife.org/",
"meta": {
"site": "news",
"source": "wbez"
},
"link": "/radio/program/this-american-life",
"subscribe": {
"apple": "https://itunes.apple.com/WebObjects/MZStore.woa/wa/viewPodcast?s=143441&mt=2&id=201671138&at=11l79Y&ct=nprdirectory",
"rss": "https://www.thisamericanlife.org/podcast/rss.xml"
}
},
"tinydeskradio": {
"id": "tinydeskradio",
"title": "Tiny Desk Radio",
"info": "We're bringing the best of Tiny Desk to the airwaves, only on public radio.",
"airtime": "SUN 8pm and SAT 9pm",
"imageSrc": "https://cdn.kqed.org/wp-content/uploads/2025/04/300x300-For-Member-Station-Logo-Tiny-Desk-Radio-@2x.png",
"officialWebsiteLink": "https://www.npr.org/series/g-s1-52030/tiny-desk-radio",
"meta": {
"site": "news",
"source": "npr"
},
"link": "/radio/program/tinydeskradio",
"subscribe": {
"rss": "https://feeds.npr.org/g-s1-52030/rss.xml"
}
},
"wait-wait-dont-tell-me": {
"id": "wait-wait-dont-tell-me",
"title": "Wait Wait... Don't Tell Me!",
"info": "Peter Sagal and Bill Kurtis host the weekly NPR News quiz show alongside some of the best and brightest news and entertainment personalities.",
"airtime": "SUN 10am-11am, SAT 11am-12pm, SAT 6pm-7pm",
"imageSrc": "https://cdn.kqed.org/wp-content/uploads/2024/04/Wait-Wait-Podcast-Tile-300x300-1.jpg",
"officialWebsiteLink": "https://www.npr.org/programs/wait-wait-dont-tell-me/",
"meta": {
"site": "news",
"source": "npr"
},
"link": "/radio/program/wait-wait-dont-tell-me",
"subscribe": {
"npr": "https://rpb3r.app.goo.gl/Xogv",
"apple": "https://itunes.apple.com/WebObjects/MZStore.woa/wa/viewPodcast?s=143441&mt=2&id=121493804&at=11l79Y&ct=nprdirectory",
"tuneIn": "https://tunein.com/radio/Wait-Wait-Dont-Tell-Me-p46/",
"rss": "https://feeds.npr.org/344098539/podcast.xml"
}
},
"weekend-edition-saturday": {
"id": "weekend-edition-saturday",
"title": "Weekend Edition Saturday",
"info": "Weekend Edition Saturday wraps up the week's news and offers a mix of analysis and features on a wide range of topics, including arts, sports, entertainment, and human interest stories. The two-hour program is hosted by NPR's Peabody Award-winning Scott Simon.",
"airtime": "SAT 5am-10am",
"imageSrc": "https://cdn.kqed.org/wp-content/uploads/2024/04/Weekend-Edition-Podcast-Tile-360x360-1.jpg",
"officialWebsiteLink": "https://www.npr.org/programs/weekend-edition-saturday/",
"meta": {
"site": "news",
"source": "npr"
},
"link": "/radio/program/weekend-edition-saturday"
},
"weekend-edition-sunday": {
"id": "weekend-edition-sunday",
"title": "Weekend Edition Sunday",
"info": "Weekend Edition Sunday features interviews with newsmakers, artists, scientists, politicians, musicians, writers, theologians and historians. The program has covered news events from Nelson Mandela's 1990 release from a South African prison to the capture of Saddam Hussein.",
"airtime": "SUN 5am-10am",
"imageSrc": "https://cdn.kqed.org/wp-content/uploads/2024/04/Weekend-Edition-Podcast-Tile-360x360-1.jpg",
"officialWebsiteLink": "https://www.npr.org/programs/weekend-edition-sunday/",
"meta": {
"site": "news",
"source": "npr"
},
"link": "/radio/program/weekend-edition-sunday"
}
},
"racesReducer": {},
"racesGenElectionReducer": {},
"racesGenElection2026Reducer": {},
"radioSchedulesReducer": {},
"listsReducer": {},
"recallGuideReducer": {
"intros": {},
"policy": {},
"candidates": {}
},
"savedArticleReducer": {
"articles": [],
"status": {}
},
"newslettersReducer": {
"isFetching": false,
"fetchFailed": false,
"hasFetched": false,
"newsletters": {},
"isSubscribing": false,
"isUnsubscribing": false,
"subscribedNewsletters": {}
},
"termsReducer": {
"about": {
"name": "About",
"type": "terms",
"id": "about",
"slug": "about",
"link": "/about",
"taxonomy": "site"
},
"arts": {
"name": "Arts & Culture",
"grouping": [
"arts",
"pop",
"trulyca"
],
"description": "KQED Arts provides daily in-depth coverage of the Bay Area's music, art, film, performing arts, literature and arts news, as well as cultural commentary and criticism.",
"type": "terms",
"id": "arts",
"slug": "arts",
"link": "/arts",
"taxonomy": "site"
},
"artschool": {
"name": "Art School",
"parent": "arts",
"type": "terms",
"id": "artschool",
"slug": "artschool",
"link": "/artschool",
"taxonomy": "site"
},
"bayareabites": {
"name": "KQED food",
"grouping": [
"food",
"bayareabites",
"checkplease"
],
"parent": "food",
"type": "terms",
"id": "bayareabites",
"slug": "bayareabites",
"link": "/food",
"taxonomy": "site"
},
"bayareahiphop": {
"name": "Bay Area Hiphop",
"type": "terms",
"id": "bayareahiphop",
"slug": "bayareahiphop",
"link": "/bayareahiphop",
"taxonomy": "site"
},
"campaign21": {
"name": "Campaign 21",
"type": "terms",
"id": "campaign21",
"slug": "campaign21",
"link": "/campaign21",
"taxonomy": "site"
},
"careers": {
"name": "Careers",
"type": "terms",
"id": "careers",
"slug": "careers",
"link": "/careers",
"taxonomy": "site"
},
"checkplease": {
"name": "KQED food",
"grouping": [
"food",
"bayareabites",
"checkplease"
],
"parent": "food",
"type": "terms",
"id": "checkplease",
"slug": "checkplease",
"link": "/food",
"taxonomy": "site"
},
"education": {
"name": "Education",
"grouping": [
"education"
],
"type": "terms",
"id": "education",
"slug": "education",
"link": "/education",
"taxonomy": "site"
},
"elections": {
"name": "Elections",
"type": "terms",
"id": "elections",
"slug": "elections",
"link": "/elections",
"taxonomy": "site"
},
"events": {
"name": "Events",
"type": "terms",
"id": "events",
"slug": "events",
"link": "/events",
"taxonomy": "site"
},
"event": {
"name": "Event",
"alias": "events",
"type": "terms",
"id": "event",
"slug": "event",
"link": "/event",
"taxonomy": "site"
},
"filmschoolshorts": {
"name": "Film School Shorts",
"type": "terms",
"id": "filmschoolshorts",
"slug": "filmschoolshorts",
"link": "/filmschoolshorts",
"taxonomy": "site"
},
"food": {
"name": "KQED food",
"grouping": [
"food",
"bayareabites",
"checkplease"
],
"type": "terms",
"id": "food",
"slug": "food",
"link": "/food",
"taxonomy": "site"
},
"forum": {
"name": "Forum",
"relatedContentQuery": "posts/forum?",
"parent": "news",
"type": "terms",
"id": "forum",
"slug": "forum",
"link": "/forum",
"taxonomy": "site"
},
"futureofyou": {
"name": "Future of You",
"grouping": [
"science",
"futureofyou"
],
"parent": "science",
"type": "terms",
"id": "futureofyou",
"slug": "futureofyou",
"link": "/futureofyou",
"taxonomy": "site"
},
"jpepinheart": {
"name": "KQED food",
"relatedContentQuery": "posts/food,bayareabites,checkplease",
"parent": "food",
"type": "terms",
"id": "jpepinheart",
"slug": "jpepinheart",
"link": "/food",
"taxonomy": "site"
},
"liveblog": {
"name": "Live Blog",
"type": "terms",
"id": "liveblog",
"slug": "liveblog",
"link": "/liveblog",
"taxonomy": "site"
},
"livetv": {
"name": "Live TV",
"parent": "tv",
"type": "terms",
"id": "livetv",
"slug": "livetv",
"link": "/livetv",
"taxonomy": "site"
},
"lowdown": {
"name": "The Lowdown",
"relatedContentQuery": "posts/lowdown?",
"parent": "news",
"type": "terms",
"id": "lowdown",
"slug": "lowdown",
"link": "/lowdown",
"taxonomy": "site"
},
"mindshift": {
"name": "Mindshift",
"parent": "news",
"description": "MindShift explores the future of education by highlighting the innovative – and sometimes counterintuitive – ways educators and parents are helping all children succeed.",
"type": "terms",
"id": "mindshift",
"slug": "mindshift",
"link": "/mindshift",
"taxonomy": "site"
},
"news": {
"name": "News",
"grouping": [
"news",
"forum"
],
"type": "terms",
"id": "news",
"slug": "news",
"link": "/news",
"taxonomy": "site"
},
"newsletters": {
"name": "newsletters",
"type": "terms",
"id": "newsletters",
"slug": "newsletters",
"link": "/newsletters",
"taxonomy": "site"
},
"perspectives": {
"name": "Perspectives",
"parent": "radio",
"type": "terms",
"id": "perspectives",
"slug": "perspectives",
"link": "/perspectives",
"taxonomy": "site"
},
"podcasts": {
"name": "Podcasts",
"type": "terms",
"id": "podcasts",
"slug": "podcasts",
"link": "/podcasts",
"taxonomy": "site"
},
"pop": {
"name": "Pop",
"parent": "arts",
"type": "terms",
"id": "pop",
"slug": "pop",
"link": "/pop",
"taxonomy": "site"
},
"pressroom": {
"name": "Pressroom",
"type": "terms",
"id": "pressroom",
"slug": "pressroom",
"link": "/pressroom",
"taxonomy": "site"
},
"quest": {
"name": "Quest",
"parent": "science",
"type": "terms",
"id": "quest",
"slug": "quest",
"link": "/quest",
"taxonomy": "site"
},
"radio": {
"name": "Radio",
"grouping": [
"forum",
"perspectives"
],
"description": "Listen to KQED Public Radio – home of Forum and The California Report – on 88.5 FM in San Francisco, 89.3 FM in Sacramento, 88.3 FM in Santa Rosa and 88.1 FM in Martinez.",
"type": "terms",
"id": "radio",
"slug": "radio",
"link": "/radio",
"taxonomy": "site"
},
"root": {
"name": "KQED",
"image": "https://ww2.kqed.org/app/uploads/2020/02/KQED-OG-Image@1x.png",
"imageWidth": 1200,
"imageHeight": 630,
"headData": {
"title": "KQED | News, Radio, Podcasts, TV | Public Media for Northern California",
"description": "KQED provides public radio, television, and independent reporting on issues that matter to the Bay Area. We’re the NPR and PBS member station for Northern California."
},
"type": "terms",
"id": "root",
"slug": "root",
"link": "/root",
"taxonomy": "site"
},
"science": {
"name": "Science",
"grouping": [
"science",
"futureofyou"
],
"description": "KQED Science brings you award-winning science and environment coverage from the Bay Area and beyond.",
"type": "terms",
"id": "science",
"slug": "science",
"link": "/science",
"taxonomy": "site"
},
"stateofhealth": {
"name": "State of Health",
"parent": "science",
"type": "terms",
"id": "stateofhealth",
"slug": "stateofhealth",
"link": "/stateofhealth",
"taxonomy": "site"
},
"support": {
"name": "Support",
"type": "terms",
"id": "support",
"slug": "support",
"link": "/support",
"taxonomy": "site"
},
"thedolist": {
"name": "The Do List",
"parent": "arts",
"type": "terms",
"id": "thedolist",
"slug": "thedolist",
"link": "/thedolist",
"taxonomy": "site"
},
"trulyca": {
"name": "Truly CA",
"grouping": [
"arts",
"pop",
"trulyca"
],
"parent": "arts",
"type": "terms",
"id": "trulyca",
"slug": "trulyca",
"link": "/trulyca",
"taxonomy": "site"
},
"tv": {
"name": "TV",
"type": "terms",
"id": "tv",
"slug": "tv",
"link": "/tv",
"taxonomy": "site"
},
"voterguide": {
"name": "Voter Guide",
"parent": "elections",
"alias": "elections",
"type": "terms",
"id": "voterguide",
"slug": "voterguide",
"link": "/voterguide",
"taxonomy": "site"
},
"guiaelectoral": {
"name": "Guia Electoral",
"parent": "elections",
"alias": "elections",
"type": "terms",
"id": "guiaelectoral",
"slug": "guiaelectoral",
"link": "/guiaelectoral",
"taxonomy": "site"
},
"mindshift_21504": {
"type": "terms",
"id": "mindshift_21504",
"meta": {
"index": "terms_1716263798",
"site": "mindshift",
"id": "21504",
"found": true
},
"relationships": {},
"featImg": null,
"name": "Education research",
"description": null,
"taxonomy": "category",
"headData": {
"twImgId": null,
"twTitle": null,
"ogTitle": null,
"ogImgId": null,
"twDescription": null,
"description": null,
"title": "Education research Archives | KQED Mindshift",
"ogDescription": null
},
"ttid": 20776,
"slug": "education-research",
"isLoading": false,
"link": "/mindshift/category/education-research"
},
"mindshift_68": {
"type": "terms",
"id": "mindshift_68",
"meta": {
"index": "terms_1716263798",
"site": "mindshift",
"id": "68",
"found": true
},
"relationships": {},
"featImg": null,
"name": "Higher Education",
"description": null,
"taxonomy": "tag",
"headData": {
"twImgId": null,
"twTitle": null,
"ogTitle": null,
"ogImgId": null,
"twDescription": null,
"description": null,
"title": "Higher Education Archives - KQED Mindshift",
"ogDescription": null
},
"ttid": 68,
"slug": "higher-education",
"isLoading": false,
"link": "/mindshift/tag/higher-education"
}
},
"userPermissionsReducer": {
"wpLoggedIn": false
},
"eventsReducer": {},
"fssReducer": {},
"tvDailyScheduleReducer": {},
"tvWeeklyScheduleReducer": {},
"tvPrimetimeScheduleReducer": {},
"tvMonthlyScheduleReducer": {},
"userAccountReducer": {
"user": {
"email": null,
"emailStatus": "EMAIL_UNVALIDATED",
"loggedStatus": "LOGGED_OUT",
"loggingChecked": false,
"articles": [],
"firstName": null,
"lastName": null,
"phoneNumber": null,
"fetchingMembership": false,
"membershipError": false,
"memberships": [
{
"id": null,
"startDate": null,
"firstName": null,
"lastName": null,
"familyNumber": null,
"memberNumber": null,
"memberSince": null,
"expirationDate": null,
"pfsEligible": false,
"isSustaining": false,
"membershipLevel": "Prospect",
"membershipStatus": "Non Member",
"lastGiftDate": null,
"renewalDate": null,
"lastDonationAmount": null
}
]
},
"authModal": {
"isOpen": false,
"view": "LANDING_VIEW"
},
"error": null
},
"youthMediaReducer": {},
"checkPleaseReducer": {
"filterData": {
"region": {
"key": "Restaurant Region",
"filters": [
"Any Region"
]
},
"cuisine": {
"key": "Restaurant Cuisine",
"filters": [
"Any Cuisine"
]
}
},
"restaurantDataById": {},
"restaurantIdsSorted": [],
"error": null
},
"userAgentReducer": {
"userAgent": "Mozilla/5.0 AppleWebKit/537.36 (KHTML, like Gecko; compatible; ClaudeBot/1.0; +claudebot@anthropic.com)",
"isBot": true
}
}