Originally posted May 5
County health departments in the Bay Area have issued a joint set of criteria to guide them in deciding when and how much to allow the region to tiptoe out of its current forced hibernation. For those who want to access the kind of COVID-19 data that public health officials are staring at in order to divine the right conditions for loosening restrictions, we’ve curated some of the best resources for tracking the numbers.
First up is the California Health and Human Services Agency’s dashboard, which is chock-full of California case statistics and hospital data, sorted by every county in the state. We also included data dashboards for the Bay Area, the U.S. and the world.
More California Data
- County Data Monitoring – Metrics that the California Department of Public Health is tracking, including case rates, testing positivity and available ventilators NEW
- California Coronavirus Tracker by County – KQED
- California Coronavirus Tracking – Comprehensive data on cases, deaths, hospitalizations, demographics and testing, viewable by county and city, from the Los Angeles Times
- California COVID-19 by the Numbers – California Department of Public Health
Bay Area Data
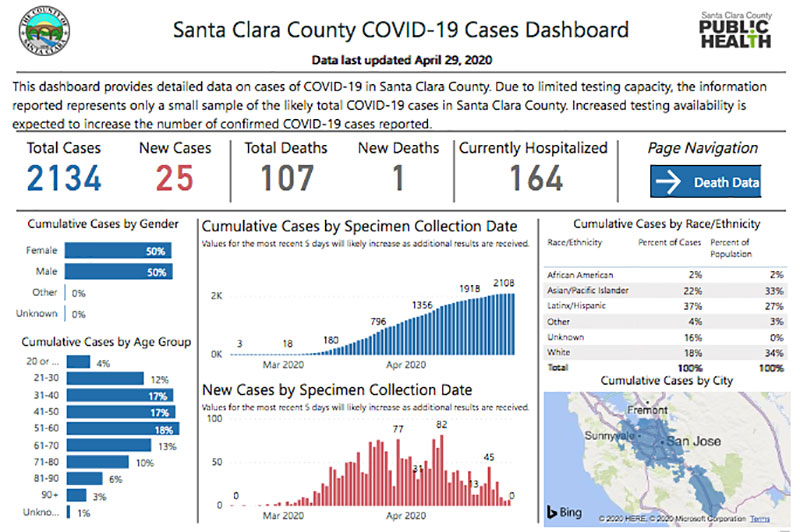
The nine counties of the Bay Area have released data dashboards where you can monitor daily counts on cases, deaths, hospitalizations, demographics and more.
Here is Santa Clara County’s data, for example. Click on the image to be taken to the dashboard. Links to the other counties are directly below.
Data Dashboards by County
Projected Peaks in U.S. States and the World
The Institute for Health Metrics and Evaluation, a research center at University of Washington Medicine, models the projected curve of the pandemic for each U.S. state and each nation using the latest available data. Though of late the model has come under some criticism. Here’s more about different models from The New York Times.
More U.S. data
- Johns Hopkins Coronavirus Resource Center Map – Find data for any county in the U.S.
- NPR State Tracking – How quickly is the virus spreading in each state?
- U.S. Centers for Disease Control and Prevention Data – forecasts
- New York Times Coronavirus Tracking – Maps, hot spots, case growth rates
- COVID Tracking Project – Testing data state-by-state
Across the Globe: Cases, Deaths, Recoveries and More
If you want to find coronavirus data for cities across the globe, the Center for Systems Science and Engineering at Johns Hopkins has created a global interactive map with stats for the number of COVID-19 cases and deaths.
WHO Data Tracks Curves by Region and Country
The World Health Organization (WHO) keeps a Situation Dashboard showing the number of cases and fatalities by country. Scroll down the page for interactive tools to follow curves for different countries and global region. This includes the number of cases confirmed per day and the change over time.
