From your friends’ VSCO-filtered throwback photos featuring leggings and black mesh tops to “evil Kermit” memes and Vine compilations, many of our feeds were briefly overtaken by odes to a so-called simpler time a decade ago (This reporter remains baffled by the longing: This was the year Carrie Fisher died, after all).
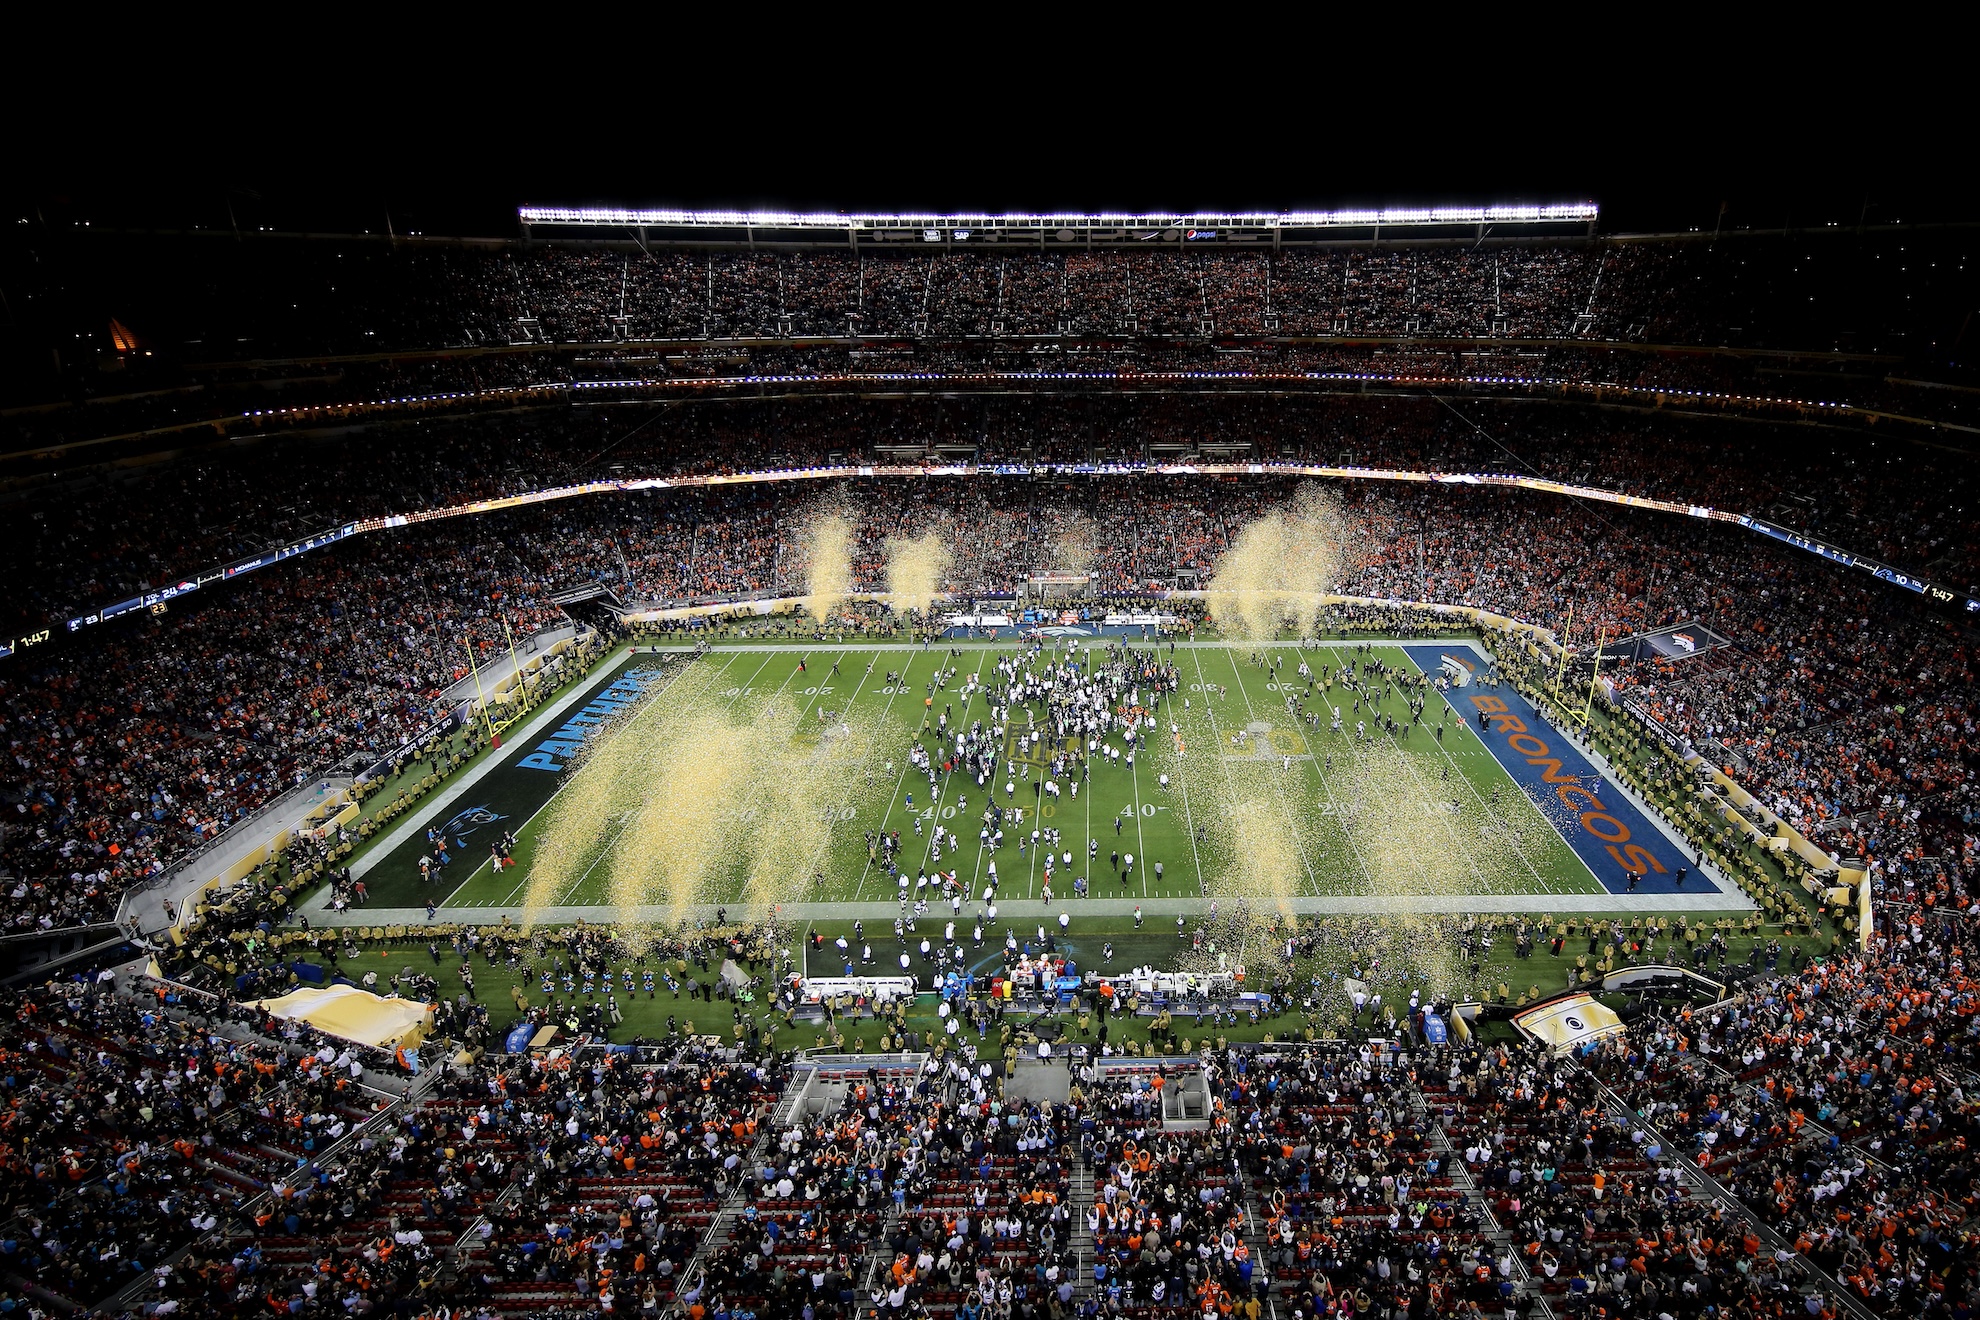
2016 was also the year the Bay Area last hosted a Super Bowl, which saw the Denver Broncos beat the Carolina Panthers and Coldplay as the halftime show with Beyoncé and Bruno Mars.
This Sunday, the NFL’s biggest game is returning to our region once again with Super Bowl LX at Santa Clara’s Levi’s Stadium, featuring the Seattle Seahawks, the New England Patriots and a halftime show by Bad Bunny.
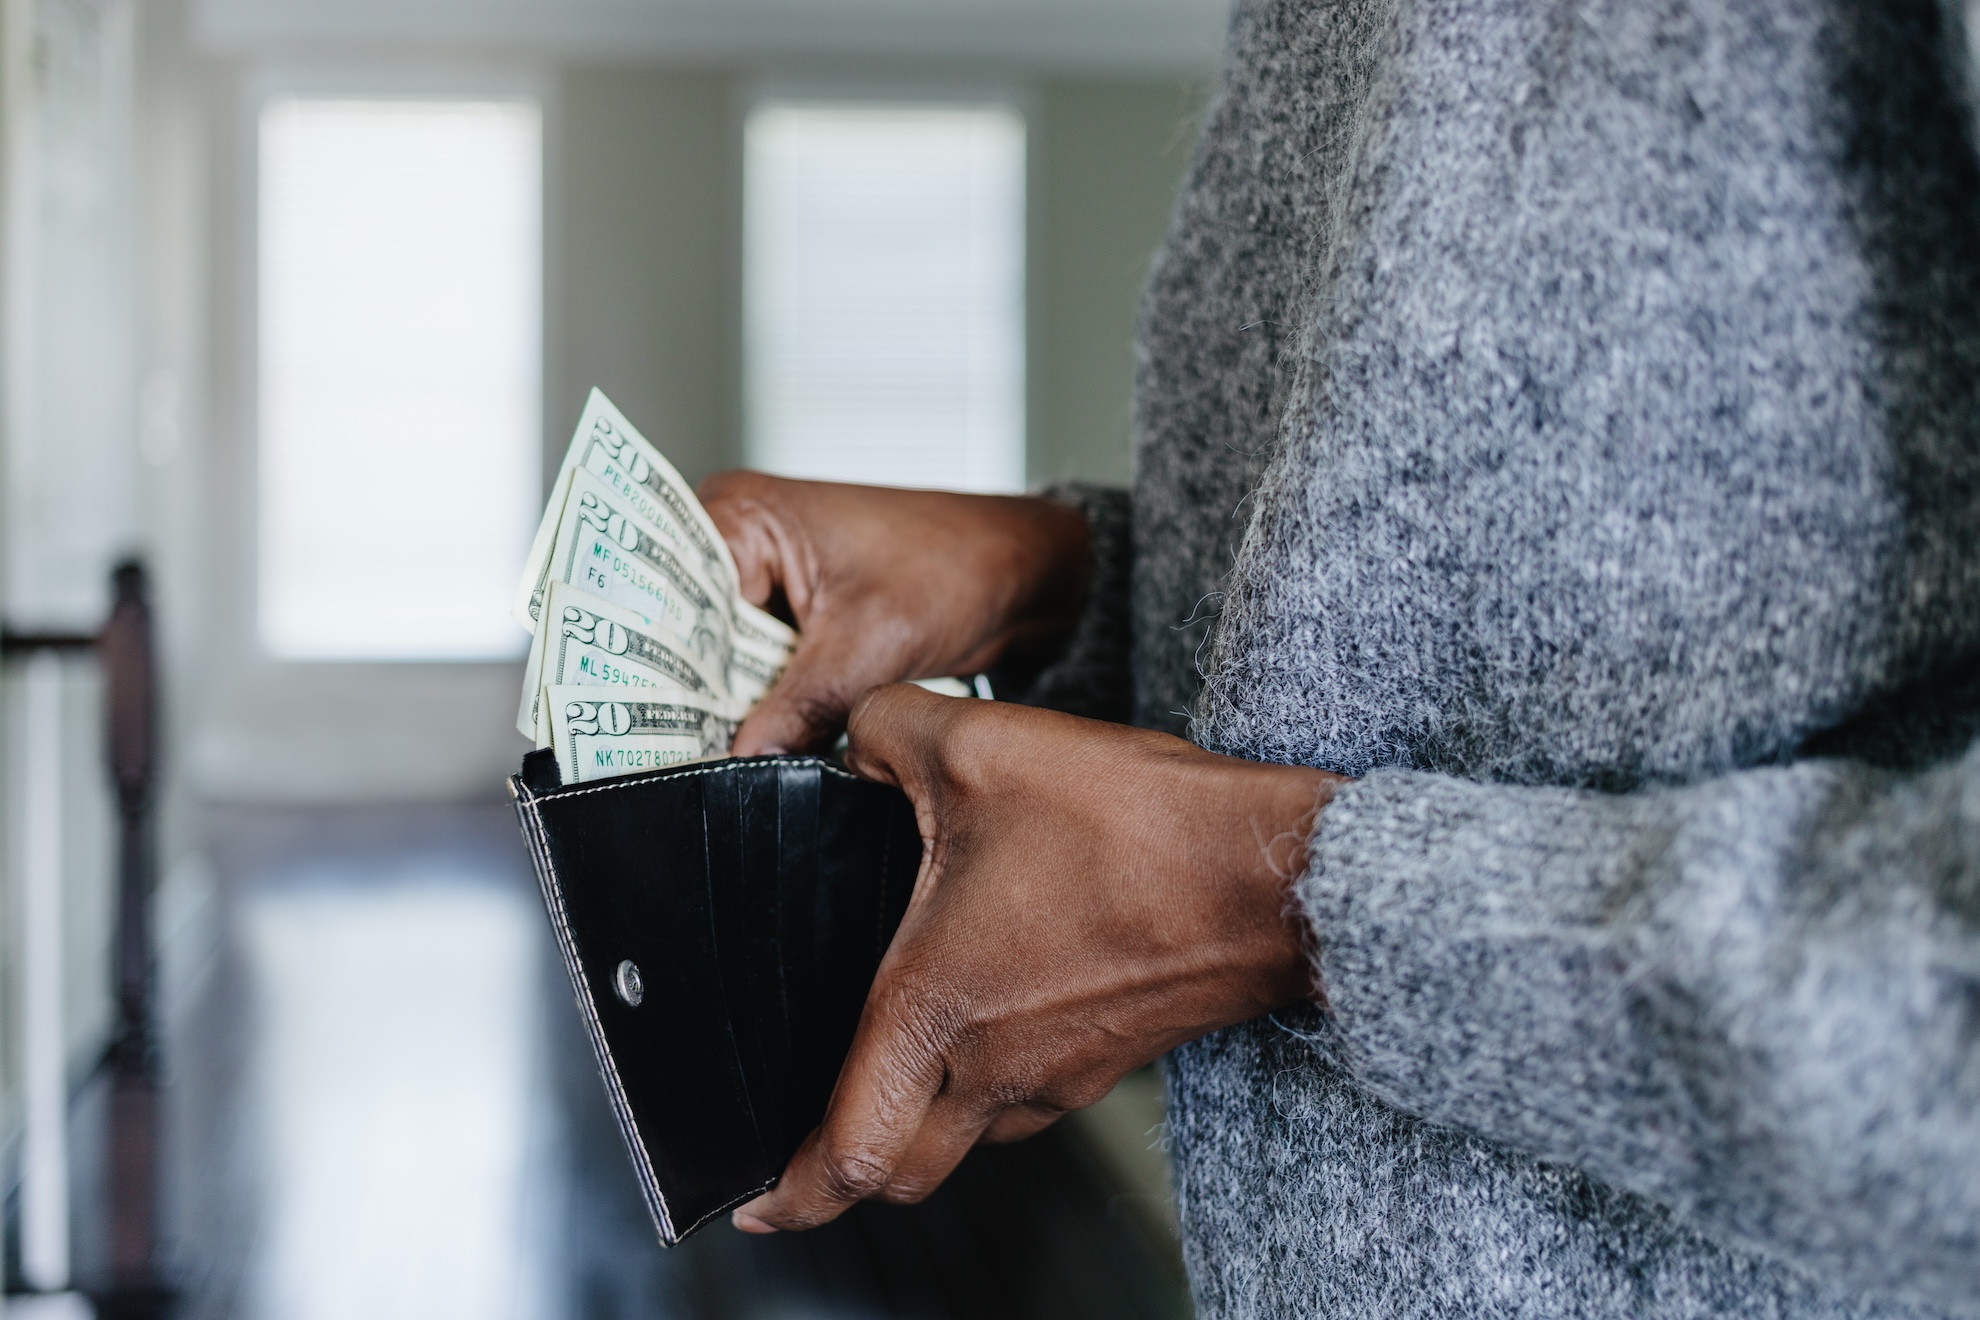
With the universe seemingly insisting in this moment on us casting our minds back a decade earlier, there’s one aspect that’s hard to ignore: the affordability crisis that’s hit the Bay Area particularly hard, and just how much prices have risen since 2016.
But how simple is it to compare how much cheaper — or not — everyday items were back then, and how much prices have actually changed?
First off, what’s the best way to look at changing prices over the years?
To get an accurate impression of whether something has become more expensive, beyond the changing numbers, it’s important to account for inflation.
And according to Ricky Volpe, professor of Agribusiness at California Polytechnic State University, this makes the Consumer Price Index (CPI) — which measures price changes over time and serves as a key indicator of inflation — a good baseline for assessing increases.
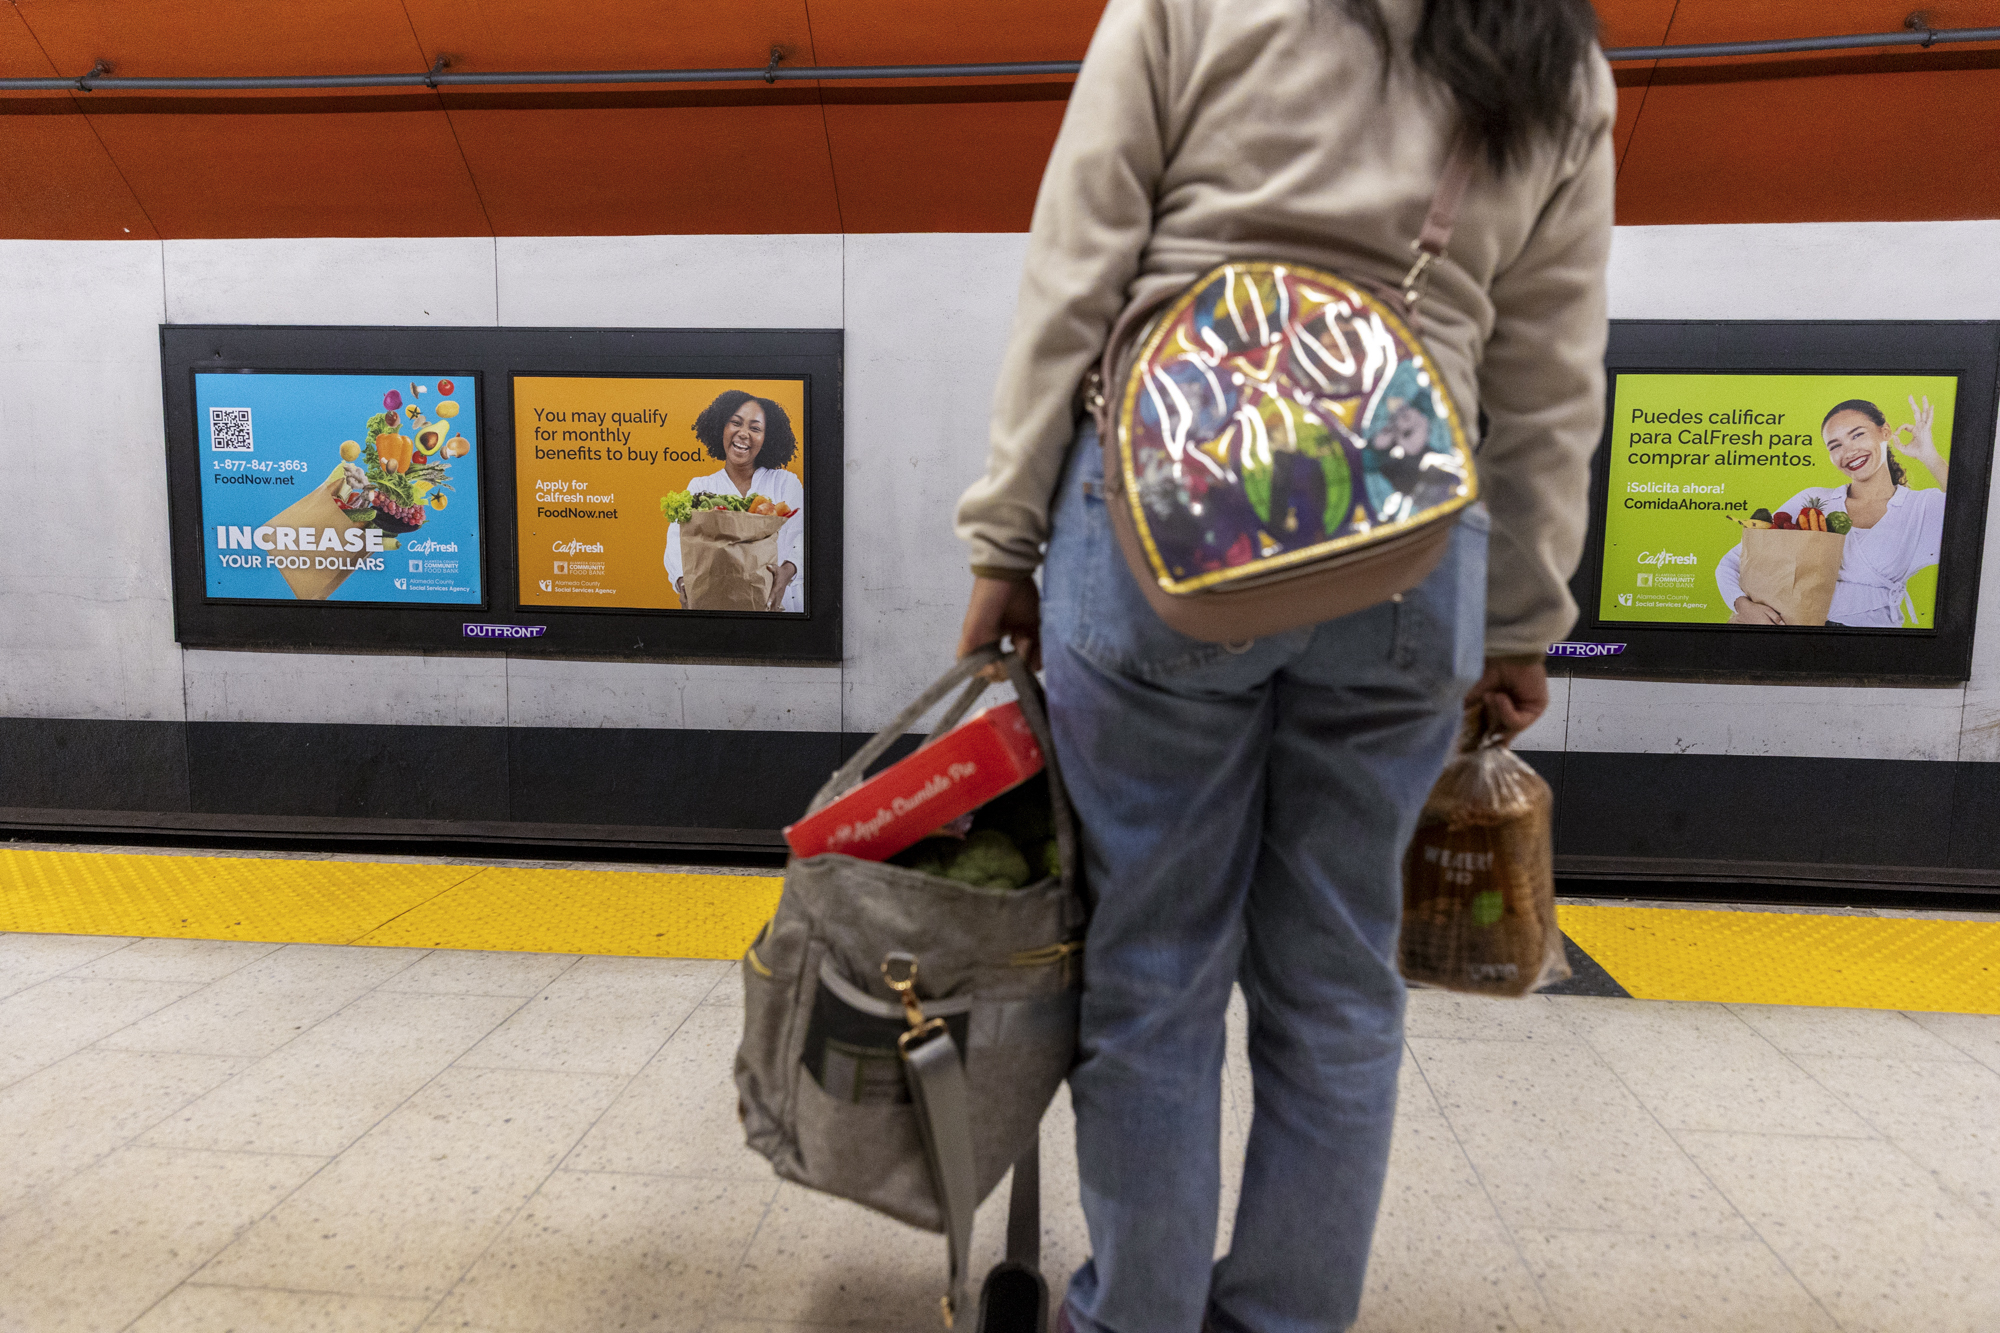
A commuter holds her groceries from the Alameda Food Bank at the 12th Street BART Station in Oakland on Nov. 14, 2025. (Tâm Vũ/KQED)
“All Items” is an index category that encompasses a huge variety of U.S. consumer spending, from groceries to education to entertainment — and CPI “is grounded in the value of the U.S. Dollar,” said Volpe. “And that can serve as a benchmark for saying, ‘Okay, this is what’s been going on economy-wide.’”
From 2016 to 2025 (the most recent year for which data is available), the CPI has gone up 34.14%, said Volpe.
Meaning that relative to the value of the dollar, “anything that’s gone up faster than that has become less affordable,” he said.
What about the price of groceries?
“The last 10 years encapsulate quite a roller coaster ride in food prices in the US,” Volpe said.
In 2016, food prices actually decreased — something “we do not see that often in the U.S.,” he said. “Inflation is the name of the game.”
After 2016, food prices “started to tip up,” said Volpe — and then came COVID-19. The pandemic ushered in record food price inflation in 2021 and 2022, which remains top of mind for many U.S. consumers, he said.
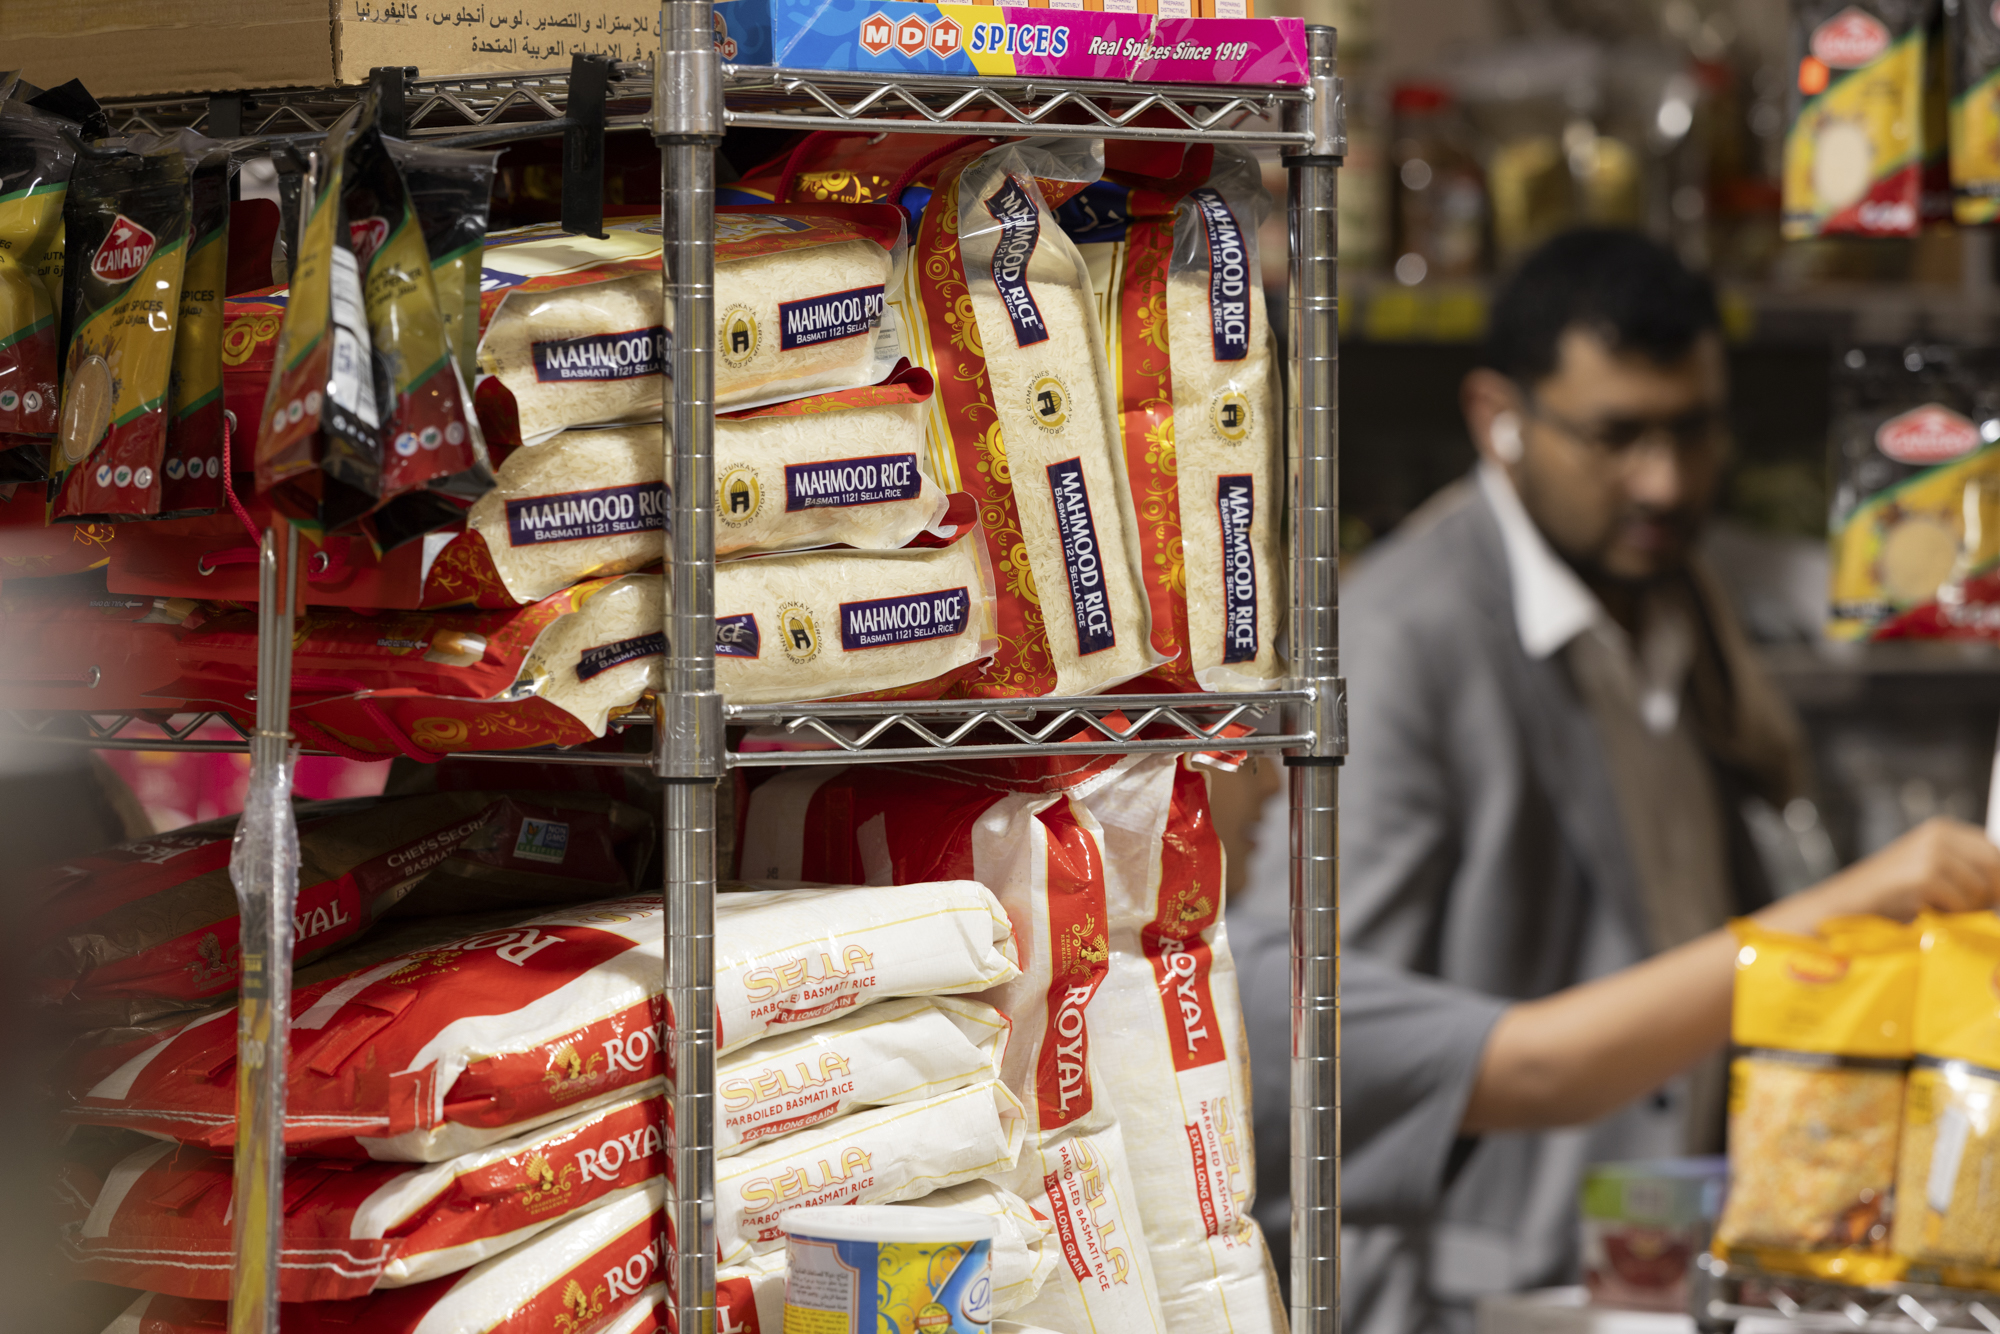
Besan’s International Market in San Bruno on March 8, 2025. (David M. Barreda/KQED)
Regardless, because food prices have never outright dropped since then, “any increases we see now, even modest ones, are on top of the food price inflation that hit Americans so hard over the last few years,” said Volpe. “So consumer sentiment is very much down on food.”
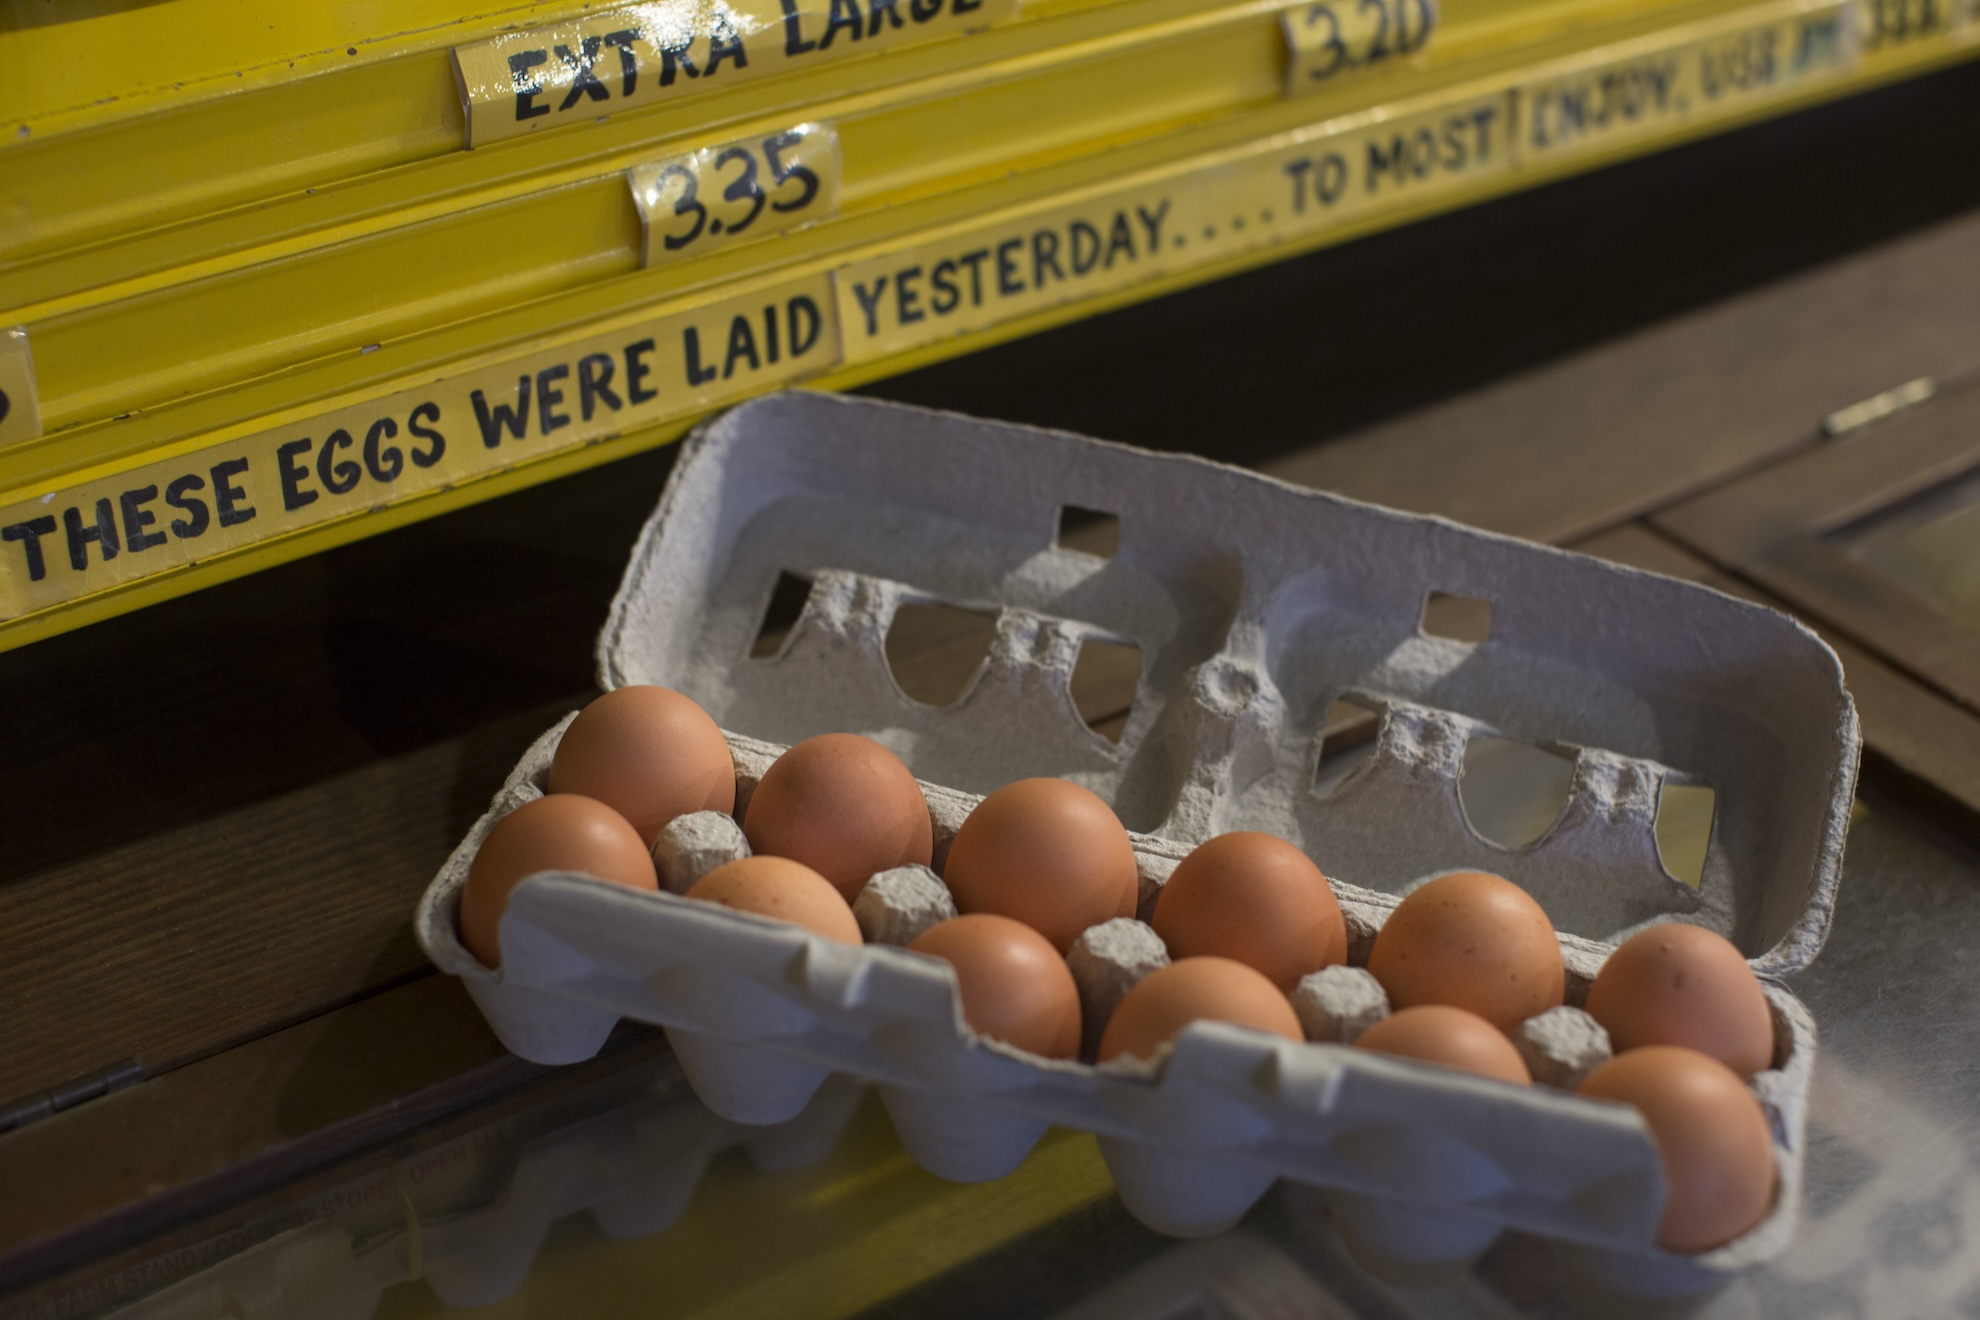
Let’s look at the classic — and increasingly political — example of eggs: specifically, a dozen large grade A eggs. In 2016, the average cost nationwide was $1.68, according to data provided by Volpe.
The 2025 average was $4.41 — a 161.59% increase, meaning these types of eggs have become less affordable for Americans over this time period.
An increase more in line with the consumer price index would have seen 2025 eggs costing around $2.25 on average.
Elsewhere in the grocery aisles, white rice went from 72 cents per pound in 2016 to $1.05 in 2025 — a 46.43% increase.
Eggs sit in a container at Chip-In Farm in Bedford, Massachusetts, on Jan. 7, 2016. (Dina Rudick/The Boston Globe via Getty Images)
And how about a snack you’re likely to see at a Super Bowl watch party, like potato chips? In 2016, the average price for 16 ounces of chips was $4.46, according to CPI data provided by Volpe. By 2025, those chips were $6.70 — a 50.12% increase.
By comparison, a price more aligned with the CPI would be around $5.98. But something that might surprise you: A gallon of fresh whole milk has actually become somewhat more affordable for Americans in this time period, relative to the U.S. dollar.
The 2016 average was $3.20, and the 2025 average was $4.07: a 26.97% increase, compared to the 34.14% rise in the Consumer Price Index.
What about local prices here in the Bay Area?
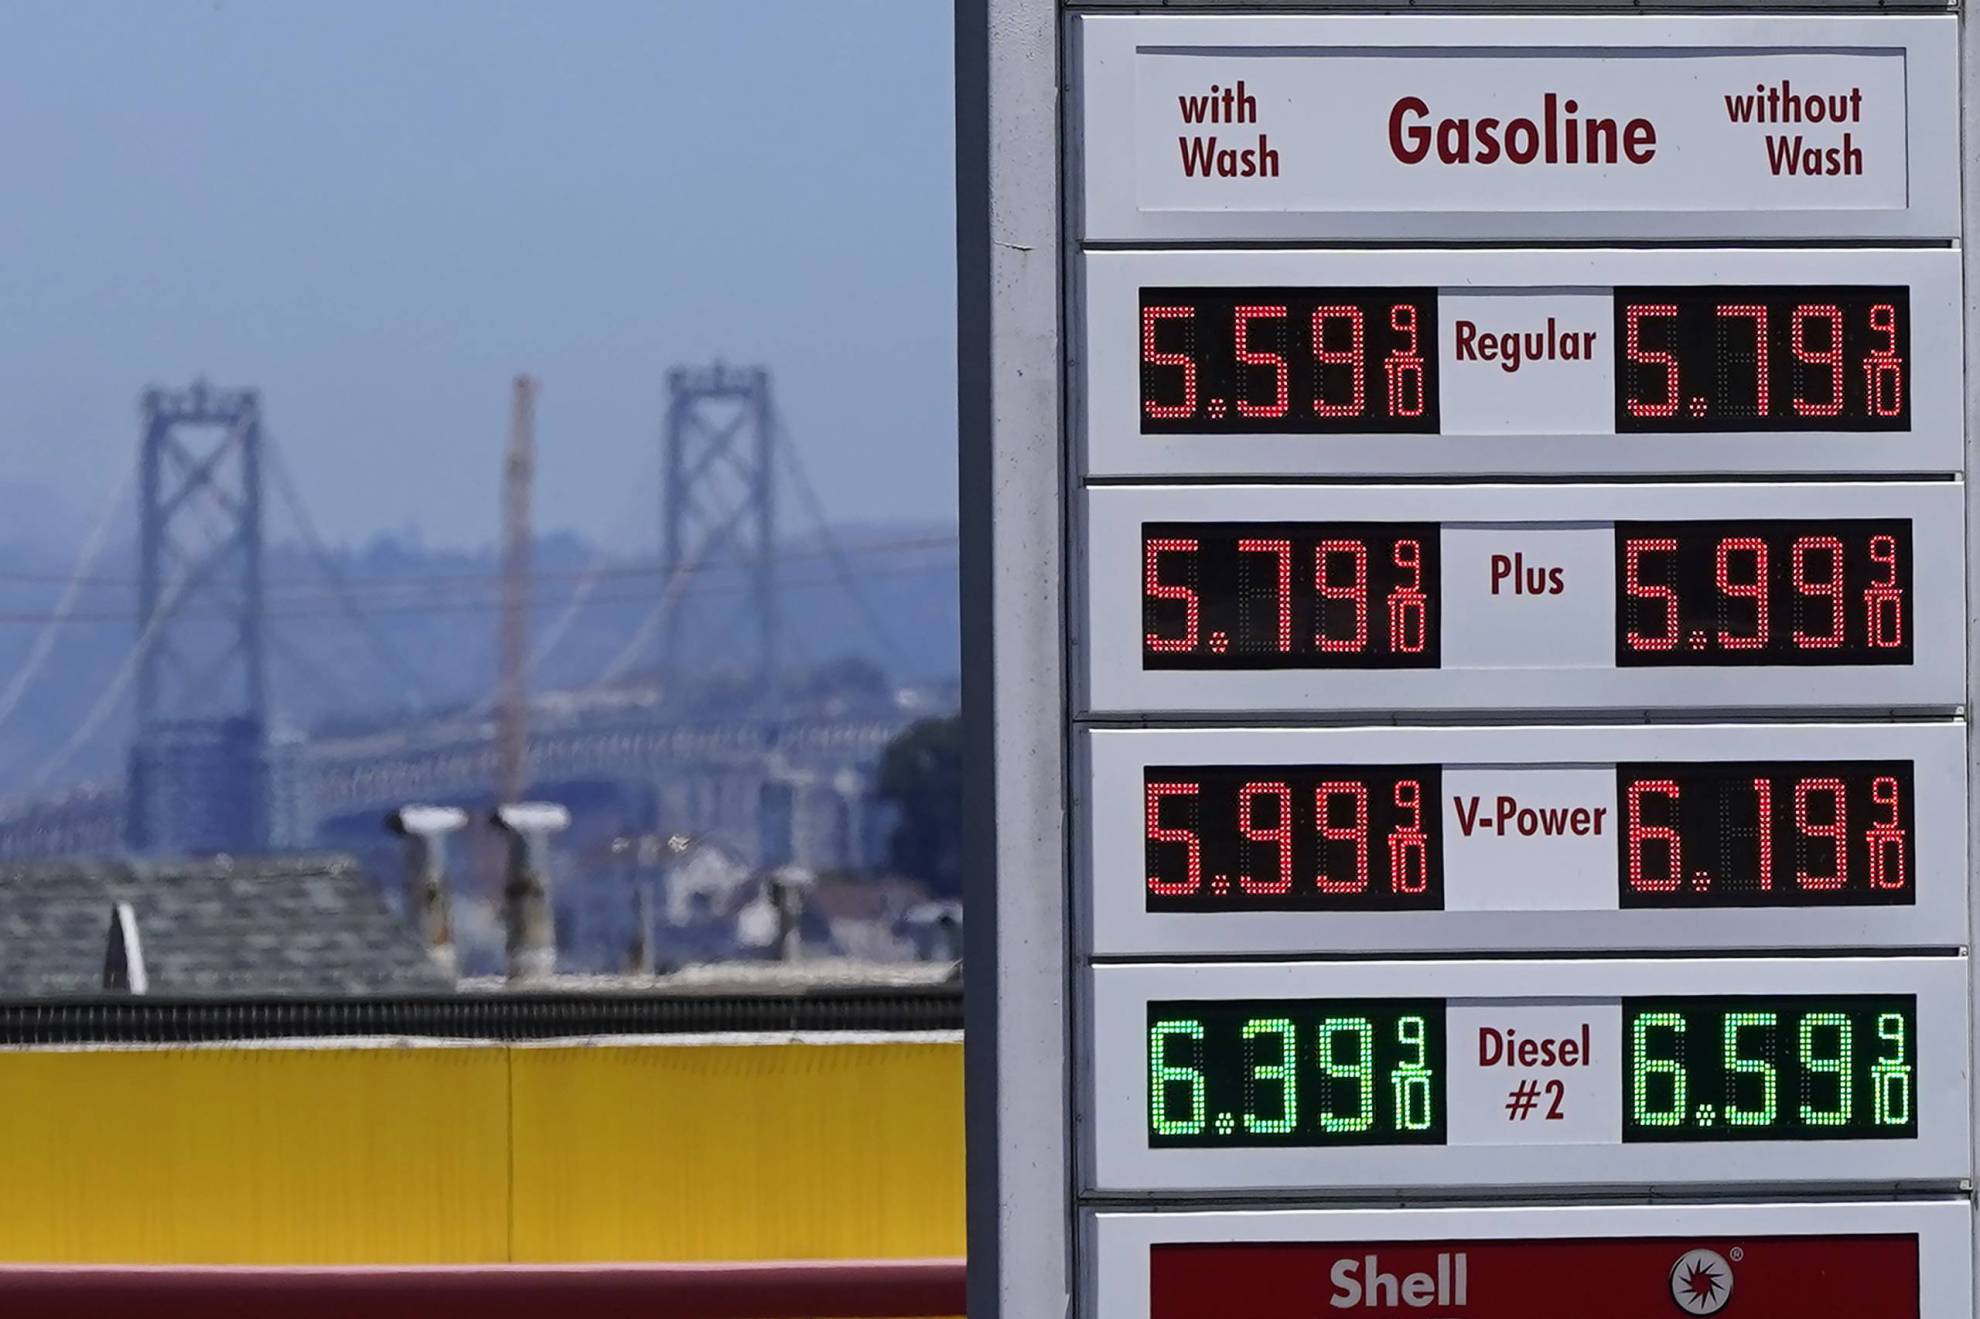
To look at more local examples here in the Bay Area, a few caveats are needed.
First, more localized data like this comes from different sources — meaning that because it may not match the exact timeline of the CPI increase, it won’t be an apples-to-apples comparison.
The Bay Bridge rises behind the price board of a gas station in San Francisco on July 20, 2022. (Jeff Chiu/AP)
Another thing to know: From 2016 to 2025, the Bay Area — measured as the San Francisco, Oakland and Hayward region — saw a slightly lower increase in CPI than the national average, of 33.66% compared to that 34.14% increase nationwide.
But Volpe stressed that this “does not mean that costs or prices are comparable” between the Bay Area and the rest of the country. “It just means that the rate of change in prices or affordability has been comparable between the Bay Area and the rest of the country.”
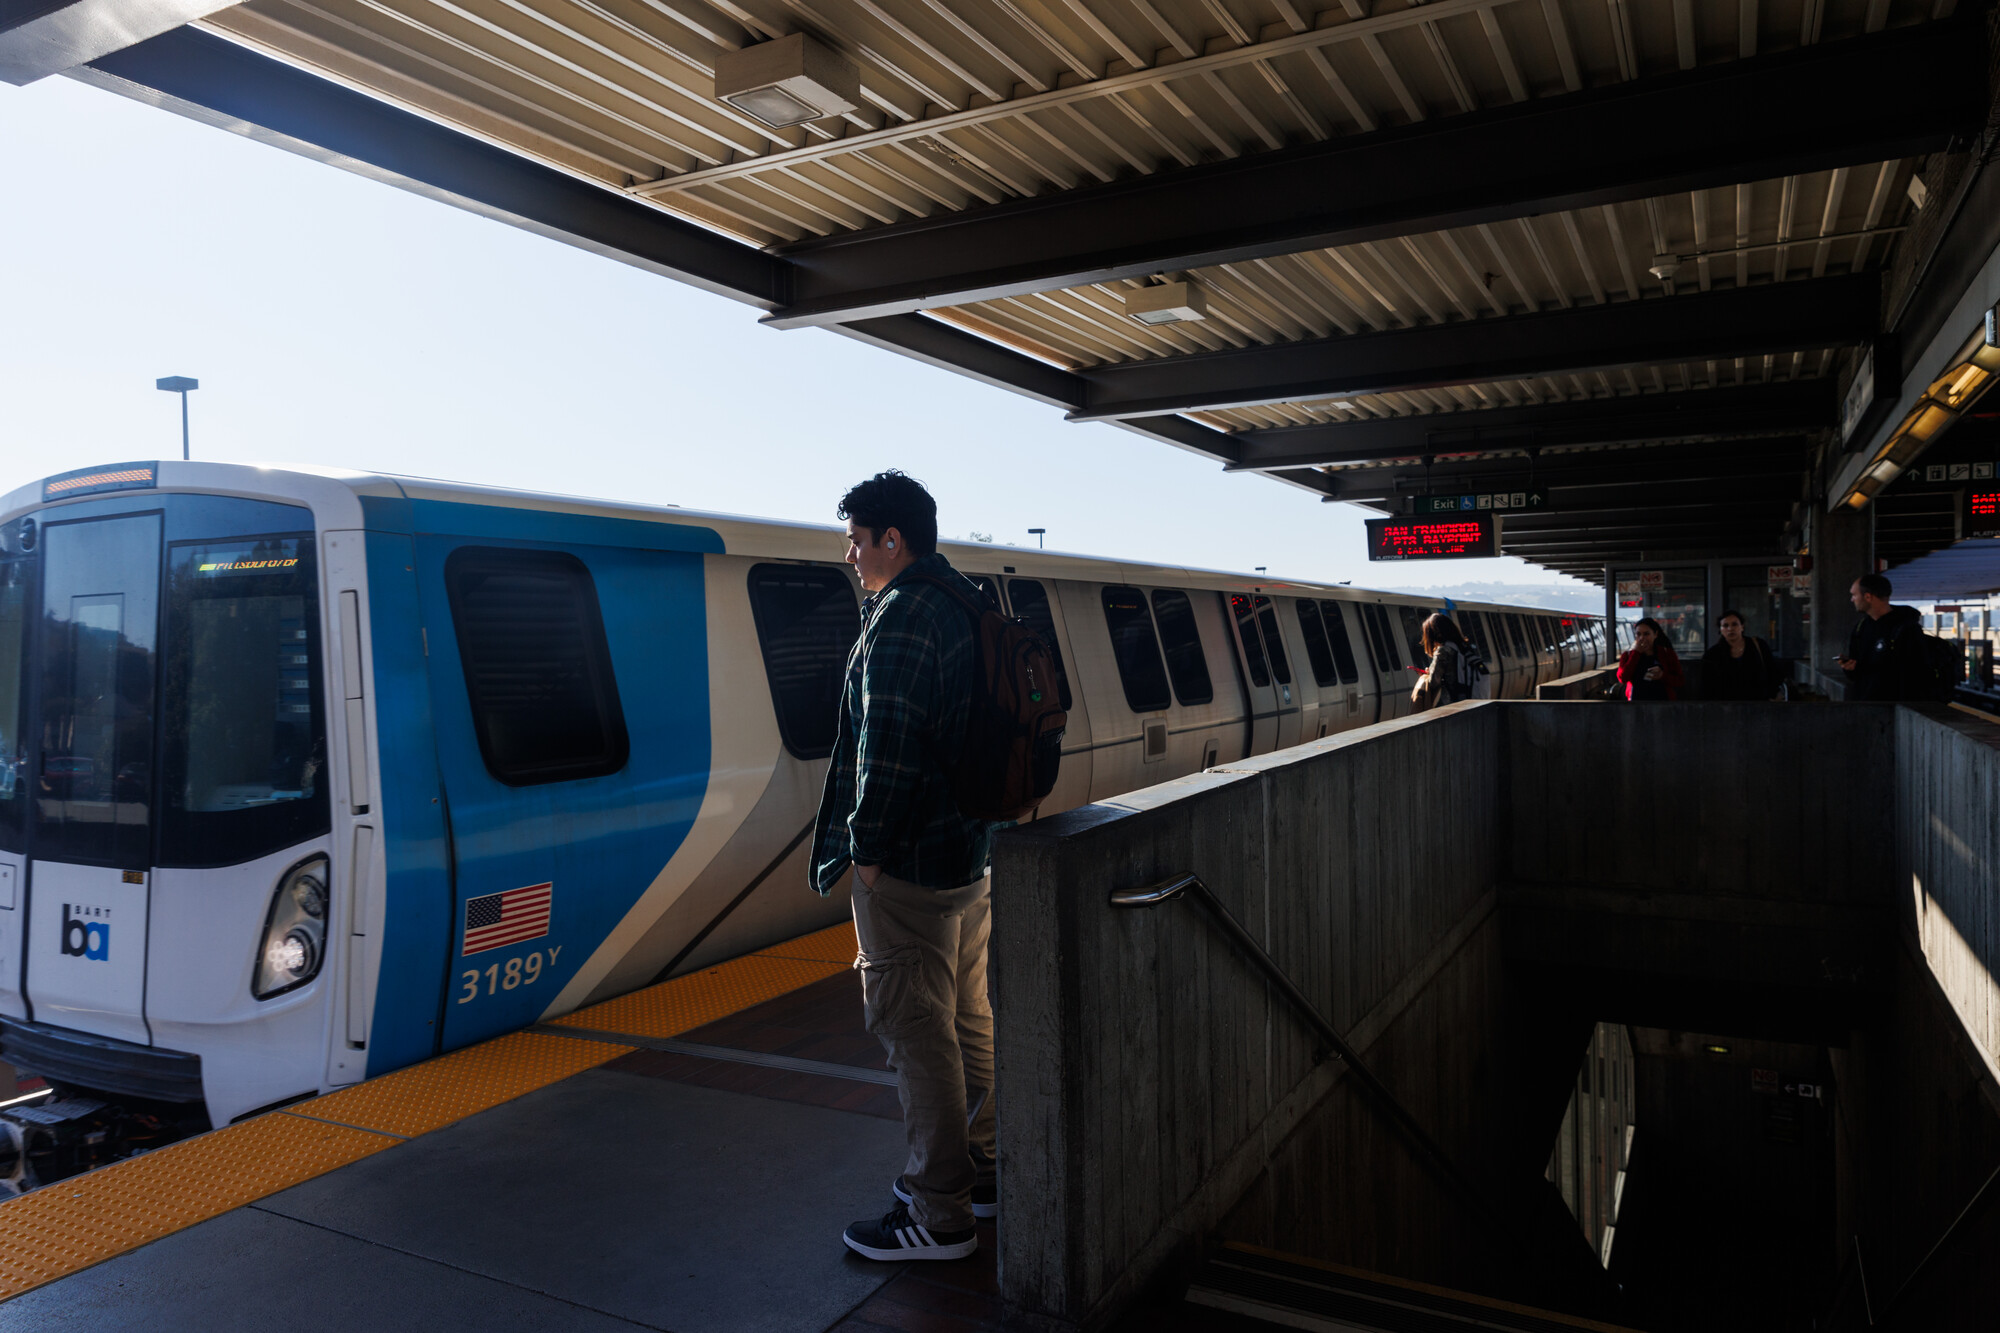
Between 2016 and 2026, there’s been a 36% increase in the average BART fare (which, remember, encompasses more time than the CPI). In January 2016, the average fare was $3.67, with a minimum fare of $1.95 and a maximum of $15.70.
Passengers wait to board BART at Daly City Station in Daly City, on Dec. 4, 2024. (Juliana Yamada/KQED)
The current average fare in 2026 has officially been updated to $4.98, according to a BART spokesperson in an email to KQED. This makes the latest price range of a journey on BART between $2.55 and $17.25.
As an aside, remember that in 2016, we had physical BART tickets made of paper, which were phased out in late 2023.
The average rent in the Bay Area
This is a thornier example, since housing markets are more granular, and rental data has always been somewhat tricky to get ahold of. But you can’t talk about Bay Area prices without getting into rent, right?
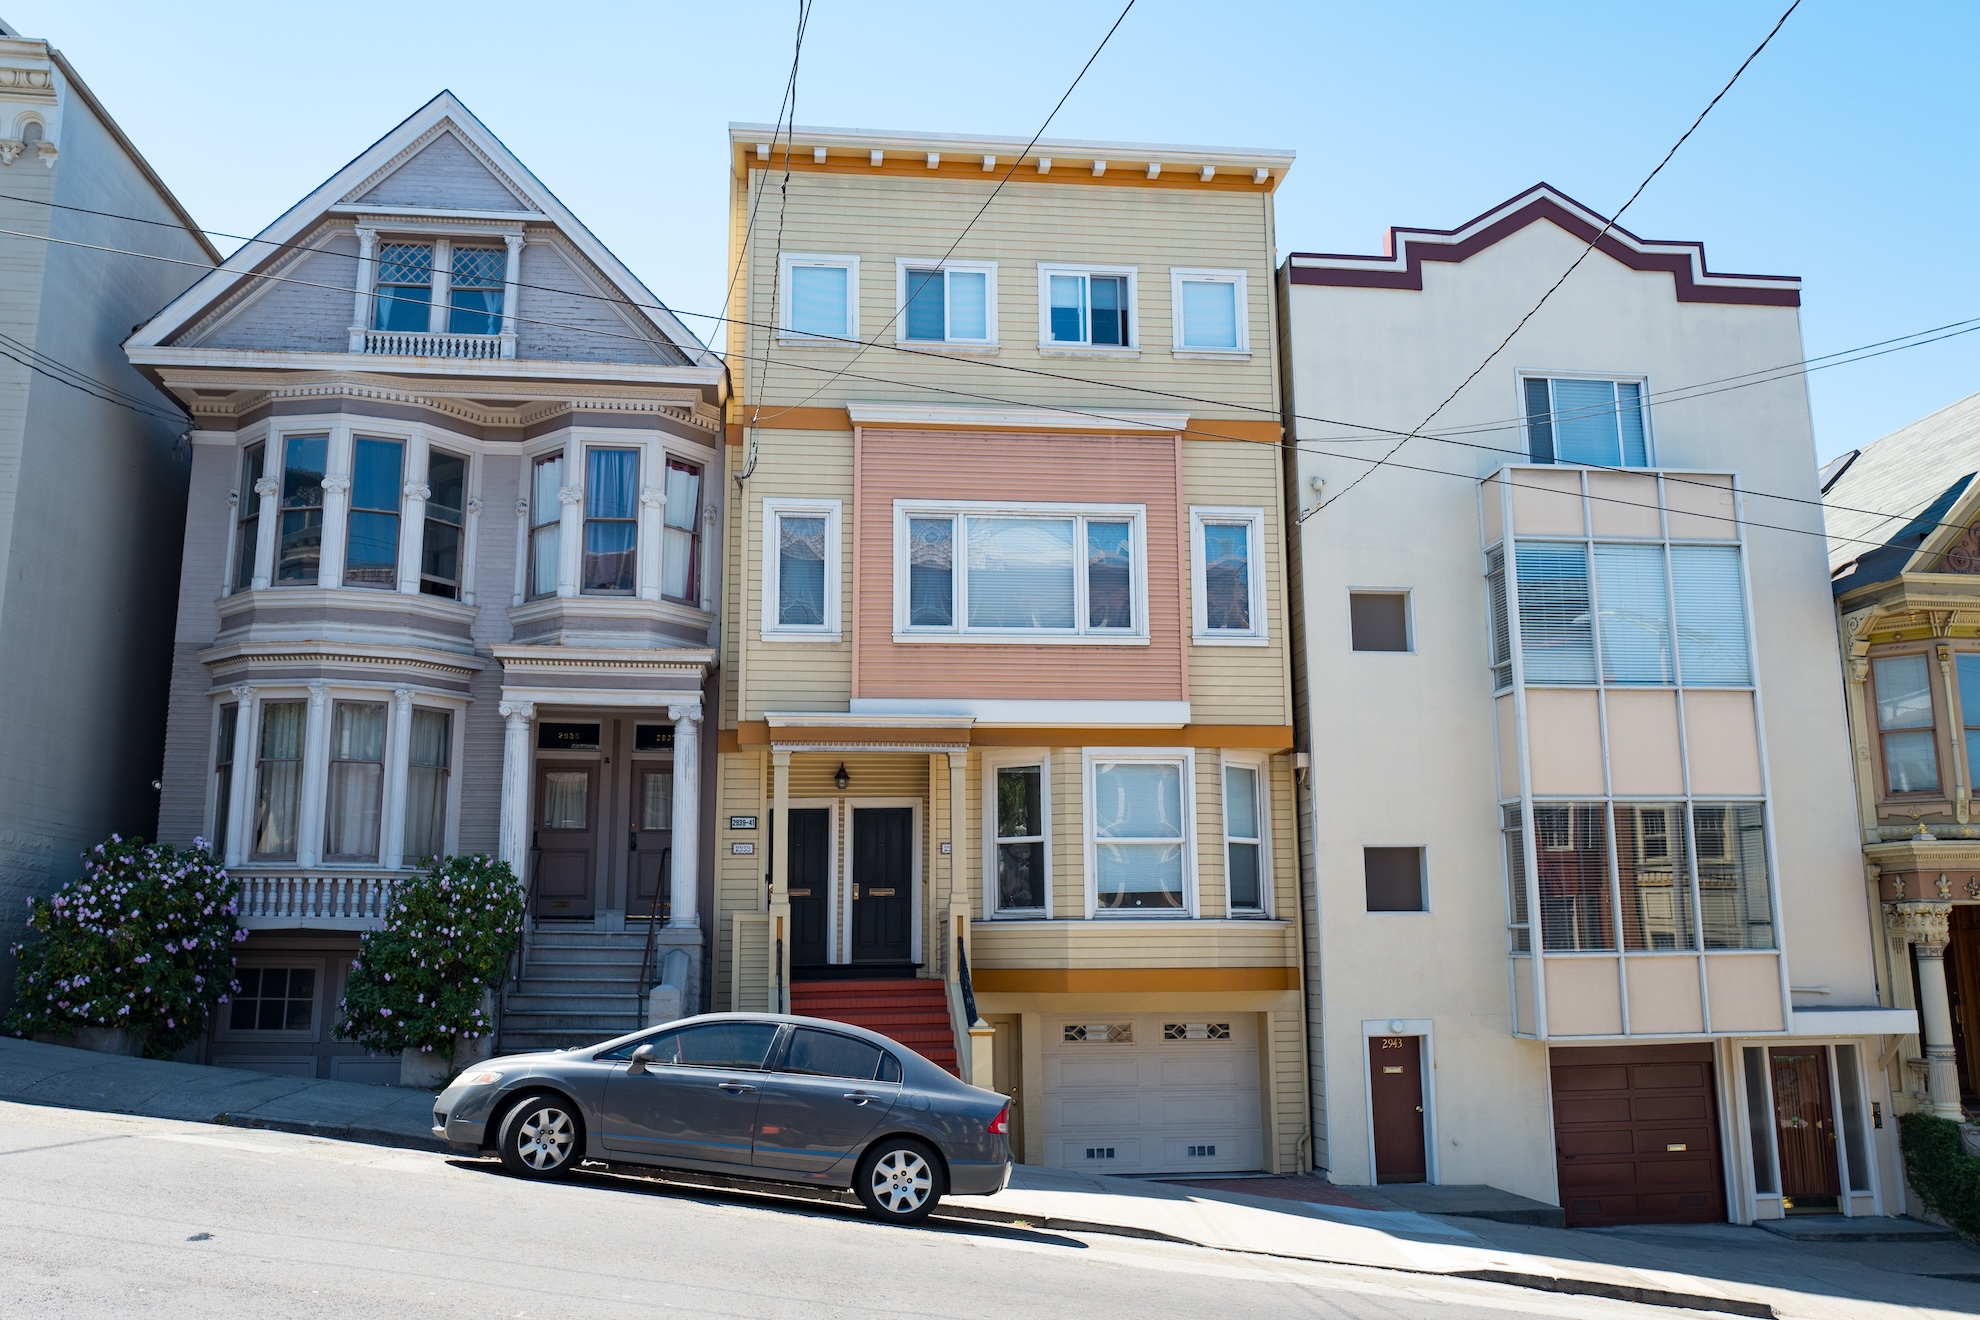
For the purposes of our task, we’ll be referring to real-estate website Zillow’s metric called the “Zillow Observed Rent Index” — which a Zillow spokesperson told KQED is used by the company to assess “typical rent.”
Three Victorian homes in a row on a steep hill on Fillmore Street in San Francisco, California, on Aug. 28, 2016. (Photo via Smith Collection/Getty Images)
Rather than reflecting a home’s number of beds or baths, this metric instead “looks at all available rentals, narrows into the middle third, then takes the average of just those units,” according to the spokesperson.
Zillow’s most recently available data is from a few months ago, for December 2025 — so let’s compare our rents with December 2015 this time. In 2025, in Santa Clara, where the Super Bowl will take place on Sunday, the typical rent was $3,578. Ten years ago, that number was $2,745: a rise of just over 30%.
But in San Francisco, a different picture emerges. According to Zillow’s metric, the typical rent in San Francisco in December 2025 was $3,666 — and in December 2015, it was $3,190.
Related Article
This 10-year rise of just under 15% might strike you as lower than you’d expect.
Alex Lacter, a spokesperson for Zillow, told KQED that among the U.S.’s biggest 50 cities, the city’s growth in rent has actually “been by far the lowest over that period” — with the next lowest being Washington, D.C’s rent, at just under 26%. By comparison, he said, Fresno’s rents went up 90% in the same period.
But for context, it’s important to remember how rent “fell significantly in urban areas of San Francisco” during the COVID-19 pandemic, said Lacter, which put the city “behind many other markets when it comes to rent growth over this 10-year period.”
Ted Egan, chief economist with San Francisco’s Office of Economic Analysis, echoed this take: “Because of economic changes that happened to the city during COVID, housing is actually cheaper than it was 10 years ago,” he said.
Plus, in a city as expensive as San Francisco, “there’s only so high [rents] can climb where enough people can still afford them to keep units filled,” speculated Lacter.
The cost of season tickets for a 49ers game
The fact that Levi’s Stadium has changed the way it structures its seating since the last time it hosted a Super Bowl — almost tripling the number of pricing tiers on sale — makes this one slightly trickier to find an apples-to-apples ticket comparison, said Keith Pagello, founder of TicketData.
During the 2015-16 season, there were only 11 pricing tiers at Levi’s — but now the stadium is broken into 30 tiers.
Super Bowl 50 at Levi’s Stadium on Feb. 7, 2016, in Santa Clara, California. (Ezra Shaw via Getty Images)
However, even with that in mind, “the overall increase is still very clear,” said Pagello. For example, according to a 2026 ticketing season map, Section 101’s first 10 rows are priced at $315. The same section during the 2015-16 season was $125 — a 152% increase.
“Quite a jump!” Pagello said.
lower waypointnext waypoint
Player sponsored by
window.__IS_SSR__=true
window.__INITIAL_STATE__={
"attachmentsReducer": {
"audio_0": {
"type": "attachments",
"id": "audio_0",
"imgSizes": {
"kqedFullSize": {
"file": "https://ww2.kqed.org/news/wp-content/themes/KQED-unified/img/audio_bgs/background0.jpg"
}
}
},
"audio_1": {
"type": "attachments",
"id": "audio_1",
"imgSizes": {
"kqedFullSize": {
"file": "https://ww2.kqed.org/news/wp-content/themes/KQED-unified/img/audio_bgs/background1.jpg"
}
}
},
"audio_2": {
"type": "attachments",
"id": "audio_2",
"imgSizes": {
"kqedFullSize": {
"file": "https://ww2.kqed.org/news/wp-content/themes/KQED-unified/img/audio_bgs/background2.jpg"
}
}
},
"audio_3": {
"type": "attachments",
"id": "audio_3",
"imgSizes": {
"kqedFullSize": {
"file": "https://ww2.kqed.org/news/wp-content/themes/KQED-unified/img/audio_bgs/background3.jpg"
}
}
},
"audio_4": {
"type": "attachments",
"id": "audio_4",
"imgSizes": {
"kqedFullSize": {
"file": "https://ww2.kqed.org/news/wp-content/themes/KQED-unified/img/audio_bgs/background4.jpg"
}
}
},
"placeholder": {
"type": "attachments",
"id": "placeholder",
"imgSizes": {
"thumbnail": {
"file": "https://cdn.kqed.org/wp-content/uploads/2024/12/KQED-Default-Image-816638274-2000x1333-1-160x107.jpg",
"width": 160,
"height": 107,
"mimeType": "image/jpeg"
},
"medium": {
"file": "https://cdn.kqed.org/wp-content/uploads/2024/12/KQED-Default-Image-816638274-2000x1333-1-800x533.jpg",
"width": 800,
"height": 533,
"mimeType": "image/jpeg"
},
"medium_large": {
"file": "https://cdn.kqed.org/wp-content/uploads/2024/12/KQED-Default-Image-816638274-2000x1333-1-768x512.jpg",
"width": 768,
"height": 512,
"mimeType": "image/jpeg"
},
"large": {
"file": "https://cdn.kqed.org/wp-content/uploads/2024/12/KQED-Default-Image-816638274-2000x1333-1-1020x680.jpg",
"width": 1020,
"height": 680,
"mimeType": "image/jpeg"
},
"1536x1536": {
"file": "https://cdn.kqed.org/wp-content/uploads/2024/12/KQED-Default-Image-816638274-2000x1333-1-1536x1024.jpg",
"width": 1536,
"height": 1024,
"mimeType": "image/jpeg"
},
"fd-lrg": {
"file": "https://cdn.kqed.org/wp-content/uploads/2024/12/KQED-Default-Image-816638274-2000x1333-1-1536x1024.jpg",
"width": 1536,
"height": 1024,
"mimeType": "image/jpeg"
},
"fd-med": {
"file": "https://cdn.kqed.org/wp-content/uploads/2024/12/KQED-Default-Image-816638274-2000x1333-1-1020x680.jpg",
"width": 1020,
"height": 680,
"mimeType": "image/jpeg"
},
"fd-sm": {
"file": "https://cdn.kqed.org/wp-content/uploads/2024/12/KQED-Default-Image-816638274-2000x1333-1-800x533.jpg",
"width": 800,
"height": 533,
"mimeType": "image/jpeg"
},
"post-thumbnail": {
"file": "https://cdn.kqed.org/wp-content/uploads/2024/12/KQED-Default-Image-816638274-2000x1333-1-672x372.jpg",
"width": 672,
"height": 372,
"mimeType": "image/jpeg"
},
"twentyfourteen-full-width": {
"file": "https://cdn.kqed.org/wp-content/uploads/2024/12/KQED-Default-Image-816638274-2000x1333-1-1038x576.jpg",
"width": 1038,
"height": 576,
"mimeType": "image/jpeg"
},
"xxsmall": {
"file": "https://cdn.kqed.org/wp-content/uploads/2024/12/KQED-Default-Image-816638274-2000x1333-1-160x107.jpg",
"width": 160,
"height": 107,
"mimeType": "image/jpeg"
},
"xsmall": {
"file": "https://cdn.kqed.org/wp-content/uploads/2024/12/KQED-Default-Image-816638274-2000x1333-1-672x372.jpg",
"width": 672,
"height": 372,
"mimeType": "image/jpeg"
},
"small": {
"file": "https://cdn.kqed.org/wp-content/uploads/2024/12/KQED-Default-Image-816638274-2000x1333-1-672x372.jpg",
"width": 672,
"height": 372,
"mimeType": "image/jpeg"
},
"xlarge": {
"file": "https://cdn.kqed.org/wp-content/uploads/2024/12/KQED-Default-Image-816638274-2000x1333-1-1020x680.jpg",
"width": 1020,
"height": 680,
"mimeType": "image/jpeg"
},
"full-width": {
"file": "https://cdn.kqed.org/wp-content/uploads/2024/12/KQED-Default-Image-816638274-2000x1333-1-1920x1280.jpg",
"width": 1920,
"height": 1280,
"mimeType": "image/jpeg"
},
"guest-author-32": {
"file": "https://cdn.kqed.org/wp-content/uploads/2025/01/KQED-Default-Image-816638274-1333x1333-1-160x160.jpg",
"width": 32,
"height": 32,
"mimeType": "image/jpeg"
},
"guest-author-50": {
"file": "https://cdn.kqed.org/wp-content/uploads/2025/01/KQED-Default-Image-816638274-1333x1333-1-160x160.jpg",
"width": 50,
"height": 50,
"mimeType": "image/jpeg"
},
"guest-author-64": {
"file": "https://cdn.kqed.org/wp-content/uploads/2025/01/KQED-Default-Image-816638274-1333x1333-1-160x160.jpg",
"width": 64,
"height": 64,
"mimeType": "image/jpeg"
},
"guest-author-96": {
"file": "https://cdn.kqed.org/wp-content/uploads/2025/01/KQED-Default-Image-816638274-1333x1333-1-160x160.jpg",
"width": 96,
"height": 96,
"mimeType": "image/jpeg"
},
"guest-author-128": {
"file": "https://cdn.kqed.org/wp-content/uploads/2025/01/KQED-Default-Image-816638274-1333x1333-1-160x160.jpg",
"width": 128,
"height": 128,
"mimeType": "image/jpeg"
},
"detail": {
"file": "https://cdn.kqed.org/wp-content/uploads/2025/01/KQED-Default-Image-816638274-1333x1333-1-160x160.jpg",
"width": 160,
"height": 160,
"mimeType": "image/jpeg"
},
"kqedFullSize": {
"file": "https://cdn.kqed.org/wp-content/uploads/2024/12/KQED-Default-Image-816638274-2000x1333-1.jpg",
"width": 2000,
"height": 1333
}
}
},
"news_12072674": {
"type": "attachments",
"id": "news_12072674",
"meta": {
"index": "attachments_1716263798",
"site": "news",
"id": "12072674",
"found": true
},
"title": "Woman Inserts Cash Into Wallet",
"publishDate": 1770413026,
"status": "inherit",
"parent": 12072629,
"modified": 1770418707,
"caption": "2016 was the last time the Bay Area hosted the Super Bowl. How much more expensive have things gotten since then? \r\n",
"credit": "Grace Cary via Getty Images",
"altTag": null,
"description": null,
"imgSizes": {
"thumbnail": {
"file": "https://cdn.kqed.org/wp-content/uploads/sites/10/2026/02/GettyImages-1493652768-160x107.jpg",
"width": 160,
"height": 107,
"mimeType": "image/jpeg"
},
"1536x1536": {
"file": "https://cdn.kqed.org/wp-content/uploads/sites/10/2026/02/GettyImages-1493652768-1536x1024.jpg",
"width": 1536,
"height": 1024,
"mimeType": "image/jpeg"
},
"post-thumbnail": {
"file": "https://cdn.kqed.org/wp-content/uploads/sites/10/2026/02/GettyImages-1493652768-672x372.jpg",
"width": 672,
"height": 372,
"mimeType": "image/jpeg"
},
"twentyfourteen-full-width": {
"file": "https://cdn.kqed.org/wp-content/uploads/sites/10/2026/02/GettyImages-1493652768-1038x576.jpg",
"width": 1038,
"height": 576,
"mimeType": "image/jpeg"
},
"npr-cds-wide": {
"file": "https://cdn.kqed.org/wp-content/uploads/sites/10/2026/02/GettyImages-1493652768-1200x675.jpg",
"width": 1200,
"height": 675,
"mimeType": "image/jpeg"
},
"kqedFullSize": {
"file": "https://cdn.kqed.org/wp-content/uploads/sites/10/2026/02/GettyImages-1493652768.jpg",
"width": 1980,
"height": 1320
}
},
"isLoading": false,
"fetchFailed": false
}
},
"audioPlayerReducer": {
"postId": "stream_live",
"isPaused": true,
"isPlaying": false,
"pfsActive": false,
"pledgeModalIsOpen": true,
"playerDrawerIsOpen": false,
"liveAudioPlayStartedAt": 0,
"liveAudioPlayContext": ""
},
"authorsReducer": {
"nkhan": {
"type": "authors",
"id": "11867",
"meta": {
"index": "authors_1716337520",
"id": "11867",
"found": true
},
"name": "Nisa Khan",
"firstName": "Nisa",
"lastName": "Khan",
"slug": "nkhan",
"email": "nkhan@kqed.org",
"display_author_email": false,
"staff_mastheads": [],
"title": "KQED Contributor",
"bio": "Nisa Khan is a reporter for KQED's Audience News Desk. She was formerly a data reporter at Michigan Radio. She earned a Bachelor of Science in Information from the University of Michigan and a Master of Arts in Communication from Stanford University.",
"avatar": "https://secure.gravatar.com/avatar/a3bf1efcfbe7658d13a434cc54d0b2e3?s=600&d=blank&r=g",
"twitter": "mnisakhan",
"bluesky": null,
"facebook": null,
"instagram": null,
"linkedin": null,
"sites": [
{
"site": "arts",
"roles": [
"editor"
]
},
{
"site": "news",
"roles": [
"editor"
]
},
{
"site": "science",
"roles": [
"editor",
"author"
]
},
{
"site": "forum",
"roles": [
"editor"
]
},
{
"site": "liveblog",
"roles": [
"contributor"
]
}
],
"headData": {
"title": "Nisa Khan | KQED",
"description": "KQED Contributor",
"ogImgSrc": "https://secure.gravatar.com/avatar/a3bf1efcfbe7658d13a434cc54d0b2e3?s=600&d=blank&r=g",
"twImgSrc": "https://secure.gravatar.com/avatar/a3bf1efcfbe7658d13a434cc54d0b2e3?s=600&d=blank&r=g"
},
"isLoading": false,
"link": "/author/nkhan"
}
},
"pagesReducer": {},
"pfsSessionReducer": {},
"postsReducer": {
"stream_live": {
"type": "live",
"id": "stream_live",
"audioUrl": "https://streams.kqed.org/kqedradio",
"title": "Live Stream",
"excerpt": "Live Stream information currently unavailable.",
"link": "/radio",
"featImg": "",
"label": {
"name": "KQED Live",
"link": "/"
}
},
"stream_kqedNewscast": {
"type": "posts",
"id": "stream_kqedNewscast",
"audioUrl": "https://www.kqed.org/.stream/anon/radio/RDnews/newscast.mp3?_=1",
"title": "KQED Newscast",
"featImg": "",
"label": {
"name": "88.5 FM",
"link": "/"
}
},
"news_12072629": {
"type": "posts",
"id": "news_12072629",
"meta": {
"index": "posts_1716263798",
"site": "news",
"id": "12072629",
"found": true
},
"articlePosition": 0,
"guestAuthors": [],
"slug": "a-decade-on-the-bay-area-is-hosting-another-super-bowl-how-have-prices-changed-since-2016",
"title": "A Decade on, the Bay Area Is Hosting Another Super Bowl. How Have Prices Changed Since 2016?",
"publishDate": 1770465652,
"format": "standard",
"headTitle": "A Decade on, the Bay Area Is Hosting Another Super Bowl. How Have Prices Changed Since 2016? | KQED",
"labelTerm": {
"site": "news"
},
"content": "\u003cp>Alongside \u003cem>Heated Rivalry\u003c/em> rewatches and furious posts about \u003ca href=\"https://www.rollingstone.com/culture/culture-features/harry-styles-tour-blood-tickets-1235505811/\">the price of Harry Styles tickets\u003c/a>, you may have noticed a nostalgic \u003ca href=\"https://www.npr.org/2026/01/16/nx-s1-5680084/why-reliving-2016-is-the-new-social-media-trend\">“me in 2016” micro-trend\u003c/a> while scrolling social media in the last few weeks.\u003c/p>\n\u003cp>From your friends’ \u003ca href=\"https://www.thecut.com/article/what-do-we-really-miss-about-2016-photos.html\">VSCO-filtered throwback photos\u003c/a> featuring leggings and black mesh tops to \u003ca href=\"https://www.teenvogue.com/story/best-evil-kermit-memes\">“evil Kermit” memes\u003c/a> and Vine compilations, many of our feeds were briefly overtaken by odes to a so-called simpler time a decade ago (This reporter remains baffled by the longing: This was the year Carrie Fisher died, after all).\u003c/p>\n\u003cp>2016 was also the year the Bay Area \u003cem>last \u003c/em>hosted a \u003ca href=\"https://www.nfl.com/photos/super-bowl-50-0ap3000000633830#f7085554-9f49-43cf-b017-aba23ab28a01\">Super Bowl\u003c/a>, which saw the Denver Broncos beat the Carolina Panthers and Coldplay as the halftime show with Beyoncé and Bruno Mars.\u003c/p>\n\u003cp>[ad fullwidth]\u003c/p>\n\u003cp>This Sunday, the NFL’s biggest game is returning to our region once again with Super Bowl LX at Santa Clara’s Levi’s Stadium, featuring the Seattle Seahawks, the New England Patriots and \u003ca href=\"https://www.kqed.org/arts/13986280/bad-bunny-bay-area-imoact-sol-food-mural-pinatas-super-bowl-mission-district\">a halftime show by Bad Bunny\u003c/a>.\u003c/p>\n\u003cp>With the universe seemingly insisting in this moment on us casting our minds back a decade earlier, there’s one aspect that’s hard to ignore: the affordability crisis that’s \u003ca href=\"https://www.kqed.org/affordability\">hit the Bay Area particularly hard\u003c/a>, and just how much prices have risen since 2016.\u003c/p>\n\u003cp>https://twitter.com/spaceashes/status/2015670842106003680?s=46&t=7BBzFwo6eYLzJIVfAlumEQ\u003c/p>\n\u003cp>But how simple \u003cem>is \u003c/em>it to compare how much cheaper — or not — everyday items were back then, and how much prices have actually changed?\u003c/p>\n\u003cp>In the spirit of \u003ca href=\"https://en.wikipedia.org/wiki/2026_is_the_new_2016\">2026 being the new 2016\u003c/a>, let’s take a deep dive.\u003c/p>\n\u003ch2>First off, what’s the best way to look at changing prices over the years?\u003c/h2>\n\u003cp>To get an accurate impression of whether something has become more expensive, beyond the changing numbers, it’s important to account for inflation.\u003c/p>\n\u003cp>And according to Ricky Volpe, professor of Agribusiness at California Polytechnic State University, this makes the \u003ca href=\"https://www.irp.wisc.edu/resources/what-is-the-consumer-price-index-and-how-is-it-used/\">Consumer Price Index\u003c/a> (CPI) — which measures price changes over time and serves as a key indicator of inflation — a good baseline for assessing increases.\u003c/p>\n\u003cfigure id=\"attachment_12067357\" class=\"wp-caption aligncenter\" style=\"max-width: 2000px\">\u003cimg loading=\"lazy\" decoding=\"async\" class=\"size-full wp-image-12067357\" src=\"https://cdn.kqed.org/wp-content/uploads/sites/10/2025/12/251113-SNAPDELAYSFEATURE01284_TV-KQED_1.jpg\" alt=\"\" width=\"2000\" height=\"1333\" srcset=\"https://cdn.kqed.org/wp-content/uploads/sites/10/2025/12/251113-SNAPDELAYSFEATURE01284_TV-KQED_1.jpg 2000w, https://cdn.kqed.org/wp-content/uploads/sites/10/2025/12/251113-SNAPDELAYSFEATURE01284_TV-KQED_1-160x107.jpg 160w, https://cdn.kqed.org/wp-content/uploads/sites/10/2025/12/251113-SNAPDELAYSFEATURE01284_TV-KQED_1-1536x1024.jpg 1536w\" sizes=\"auto, (max-width: 2000px) 100vw, 2000px\">\u003cfigcaption class=\"wp-caption-text\">A commuter holds her groceries from the Alameda Food Bank at the 12th Street BART Station in Oakland on Nov. 14, 2025. \u003ccite>(Tâm Vũ/KQED)\u003c/cite>\u003c/figcaption>\u003c/figure>\n\u003cp>“All Items” is \u003ca href=\"https://fred.stlouisfed.org/series/CPIAUCSL\">an index category\u003c/a> that encompasses a huge variety of U.S. consumer spending, from groceries to education to entertainment — and CPI “is grounded in the value of the U.S. Dollar,” said Volpe. “And that can serve as a benchmark for saying, ‘Okay, this is what’s been going on economy-wide.’”\u003c/p>\n\u003cp>From 2016 to 2025 (the most recent year for which data is available), the CPI has gone up 34.14%, said Volpe.\u003c/p>\n\u003cp>Meaning that relative to the value of the dollar, “anything that’s gone up faster than that has become less affordable,” he said.\u003c/p>\n\u003ch2>\u003cstrong>What about the price of groceries?\u003c/strong>\u003c/h2>\n\u003cp>“The last 10 years encapsulate quite a roller coaster ride in food prices in the US,” Volpe said.\u003c/p>\n\u003cp>In 2016, food prices actually \u003cem>decreased \u003c/em>— something “we do not see that often in the U.S.,” he said. “Inflation is the name of the game.”\u003c/p>\n\u003cp>After 2016, food prices “started to tip up,” said Volpe — and then came COVID-19. The pandemic ushered in record food price inflation in 2021 and 2022, which remains top of mind for many U.S. consumers, he said.\u003c/p>\n\u003cfigure id=\"attachment_12030659\" class=\"wp-caption aligncenter\" style=\"max-width: 2000px\">\u003cimg loading=\"lazy\" decoding=\"async\" class=\"wp-image-12030659 size-full\" src=\"https://cdn.kqed.org/wp-content/uploads/sites/10/2025/03/20250308_BESANS-MARKET_DMB_00903-KQED.jpg\" alt=\"\" width=\"2000\" height=\"1334\" srcset=\"https://cdn.kqed.org/wp-content/uploads/sites/10/2025/03/20250308_BESANS-MARKET_DMB_00903-KQED.jpg 2000w, https://cdn.kqed.org/wp-content/uploads/sites/10/2025/03/20250308_BESANS-MARKET_DMB_00903-KQED-800x534.jpg 800w, https://cdn.kqed.org/wp-content/uploads/sites/10/2025/03/20250308_BESANS-MARKET_DMB_00903-KQED-1020x680.jpg 1020w, https://cdn.kqed.org/wp-content/uploads/sites/10/2025/03/20250308_BESANS-MARKET_DMB_00903-KQED-160x107.jpg 160w, https://cdn.kqed.org/wp-content/uploads/sites/10/2025/03/20250308_BESANS-MARKET_DMB_00903-KQED-1536x1025.jpg 1536w, https://cdn.kqed.org/wp-content/uploads/sites/10/2025/03/20250308_BESANS-MARKET_DMB_00903-KQED-1920x1281.jpg 1920w\" sizes=\"auto, (max-width: 2000px) 100vw, 2000px\">\u003cfigcaption class=\"wp-caption-text\">Besan’s International Market in San Bruno on March 8, 2025. \u003ccite>(David M. Barreda/KQED)\u003c/cite>\u003c/figcaption>\u003c/figure>\n\u003cp>“The current administration has \u003ca href=\"https://www.nytimes.com/2026/01/14/business/food-prices-tariffs-trump.html\">a talking point that grocery prices are going down\u003c/a>. That is not true,” Volpe said. “But what \u003cem>is \u003c/em>true is that food prices are behaving largely normally right now.”\u003c/p>\n\u003cp>Regardless, because food prices have never outright dropped since then, “any increases we see now, even modest ones, are on top of the food price inflation that hit Americans so hard over the last few years,” said Volpe. “So \u003ca href=\"https://www.kqed.org/news/12036654/2025-recession-indicator-meme-us-economy\">consumer sentiment\u003c/a> is very much down on food.”\u003c/p>\n\u003cp>Let’s look at the classic — and increasingly political — example of eggs: specifically, a dozen large grade A eggs. In 2016, the average cost nationwide was $1.68, according to data provided by Volpe.\u003c/p>\n\u003cp>https://www.youtube.com/watch?v=Nl_Qyk9DSUw\u003c/p>\n\u003cp>The 2025 average was $4.41 — a 161.59% increase, meaning these types of eggs have become \u003cem>less \u003c/em>affordable for Americans over this time period.\u003c/p>\n\u003cp>An increase more in line with the consumer price index would have seen 2025 eggs costing around $2.25 on average.\u003c/p>\n\u003cp>Elsewhere in the grocery aisles, white rice went from 72 cents per pound in 2016 to $1.05 in 2025 — a 46.43% increase.\u003c/p>\n\u003cfigure id=\"attachment_12072676\" class=\"wp-caption aligncenter\" style=\"max-width: 1980px\">\u003cimg loading=\"lazy\" decoding=\"async\" class=\"wp-image-12072676 size-full\" src=\"https://cdn.kqed.org/wp-content/uploads/sites/10/2026/02/GettyImages-524459278.jpg\" alt=\"\" width=\"1980\" height=\"1320\" srcset=\"https://cdn.kqed.org/wp-content/uploads/sites/10/2026/02/GettyImages-524459278.jpg 1980w, https://cdn.kqed.org/wp-content/uploads/sites/10/2026/02/GettyImages-524459278-160x107.jpg 160w, https://cdn.kqed.org/wp-content/uploads/sites/10/2026/02/GettyImages-524459278-1536x1024.jpg 1536w\" sizes=\"auto, (max-width: 1980px) 100vw, 1980px\">\u003cfigcaption class=\"wp-caption-text\">Eggs sit in a container at Chip-In Farm in Bedford, Massachusetts, on Jan. 7, 2016. \u003ccite>(Dina Rudick/The Boston Globe via Getty Images)\u003c/cite>\u003c/figcaption>\u003c/figure>\n\u003cp>And how about a snack you’re likely to see at \u003ca href=\"https://www.kqed.org/news/12071772/where-to-watch-super-bowl-2026-san-francisco-bay-area-levis-stadium-bad-bunny-green-day-larussell-santa-clara\">a Super Bowl watch party\u003c/a>, like potato chips? In 2016, the average price for 16 ounces of chips was $4.46, according to CPI data provided by Volpe. By 2025, those chips were $6.70 — a 50.12% increase.\u003c/p>\n\u003cp>By comparison, a price more aligned with the CPI would be around $5.98. But something that might surprise you: A gallon of fresh whole milk has actually become somewhat \u003cem>more \u003c/em>affordable for Americans in this time period, relative to the U.S. dollar.\u003c/p>\n\u003cp>The 2016 average was $3.20, and the 2025 average was $4.07: a 26.97% increase, compared to the 34.14% rise in the Consumer Price Index.\u003c/p>\n\u003ch2>What about local prices here in the Bay Area?\u003c/h2>\n\u003cp>To look at more local examples here in the Bay Area, a few caveats are needed.\u003c/p>\n\u003cp>First, more localized data like this comes from different sources — meaning that because it may not match the exact timeline of the CPI increase, it won’t be an apples-to-apples comparison.\u003c/p>\n\u003cfigure id=\"attachment_11944934\" class=\"wp-caption aligncenter\" style=\"max-width: 1980px\">\u003cimg loading=\"lazy\" decoding=\"async\" class=\"size-full wp-image-11944934\" src=\"https://cdn.kqed.org/wp-content/uploads/sites/10/2023/03/AP23086788063121-scaled-e1770414780894.jpg\" alt=\"A sign at a gas station shows very high gas prices, approaching $6 a gallon. The Bay Bridge can be scene in the background.\" width=\"1980\" height=\"1319\">\u003cfigcaption class=\"wp-caption-text\">The Bay Bridge rises behind the price board of a gas station in San Francisco on July 20, 2022. \u003ccite>(Jeff Chiu/AP)\u003c/cite>\u003c/figcaption>\u003c/figure>\n\u003cp>Another thing to know: From 2016 to 2025, the Bay Area — measured as the San Francisco, Oakland and Hayward region — saw a \u003cem>slightly \u003c/em>lower increase in CPI than the national average, of 33.66% compared to that 34.14% increase nationwide.\u003c/p>\n\u003cp>But Volpe stressed that this “does not mean that costs or prices are comparable” between the Bay Area and the rest of the country. “It just means that the rate of change in prices or affordability has been \u003cem>comparable \u003c/em>between the Bay Area and the rest of the country.”\u003c/p>\n\u003cp>With that, let’s look at …\u003c/p>\n\u003cp>\u003cstrong>The price of a Golden Gate Bridge toll\u003c/strong>\u003c/p>\n\u003cp>The current \u003ca href=\"https://www.goldengate.org/bridge/tolls-payment/\">price of crossing the Golden Gate Bridge using FasTrak\u003c/a> with a car or a motorcycle, as of the most recent price increase in 2025, is $9.75. Back on \u003ca href=\"https://www.goldengate.org/bridge/history-research/statistics-data/traffic-toll-data/\">July 1, 2016\u003c/a>, the FasTrak toll price was $6.50.\u003c/p>\n\u003cfigure id=\"attachment_12072677\" class=\"wp-caption aligncenter\" style=\"max-width: 1980px\">\u003cimg loading=\"lazy\" decoding=\"async\" class=\"size-full wp-image-12072677\" src=\"https://cdn.kqed.org/wp-content/uploads/sites/10/2026/02/GettyImages-1036068114.jpg\" alt=\"\" width=\"1980\" height=\"1291\" srcset=\"https://cdn.kqed.org/wp-content/uploads/sites/10/2026/02/GettyImages-1036068114.jpg 1980w, https://cdn.kqed.org/wp-content/uploads/sites/10/2026/02/GettyImages-1036068114-160x104.jpg 160w, https://cdn.kqed.org/wp-content/uploads/sites/10/2026/02/GettyImages-1036068114-1536x1002.jpg 1536w\" sizes=\"auto, (max-width: 1980px) 100vw, 1980px\">\u003cfigcaption class=\"wp-caption-text\">A container ship under the Golden Gate Bridge. \u003ccite>(Andia/Universal Images via Getty Images)\u003c/cite>\u003c/figcaption>\u003c/figure>\n\u003cp>That’s a 50% increase, very much above the CPI increase — as a 2025 toll fare matching the CPI would be something more like $8.68.\u003c/p>\n\u003cp>\u003cstrong>The price of a BART fare\u003c/strong>\u003c/p>\n\u003cp>By now, you’re probably used to seeing \u003ca href=\"https://www.bart.gov/news/articles/2024/news20241126\">annual \u003c/a>\u003ca href=\"https://www.bart.gov/news/articles/2023/news20231211-0\">announcements \u003c/a>\u003ca href=\"https://www.bart.gov/news/articles/2022/news20220614\">from BART\u003c/a> about fare increases, with \u003ca href=\"https://www.bart.gov/news/articles/2025/news20251120\">the most recent arriving Jan. 1\u003c/a>.\u003c/p>\n\u003cp>According to BART, the agency’s \u003ca href=\"https://www.bart.gov/news/articles/2025/news20251120\">“current funding model relies on passenger fares to pay for operations”\u003c/a> (which BART also described last month as “an outdated model that is no longer feasible due to remote work.”)\u003c/p>\n\u003cp>Between 2016 and 2026, there’s been a 36% increase in the average BART fare (which, remember, encompasses more time than the CPI). In January 2016, the average fare was $3.67, with a minimum fare of $1.95 and a maximum of $15.70.\u003c/p>\n\u003cfigure id=\"attachment_12044953\" class=\"wp-caption aligncenter\" style=\"max-width: 2000px\">\u003cimg loading=\"lazy\" decoding=\"async\" class=\"size-full wp-image-12044953\" src=\"https://cdn.kqed.org/wp-content/uploads/sites/10/2025/06/20241204-BART-JY-009_qed.jpg\" alt=\"\" width=\"2000\" height=\"1333\" srcset=\"https://cdn.kqed.org/wp-content/uploads/sites/10/2025/06/20241204-BART-JY-009_qed.jpg 2000w, https://cdn.kqed.org/wp-content/uploads/sites/10/2025/06/20241204-BART-JY-009_qed-160x107.jpg 160w, https://cdn.kqed.org/wp-content/uploads/sites/10/2025/06/20241204-BART-JY-009_qed-1536x1024.jpg 1536w\" sizes=\"auto, (max-width: 2000px) 100vw, 2000px\">\u003cfigcaption class=\"wp-caption-text\">Passengers wait to board BART at Daly City Station in Daly City, on Dec. 4, 2024. \u003ccite>(Juliana Yamada/KQED)\u003c/cite>\u003c/figcaption>\u003c/figure>\n\u003cp>The \u003ca href=\"https://www.kqed.org/news/12040951/bart-raise-fares-again-deficit-looms\">current average fare\u003c/a> in 2026 has officially been updated to $4.98, according to a BART spokesperson in an email to KQED. This makes the latest price range of a journey on BART between $2.55 and $17.25.\u003c/p>\n\u003cp>As an aside, remember that in 2016, we had physical BART tickets made of paper, which were \u003ca href=\"https://www.bart.gov/news/articles/2023/news20230911\">phased out in late 2023\u003c/a>.\u003c/p>\n\u003cp>\u003cstrong>The average rent in the Bay Area\u003c/strong>\u003c/p>\n\u003cp>This is a thornier example, since housing markets are more granular, and rental data has always been \u003ca href=\"https://www.sfchronicle.com/bayarea/article/The-S-F-Chronicle-s-guide-to-Bay-Area-housing-16441648.php\">somewhat tricky to get ahold of\u003c/a>. But you can’t talk about Bay Area prices without getting into rent, right?\u003c/p>\n\u003cp>For the purposes of our task, we’ll be referring to real-estate website Zillow’s metric called the \u003ca href=\"https://www.zillow.com/research/methodology-zori-repeat-rent-27092/\">“Zillow Observed Rent Index”\u003c/a> — which a Zillow spokesperson told KQED is used by the company to assess “typical rent.”\u003c/p>\n\u003cfigure id=\"attachment_12072679\" class=\"wp-caption aligncenter\" style=\"max-width: 1980px\">\u003cimg loading=\"lazy\" decoding=\"async\" class=\"size-full wp-image-12072679\" src=\"https://cdn.kqed.org/wp-content/uploads/sites/10/2026/02/GettyImages-600766444.jpg\" alt=\"\" width=\"1980\" height=\"1320\" srcset=\"https://cdn.kqed.org/wp-content/uploads/sites/10/2026/02/GettyImages-600766444.jpg 1980w, https://cdn.kqed.org/wp-content/uploads/sites/10/2026/02/GettyImages-600766444-160x107.jpg 160w, https://cdn.kqed.org/wp-content/uploads/sites/10/2026/02/GettyImages-600766444-1536x1024.jpg 1536w\" sizes=\"auto, (max-width: 1980px) 100vw, 1980px\">\u003cfigcaption class=\"wp-caption-text\">Three Victorian homes in a row on a steep hill on Fillmore Street in San Francisco, California, on Aug. 28, 2016. \u003ccite>(Photo via Smith Collection/Getty Images)\u003c/cite>\u003c/figcaption>\u003c/figure>\n\u003cp>Rather than reflecting a home’s number of beds or baths, this metric instead “looks at all available rentals, narrows into the middle third, then takes the average of just those units,” according to the spokesperson.\u003c/p>\n\u003cp>Zillow’s most recently available data is from a few months ago, for December 2025 — so let’s compare our rents with December 2015 this time. In 2025, in Santa Clara, where the Super Bowl will take place on Sunday, the typical rent was $3,578. Ten years ago, that number was $2,745: a rise of just over 30%.\u003c/p>\n\u003cp>But in San Francisco, a different picture emerges. According to Zillow’s metric, the typical rent in San Francisco in December 2025 was $3,666 — and in December 2015, it was $3,190.[aside postID=news_12071211 hero='https://cdn.kqed.org/wp-content/uploads/sites/10/2026/01/013026_SUPERBOWLECONOMICDEV_GH_010_QED-KQED.jpg']This 10-year rise of just under 15% might strike you as lower than you’d expect.\u003c/p>\n\u003cp>Alex Lacter, a spokesperson for Zillow, told KQED that among the U.S.’s biggest 50 cities, the city’s growth in rent has actually “been by far the lowest over that period” — with the next lowest being Washington, D.C’s rent, at just under 26%. By comparison, he said, Fresno’s rents went up 90% in the same period.\u003c/p>\n\u003cp>But for context, it’s important to remember how rent “\u003ca href=\"https://www.zillow.com/research/2020-urban-suburban-report-28802/\">fell significantly \u003c/a>in urban areas of San Francisco” during the COVID-19 pandemic, said Lacter, which put the city “behind many other markets when it comes to rent growth over this 10-year period.”\u003c/p>\n\u003cp>Ted Egan, chief economist with San Francisco’s Office of Economic Analysis, echoed this take: “Because of economic changes that happened to the city during COVID, housing is actually cheaper than it was 10 years ago,” he said.\u003c/p>\n\u003cp>Plus, in a city as expensive as San Francisco, “there’s only so high [rents] can climb where enough people can still afford them to keep units filled,” speculated Lacter.\u003c/p>\n\u003ch2>The cost of season tickets for a 49ers game\u003c/h2>\n\u003cp>The fact that Levi’s Stadium has changed the way it structures its seating since the last time it hosted a Super Bowl — almost tripling the number of pricing tiers on sale — makes this one slightly trickier to find an apples-to-apples ticket comparison, said Keith Pagello, \u003ca href=\"https://www.ticketdata.com/super-bowl-ticket-prices\">founder of TicketData\u003c/a>.\u003c/p>\n\u003cp>During the 2015-16 season, there were only 11 pricing tiers at Levi’s — but now the stadium is broken into 30 tiers.\u003c/p>\n\u003cfigure id=\"attachment_12072682\" class=\"wp-caption aligncenter\" style=\"max-width: 1980px\">\u003cimg loading=\"lazy\" decoding=\"async\" class=\"wp-image-12072682 size-full\" src=\"https://cdn.kqed.org/wp-content/uploads/sites/10/2026/02/GettyImages-508989690.jpg\" alt=\"\" width=\"1980\" height=\"1320\" srcset=\"https://cdn.kqed.org/wp-content/uploads/sites/10/2026/02/GettyImages-508989690.jpg 1980w, https://cdn.kqed.org/wp-content/uploads/sites/10/2026/02/GettyImages-508989690-160x107.jpg 160w, https://cdn.kqed.org/wp-content/uploads/sites/10/2026/02/GettyImages-508989690-1536x1024.jpg 1536w\" sizes=\"auto, (max-width: 1980px) 100vw, 1980px\">\u003cfigcaption class=\"wp-caption-text\">Super Bowl 50 at Levi’s Stadium on Feb. 7, 2016, in Santa Clara, California. \u003ccite>(Ezra Shaw via Getty Images)\u003c/cite>\u003c/figcaption>\u003c/figure>\n\u003cp>However, even with that in mind, “the overall increase is still very clear,” said Pagello. For example, according to \u003ca href=\"https://levisstadium.com/seats-pricing/\">a 2026 ticketing season map\u003c/a>, Section 101’s first 10 rows are priced at $315. The same section during the 2015-16 season was $125 — a 152% increase.\u003c/p>\n\u003cp>“Quite a jump!” Pagello said.\u003c/p>\n\u003cp>[ad floatright]\u003c/p>\n",
"blocks": [],
"excerpt": "2016 was the last time the Bay Area hosted the Super Bowl. How much more expensive have things gotten since then?",
"status": "publish",
"parent": 0,
"modified": 1770657918,
"stats": {
"hasAudio": false,
"hasVideo": true,
"hasChartOrMap": false,
"iframeSrcs": [],
"hasGoogleForm": false,
"hasGallery": false,
"hasHearkenModule": false,
"hasPolis": false,
"paragraphCount": 54,
"wordCount": 2088
},
"headData": {
"title": "A Decade on, the Bay Area Is Hosting Another Super Bowl. How Have Prices Changed Since 2016? | KQED",
"description": "2016 was the last time the Bay Area hosted the Super Bowl. How much more expensive have things gotten since then?",
"ogTitle": "",
"ogDescription": "",
"ogImgId": "",
"twTitle": "",
"twDescription": "",
"twImgId": "",
"schema": {
"@context": "https://schema.org",
"@type": "NewsArticle",
"headline": "A Decade on, the Bay Area Is Hosting Another Super Bowl. How Have Prices Changed Since 2016?",
"datePublished": "2026-02-07T04:00:52-08:00",
"dateModified": "2026-02-09T09:25:18-08:00",
"image": "https://cdn.kqed.org/wp-content/uploads/2020/02/KQED-OG-Image@1x.png",
"isAccessibleForFree": "True",
"publisher": {
"@type": "NewsMediaOrganization",
"@id": "https://www.kqed.org/#organization",
"name": "KQED",
"logo": "https://cdn.kqed.org/wp-content/uploads/2020/02/KQED-OG-Image@1x.png",
"url": "https://www.kqed.org",
"sameAs": [
"https://www.facebook.com/KQED",
"https://twitter.com/KQED",
"https://www.instagram.com/kqed/",
"https://www.tiktok.com/@kqedofficial",
"https://www.linkedin.com/company/kqed",
"https://www.youtube.com/channel/UCeC0IOo7i1P_61zVUWbJ4nw"
]
},
"author": {
"@type": "Person",
"name": "Nisa Khan",
"jobTitle": "KQED Contributor",
"url": "https://www.kqed.org/author/nkhan"
}
},
"authorsData": [],
"tagData": []
},
"primaryCategory": {
"termId": 34168,
"slug": "guides-and-explainers",
"name": "Guides and Explainers"
},
"sticky": false,
"nprStoryId": "kqed-12072629",
"templateType": "standard",
"featuredImageType": "standard",
"excludeFromSiteSearch": "Include",
"articleAge": "0",
"path": "/news/12072629/a-decade-on-the-bay-area-is-hosting-another-super-bowl-how-have-prices-changed-since-2016",
"audioTrackLength": null,
"parsedContent": [
{
"type": "contentString",
"content": "\u003cdiv class=\"post-body\">\u003cp>\u003cp>Alongside \u003cem>Heated Rivalry\u003c/em> rewatches and furious posts about \u003ca href=\"https://www.rollingstone.com/culture/culture-features/harry-styles-tour-blood-tickets-1235505811/\">the price of Harry Styles tickets\u003c/a>, you may have noticed a nostalgic \u003ca href=\"https://www.npr.org/2026/01/16/nx-s1-5680084/why-reliving-2016-is-the-new-social-media-trend\">“me in 2016” micro-trend\u003c/a> while scrolling social media in the last few weeks.\u003c/p>\n\u003cp>From your friends’ \u003ca href=\"https://www.thecut.com/article/what-do-we-really-miss-about-2016-photos.html\">VSCO-filtered throwback photos\u003c/a> featuring leggings and black mesh tops to \u003ca href=\"https://www.teenvogue.com/story/best-evil-kermit-memes\">“evil Kermit” memes\u003c/a> and Vine compilations, many of our feeds were briefly overtaken by odes to a so-called simpler time a decade ago (This reporter remains baffled by the longing: This was the year Carrie Fisher died, after all).\u003c/p>\n\u003cp>2016 was also the year the Bay Area \u003cem>last \u003c/em>hosted a \u003ca href=\"https://www.nfl.com/photos/super-bowl-50-0ap3000000633830#f7085554-9f49-43cf-b017-aba23ab28a01\">Super Bowl\u003c/a>, which saw the Denver Broncos beat the Carolina Panthers and Coldplay as the halftime show with Beyoncé and Bruno Mars.\u003c/p>\n\u003cp>\u003c/p>\u003c/div>",
"attributes": {
"named": {},
"numeric": []
}
},
{
"type": "component",
"content": "",
"name": "ad",
"attributes": {
"named": {
"label": "fullwidth"
},
"numeric": [
"fullwidth"
]
}
},
{
"type": "contentString",
"content": "\u003cdiv class=\"post-body\">\u003cp>\u003c/p>\n\u003cp>This Sunday, the NFL’s biggest game is returning to our region once again with Super Bowl LX at Santa Clara’s Levi’s Stadium, featuring the Seattle Seahawks, the New England Patriots and \u003ca href=\"https://www.kqed.org/arts/13986280/bad-bunny-bay-area-imoact-sol-food-mural-pinatas-super-bowl-mission-district\">a halftime show by Bad Bunny\u003c/a>.\u003c/p>\n\u003cp>With the universe seemingly insisting in this moment on us casting our minds back a decade earlier, there’s one aspect that’s hard to ignore: the affordability crisis that’s \u003ca href=\"https://www.kqed.org/affordability\">hit the Bay Area particularly hard\u003c/a>, and just how much prices have risen since 2016.\u003c/p>\u003c/p>\u003c/div>",
"attributes": {
"named": {},
"numeric": []
}
},
{
"type": "component",
"content": "",
"name": "singleTwitterStatus",
"attributes": {
"named": {
"id": "2015670842106003680"
},
"numeric": []
}
},
{
"type": "contentString",
"content": "\u003cdiv class=\"post-body\">\u003cp>\n\u003cp>But how simple \u003cem>is \u003c/em>it to compare how much cheaper — or not — everyday items were back then, and how much prices have actually changed?\u003c/p>\n\u003cp>In the spirit of \u003ca href=\"https://en.wikipedia.org/wiki/2026_is_the_new_2016\">2026 being the new 2016\u003c/a>, let’s take a deep dive.\u003c/p>\n\u003ch2>First off, what’s the best way to look at changing prices over the years?\u003c/h2>\n\u003cp>To get an accurate impression of whether something has become more expensive, beyond the changing numbers, it’s important to account for inflation.\u003c/p>\n\u003cp>And according to Ricky Volpe, professor of Agribusiness at California Polytechnic State University, this makes the \u003ca href=\"https://www.irp.wisc.edu/resources/what-is-the-consumer-price-index-and-how-is-it-used/\">Consumer Price Index\u003c/a> (CPI) — which measures price changes over time and serves as a key indicator of inflation — a good baseline for assessing increases.\u003c/p>\n\u003cfigure id=\"attachment_12067357\" class=\"wp-caption aligncenter\" style=\"max-width: 2000px\">\u003cimg loading=\"lazy\" decoding=\"async\" class=\"size-full wp-image-12067357\" src=\"https://cdn.kqed.org/wp-content/uploads/sites/10/2025/12/251113-SNAPDELAYSFEATURE01284_TV-KQED_1.jpg\" alt=\"\" width=\"2000\" height=\"1333\" srcset=\"https://cdn.kqed.org/wp-content/uploads/sites/10/2025/12/251113-SNAPDELAYSFEATURE01284_TV-KQED_1.jpg 2000w, https://cdn.kqed.org/wp-content/uploads/sites/10/2025/12/251113-SNAPDELAYSFEATURE01284_TV-KQED_1-160x107.jpg 160w, https://cdn.kqed.org/wp-content/uploads/sites/10/2025/12/251113-SNAPDELAYSFEATURE01284_TV-KQED_1-1536x1024.jpg 1536w\" sizes=\"auto, (max-width: 2000px) 100vw, 2000px\">\u003cfigcaption class=\"wp-caption-text\">A commuter holds her groceries from the Alameda Food Bank at the 12th Street BART Station in Oakland on Nov. 14, 2025. \u003ccite>(Tâm Vũ/KQED)\u003c/cite>\u003c/figcaption>\u003c/figure>\n\u003cp>“All Items” is \u003ca href=\"https://fred.stlouisfed.org/series/CPIAUCSL\">an index category\u003c/a> that encompasses a huge variety of U.S. consumer spending, from groceries to education to entertainment — and CPI “is grounded in the value of the U.S. Dollar,” said Volpe. “And that can serve as a benchmark for saying, ‘Okay, this is what’s been going on economy-wide.’”\u003c/p>\n\u003cp>From 2016 to 2025 (the most recent year for which data is available), the CPI has gone up 34.14%, said Volpe.\u003c/p>\n\u003cp>Meaning that relative to the value of the dollar, “anything that’s gone up faster than that has become less affordable,” he said.\u003c/p>\n\u003ch2>\u003cstrong>What about the price of groceries?\u003c/strong>\u003c/h2>\n\u003cp>“The last 10 years encapsulate quite a roller coaster ride in food prices in the US,” Volpe said.\u003c/p>\n\u003cp>In 2016, food prices actually \u003cem>decreased \u003c/em>— something “we do not see that often in the U.S.,” he said. “Inflation is the name of the game.”\u003c/p>\n\u003cp>After 2016, food prices “started to tip up,” said Volpe — and then came COVID-19. The pandemic ushered in record food price inflation in 2021 and 2022, which remains top of mind for many U.S. consumers, he said.\u003c/p>\n\u003cfigure id=\"attachment_12030659\" class=\"wp-caption aligncenter\" style=\"max-width: 2000px\">\u003cimg loading=\"lazy\" decoding=\"async\" class=\"wp-image-12030659 size-full\" src=\"https://cdn.kqed.org/wp-content/uploads/sites/10/2025/03/20250308_BESANS-MARKET_DMB_00903-KQED.jpg\" alt=\"\" width=\"2000\" height=\"1334\" srcset=\"https://cdn.kqed.org/wp-content/uploads/sites/10/2025/03/20250308_BESANS-MARKET_DMB_00903-KQED.jpg 2000w, https://cdn.kqed.org/wp-content/uploads/sites/10/2025/03/20250308_BESANS-MARKET_DMB_00903-KQED-800x534.jpg 800w, https://cdn.kqed.org/wp-content/uploads/sites/10/2025/03/20250308_BESANS-MARKET_DMB_00903-KQED-1020x680.jpg 1020w, https://cdn.kqed.org/wp-content/uploads/sites/10/2025/03/20250308_BESANS-MARKET_DMB_00903-KQED-160x107.jpg 160w, https://cdn.kqed.org/wp-content/uploads/sites/10/2025/03/20250308_BESANS-MARKET_DMB_00903-KQED-1536x1025.jpg 1536w, https://cdn.kqed.org/wp-content/uploads/sites/10/2025/03/20250308_BESANS-MARKET_DMB_00903-KQED-1920x1281.jpg 1920w\" sizes=\"auto, (max-width: 2000px) 100vw, 2000px\">\u003cfigcaption class=\"wp-caption-text\">Besan’s International Market in San Bruno on March 8, 2025. \u003ccite>(David M. Barreda/KQED)\u003c/cite>\u003c/figcaption>\u003c/figure>\n\u003cp>“The current administration has \u003ca href=\"https://www.nytimes.com/2026/01/14/business/food-prices-tariffs-trump.html\">a talking point that grocery prices are going down\u003c/a>. That is not true,” Volpe said. “But what \u003cem>is \u003c/em>true is that food prices are behaving largely normally right now.”\u003c/p>\n\u003cp>Regardless, because food prices have never outright dropped since then, “any increases we see now, even modest ones, are on top of the food price inflation that hit Americans so hard over the last few years,” said Volpe. “So \u003ca href=\"https://www.kqed.org/news/12036654/2025-recession-indicator-meme-us-economy\">consumer sentiment\u003c/a> is very much down on food.”\u003c/p>\n\u003cp>Let’s look at the classic — and increasingly political — example of eggs: specifically, a dozen large grade A eggs. In 2016, the average cost nationwide was $1.68, according to data provided by Volpe.\u003c/p>\u003c/p>\u003cp>\u003cspan class='utils-parseShortcode-shortcodes-__youtubeShortcode__embedYoutube'>\n \u003cspan class='utils-parseShortcode-shortcodes-__youtubeShortcode__embedYoutubeInside'>\n \u003ciframe\n loading='lazy'\n class='utils-parseShortcode-shortcodes-__youtubeShortcode__youtubePlayer'\n type='text/html'\n src='//www.youtube.com/embed/Nl_Qyk9DSUw'\n title='//www.youtube.com/embed/Nl_Qyk9DSUw'\n allowfullscreen='true'\n style='border:0;'>\u003c/iframe>\n \u003c/span>\n \u003c/span>\u003c/p>\u003cp>\u003cp>The 2025 average was $4.41 — a 161.59% increase, meaning these types of eggs have become \u003cem>less \u003c/em>affordable for Americans over this time period.\u003c/p>\n\u003cp>An increase more in line with the consumer price index would have seen 2025 eggs costing around $2.25 on average.\u003c/p>\n\u003cp>Elsewhere in the grocery aisles, white rice went from 72 cents per pound in 2016 to $1.05 in 2025 — a 46.43% increase.\u003c/p>\n\u003cfigure id=\"attachment_12072676\" class=\"wp-caption aligncenter\" style=\"max-width: 1980px\">\u003cimg loading=\"lazy\" decoding=\"async\" class=\"wp-image-12072676 size-full\" src=\"https://cdn.kqed.org/wp-content/uploads/sites/10/2026/02/GettyImages-524459278.jpg\" alt=\"\" width=\"1980\" height=\"1320\" srcset=\"https://cdn.kqed.org/wp-content/uploads/sites/10/2026/02/GettyImages-524459278.jpg 1980w, https://cdn.kqed.org/wp-content/uploads/sites/10/2026/02/GettyImages-524459278-160x107.jpg 160w, https://cdn.kqed.org/wp-content/uploads/sites/10/2026/02/GettyImages-524459278-1536x1024.jpg 1536w\" sizes=\"auto, (max-width: 1980px) 100vw, 1980px\">\u003cfigcaption class=\"wp-caption-text\">Eggs sit in a container at Chip-In Farm in Bedford, Massachusetts, on Jan. 7, 2016. \u003ccite>(Dina Rudick/The Boston Globe via Getty Images)\u003c/cite>\u003c/figcaption>\u003c/figure>\n\u003cp>And how about a snack you’re likely to see at \u003ca href=\"https://www.kqed.org/news/12071772/where-to-watch-super-bowl-2026-san-francisco-bay-area-levis-stadium-bad-bunny-green-day-larussell-santa-clara\">a Super Bowl watch party\u003c/a>, like potato chips? In 2016, the average price for 16 ounces of chips was $4.46, according to CPI data provided by Volpe. By 2025, those chips were $6.70 — a 50.12% increase.\u003c/p>\n\u003cp>By comparison, a price more aligned with the CPI would be around $5.98. But something that might surprise you: A gallon of fresh whole milk has actually become somewhat \u003cem>more \u003c/em>affordable for Americans in this time period, relative to the U.S. dollar.\u003c/p>\n\u003cp>The 2016 average was $3.20, and the 2025 average was $4.07: a 26.97% increase, compared to the 34.14% rise in the Consumer Price Index.\u003c/p>\n\u003ch2>What about local prices here in the Bay Area?\u003c/h2>\n\u003cp>To look at more local examples here in the Bay Area, a few caveats are needed.\u003c/p>\n\u003cp>First, more localized data like this comes from different sources — meaning that because it may not match the exact timeline of the CPI increase, it won’t be an apples-to-apples comparison.\u003c/p>\n\u003cfigure id=\"attachment_11944934\" class=\"wp-caption aligncenter\" style=\"max-width: 1980px\">\u003cimg loading=\"lazy\" decoding=\"async\" class=\"size-full wp-image-11944934\" src=\"https://cdn.kqed.org/wp-content/uploads/sites/10/2023/03/AP23086788063121-scaled-e1770414780894.jpg\" alt=\"A sign at a gas station shows very high gas prices, approaching $6 a gallon. The Bay Bridge can be scene in the background.\" width=\"1980\" height=\"1319\">\u003cfigcaption class=\"wp-caption-text\">The Bay Bridge rises behind the price board of a gas station in San Francisco on July 20, 2022. \u003ccite>(Jeff Chiu/AP)\u003c/cite>\u003c/figcaption>\u003c/figure>\n\u003cp>Another thing to know: From 2016 to 2025, the Bay Area — measured as the San Francisco, Oakland and Hayward region — saw a \u003cem>slightly \u003c/em>lower increase in CPI than the national average, of 33.66% compared to that 34.14% increase nationwide.\u003c/p>\n\u003cp>But Volpe stressed that this “does not mean that costs or prices are comparable” between the Bay Area and the rest of the country. “It just means that the rate of change in prices or affordability has been \u003cem>comparable \u003c/em>between the Bay Area and the rest of the country.”\u003c/p>\n\u003cp>With that, let’s look at …\u003c/p>\n\u003cp>\u003cstrong>The price of a Golden Gate Bridge toll\u003c/strong>\u003c/p>\n\u003cp>The current \u003ca href=\"https://www.goldengate.org/bridge/tolls-payment/\">price of crossing the Golden Gate Bridge using FasTrak\u003c/a> with a car or a motorcycle, as of the most recent price increase in 2025, is $9.75. Back on \u003ca href=\"https://www.goldengate.org/bridge/history-research/statistics-data/traffic-toll-data/\">July 1, 2016\u003c/a>, the FasTrak toll price was $6.50.\u003c/p>\n\u003cfigure id=\"attachment_12072677\" class=\"wp-caption aligncenter\" style=\"max-width: 1980px\">\u003cimg loading=\"lazy\" decoding=\"async\" class=\"size-full wp-image-12072677\" src=\"https://cdn.kqed.org/wp-content/uploads/sites/10/2026/02/GettyImages-1036068114.jpg\" alt=\"\" width=\"1980\" height=\"1291\" srcset=\"https://cdn.kqed.org/wp-content/uploads/sites/10/2026/02/GettyImages-1036068114.jpg 1980w, https://cdn.kqed.org/wp-content/uploads/sites/10/2026/02/GettyImages-1036068114-160x104.jpg 160w, https://cdn.kqed.org/wp-content/uploads/sites/10/2026/02/GettyImages-1036068114-1536x1002.jpg 1536w\" sizes=\"auto, (max-width: 1980px) 100vw, 1980px\">\u003cfigcaption class=\"wp-caption-text\">A container ship under the Golden Gate Bridge. \u003ccite>(Andia/Universal Images via Getty Images)\u003c/cite>\u003c/figcaption>\u003c/figure>\n\u003cp>That’s a 50% increase, very much above the CPI increase — as a 2025 toll fare matching the CPI would be something more like $8.68.\u003c/p>\n\u003cp>\u003cstrong>The price of a BART fare\u003c/strong>\u003c/p>\n\u003cp>By now, you’re probably used to seeing \u003ca href=\"https://www.bart.gov/news/articles/2024/news20241126\">annual \u003c/a>\u003ca href=\"https://www.bart.gov/news/articles/2023/news20231211-0\">announcements \u003c/a>\u003ca href=\"https://www.bart.gov/news/articles/2022/news20220614\">from BART\u003c/a> about fare increases, with \u003ca href=\"https://www.bart.gov/news/articles/2025/news20251120\">the most recent arriving Jan. 1\u003c/a>.\u003c/p>\n\u003cp>According to BART, the agency’s \u003ca href=\"https://www.bart.gov/news/articles/2025/news20251120\">“current funding model relies on passenger fares to pay for operations”\u003c/a> (which BART also described last month as “an outdated model that is no longer feasible due to remote work.”)\u003c/p>\n\u003cp>Between 2016 and 2026, there’s been a 36% increase in the average BART fare (which, remember, encompasses more time than the CPI). In January 2016, the average fare was $3.67, with a minimum fare of $1.95 and a maximum of $15.70.\u003c/p>\n\u003cfigure id=\"attachment_12044953\" class=\"wp-caption aligncenter\" style=\"max-width: 2000px\">\u003cimg loading=\"lazy\" decoding=\"async\" class=\"size-full wp-image-12044953\" src=\"https://cdn.kqed.org/wp-content/uploads/sites/10/2025/06/20241204-BART-JY-009_qed.jpg\" alt=\"\" width=\"2000\" height=\"1333\" srcset=\"https://cdn.kqed.org/wp-content/uploads/sites/10/2025/06/20241204-BART-JY-009_qed.jpg 2000w, https://cdn.kqed.org/wp-content/uploads/sites/10/2025/06/20241204-BART-JY-009_qed-160x107.jpg 160w, https://cdn.kqed.org/wp-content/uploads/sites/10/2025/06/20241204-BART-JY-009_qed-1536x1024.jpg 1536w\" sizes=\"auto, (max-width: 2000px) 100vw, 2000px\">\u003cfigcaption class=\"wp-caption-text\">Passengers wait to board BART at Daly City Station in Daly City, on Dec. 4, 2024. \u003ccite>(Juliana Yamada/KQED)\u003c/cite>\u003c/figcaption>\u003c/figure>\n\u003cp>The \u003ca href=\"https://www.kqed.org/news/12040951/bart-raise-fares-again-deficit-looms\">current average fare\u003c/a> in 2026 has officially been updated to $4.98, according to a BART spokesperson in an email to KQED. This makes the latest price range of a journey on BART between $2.55 and $17.25.\u003c/p>\n\u003cp>As an aside, remember that in 2016, we had physical BART tickets made of paper, which were \u003ca href=\"https://www.bart.gov/news/articles/2023/news20230911\">phased out in late 2023\u003c/a>.\u003c/p>\n\u003cp>\u003cstrong>The average rent in the Bay Area\u003c/strong>\u003c/p>\n\u003cp>This is a thornier example, since housing markets are more granular, and rental data has always been \u003ca href=\"https://www.sfchronicle.com/bayarea/article/The-S-F-Chronicle-s-guide-to-Bay-Area-housing-16441648.php\">somewhat tricky to get ahold of\u003c/a>. But you can’t talk about Bay Area prices without getting into rent, right?\u003c/p>\n\u003cp>For the purposes of our task, we’ll be referring to real-estate website Zillow’s metric called the \u003ca href=\"https://www.zillow.com/research/methodology-zori-repeat-rent-27092/\">“Zillow Observed Rent Index”\u003c/a> — which a Zillow spokesperson told KQED is used by the company to assess “typical rent.”\u003c/p>\n\u003cfigure id=\"attachment_12072679\" class=\"wp-caption aligncenter\" style=\"max-width: 1980px\">\u003cimg loading=\"lazy\" decoding=\"async\" class=\"size-full wp-image-12072679\" src=\"https://cdn.kqed.org/wp-content/uploads/sites/10/2026/02/GettyImages-600766444.jpg\" alt=\"\" width=\"1980\" height=\"1320\" srcset=\"https://cdn.kqed.org/wp-content/uploads/sites/10/2026/02/GettyImages-600766444.jpg 1980w, https://cdn.kqed.org/wp-content/uploads/sites/10/2026/02/GettyImages-600766444-160x107.jpg 160w, https://cdn.kqed.org/wp-content/uploads/sites/10/2026/02/GettyImages-600766444-1536x1024.jpg 1536w\" sizes=\"auto, (max-width: 1980px) 100vw, 1980px\">\u003cfigcaption class=\"wp-caption-text\">Three Victorian homes in a row on a steep hill on Fillmore Street in San Francisco, California, on Aug. 28, 2016. \u003ccite>(Photo via Smith Collection/Getty Images)\u003c/cite>\u003c/figcaption>\u003c/figure>\n\u003cp>Rather than reflecting a home’s number of beds or baths, this metric instead “looks at all available rentals, narrows into the middle third, then takes the average of just those units,” according to the spokesperson.\u003c/p>\n\u003cp>Zillow’s most recently available data is from a few months ago, for December 2025 — so let’s compare our rents with December 2015 this time. In 2025, in Santa Clara, where the Super Bowl will take place on Sunday, the typical rent was $3,578. Ten years ago, that number was $2,745: a rise of just over 30%.\u003c/p>\n\u003cp>But in San Francisco, a different picture emerges. According to Zillow’s metric, the typical rent in San Francisco in December 2025 was $3,666 — and in December 2015, it was $3,190.\u003c/p>\u003c/div>",
"attributes": {
"named": {},
"numeric": []
}
},
{
"type": "component",
"content": "",
"name": "aside",
"attributes": {
"named": {
"postid": "news_12071211",
"hero": "https://cdn.kqed.org/wp-content/uploads/sites/10/2026/01/013026_SUPERBOWLECONOMICDEV_GH_010_QED-KQED.jpg",
"label": ""
},
"numeric": []
}
},
{
"type": "contentString",
"content": "\u003cdiv class=\"post-body\">\u003cp>This 10-year rise of just under 15% might strike you as lower than you’d expect.\u003c/p>\n\u003cp>Alex Lacter, a spokesperson for Zillow, told KQED that among the U.S.’s biggest 50 cities, the city’s growth in rent has actually “been by far the lowest over that period” — with the next lowest being Washington, D.C’s rent, at just under 26%. By comparison, he said, Fresno’s rents went up 90% in the same period.\u003c/p>\n\u003cp>But for context, it’s important to remember how rent “\u003ca href=\"https://www.zillow.com/research/2020-urban-suburban-report-28802/\">fell significantly \u003c/a>in urban areas of San Francisco” during the COVID-19 pandemic, said Lacter, which put the city “behind many other markets when it comes to rent growth over this 10-year period.”\u003c/p>\n\u003cp>Ted Egan, chief economist with San Francisco’s Office of Economic Analysis, echoed this take: “Because of economic changes that happened to the city during COVID, housing is actually cheaper than it was 10 years ago,” he said.\u003c/p>\n\u003cp>Plus, in a city as expensive as San Francisco, “there’s only so high [rents] can climb where enough people can still afford them to keep units filled,” speculated Lacter.\u003c/p>\n\u003ch2>The cost of season tickets for a 49ers game\u003c/h2>\n\u003cp>The fact that Levi’s Stadium has changed the way it structures its seating since the last time it hosted a Super Bowl — almost tripling the number of pricing tiers on sale — makes this one slightly trickier to find an apples-to-apples ticket comparison, said Keith Pagello, \u003ca href=\"https://www.ticketdata.com/super-bowl-ticket-prices\">founder of TicketData\u003c/a>.\u003c/p>\n\u003cp>During the 2015-16 season, there were only 11 pricing tiers at Levi’s — but now the stadium is broken into 30 tiers.\u003c/p>\n\u003cfigure id=\"attachment_12072682\" class=\"wp-caption aligncenter\" style=\"max-width: 1980px\">\u003cimg loading=\"lazy\" decoding=\"async\" class=\"wp-image-12072682 size-full\" src=\"https://cdn.kqed.org/wp-content/uploads/sites/10/2026/02/GettyImages-508989690.jpg\" alt=\"\" width=\"1980\" height=\"1320\" srcset=\"https://cdn.kqed.org/wp-content/uploads/sites/10/2026/02/GettyImages-508989690.jpg 1980w, https://cdn.kqed.org/wp-content/uploads/sites/10/2026/02/GettyImages-508989690-160x107.jpg 160w, https://cdn.kqed.org/wp-content/uploads/sites/10/2026/02/GettyImages-508989690-1536x1024.jpg 1536w\" sizes=\"auto, (max-width: 1980px) 100vw, 1980px\">\u003cfigcaption class=\"wp-caption-text\">Super Bowl 50 at Levi’s Stadium on Feb. 7, 2016, in Santa Clara, California. \u003ccite>(Ezra Shaw via Getty Images)\u003c/cite>\u003c/figcaption>\u003c/figure>\n\u003cp>However, even with that in mind, “the overall increase is still very clear,” said Pagello. For example, according to \u003ca href=\"https://levisstadium.com/seats-pricing/\">a 2026 ticketing season map\u003c/a>, Section 101’s first 10 rows are priced at $315. The same section during the 2015-16 season was $125 — a 152% increase.\u003c/p>\n\u003cp>“Quite a jump!” Pagello said.\u003c/p>\n\u003cp>\u003c/p>\u003c/div>",
"attributes": {
"named": {},
"numeric": []
}
},
{
"type": "component",
"content": "",
"name": "ad",
"attributes": {
"named": {
"label": "floatright"
},
"numeric": [
"floatright"
]
}
},
{
"type": "contentString",
"content": "\u003cdiv class=\"post-body\">\u003cp>\u003c/p>\n\u003c/div>\u003c/p>",
"attributes": {
"named": {},
"numeric": []
}
}
],
"link": "/news/12072629/a-decade-on-the-bay-area-is-hosting-another-super-bowl-how-have-prices-changed-since-2016",
"authors": [
"11867"
],
"categories": [
"news_1758",
"news_34168",
"news_8",
"news_10"
],
"tags": [
"news_32707",
"news_269",
"news_1386",
"news_3651",
"news_18545",
"news_35888",
"news_27626",
"news_38",
"news_783"
],
"featImg": "news_12072674",
"label": "news",
"isLoading": false,
"hasAllInfo": true
}
},
"podcastsReducer": {
"isFetching": false,
"fetchFailed": false,
"hasFetched": false,
"podcasts": {}
},
"radioProgramsReducer": {
"isFetching": false,
"fetchFailed": false,
"hasFetched": false,
"radioPrograms": {}
},
"programsReducer": {
"all-things-considered": {
"id": "all-things-considered",
"title": "All Things Considered",
"info": "Every weekday, \u003cem>All Things Considered\u003c/em> hosts Robert Siegel, Audie Cornish, Ari Shapiro, and Kelly McEvers present the program's trademark mix of news, interviews, commentaries, reviews, and offbeat features. Michel Martin hosts on the weekends.",
"airtime": "MON-FRI 1pm-2pm, 4:30pm-6:30pm\u003cbr />SAT-SUN 5pm-6pm",
"imageSrc": "https://cdn.kqed.org/wp-content/uploads/2024/04/All-Things-Considered-Podcast-Tile-360x360-1.jpg",
"officialWebsiteLink": "https://www.npr.org/programs/all-things-considered/",
"meta": {
"site": "news",
"source": "npr"
},
"link": "/radio/program/all-things-considered"
},
"american-suburb-podcast": {
"id": "american-suburb-podcast",
"title": "American Suburb: The Podcast",
"tagline": "The flip side of gentrification, told through one town",
"info": "Gentrification is changing cities across America, forcing people from neighborhoods they have long called home. Call them the displaced. Now those priced out of the Bay Area are looking for a better life in an unlikely place. American Suburb follows this migration to one California town along the Delta, 45 miles from San Francisco. But is this once sleepy suburb ready for them?",
"imageSrc": "https://cdn.kqed.org/wp-content/uploads/2024/04/American-Suburb-Podcast-Tile-703x703-1.jpg",
"officialWebsiteLink": "/news/series/american-suburb-podcast",
"meta": {
"site": "news",
"source": "kqed",
"order": 19
},
"link": "/news/series/american-suburb-podcast/",
"subscribe": {
"npr": "https://rpb3r.app.goo.gl/RBrW",
"apple": "https://itunes.apple.com/WebObjects/MZStore.woa/wa/viewPodcast?mt=2&id=1287748328",
"tuneIn": "https://tunein.com/radio/American-Suburb-p1086805/",
"rss": "https://ww2.kqed.org/news/series/american-suburb-podcast/feed/podcast",
"google": "https://podcasts.google.com/feed/aHR0cHM6Ly9mZWVkcy5tZWdhcGhvbmUuZm0vS1FJTkMzMDExODgxNjA5"
}
},
"baycurious": {
"id": "baycurious",
"title": "Bay Curious",
"tagline": "Exploring the Bay Area, one question at a time",
"info": "KQED’s new podcast, Bay Curious, gets to the bottom of the mysteries — both profound and peculiar — that give the Bay Area its unique identity. And we’ll do it with your help! You ask the questions. You decide what Bay Curious investigates. And you join us on the journey to find the answers.",
"imageSrc": "https://cdn.kqed.org/wp-content/uploads/2024/04/Bay-Curious-Podcast-Tile-703x703-1.jpg",
"imageAlt": "KQED Bay Curious",
"officialWebsiteLink": "/news/series/baycurious",
"meta": {
"site": "news",
"source": "kqed",
"order": 3
},
"link": "/podcasts/baycurious",
"subscribe": {
"apple": "https://podcasts.apple.com/us/podcast/bay-curious/id1172473406",
"npr": "https://www.npr.org/podcasts/500557090/bay-curious",
"rss": "https://ww2.kqed.org/news/category/bay-curious-podcast/feed/podcast",
"amazon": "https://music.amazon.com/podcasts/9a90d476-aa04-455d-9a4c-0871ed6216d4/bay-curious",
"stitcher": "https://www.stitcher.com/podcast/kqed/bay-curious",
"spotify": "https://open.spotify.com/show/6O76IdmhixfijmhTZLIJ8k"
}
},
"bbc-world-service": {
"id": "bbc-world-service",
"title": "BBC World Service",
"info": "The day's top stories from BBC News compiled twice daily in the week, once at weekends.",
"airtime": "MON-FRI 9pm-10pm, TUE-FRI 1am-2am",
"imageSrc": "https://cdn.kqed.org/wp-content/uploads/2024/04/BBC-World-Service-Podcast-Tile-360x360-1.jpg",
"officialWebsiteLink": "https://www.bbc.co.uk/sounds/play/live:bbc_world_service",
"meta": {
"site": "news",
"source": "BBC World Service"
},
"link": "/radio/program/bbc-world-service",
"subscribe": {
"apple": "https://itunes.apple.com/us/podcast/global-news-podcast/id135067274?mt=2",
"tuneIn": "https://tunein.com/radio/BBC-World-Service-p455581/",
"rss": "https://podcasts.files.bbci.co.uk/p02nq0gn.rss"
}
},
"californiareport": {
"id": "californiareport",
"title": "The California Report",
"tagline": "California, day by day",
"info": "KQED’s statewide radio news program providing daily coverage of issues, trends and public policy decisions.",
"imageSrc": "https://cdn.kqed.org/wp-content/uploads/2024/04/The-California-Report-Podcast-Tile-703x703-1.jpg",
"imageAlt": "KQED The California Report",
"officialWebsiteLink": "/californiareport",
"meta": {
"site": "news",
"source": "kqed",
"order": 8
},
"link": "/californiareport",
"subscribe": {
"apple": "https://podcasts.apple.com/us/podcast/kqeds-the-california-report/id79681292",
"amazon": "https://music.amazon.com/podcasts/26099305-72af-4542-9dde-ac1807fe36d5/kqed-s-the-california-report",
"npr": "https://www.npr.org/podcasts/432285393/the-california-report",
"stitcher": "https://www.stitcher.com/podcast/kqedfm-kqeds-the-california-report-podcast-8838",
"rss": "https://ww2.kqed.org/news/tag/tcram/feed/podcast"
}
},
"californiareportmagazine": {
"id": "californiareportmagazine",
"title": "The California Report Magazine",
"tagline": "Your state, your stories",
"info": "Every week, The California Report Magazine takes you on a road trip for the ears: to visit the places and meet the people who make California unique. The in-depth storytelling podcast from the California Report.",
"airtime": "FRI 4:30pm-5pm, 6:30pm-7pm, 11pm-11:30pm",
"imageSrc": "https://cdn.kqed.org/wp-content/uploads/2024/04/The-California-Report-Magazine-Podcast-Tile-703x703-1.jpg",
"imageAlt": "KQED The California Report Magazine",
"officialWebsiteLink": "/californiareportmagazine",
"meta": {
"site": "news",
"source": "kqed",
"order": 10
},
"link": "/californiareportmagazine",
"subscribe": {
"apple": "https://podcasts.apple.com/us/podcast/the-california-report-magazine/id1314750545",
"google": "https://podcasts.google.com/feed/aHR0cHM6Ly9mZWVkcy5tZWdhcGhvbmUuZm0vS1FJTkM3NjkwNjk1OTAz",
"npr": "https://www.npr.org/podcasts/564733126/the-california-report-magazine",
"stitcher": "https://www.stitcher.com/podcast/kqed/the-california-report-magazine",
"rss": "https://ww2.kqed.org/news/tag/tcrmag/feed/podcast"
}
},
"city-arts": {
"id": "city-arts",
"title": "City Arts & Lectures",
"info": "A one-hour radio program to hear celebrated writers, artists and thinkers address contemporary ideas and values, often discussing the creative process. Please note: tapes or transcripts are not available",
"imageSrc": "https://ww2.kqed.org/radio/wp-content/uploads/sites/50/2018/05/cityartsandlecture-300x300.jpg",
"officialWebsiteLink": "https://www.cityarts.net/",
"airtime": "SUN 1pm-2pm, TUE 10pm, WED 1am",
"meta": {
"site": "news",
"source": "City Arts & Lectures"
},
"link": "https://www.cityarts.net",
"subscribe": {
"tuneIn": "https://tunein.com/radio/City-Arts-and-Lectures-p692/",
"rss": "https://www.cityarts.net/feed/"
}
},
"closealltabs": {
"id": "closealltabs",
"title": "Close All Tabs",
"tagline": "Your irreverent guide to the trends redefining our world",
"info": "Close All Tabs breaks down how digital culture shapes our world through thoughtful insights and irreverent humor.",
"imageSrc": "https://cdn.kqed.org/wp-content/uploads/2025/02/CAT_2_Tile-scaled.jpg",
"imageAlt": "KQED Close All Tabs",
"officialWebsiteLink": "/podcasts/closealltabs",
"meta": {
"site": "news",
"source": "kqed",
"order": 1
},
"link": "/podcasts/closealltabs",
"subscribe": {
"apple": "https://podcasts.apple.com/us/podcast/close-all-tabs/id214663465",
"rss": "https://feeds.megaphone.fm/KQINC6993880386",
"amazon": "https://music.amazon.com/podcasts/92d9d4ac-67a3-4eed-b10a-fb45d45b1ef2/close-all-tabs",
"spotify": "https://open.spotify.com/show/6LAJFHnGK1pYXYzv6SIol6?si=deb0cae19813417c"
}
},
"code-switch-life-kit": {
"id": "code-switch-life-kit",
"title": "Code Switch / Life Kit",
"info": "\u003cem>Code Switch\u003c/em>, which listeners will hear in the first part of the hour, has fearless and much-needed conversations about race. Hosted by journalists of color, the show tackles the subject of race head-on, exploring how it impacts every part of society — from politics and pop culture to history, sports and more.\u003cbr />\u003cbr />\u003cem>Life Kit\u003c/em>, which will be in the second part of the hour, guides you through spaces and feelings no one prepares you for — from finances to mental health, from workplace microaggressions to imposter syndrome, from relationships to parenting. The show features experts with real world experience and shares their knowledge. Because everyone needs a little help being human.\u003cbr />\u003cbr />\u003ca href=\"https://www.npr.org/podcasts/510312/codeswitch\">\u003cem>Code Switch\u003c/em> offical site and podcast\u003c/a>\u003cbr />\u003ca href=\"https://www.npr.org/lifekit\">\u003cem>Life Kit\u003c/em> offical site and podcast\u003c/a>\u003cbr />",
"airtime": "SUN 9pm-10pm",
"imageSrc": "https://cdn.kqed.org/wp-content/uploads/2024/04/Code-Switch-Life-Kit-Podcast-Tile-360x360-1.jpg",
"meta": {
"site": "radio",
"source": "npr"
},
"link": "/radio/program/code-switch-life-kit",
"subscribe": {
"apple": "https://podcasts.apple.com/podcast/1112190608?mt=2&at=11l79Y&ct=nprdirectory",
"google": "https://podcasts.google.com/feed/aHR0cHM6Ly93d3cubnByLm9yZy9yc3MvcG9kY2FzdC5waHA_aWQ9NTEwMzEy",
"spotify": "https://open.spotify.com/show/3bExJ9JQpkwNhoHvaIIuyV",
"rss": "https://feeds.npr.org/510312/podcast.xml"
}
},
"commonwealth-club": {
"id": "commonwealth-club",
"title": "Commonwealth Club of California Podcast",
"info": "The Commonwealth Club of California is the nation's oldest and largest public affairs forum. As a non-partisan forum, The Club brings to the public airwaves diverse viewpoints on important topics. The Club's weekly radio broadcast - the oldest in the U.S., dating back to 1924 - is carried across the nation on public radio stations and is now podcasting. Our website archive features audio of our recent programs, as well as selected speeches from our long and distinguished history. This podcast feed is usually updated twice a week and is always un-edited.",
"airtime": "THU 10pm, FRI 1am",
"imageSrc": "https://cdn.kqed.org/wp-content/uploads/2024/04/Commonwealth-Club-Podcast-Tile-360x360-1.jpg",
"officialWebsiteLink": "https://www.commonwealthclub.org/podcasts",
"meta": {
"site": "news",
"source": "Commonwealth Club of California"
},
"link": "/radio/program/commonwealth-club",
"subscribe": {
"apple": "https://itunes.apple.com/us/podcast/commonwealth-club-of-california-podcast/id976334034?mt=2",
"google": "https://podcasts.google.com/feed/aHR0cDovL3d3dy5jb21tb253ZWFsdGhjbHViLm9yZy9hdWRpby9wb2RjYXN0L3dlZWtseS54bWw",
"tuneIn": "https://tunein.com/radio/Commonwealth-Club-of-California-p1060/"
}
},
"forum": {
"id": "forum",
"title": "Forum",
"tagline": "The conversation starts here",
"info": "KQED’s live call-in program discussing local, state, national and international issues, as well as in-depth interviews.",
"airtime": "MON-FRI 9am-11am, 10pm-11pm",
"imageSrc": "https://cdn.kqed.org/wp-content/uploads/2024/04/Forum-Podcast-Tile-703x703-1.jpg",
"imageAlt": "KQED Forum with Mina Kim and Alexis Madrigal",
"officialWebsiteLink": "/forum",
"meta": {
"site": "news",
"source": "kqed",
"order": 9
},
"link": "/forum",
"subscribe": {
"apple": "https://podcasts.apple.com/us/podcast/kqeds-forum/id73329719",
"google": "https://podcasts.google.com/feed/aHR0cHM6Ly9mZWVkcy5tZWdhcGhvbmUuZm0vS1FJTkM5NTU3MzgxNjMz",
"npr": "https://www.npr.org/podcasts/432307980/forum",
"stitcher": "https://www.stitcher.com/podcast/kqedfm-kqeds-forum-podcast",
"rss": "https://feeds.megaphone.fm/KQINC9557381633"
}
},
"freakonomics-radio": {
"id": "freakonomics-radio",
"title": "Freakonomics Radio",
"info": "Freakonomics Radio is a one-hour award-winning podcast and public-radio project hosted by Stephen Dubner, with co-author Steve Levitt as a regular guest. It is produced in partnership with WNYC.",
"imageSrc": "https://ww2.kqed.org/news/wp-content/uploads/sites/10/2018/05/freakonomicsRadio.png",
"officialWebsiteLink": "http://freakonomics.com/",
"airtime": "SUN 1am-2am, SAT 3pm-4pm",
"meta": {
"site": "radio",
"source": "WNYC"
},
"link": "/radio/program/freakonomics-radio",
"subscribe": {
"npr": "https://rpb3r.app.goo.gl/4s8b",
"apple": "https://itunes.apple.com/us/podcast/freakonomics-radio/id354668519",
"tuneIn": "https://tunein.com/podcasts/WNYC-Podcasts/Freakonomics-Radio-p272293/",
"rss": "https://feeds.feedburner.com/freakonomicsradio"
}
},
"fresh-air": {
"id": "fresh-air",
"title": "Fresh Air",
"info": "Hosted by Terry Gross, \u003cem>Fresh Air from WHYY\u003c/em> is the Peabody Award-winning weekday magazine of contemporary arts and issues. One of public radio's most popular programs, Fresh Air features intimate conversations with today's biggest luminaries.",
"airtime": "MON-FRI 7pm-8pm",
"imageSrc": "https://cdn.kqed.org/wp-content/uploads/2024/04/Fresh-Air-Podcast-Tile-360x360-1.jpg",
"officialWebsiteLink": "https://www.npr.org/programs/fresh-air/",
"meta": {
"site": "radio",
"source": "npr"
},
"link": "/radio/program/fresh-air",
"subscribe": {
"npr": "https://rpb3r.app.goo.gl/4s8b",
"apple": "https://itunes.apple.com/WebObjects/MZStore.woa/wa/viewPodcast?s=143441&mt=2&id=214089682&at=11l79Y&ct=nprdirectory",
"tuneIn": "https://tunein.com/radio/Fresh-Air-p17/",
"rss": "https://feeds.npr.org/381444908/podcast.xml"
}
},
"here-and-now": {
"id": "here-and-now",
"title": "Here & Now",
"info": "A live production of NPR and WBUR Boston, in collaboration with stations across the country, Here & Now reflects the fluid world of news as it's happening in the middle of the day, with timely, in-depth news, interviews and conversation. Hosted by Robin Young, Jeremy Hobson and Tonya Mosley.",
"airtime": "MON-THU 11am-12pm",
"imageSrc": "https://cdn.kqed.org/wp-content/uploads/2024/04/Here-And-Now-Podcast-Tile-360x360-1.jpg",
"officialWebsiteLink": "http://www.wbur.org/hereandnow",
"meta": {
"site": "news",
"source": "npr"
},
"link": "/radio/program/here-and-now",
"subsdcribe": {
"apple": "https://itunes.apple.com/WebObjects/MZStore.woa/wa/viewPodcast?mt=2&id=426698661",
"tuneIn": "https://tunein.com/radio/Here--Now-p211/",
"rss": "https://feeds.npr.org/510051/podcast.xml"
}
},
"hidden-brain": {
"id": "hidden-brain",
"title": "Hidden Brain",
"info": "Shankar Vedantam uses science and storytelling to reveal the unconscious patterns that drive human behavior, shape our choices and direct our relationships.",
"imageSrc": "https://ww2.kqed.org/radio/wp-content/uploads/sites/50/2018/05/hiddenbrain.jpg",
"officialWebsiteLink": "https://www.npr.org/series/423302056/hidden-brain",
"airtime": "SUN 7pm-8pm",
"meta": {
"site": "news",
"source": "NPR"
},
"link": "/radio/program/hidden-brain",
"subscribe": {
"apple": "https://itunes.apple.com/us/podcast/hidden-brain/id1028908750?mt=2",
"tuneIn": "https://tunein.com/podcasts/Science-Podcasts/Hidden-Brain-p787503/",
"rss": "https://feeds.npr.org/510308/podcast.xml"
}
},
"how-i-built-this": {
"id": "how-i-built-this",
"title": "How I Built This with Guy Raz",
"info": "Guy Raz dives into the stories behind some of the world's best known companies. How I Built This weaves a narrative journey about innovators, entrepreneurs and idealists—and the movements they built.",
"imageSrc": "https://ww2.kqed.org/news/wp-content/uploads/sites/10/2018/05/howIBuiltThis.png",
"officialWebsiteLink": "https://www.npr.org/podcasts/510313/how-i-built-this",
"airtime": "SUN 7:30pm-8pm",
"meta": {
"site": "news",
"source": "npr"
},
"link": "/radio/program/how-i-built-this",
"subscribe": {
"npr": "https://rpb3r.app.goo.gl/3zxy",
"apple": "https://itunes.apple.com/us/podcast/how-i-built-this-with-guy-raz/id1150510297?mt=2",
"tuneIn": "https://tunein.com/podcasts/Arts--Culture-Podcasts/How-I-Built-This-p910896/",
"rss": "https://feeds.npr.org/510313/podcast.xml"
}
},
"hyphenacion": {
"id": "hyphenacion",
"title": "Hyphenación",
"tagline": "Where conversation and cultura meet",
"info": "What kind of no sabo word is Hyphenación? For us, it’s about living within a hyphenation. Like being a third-gen Mexican-American from the Texas border now living that Bay Area Chicano life. Like Xorje! Each week we bring together a couple of hyphenated Latinos to talk all about personal life choices: family, careers, relationships, belonging … everything is on the table. ",
"imageSrc": "https://cdn.kqed.org/wp-content/uploads/2025/03/Hyphenacion_FinalAssets_PodcastTile.png",
"imageAlt": "KQED Hyphenación",
"officialWebsiteLink": "/podcasts/hyphenacion",
"meta": {
"site": "news",
"source": "kqed",
"order": 15
},
"link": "/podcasts/hyphenacion",
"subscribe": {
"apple": "https://podcasts.apple.com/us/podcast/hyphenaci%C3%B3n/id1191591838",
"spotify": "https://open.spotify.com/show/2p3Fifq96nw9BPcmFdIq0o?si=39209f7b25774f38",
"youtube": "https://www.youtube.com/c/kqedarts",
"amazon": "https://music.amazon.com/podcasts/6c3dd23c-93fb-4aab-97ba-1725fa6315f1/hyphenaci%C3%B3n",
"rss": "https://feeds.megaphone.fm/KQINC2275451163"
}
},
"jerrybrown": {
"id": "jerrybrown",
"title": "The Political Mind of Jerry Brown",
"tagline": "Lessons from a lifetime in politics",
"info": "The Political Mind of Jerry Brown brings listeners the wisdom of the former Governor, Mayor, and presidential candidate. Scott Shafer interviewed Brown for more than 40 hours, covering the former governor's life and half-century in the political game – and Brown has some lessons he'd like to share. ",
"imageSrc": "https://cdn.kqed.org/wp-content/uploads/2024/04/The-Political-Mind-of-Jerry-Brown-Podcast-Tile-703x703-1.jpg",
"imageAlt": "KQED The Political Mind of Jerry Brown",
"officialWebsiteLink": "/podcasts/jerrybrown",
"meta": {
"site": "news",
"source": "kqed",
"order": 18
},
"link": "/podcasts/jerrybrown",
"subscribe": {
"npr": "https://www.npr.org/podcasts/790253322/the-political-mind-of-jerry-brown",
"apple": "https://itunes.apple.com/us/podcast/id1492194549",
"rss": "https://ww2.kqed.org/news/series/jerrybrown/feed/podcast/",
"tuneIn": "http://tun.in/pjGcK",
"stitcher": "https://www.stitcher.com/podcast/kqed/the-political-mind-of-jerry-brown",
"spotify": "https://open.spotify.com/show/54C1dmuyFyKMFttY6X2j6r?si=K8SgRCoISNK6ZbjpXrX5-w",
"amazon": "https://music.amazon.com/podcasts/44420f75-3b0e-4301-ab3b-16da6b09e543/the-political-mind-of-jerry-brown"
}
},
"latino-usa": {
"id": "latino-usa",
"title": "Latino USA",
"airtime": "MON 1am-2am, SUN 6pm-7pm",
"info": "Latino USA, the radio journal of news and culture, is the only national, English-language radio program produced from a Latino perspective.",
"imageSrc": "https://ww2.kqed.org/radio/wp-content/uploads/sites/50/2018/04/latinoUsa.jpg",
"officialWebsiteLink": "http://latinousa.org/",
"meta": {
"site": "news",
"source": "npr"
},
"link": "/radio/program/latino-usa",
"subscribe": {
"npr": "https://rpb3r.app.goo.gl/xtTd",
"apple": "https://itunes.apple.com/WebObjects/MZStore.woa/wa/viewPodcast?s=143441&mt=2&id=79681317&at=11l79Y&ct=nprdirectory",
"tuneIn": "https://tunein.com/radio/Latino-USA-p621/",
"rss": "https://feeds.npr.org/510016/podcast.xml"
}
},
"marketplace": {
"id": "marketplace",
"title": "Marketplace",
"info": "Our flagship program, helmed by Kai Ryssdal, examines what the day in money delivered, through stories, conversations, newsworthy numbers and more. Updated Monday through Friday at about 3:30 p.m. PT.",
"airtime": "MON-FRI 4pm-4:30pm, MON-WED 6:30pm-7pm",
"imageSrc": "https://cdn.kqed.org/wp-content/uploads/2024/04/Marketplace-Podcast-Tile-360x360-1.jpg",
"officialWebsiteLink": "https://www.marketplace.org/",
"meta": {
"site": "news",
"source": "American Public Media"
},
"link": "/radio/program/marketplace",
"subscribe": {
"apple": "https://itunes.apple.com/WebObjects/MZStore.woa/wa/viewPodcast?s=143441&mt=2&id=201853034&at=11l79Y&ct=nprdirectory",
"tuneIn": "https://tunein.com/radio/APM-Marketplace-p88/",
"rss": "https://feeds.publicradio.org/public_feeds/marketplace-pm/rss/rss"
}
},
"masters-of-scale": {
"id": "masters-of-scale",
"title": "Masters of Scale",
"info": "Masters of Scale is an original podcast in which LinkedIn co-founder and Greylock Partner Reid Hoffman sets out to describe and prove theories that explain how great entrepreneurs take their companies from zero to a gazillion in ingenious fashion.",
"airtime": "Every other Wednesday June 12 through October 16 at 8pm (repeats Thursdays at 2am)",
"imageSrc": "https://cdn.kqed.org/wp-content/uploads/2024/04/Masters-of-Scale-Podcast-Tile-360x360-1.jpg",
"officialWebsiteLink": "https://mastersofscale.com/",
"meta": {
"site": "radio",
"source": "WaitWhat"
},
"link": "/radio/program/masters-of-scale",
"subscribe": {
"apple": "http://mastersofscale.app.link/",
"rss": "https://rss.art19.com/masters-of-scale"
}
},
"mindshift": {
"id": "mindshift",
"title": "MindShift",
"tagline": "A podcast about the future of learning and how we raise our kids",
"info": "The MindShift podcast explores the innovations in education that are shaping how kids learn. Hosts Ki Sung and Katrina Schwartz introduce listeners to educators, researchers, parents and students who are developing effective ways to improve how kids learn. We cover topics like how fed-up administrators are developing surprising tactics to deal with classroom disruptions; how listening to podcasts are helping kids develop reading skills; the consequences of overparenting; and why interdisciplinary learning can engage students on all ends of the traditional achievement spectrum. This podcast is part of the MindShift education site, a division of KQED News. KQED is an NPR/PBS member station based in San Francisco. You can also visit the MindShift website for episodes and supplemental blog posts or tweet us \u003ca href=\"https://twitter.com/MindShiftKQED\">@MindShiftKQED\u003c/a> or visit us at \u003ca href=\"/mindshift\">MindShift.KQED.org\u003c/a>",
"imageSrc": "https://cdn.kqed.org/wp-content/uploads/2024/04/Mindshift-Podcast-Tile-703x703-1.jpg",
"imageAlt": "KQED MindShift: How We Will Learn",
"officialWebsiteLink": "/mindshift/",
"meta": {
"site": "news",
"source": "kqed",
"order": 12
},
"link": "/podcasts/mindshift",
"subscribe": {
"apple": "https://podcasts.apple.com/us/podcast/mindshift-podcast/id1078765985",
"google": "https://podcasts.google.com/feed/aHR0cHM6Ly9mZWVkcy5tZWdhcGhvbmUuZm0vS1FJTkM1NzY0NjAwNDI5",
"npr": "https://www.npr.org/podcasts/464615685/mind-shift-podcast",
"stitcher": "https://www.stitcher.com/podcast/kqed/stories-teachers-share",
"spotify": "https://open.spotify.com/show/0MxSpNYZKNprFLCl7eEtyx"
}
},
"morning-edition": {
"id": "morning-edition",
"title": "Morning Edition",
"info": "\u003cem>Morning Edition\u003c/em> takes listeners around the country and the world with multi-faceted stories and commentaries every weekday. Hosts Steve Inskeep, David Greene and Rachel Martin bring you the latest breaking news and features to prepare you for the day.",
"airtime": "MON-FRI 3am-9am",
"imageSrc": "https://cdn.kqed.org/wp-content/uploads/2024/04/Morning-Edition-Podcast-Tile-360x360-1.jpg",
"officialWebsiteLink": "https://www.npr.org/programs/morning-edition/",
"meta": {
"site": "news",
"source": "npr"
},
"link": "/radio/program/morning-edition"
},
"onourwatch": {
"id": "onourwatch",
"title": "On Our Watch",
"tagline": "Deeply-reported investigative journalism",
"info": "For decades, the process for how police police themselves has been inconsistent – if not opaque. In some states, like California, these proceedings were completely hidden. After a new police transparency law unsealed scores of internal affairs files, our reporters set out to examine these cases and the shadow world of police discipline. On Our Watch brings listeners into the rooms where officers are questioned and witnesses are interrogated to find out who this system is really protecting. Is it the officers, or the public they've sworn to serve?",
"imageSrc": "https://cdn.kqed.org/wp-content/uploads/2024/04/On-Our-Watch-Podcast-Tile-703x703-1.jpg",
"imageAlt": "On Our Watch from NPR and KQED",
"officialWebsiteLink": "/podcasts/onourwatch",
"meta": {
"site": "news",
"source": "kqed",
"order": 11
},
"link": "/podcasts/onourwatch",
"subscribe": {
"apple": "https://podcasts.apple.com/podcast/id1567098962",
"google": "https://podcasts.google.com/feed/aHR0cHM6Ly9mZWVkcy5ucHIub3JnLzUxMDM2MC9wb2RjYXN0LnhtbD9zYz1nb29nbGVwb2RjYXN0cw",
"npr": "https://rpb3r.app.goo.gl/onourwatch",
"spotify": "https://open.spotify.com/show/0OLWoyizopu6tY1XiuX70x",
"tuneIn": "https://tunein.com/radio/On-Our-Watch-p1436229/",
"stitcher": "https://www.stitcher.com/show/on-our-watch",
"rss": "https://feeds.npr.org/510360/podcast.xml"
}
},
"on-the-media": {
"id": "on-the-media",
"title": "On The Media",
"info": "Our weekly podcast explores how the media 'sausage' is made, casts an incisive eye on fluctuations in the marketplace of ideas, and examines threats to the freedom of information and expression in America and abroad. For one hour a week, the show tries to lift the veil from the process of \"making media,\" especially news media, because it's through that lens that we see the world and the world sees us",
"airtime": "SUN 2pm-3pm, MON 12am-1am",
"imageSrc": "https://ww2.kqed.org/radio/wp-content/uploads/sites/50/2018/04/onTheMedia.png",
"officialWebsiteLink": "https://www.wnycstudios.org/shows/otm",
"meta": {
"site": "news",
"source": "wnyc"
},
"link": "/radio/program/on-the-media",
"subscribe": {
"apple": "https://itunes.apple.com/us/podcast/on-the-media/id73330715?mt=2",
"tuneIn": "https://tunein.com/radio/On-the-Media-p69/",
"rss": "http://feeds.wnyc.org/onthemedia"
}
},
"pbs-newshour": {
"id": "pbs-newshour",
"title": "PBS NewsHour",
"info": "Analysis, background reports and updates from the PBS NewsHour putting today's news in context.",
"airtime": "MON-FRI 3pm-4pm",
"imageSrc": "https://cdn.kqed.org/wp-content/uploads/2024/04/PBS-News-Hour-Podcast-Tile-360x360-1.jpg",
"officialWebsiteLink": "https://www.pbs.org/newshour/",
"meta": {
"site": "news",
"source": "pbs"
},
"link": "/radio/program/pbs-newshour",
"subscribe": {
"apple": "https://itunes.apple.com/us/podcast/pbs-newshour-full-show/id394432287?mt=2",
"tuneIn": "https://tunein.com/radio/PBS-NewsHour---Full-Show-p425698/",
"rss": "https://www.pbs.org/newshour/feeds/rss/podcasts/show"
}
},
"perspectives": {
"id": "perspectives",
"title": "Perspectives",
"tagline": "KQED's series of daily listener commentaries since 1991",
"info": "KQED's series of daily listener commentaries since 1991.",
"imageSrc": "https://cdn.kqed.org/wp-content/uploads/2025/01/Perspectives_Tile_Final.jpg",
"imageAlt": "KQED Perspectives",
"officialWebsiteLink": "/perspectives/",
"meta": {
"site": "radio",
"source": "kqed",
"order": 14
},
"link": "/perspectives",
"subscribe": {
"apple": "https://podcasts.apple.com/us/podcast/id73801135",
"npr": "https://www.npr.org/podcasts/432309616/perspectives",
"rss": "https://ww2.kqed.org/perspectives/category/perspectives/feed/",
"google": "https://podcasts.google.com/feed/aHR0cHM6Ly93dzIua3FlZC5vcmcvcGVyc3BlY3RpdmVzL2NhdGVnb3J5L3BlcnNwZWN0aXZlcy9mZWVkLw"
}
},
"planet-money": {
"id": "planet-money",
"title": "Planet Money",
"info": "The economy explained. Imagine you could call up a friend and say, Meet me at the bar and tell me what's going on with the economy. Now imagine that's actually a fun evening.",
"airtime": "SUN 3pm-4pm",
"imageSrc": "https://ww2.kqed.org/radio/wp-content/uploads/sites/50/2018/04/planetmoney.jpg",
"officialWebsiteLink": "https://www.npr.org/sections/money/",
"meta": {
"site": "news",
"source": "npr"
},
"link": "/radio/program/planet-money",
"subscribe": {
"npr": "https://rpb3r.app.goo.gl/M4f5",
"apple": "https://itunes.apple.com/us/podcast/planet-money/id290783428?mt=2",
"tuneIn": "https://tunein.com/podcasts/Business--Economics-Podcasts/Planet-Money-p164680/",
"rss": "https://feeds.npr.org/510289/podcast.xml"
}
},
"politicalbreakdown": {
"id": "politicalbreakdown",
"title": "Political Breakdown",
"tagline": "Politics from a personal perspective",
"info": "Political Breakdown is a new series that explores the political intersection of California and the nation. Each week hosts Scott Shafer and Marisa Lagos are joined with a new special guest to unpack politics -- with personality — and offer an insider’s glimpse at how politics happens.",
"airtime": "THU 6:30pm-7pm",
"imageSrc": "https://cdn.kqed.org/wp-content/uploads/2024/04/Political-Breakdown-2024-Podcast-Tile-703x703-1.jpg",
"imageAlt": "KQED Political Breakdown",
"officialWebsiteLink": "/podcasts/politicalbreakdown",
"meta": {
"site": "radio",
"source": "kqed",
"order": 5
},
"link": "/podcasts/politicalbreakdown",
"subscribe": {
"apple": "https://podcasts.apple.com/us/podcast/political-breakdown/id1327641087",
"amazon": "https://music.amazon.com/podcasts/e0c2d153-ad36-4c8d-901d-f1da6a724824/political-breakdown",
"npr": "https://www.npr.org/podcasts/572155894/political-breakdown",
"stitcher": "https://www.stitcher.com/podcast/kqed/political-breakdown",
"spotify": "https://open.spotify.com/show/07RVyIjIdk2WDuVehvBMoN",
"rss": "https://ww2.kqed.org/news/tag/political-breakdown/feed/podcast"
}
},
"possible": {
"id": "possible",
"title": "Possible",
"info": "Possible is hosted by entrepreneur Reid Hoffman and writer Aria Finger. Together in Possible, Hoffman and Finger lead enlightening discussions about building a brighter collective future. The show features interviews with visionary guests like Trevor Noah, Sam Altman and Janette Sadik-Khan. Possible paints an optimistic portrait of the world we can create through science, policy, business, art and our shared humanity. It asks: What if everything goes right for once? How can we get there? Each episode also includes a short fiction story generated by advanced AI GPT-4, serving as a thought-provoking springboard to speculate how humanity could leverage technology for good.",
"airtime": "SUN 2pm",
"imageSrc": "https://cdn.kqed.org/wp-content/uploads/2024/04/Possible-Podcast-Tile-360x360-1.jpg",
"officialWebsiteLink": "https://www.possible.fm/",
"meta": {
"site": "news",
"source": "Possible"
},
"link": "/radio/program/possible",
"subscribe": {
"apple": "https://podcasts.apple.com/us/podcast/possible/id1677184070",
"spotify": "https://open.spotify.com/show/730YpdUSNlMyPQwNnyjp4k"
}
},
"pri-the-world": {
"id": "pri-the-world",
"title": "PRI's The World: Latest Edition",
"info": "Each weekday, host Marco Werman and his team of producers bring you the world's most interesting stories in an hour of radio that reminds us just how small our planet really is.",
"airtime": "MON-FRI 2pm-3pm",
"imageSrc": "https://cdn.kqed.org/wp-content/uploads/2024/04/The-World-Podcast-Tile-360x360-1.jpg",
"officialWebsiteLink": "https://www.pri.org/programs/the-world",
"meta": {
"site": "news",
"source": "PRI"
},
"link": "/radio/program/pri-the-world",
"subscribe": {
"apple": "https://itunes.apple.com/us/podcast/pris-the-world-latest-edition/id278196007?mt=2",
"tuneIn": "https://tunein.com/podcasts/News--Politics-Podcasts/PRIs-The-World-p24/",
"rss": "http://feeds.feedburner.com/pri/theworld"
}
},
"radiolab": {
"id": "radiolab",
"title": "Radiolab",
"info": "A two-time Peabody Award-winner, Radiolab is an investigation told through sounds and stories, and centered around one big idea. In the Radiolab world, information sounds like music and science and culture collide. Hosted by Jad Abumrad and Robert Krulwich, the show is designed for listeners who demand skepticism, but appreciate wonder. WNYC Studios is the producer of other leading podcasts including Freakonomics Radio, Death, Sex & Money, On the Media and many more.",
"airtime": "SUN 12am-1am, SAT 2pm-3pm",
"imageSrc": "https://ww2.kqed.org/radio/wp-content/uploads/sites/50/2018/04/radiolab1400.png",
"officialWebsiteLink": "https://www.wnycstudios.org/shows/radiolab/",
"meta": {
"site": "science",
"source": "WNYC"
},
"link": "/radio/program/radiolab",
"subscribe": {
"apple": "https://itunes.apple.com/us/podcast/radiolab/id152249110?mt=2",
"tuneIn": "https://tunein.com/radio/RadioLab-p68032/",
"rss": "https://feeds.wnyc.org/radiolab"
}
},
"reveal": {
"id": "reveal",
"title": "Reveal",
"info": "Created by The Center for Investigative Reporting and PRX, Reveal is public radios first one-hour weekly radio show and podcast dedicated to investigative reporting. Credible, fact based and without a partisan agenda, Reveal combines the power and artistry of driveway moment storytelling with data-rich reporting on critically important issues. The result is stories that inform and inspire, arming our listeners with information to right injustices, hold the powerful accountable and improve lives.Reveal is hosted by Al Letson and showcases the award-winning work of CIR and newsrooms large and small across the nation. In a radio and podcast market crowded with choices, Reveal focuses on important and often surprising stories that illuminate the world for our listeners.",
"airtime": "SAT 4pm-5pm",
"imageSrc": "https://ww2.kqed.org/radio/wp-content/uploads/sites/50/2018/04/reveal300px.png",
"officialWebsiteLink": "https://www.revealnews.org/episodes/",
"meta": {
"site": "news",
"source": "npr"
},
"link": "/radio/program/reveal",
"subscribe": {
"apple": "https://itunes.apple.com/us/podcast/reveal/id886009669",
"tuneIn": "https://tunein.com/radio/Reveal-p679597/",
"rss": "http://feeds.revealradio.org/revealpodcast"
}
},
"rightnowish": {
"id": "rightnowish",
"title": "Rightnowish",
"tagline": "Art is where you find it",
"info": "Rightnowish digs into life in the Bay Area right now… ish. Journalist Pendarvis Harshaw takes us to galleries painted on the sides of liquor stores in West Oakland. We'll dance in warehouses in the Bayview, make smoothies with kids in South Berkeley, and listen to classical music in a 1984 Cutlass Supreme in Richmond. Every week, Pen talks to movers and shakers about how the Bay Area shapes what they create, and how they shape the place we call home.",
"imageSrc": "https://cdn.kqed.org/wp-content/uploads/2024/04/Rightnowish-Podcast-Tile-500x500-1.jpg",
"imageAlt": "KQED Rightnowish with Pendarvis Harshaw",
"officialWebsiteLink": "/podcasts/rightnowish",
"meta": {
"site": "arts",
"source": "kqed",
"order": 16
},
"link": "/podcasts/rightnowish",
"subscribe": {
"npr": "https://www.npr.org/podcasts/721590300/rightnowish",
"rss": "https://ww2.kqed.org/arts/programs/rightnowish/feed/podcast",
"apple": "https://podcasts.apple.com/us/podcast/rightnowish/id1482187648",
"stitcher": "https://www.stitcher.com/podcast/kqed/rightnowish",
"google": "https://podcasts.google.com/feed/aHR0cHM6Ly9mZWVkcy5tZWdhcGhvbmUuZm0vS1FJTkMxMjU5MTY3NDc4",
"spotify": "https://open.spotify.com/show/7kEJuafTzTVan7B78ttz1I"
}
},
"science-friday": {
"id": "science-friday",
"title": "Science Friday",
"info": "Science Friday is a weekly science talk show, broadcast live over public radio stations nationwide. Each week, the show focuses on science topics that are in the news and tries to bring an educated, balanced discussion to bear on the scientific issues at hand. Panels of expert guests join host Ira Flatow, a veteran science journalist, to discuss science and to take questions from listeners during the call-in portion of the program.",
"airtime": "FRI 11am-1pm",
"imageSrc": "https://cdn.kqed.org/wp-content/uploads/2024/04/Science-Friday-Podcast-Tile-360x360-1.jpg",
"officialWebsiteLink": "https://www.wnycstudios.org/shows/science-friday",
"meta": {
"site": "news",
"source": "npr"
},
"link": "/radio/program/science-friday",
"subscribe": {
"apple": "https://itunes.apple.com/WebObjects/MZStore.woa/wa/viewPodcast?s=143441&mt=2&id=73329284&at=11l79Y&ct=nprdirectory",
"tuneIn": "https://tunein.com/radio/Science-Friday-p394/",
"rss": "http://feeds.wnyc.org/science-friday"
}
},
"snap-judgment": {
"id": "snap-judgment",
"title": "Snap Judgment",
"tagline": "Real stories with killer beats",
"info": "The Snap Judgment radio show and podcast mixes real stories with killer beats to produce cinematic, dramatic radio. Snap's musical brand of storytelling dares listeners to see the world through the eyes of another. This is storytelling... with a BEAT!! Snap first aired on public radio stations nationwide in July 2010. Today, Snap Judgment airs on over 450 public radio stations and is brought to the airwaves by KQED & PRX.",
"airtime": "SAT 1pm-2pm, 9pm-10pm",
"imageSrc": "https://cdn.kqed.org/wp-content/uploads/2024/05/Snap-Judgment-Podcast-Tile-703x703-1.jpg",
"imageAlt": "KQED Snap Judgment",
"officialWebsiteLink": "https://snapjudgment.org",
"meta": {
"site": "arts",
"source": "kqed",
"order": 4
},
"link": "https://snapjudgment.org",
"subscribe": {
"apple": "https://podcasts.apple.com/us/podcast/snap-judgment/id283657561",
"npr": "https://www.npr.org/podcasts/449018144/snap-judgment",
"stitcher": "https://www.pandora.com/podcast/snap-judgment/PC:241?source=stitcher-sunset",
"spotify": "https://open.spotify.com/show/3Cct7ZWmxHNAtLgBTqjC5v",
"rss": "https://snap.feed.snapjudgment.org/"
}
},
"soldout": {
"id": "soldout",
"title": "SOLD OUT: Rethinking Housing in America",
"tagline": "A new future for housing",
"info": "Sold Out: Rethinking Housing in America",
"imageSrc": "https://cdn.kqed.org/wp-content/uploads/2024/04/Sold-Out-Podcast-Tile-703x703-1.jpg",
"imageAlt": "KQED Sold Out: Rethinking Housing in America",
"officialWebsiteLink": "/podcasts/soldout",
"meta": {
"site": "news",
"source": "kqed",
"order": 13
},
"link": "/podcasts/soldout",
"subscribe": {
"npr": "https://www.npr.org/podcasts/911586047/s-o-l-d-o-u-t-a-new-future-for-housing",
"apple": "https://podcasts.apple.com/us/podcast/introducing-sold-out-rethinking-housing-in-america/id1531354937",
"rss": "https://feeds.megaphone.fm/soldout",
"spotify": "https://open.spotify.com/show/38dTBSk2ISFoPiyYNoKn1X",
"stitcher": "https://www.stitcher.com/podcast/kqed/sold-out-rethinking-housing-in-america",
"tunein": "https://tunein.com/radio/SOLD-OUT-Rethinking-Housing-in-America-p1365871/"
}
},
"spooked": {
"id": "spooked",
"title": "Spooked",
"tagline": "True-life supernatural stories",
"info": "",
"imageSrc": "https://cdn.kqed.org/wp-content/uploads/2024/10/Spooked-Podcast-Tile-703x703-1.jpg",
"imageAlt": "KQED Spooked",
"officialWebsiteLink": "https://spookedpodcast.org/",
"meta": {
"site": "news",
"source": "kqed",
"order": 7
},
"link": "https://spookedpodcast.org/",
"subscribe": {
"apple": "https://podcasts.apple.com/us/podcast/spooked/id1279361017",
"npr": "https://www.npr.org/podcasts/549547848/snap-judgment-presents-spooked",
"spotify": "https://open.spotify.com/show/76571Rfl3m7PLJQZKQIGCT",
"rss": "https://feeds.simplecast.com/TBotaapn"
}
},
"tech-nation": {
"id": "tech-nation",
"title": "Tech Nation Radio Podcast",
"info": "Tech Nation is a weekly public radio program, hosted by Dr. Moira Gunn. Founded in 1993, it has grown from a simple interview show to a multi-faceted production, featuring conversations with noted technology and science leaders, and a weekly science and technology-related commentary.",
"airtime": "FRI 10pm",
"imageSrc": "https://cdn.kqed.org/wp-content/uploads/2024/04/Tech-Nation-Radio-Podcast-Tile-360x360-1.jpg",
"officialWebsiteLink": "http://technation.podomatic.com/",
"meta": {
"site": "science",
"source": "Tech Nation Media"
},
"link": "/radio/program/tech-nation",
"subscribe": {
"rss": "https://technation.podomatic.com/rss2.xml"
}
},
"ted-radio-hour": {
"id": "ted-radio-hour",
"title": "TED Radio Hour",
"info": "The TED Radio Hour is a journey through fascinating ideas, astonishing inventions, fresh approaches to old problems, and new ways to think and create.",
"airtime": "SUN 3pm-4pm, SAT 10pm-11pm",
"imageSrc": "https://ww2.kqed.org/radio/wp-content/uploads/sites/50/2018/04/tedRadioHour.jpg",
"officialWebsiteLink": "https://www.npr.org/programs/ted-radio-hour/?showDate=2018-06-22",
"meta": {
"site": "news",
"source": "npr"
},
"link": "/radio/program/ted-radio-hour",
"subscribe": {
"npr": "https://rpb3r.app.goo.gl/8vsS",
"apple": "https://itunes.apple.com/WebObjects/MZStore.woa/wa/viewPodcast?s=143441&mt=2&id=523121474&at=11l79Y&ct=nprdirectory",
"tuneIn": "https://tunein.com/radio/TED-Radio-Hour-p418021/",
"rss": "https://feeds.npr.org/510298/podcast.xml"
}
},
"thebay": {
"id": "thebay",
"title": "The Bay",
"tagline": "Local news to keep you rooted",
"info": "Host Devin Katayama walks you through the biggest story of the day with reporters and newsmakers.",
"imageSrc": "https://cdn.kqed.org/wp-content/uploads/2024/04/The-Bay-Podcast-Tile-703x703-1.jpg",
"imageAlt": "KQED The Bay",
"officialWebsiteLink": "/podcasts/thebay",
"meta": {
"site": "radio",
"source": "kqed",
"order": 2
},
"link": "/podcasts/thebay",
"subscribe": {
"apple": "https://podcasts.apple.com/us/podcast/the-bay/id1350043452",
"amazon": "https://music.amazon.com/podcasts/d800ea4c-7a2c-42f2-b861-edaf78a5db0b/the-bay",
"npr": "https://www.npr.org/podcasts/586725995/the-bay",
"stitcher": "https://www.stitcher.com/podcast/kqed/the-bay",
"spotify": "https://open.spotify.com/show/4BIKBKIujizLHlIlBNaAqQ",
"rss": "https://feeds.megaphone.fm/KQINC8259786327"
}
},
"thelatest": {
"id": "thelatest",
"title": "The Latest",
"tagline": "Trusted local news in real time",
"info": "",
"imageSrc": "https://cdn.kqed.org/wp-content/uploads/2025/05/The-Latest-2025-Podcast-Tile-703x703-1.jpg",
"imageAlt": "KQED The Latest",
"officialWebsiteLink": "/thelatest",
"meta": {
"site": "news",
"source": "kqed",
"order": 6
},
"link": "/thelatest",
"subscribe": {
"apple": "https://podcasts.apple.com/us/podcast/the-latest-from-kqed/id1197721799",
"npr": "https://www.npr.org/podcasts/1257949365/the-latest-from-k-q-e-d",
"spotify": "https://open.spotify.com/show/5KIIXMgM9GTi5AepwOYvIZ?si=bd3053fec7244dba",
"rss": "https://feeds.megaphone.fm/KQINC9137121918"
}
},
"theleap": {
"id": "theleap",
"title": "The Leap",
"tagline": "What if you closed your eyes, and jumped?",
"info": "Stories about people making dramatic, risky changes, told by award-winning public radio reporter Judy Campbell.",
"imageSrc": "https://cdn.kqed.org/wp-content/uploads/2024/04/The-Leap-Podcast-Tile-703x703-1.jpg",
"imageAlt": "KQED The Leap",
"officialWebsiteLink": "/podcasts/theleap",
"meta": {
"site": "news",
"source": "kqed",
"order": 17
},
"link": "/podcasts/theleap",
"subscribe": {
"apple": "https://podcasts.apple.com/us/podcast/the-leap/id1046668171",
"npr": "https://www.npr.org/podcasts/447248267/the-leap",
"stitcher": "https://www.stitcher.com/podcast/kqed/the-leap",
"spotify": "https://open.spotify.com/show/3sSlVHHzU0ytLwuGs1SD1U",
"rss": "https://ww2.kqed.org/news/programs/the-leap/feed/podcast"
}
},
"the-moth-radio-hour": {
"id": "the-moth-radio-hour",
"title": "The Moth Radio Hour",
"info": "Since its launch in 1997, The Moth has presented thousands of true stories, told live and without notes, to standing-room-only crowds worldwide. Moth storytellers stand alone, under a spotlight, with only a microphone and a roomful of strangers. The storyteller and the audience embark on a high-wire act of shared experience which is both terrifying and exhilarating. Since 2008, The Moth podcast has featured many of our favorite stories told live on Moth stages around the country. For information on all of our programs and live events, visit themoth.org.",
"airtime": "SAT 8pm-9pm and SUN 11am-12pm",
"imageSrc": "https://ww2.kqed.org/radio/wp-content/uploads/sites/50/2018/04/theMoth.jpg",
"officialWebsiteLink": "https://themoth.org/",
"meta": {
"site": "arts",
"source": "prx"
},
"link": "/radio/program/the-moth-radio-hour",
"subscribe": {
"apple": "https://itunes.apple.com/us/podcast/the-moth-podcast/id275699983?mt=2",
"tuneIn": "https://tunein.com/radio/The-Moth-p273888/",
"rss": "http://feeds.themoth.org/themothpodcast"
}
},
"the-new-yorker-radio-hour": {
"id": "the-new-yorker-radio-hour",
"title": "The New Yorker Radio Hour",
"info": "The New Yorker Radio Hour is a weekly program presented by the magazine's editor, David Remnick, and produced by WNYC Studios and The New Yorker. Each episode features a diverse mix of interviews, profiles, storytelling, and an occasional burst of humor inspired by the magazine, and shaped by its writers, artists, and editors. This isn't a radio version of a magazine, but something all its own, reflecting the rich possibilities of audio storytelling and conversation. Theme music for the show was composed and performed by Merrill Garbus of tUnE-YArDs.",
"airtime": "SAT 10am-11am",
"imageSrc": "https://cdn.kqed.org/wp-content/uploads/2024/04/The-New-Yorker-Podcast-Tile-360x360-1.jpg",
"officialWebsiteLink": "https://www.wnycstudios.org/shows/tnyradiohour",
"meta": {
"site": "arts",
"source": "WNYC"
},
"link": "/radio/program/the-new-yorker-radio-hour",
"subscribe": {
"apple": "https://itunes.apple.com/us/podcast/id1050430296",
"tuneIn": "https://tunein.com/podcasts/WNYC-Podcasts/New-Yorker-Radio-Hour-p803804/",
"rss": "https://feeds.feedburner.com/newyorkerradiohour"
}
},
"the-sam-sanders-show": {
"id": "the-sam-sanders-show",
"title": "The Sam Sanders Show",
"info": "One of public radio's most dynamic voices, Sam Sanders helped launch The NPR Politics Podcast and hosted NPR's hit show It's Been A Minute. Now, the award-winning host returns with something brand new, The Sam Sanders Show. Every week, Sam Sanders and friends dig into the culture that shapes our lives: what's driving the biggest trends, how artists really think, and even the memes you can't stop scrolling past. Sam is beloved for his way of unpacking the world and bringing you up close to fresh currents and engaging conversations. The Sam Sanders Show is smart, funny and always a good time.",
"airtime": "FRI 12-1pm AND SAT 11am-12pm",
"imageSrc": "https://cdn.kqed.org/wp-content/uploads/2025/11/The-Sam-Sanders-Show-Podcast-Tile-400x400-1.jpg",
"officialWebsiteLink": "https://www.kcrw.com/shows/the-sam-sanders-show/latest",
"meta": {
"site": "arts",
"source": "KCRW"
},
"link": "https://www.kcrw.com/shows/the-sam-sanders-show/latest",
"subscribe": {
"rss": "https://feed.cdnstream1.com/zjb/feed/download/ac/28/59/ac28594c-e1d0-4231-8728-61865cdc80e8.xml"
}
},
"the-splendid-table": {
"id": "the-splendid-table",
"title": "The Splendid Table",
"info": "\u003cem>The Splendid Table\u003c/em> hosts our nation's conversations about cooking, sustainability and food culture.",
"imageSrc": "https://cdn.kqed.org/wp-content/uploads/2024/04/The-Splendid-Table-Podcast-Tile-360x360-1.jpg",
"officialWebsiteLink": "https://www.splendidtable.org/",
"airtime": "SUN 10-11 pm",
"meta": {
"site": "radio",
"source": "npr"
},
"link": "/radio/program/the-splendid-table"
},
"this-american-life": {
"id": "this-american-life",
"title": "This American Life",
"info": "This American Life is a weekly public radio show, heard by 2.2 million people on more than 500 stations. Another 2.5 million people download the weekly podcast. It is hosted by Ira Glass, produced in collaboration with Chicago Public Media, delivered to stations by PRX The Public Radio Exchange, and has won all of the major broadcasting awards.",
"airtime": "SAT 12pm-1pm, 7pm-8pm",
"imageSrc": "https://ww2.kqed.org/radio/wp-content/uploads/sites/50/2018/04/thisAmericanLife.png",
"officialWebsiteLink": "https://www.thisamericanlife.org/",
"meta": {
"site": "news",
"source": "wbez"
},
"link": "/radio/program/this-american-life",
"subscribe": {
"apple": "https://itunes.apple.com/WebObjects/MZStore.woa/wa/viewPodcast?s=143441&mt=2&id=201671138&at=11l79Y&ct=nprdirectory",
"rss": "https://www.thisamericanlife.org/podcast/rss.xml"
}
},
"tinydeskradio": {
"id": "tinydeskradio",
"title": "Tiny Desk Radio",
"info": "We're bringing the best of Tiny Desk to the airwaves, only on public radio.",
"airtime": "SUN 8pm and SAT 9pm",
"imageSrc": "https://cdn.kqed.org/wp-content/uploads/2025/04/300x300-For-Member-Station-Logo-Tiny-Desk-Radio-@2x.png",
"officialWebsiteLink": "https://www.npr.org/series/g-s1-52030/tiny-desk-radio",
"meta": {
"site": "news",
"source": "npr"
},
"link": "/radio/program/tinydeskradio",
"subscribe": {
"rss": "https://feeds.npr.org/g-s1-52030/rss.xml"
}
},
"wait-wait-dont-tell-me": {
"id": "wait-wait-dont-tell-me",
"title": "Wait Wait... Don't Tell Me!",
"info": "Peter Sagal and Bill Kurtis host the weekly NPR News quiz show alongside some of the best and brightest news and entertainment personalities.",
"airtime": "SUN 10am-11am, SAT 11am-12pm, SAT 6pm-7pm",
"imageSrc": "https://cdn.kqed.org/wp-content/uploads/2024/04/Wait-Wait-Podcast-Tile-300x300-1.jpg",
"officialWebsiteLink": "https://www.npr.org/programs/wait-wait-dont-tell-me/",
"meta": {
"site": "news",
"source": "npr"
},
"link": "/radio/program/wait-wait-dont-tell-me",
"subscribe": {
"npr": "https://rpb3r.app.goo.gl/Xogv",
"apple": "https://itunes.apple.com/WebObjects/MZStore.woa/wa/viewPodcast?s=143441&mt=2&id=121493804&at=11l79Y&ct=nprdirectory",
"tuneIn": "https://tunein.com/radio/Wait-Wait-Dont-Tell-Me-p46/",
"rss": "https://feeds.npr.org/344098539/podcast.xml"
}
},
"weekend-edition-saturday": {
"id": "weekend-edition-saturday",
"title": "Weekend Edition Saturday",
"info": "Weekend Edition Saturday wraps up the week's news and offers a mix of analysis and features on a wide range of topics, including arts, sports, entertainment, and human interest stories. The two-hour program is hosted by NPR's Peabody Award-winning Scott Simon.",
"airtime": "SAT 5am-10am",
"imageSrc": "https://cdn.kqed.org/wp-content/uploads/2024/04/Weekend-Edition-Podcast-Tile-360x360-1.jpg",
"officialWebsiteLink": "https://www.npr.org/programs/weekend-edition-saturday/",
"meta": {
"site": "news",
"source": "npr"
},
"link": "/radio/program/weekend-edition-saturday"
},
"weekend-edition-sunday": {
"id": "weekend-edition-sunday",
"title": "Weekend Edition Sunday",
"info": "Weekend Edition Sunday features interviews with newsmakers, artists, scientists, politicians, musicians, writers, theologians and historians. The program has covered news events from Nelson Mandela's 1990 release from a South African prison to the capture of Saddam Hussein.",
"airtime": "SUN 5am-10am",
"imageSrc": "https://cdn.kqed.org/wp-content/uploads/2024/04/Weekend-Edition-Podcast-Tile-360x360-1.jpg",
"officialWebsiteLink": "https://www.npr.org/programs/weekend-edition-sunday/",
"meta": {
"site": "news",
"source": "npr"
},
"link": "/radio/program/weekend-edition-sunday"
}
},
"racesReducer": {},
"racesGenElectionReducer": {},
"racesGenElection2026Reducer": {},
"radioSchedulesReducer": {},
"listsReducer": {},
"recallGuideReducer": {
"intros": {},
"policy": {},
"candidates": {}
},
"savedArticleReducer": {
"articles": [],
"status": {}
},
"newslettersReducer": {
"isFetching": false,
"fetchFailed": false,
"hasFetched": false,
"newsletters": {},
"isSubscribing": false,
"isUnsubscribing": false,
"subscribedNewsletters": {}
},
"termsReducer": {
"about": {
"name": "About",
"type": "terms",
"id": "about",
"slug": "about",
"link": "/about",
"taxonomy": "site"
},
"arts": {
"name": "Arts & Culture",
"grouping": [
"arts",
"pop",
"trulyca"
],
"description": "KQED Arts provides daily in-depth coverage of the Bay Area's music, art, film, performing arts, literature and arts news, as well as cultural commentary and criticism.",
"type": "terms",
"id": "arts",
"slug": "arts",
"link": "/arts",
"taxonomy": "site"
},
"artschool": {
"name": "Art School",
"parent": "arts",
"type": "terms",
"id": "artschool",
"slug": "artschool",
"link": "/artschool",
"taxonomy": "site"
},
"bayareabites": {
"name": "KQED food",
"grouping": [
"food",
"bayareabites",
"checkplease"
],
"parent": "food",
"type": "terms",
"id": "bayareabites",
"slug": "bayareabites",
"link": "/food",
"taxonomy": "site"
},
"bayareahiphop": {
"name": "Bay Area Hiphop",
"type": "terms",
"id": "bayareahiphop",
"slug": "bayareahiphop",
"link": "/bayareahiphop",
"taxonomy": "site"
},
"campaign21": {
"name": "Campaign 21",
"type": "terms",
"id": "campaign21",
"slug": "campaign21",
"link": "/campaign21",
"taxonomy": "site"
},
"careers": {
"name": "Careers",
"type": "terms",
"id": "careers",
"slug": "careers",
"link": "/careers",
"taxonomy": "site"
},
"checkplease": {
"name": "KQED food",
"grouping": [
"food",
"bayareabites",
"checkplease"
],
"parent": "food",
"type": "terms",
"id": "checkplease",
"slug": "checkplease",
"link": "/food",
"taxonomy": "site"
},
"education": {
"name": "Education",
"grouping": [
"education"
],
"type": "terms",
"id": "education",
"slug": "education",
"link": "/education",
"taxonomy": "site"
},
"elections": {
"name": "Elections",
"type": "terms",
"id": "elections",
"slug": "elections",
"link": "/elections",
"taxonomy": "site"
},
"events": {
"name": "Events",
"type": "terms",
"id": "events",
"slug": "events",
"link": "/events",
"taxonomy": "site"
},
"event": {
"name": "Event",
"alias": "events",
"type": "terms",
"id": "event",
"slug": "event",
"link": "/event",
"taxonomy": "site"
},
"filmschoolshorts": {
"name": "Film School Shorts",
"type": "terms",
"id": "filmschoolshorts",
"slug": "filmschoolshorts",
"link": "/filmschoolshorts",
"taxonomy": "site"
},
"food": {
"name": "KQED food",
"grouping": [
"food",
"bayareabites",
"checkplease"
],
"type": "terms",
"id": "food",
"slug": "food",
"link": "/food",
"taxonomy": "site"
},
"forum": {
"name": "Forum",
"relatedContentQuery": "posts/forum?",
"parent": "news",
"type": "terms",
"id": "forum",
"slug": "forum",
"link": "/forum",
"taxonomy": "site"
},
"futureofyou": {
"name": "Future of You",
"grouping": [
"science",
"futureofyou"
],
"parent": "science",
"type": "terms",
"id": "futureofyou",
"slug": "futureofyou",
"link": "/futureofyou",
"taxonomy": "site"
},
"jpepinheart": {
"name": "KQED food",
"relatedContentQuery": "posts/food,bayareabites,checkplease",
"parent": "food",
"type": "terms",
"id": "jpepinheart",
"slug": "jpepinheart",
"link": "/food",
"taxonomy": "site"
},
"liveblog": {
"name": "Live Blog",
"type": "terms",
"id": "liveblog",
"slug": "liveblog",
"link": "/liveblog",
"taxonomy": "site"
},
"livetv": {
"name": "Live TV",
"parent": "tv",
"type": "terms",
"id": "livetv",
"slug": "livetv",
"link": "/livetv",
"taxonomy": "site"
},
"lowdown": {
"name": "The Lowdown",
"relatedContentQuery": "posts/lowdown?",
"parent": "news",
"type": "terms",
"id": "lowdown",
"slug": "lowdown",
"link": "/lowdown",
"taxonomy": "site"
},
"mindshift": {
"name": "Mindshift",
"parent": "news",
"description": "MindShift explores the future of education by highlighting the innovative – and sometimes counterintuitive – ways educators and parents are helping all children succeed.",
"type": "terms",
"id": "mindshift",
"slug": "mindshift",
"link": "/mindshift",
"taxonomy": "site"
},
"news": {
"name": "News",
"grouping": [
"news",
"forum"
],
"type": "terms",
"id": "news",
"slug": "news",
"link": "/news",
"taxonomy": "site"
},
"newsletters": {
"name": "newsletters",
"type": "terms",
"id": "newsletters",
"slug": "newsletters",
"link": "/newsletters",
"taxonomy": "site"
},
"perspectives": {
"name": "Perspectives",
"parent": "radio",
"type": "terms",
"id": "perspectives",
"slug": "perspectives",
"link": "/perspectives",
"taxonomy": "site"
},
"podcasts": {
"name": "Podcasts",
"type": "terms",
"id": "podcasts",
"slug": "podcasts",
"link": "/podcasts",
"taxonomy": "site"
},
"pop": {
"name": "Pop",
"parent": "arts",
"type": "terms",
"id": "pop",
"slug": "pop",
"link": "/pop",
"taxonomy": "site"
},
"pressroom": {
"name": "Pressroom",
"type": "terms",
"id": "pressroom",
"slug": "pressroom",
"link": "/pressroom",
"taxonomy": "site"
},
"quest": {
"name": "Quest",
"parent": "science",
"type": "terms",
"id": "quest",
"slug": "quest",
"link": "/quest",
"taxonomy": "site"
},
"radio": {
"name": "Radio",
"grouping": [
"forum",
"perspectives"
],
"description": "Listen to KQED Public Radio – home of Forum and The California Report – on 88.5 FM in San Francisco, 89.3 FM in Sacramento, 88.3 FM in Santa Rosa and 88.1 FM in Martinez.",
"type": "terms",
"id": "radio",
"slug": "radio",
"link": "/radio",
"taxonomy": "site"
},
"root": {
"name": "KQED",
"image": "https://ww2.kqed.org/app/uploads/2020/02/KQED-OG-Image@1x.png",
"imageWidth": 1200,
"imageHeight": 630,
"headData": {
"title": "KQED | News, Radio, Podcasts, TV | Public Media for Northern California",
"description": "KQED provides public radio, television, and independent reporting on issues that matter to the Bay Area. We’re the NPR and PBS member station for Northern California."
},
"type": "terms",
"id": "root",
"slug": "root",
"link": "/root",
"taxonomy": "site"
},
"science": {
"name": "Science",
"grouping": [
"science",
"futureofyou"
],
"description": "KQED Science brings you award-winning science and environment coverage from the Bay Area and beyond.",
"type": "terms",
"id": "science",
"slug": "science",
"link": "/science",
"taxonomy": "site"
},
"stateofhealth": {
"name": "State of Health",
"parent": "science",
"type": "terms",
"id": "stateofhealth",
"slug": "stateofhealth",
"link": "/stateofhealth",
"taxonomy": "site"
},
"support": {
"name": "Support",
"type": "terms",
"id": "support",
"slug": "support",
"link": "/support",
"taxonomy": "site"
},
"thedolist": {
"name": "The Do List",
"parent": "arts",
"type": "terms",
"id": "thedolist",
"slug": "thedolist",
"link": "/thedolist",
"taxonomy": "site"
},
"trulyca": {
"name": "Truly CA",
"grouping": [
"arts",
"pop",
"trulyca"
],
"parent": "arts",
"type": "terms",
"id": "trulyca",
"slug": "trulyca",
"link": "/trulyca",
"taxonomy": "site"
},
"tv": {
"name": "TV",
"type": "terms",
"id": "tv",
"slug": "tv",
"link": "/tv",
"taxonomy": "site"
},
"voterguide": {
"name": "Voter Guide",
"parent": "elections",
"alias": "elections",
"type": "terms",
"id": "voterguide",
"slug": "voterguide",
"link": "/voterguide",
"taxonomy": "site"
},
"guiaelectoral": {
"name": "Guia Electoral",
"parent": "elections",
"alias": "elections",
"type": "terms",
"id": "guiaelectoral",
"slug": "guiaelectoral",
"link": "/guiaelectoral",
"taxonomy": "site"
},
"news_1758": {
"type": "terms",
"id": "news_1758",
"meta": {
"index": "terms_1716263798",
"site": "news",
"id": "1758",
"found": true
},
"relationships": {},
"featImg": null,
"name": "Economy",
"description": null,
"taxonomy": "category",
"headData": {
"twImgId": null,
"twTitle": null,
"ogTitle": null,
"ogImgId": null,
"twDescription": null,
"description": "Full coverage of the economy",
"title": "Economy Archives | KQED News",
"ogDescription": null
},
"ttid": 2648,
"slug": "economy",
"isLoading": false,
"link": "/news/category/economy"
},
"news_34168": {
"type": "terms",
"id": "news_34168",
"meta": {
"index": "terms_1716263798",
"site": "news",
"id": "34168",
"found": true
},
"relationships": {},
"name": "Guides and Explainers",
"slug": "guides-and-explainers",
"taxonomy": "category",
"description": null,
"featImg": null,
"headData": {
"title": "Guides and Explainers Archives | KQED News",
"description": null,
"ogTitle": null,
"ogDescription": null,
"ogImgId": null,
"twTitle": null,
"twDescription": null,
"twImgId": null
},
"ttid": 34185,
"isLoading": false,
"link": "/news/category/guides-and-explainers"
},
"news_8": {
"type": "terms",
"id": "news_8",
"meta": {
"index": "terms_1716263798",
"site": "news",
"id": "8",
"found": true
},
"relationships": {},
"featImg": null,
"name": "News",
"description": null,
"taxonomy": "category",
"headData": {
"twImgId": null,
"twTitle": null,
"ogTitle": null,
"ogImgId": null,
"twDescription": null,
"description": null,
"title": "News Archives | KQED News",
"ogDescription": null
},
"ttid": 8,
"slug": "news",
"isLoading": false,
"link": "/news/category/news"
},
"news_10": {
"type": "terms",
"id": "news_10",
"meta": {
"index": "terms_1716263798",
"site": "news",
"id": "10",
"found": true
},
"relationships": {},
"featImg": null,
"name": "Sports",
"description": null,
"taxonomy": "category",
"headData": {
"twImgId": null,
"twTitle": null,
"ogTitle": null,
"ogImgId": null,
"twDescription": null,
"description": null,
"title": "Sports Archives | KQED News",
"ogDescription": null
},
"ttid": 10,
"slug": "sports",
"isLoading": false,
"link": "/news/category/sports"
},
"news_32707": {
"type": "terms",
"id": "news_32707",
"meta": {
"index": "terms_1716263798",
"site": "news",
"id": "32707",
"found": true
},
"relationships": {},
"featImg": null,
"name": "audience-news",
"description": null,
"taxonomy": "tag",
"headData": {
"twImgId": null,
"twTitle": null,
"ogTitle": null,
"ogImgId": null,
"twDescription": null,
"description": null,
"title": "audience-news Archives | KQED News",
"ogDescription": null
},
"ttid": 32724,
"slug": "audience-news",
"isLoading": false,
"link": "/news/tag/audience-news"
},
"news_269": {
"type": "terms",
"id": "news_269",
"meta": {
"index": "terms_1716263798",
"site": "news",
"id": "269",
"found": true
},
"relationships": {},
"featImg": null,
"name": "BART",
"description": null,
"taxonomy": "tag",
"headData": {
"twImgId": null,
"twTitle": null,
"ogTitle": null,
"ogImgId": null,
"twDescription": null,
"description": null,
"title": "BART Archives | KQED News",
"ogDescription": null
},
"ttid": 277,
"slug": "bart",
"isLoading": false,
"link": "/news/tag/bart"
},
"news_1386": {
"type": "terms",
"id": "news_1386",
"meta": {
"index": "terms_1716263798",
"site": "news",
"id": "1386",
"found": true
},
"relationships": {},
"featImg": null,
"name": "Bay Area",
"description": null,
"taxonomy": "tag",
"headData": {
"twImgId": null,
"twTitle": null,
"ogTitle": null,
"ogImgId": null,
"twDescription": null,
"description": null,
"title": "Bay Area Archives | KQED News",
"ogDescription": null
},
"ttid": 1398,
"slug": "bay-area",
"isLoading": false,
"link": "/news/tag/bay-area"
},
"news_3651": {
"type": "terms",
"id": "news_3651",
"meta": {
"index": "terms_1716263798",
"site": "news",
"id": "3651",
"found": true
},
"relationships": {},
"featImg": null,
"name": "California economy",
"description": null,
"taxonomy": "tag",
"headData": {
"twImgId": null,
"twTitle": null,
"ogTitle": null,
"ogImgId": null,
"twDescription": null,
"description": null,
"title": "California economy Archives | KQED News",
"ogDescription": null
},
"ttid": 3669,
"slug": "california-economy",
"isLoading": false,
"link": "/news/tag/california-economy"
},
"news_18545": {
"type": "terms",
"id": "news_18545",
"meta": {
"index": "terms_1716263798",
"site": "news",
"id": "18545",
"found": true
},
"relationships": {},
"featImg": null,
"name": "Economy",
"description": null,
"taxonomy": "tag",
"headData": {
"twImgId": null,
"twTitle": null,
"ogTitle": null,
"ogImgId": null,
"twDescription": null,
"description": null,
"title": "Economy Archives | KQED News",
"ogDescription": null
},
"ttid": 1771,
"slug": "economy",
"isLoading": false,
"link": "/news/tag/economy"
},
"news_35888": {
"type": "terms",
"id": "news_35888",
"meta": {
"index": "terms_1716263798",
"site": "news",
"id": "35888",
"found": true
},
"relationships": {},
"name": "featured-audience-news",
"slug": "featured-audience-news",
"taxonomy": "tag",
"description": null,
"featImg": null,
"headData": {
"title": "featured-audience-news | KQED News",
"description": null,
"ogTitle": null,
"ogDescription": null,
"ogImgId": null,
"twTitle": null,
"twDescription": null,
"twImgId": null
},
"ttid": 35905,
"isLoading": false,
"link": "/news/tag/featured-audience-news"
},
"news_27626": {
"type": "terms",
"id": "news_27626",
"meta": {
"index": "terms_1716263798",
"site": "news",
"id": "27626",
"found": true
},
"relationships": {},
"featImg": null,
"name": "featured-news",
"description": null,
"taxonomy": "tag",
"headData": {
"twImgId": null,
"twTitle": null,
"ogTitle": null,
"ogImgId": null,
"twDescription": null,
"description": null,
"title": "featured-news Archives | KQED News",
"ogDescription": null
},
"ttid": 27643,
"slug": "featured-news",
"isLoading": false,
"link": "/news/tag/featured-news"
},
"news_38": {
"type": "terms",
"id": "news_38",
"meta": {
"index": "terms_1716263798",
"site": "news",
"id": "38",
"found": true
},
"relationships": {},
"featImg": null,
"name": "San Francisco",
"description": null,
"taxonomy": "tag",
"headData": {
"twImgId": null,
"twTitle": null,
"ogTitle": null,
"ogImgId": null,
"twDescription": null,
"description": null,
"title": "San Francisco Archives | KQED News",
"ogDescription": null
},
"ttid": 58,
"slug": "san-francisco",
"isLoading": false,
"link": "/news/tag/san-francisco"
},
"news_783": {
"type": "terms",
"id": "news_783",
"meta": {
"index": "terms_1716263798",
"site": "news",
"id": "783",
"found": true
},
"relationships": {},
"featImg": null,
"name": "Super Bowl",
"description": null,
"taxonomy": "tag",
"headData": {
"twImgId": null,
"twTitle": null,
"ogTitle": null,
"ogImgId": null,
"twDescription": null,
"description": null,
"title": "Super Bowl Archives | KQED News",
"ogDescription": null
},
"ttid": 792,
"slug": "super-bowl",
"isLoading": false,
"link": "/news/tag/super-bowl"
},
"news_33740": {
"type": "terms",
"id": "news_33740",
"meta": {
"index": "terms_1716263798",
"site": "news",
"id": "33740",
"found": true
},
"relationships": {},
"featImg": null,
"name": "Events",
"description": null,
"taxonomy": "interest",
"headData": {
"twImgId": null,
"twTitle": null,
"ogTitle": null,
"ogImgId": null,
"twDescription": null,
"description": null,
"title": "Events Archives | KQED News",
"ogDescription": null
},
"ttid": 33757,
"slug": "events",
"isLoading": false,
"link": "/news/interest/events"
},
"news_33733": {
"type": "terms",
"id": "news_33733",
"meta": {
"index": "terms_1716263798",
"site": "news",
"id": "33733",
"found": true
},
"relationships": {},
"featImg": null,
"name": "News",
"description": null,
"taxonomy": "interest",
"headData": {
"twImgId": null,
"twTitle": null,
"ogTitle": null,
"ogImgId": null,
"twDescription": null,
"description": null,
"title": "News Archives | KQED News",
"ogDescription": null
},
"ttid": 33750,
"slug": "news",
"isLoading": false,
"link": "/news/interest/news"
},
"news_33729": {
"type": "terms",
"id": "news_33729",
"meta": {
"index": "terms_1716263798",
"site": "news",
"id": "33729",
"found": true
},
"relationships": {},
"featImg": null,
"name": "San Francisco",
"description": null,
"taxonomy": "interest",
"headData": {
"twImgId": null,
"twTitle": null,
"ogTitle": null,
"ogImgId": null,
"twDescription": null,
"description": null,
"title": "San Francisco Archives | KQED News",
"ogDescription": null
},
"ttid": 33746,
"slug": "san-francisco",
"isLoading": false,
"link": "/news/interest/san-francisco"
}
},
"userPermissionsReducer": {
"wpLoggedIn": false
},
"eventsReducer": {},
"fssReducer": {},
"tvDailyScheduleReducer": {},
"tvWeeklyScheduleReducer": {},
"tvPrimetimeScheduleReducer": {},
"tvMonthlyScheduleReducer": {},
"userAccountReducer": {
"user": {
"email": null,
"emailStatus": "EMAIL_UNVALIDATED",
"loggedStatus": "LOGGED_OUT",
"loggingChecked": false,
"articles": [],
"firstName": null,
"lastName": null,
"phoneNumber": null,
"fetchingMembership": false,
"membershipError": false,
"memberships": [
{
"id": null,
"startDate": null,
"firstName": null,
"lastName": null,
"familyNumber": null,
"memberNumber": null,
"memberSince": null,
"expirationDate": null,
"pfsEligible": false,
"isSustaining": false,
"membershipLevel": "Prospect",
"membershipStatus": "Non Member",
"lastGiftDate": null,
"renewalDate": null,
"lastDonationAmount": null
}
]
},
"authModal": {
"isOpen": false,
"view": "LANDING_VIEW"
},
"error": null
},
"youthMediaReducer": {},
"checkPleaseReducer": {
"filterData": {
"region": {
"key": "Restaurant Region",
"filters": [
"Any Region"
]
},
"cuisine": {
"key": "Restaurant Cuisine",
"filters": [
"Any Cuisine"
]
}
},
"restaurantDataById": {},
"restaurantIdsSorted": [],
"error": null
},
"userAgentReducer": {
"userAgent": "Mozilla/5.0 AppleWebKit/537.36 (KHTML, like Gecko; compatible; ClaudeBot/1.0; +claudebot@anthropic.com)",
"isBot": true
}
}