upper waypoint

The Numbers Behind Bay Area Vote to Raise Bridge Tolls

Save ArticleSave Article
Failed to save article

Please try again

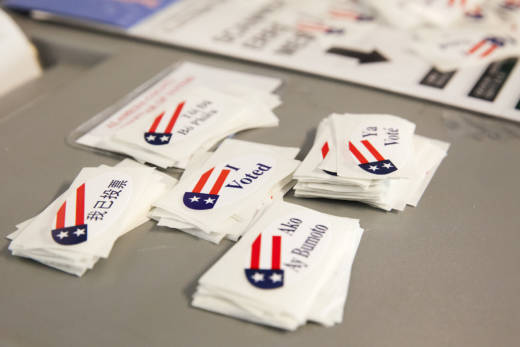
Multilingual 'I Voted' stickers at a polling place in Berkeley.  (Brittany Hosea-Small/KQED)

Update, July 10, 11:20 a.m.: The table below has been updated with final county election numbers reported to the state.

  • First: Marin County's recent returns show it to have had the highest voter turnout in the region -- 55.9 percent -- and to have expressed stronger support for Regional Measure 3 than was first apparent. The latest tally shows Marin to hove joined San Francisco and Santa Clara counties in approving the toll hikes by 60 percent or more.
  • Second: The nearly final returns indicate that Regional Measure 3 would have passed -- by an eyelash -- without the lopsided support from Santa Clara and San Francisco counties. Subtracting those two counties from the total, the vote from the seven remaining counties was something like 50.3 percent yes. That figure is subject to future tweaking as the last votes are counted.
  • Third: One large-ish chunk of votes is still not reflected in the vote totals: Sonoma County has not reported vote totals since June 6, the day after the election. Based on Sonoma's much higher than average turnout in the 2014 primary and overall regional turnout this year -- close to 42 percent -- the county could still have 35,000 to 40,000 votes to report. At last report, Sonoma had voted 52.8 percent yes for the toll hikes.

Original post:

W

e can't say we've heard of anyone -- or anyone else -- who's still sitting on the edge of their seats waiting for the final results of the nine-county vote on Regional Measure 3. That's the measure to raise tolls on Bay Area bridges by three bucks between now and 2025 to pay for transit and highway projects.

Since I am sitting on the edge of my seat, I can tell you that as of 5:30 p.m. Wednesday the measure is ahead with a tally of 783,791 yes (54.9 percent), and 642,492 no (45.1 percent). That tally isn't final. But the roughly 141,000-vote margin means that unless someone somewhere has been hoarding a couple of BART trains packed with "no" ballots, the bridge toll has passed. Period.

The measure got a yes vote in seven of nine counties, with Contra Costa and Solano counties voting no by large margins. The size of the winning majority is due to relatively high turnout and overwhelming support in San Francisco and Santa Clara counties. Together, voters in those two counties approved RM3 by just over 146,000 votes.
Sponsored


A couple of observations on the numbers as they stand now:

1. Uncounted ballots: It's unknown how many votes are left to count regionwide -- but we can guess. So far, elections offices in the nine counties have reported counting 1.52 million ballots, representing 39.1 percent of the region's 3.9 million registered voters. If you assume that the total nine-county turnout gets to 40 percent, that would mean there are at most 80,000 votes left to count.

2. Turnout: The current 39.1 percent participation of registered voters doesn't sound like anything to write home about. The statewide turnout for the 2016 presidential election, by contrast, was 75 percent. But masses of voters ignore the primaries -- especially off-year primaries, when no presidential candidates appear on the ballot. In 2014, for instance, turnout in the nine Bay Area counties was an aggregate 30 percent (statewide, the figure was 25 percent). So, the prospect of 40 percent participation after all votes are counted? That's a raging torrent of turnout.

3. Turnout hotspots: San Francisco, thanks to a contentious mayor's race, will probably wind up with close to 53 percent turnout -- the highest in the Bay Area and the only county to come close to exceeding 50 percent. Santa Clara and Marin counties are next, with turnout in the low 40s.

4. Turnout deadspots: The race for lowest turnout county is still too close to call. San Mateo and Sonoma counties still report lower than 30 percent turnout -- but they have been slow to count ballots and report results, and it's likely to be the end of the week before we have a better picture of their close-to-final numbers.


5. The "no" counties: The result in the "no" counties was in line with their voting history on past transportation measures. Solano County gave the weakest support for Regional Measure 1 in 1988, which standardized tolls on the Bay Area's seven state-owned bridge at $1. While the rest of the seven counties that voted in that election gave better than two-thirds support, Solano voted 58 percent "yes." In 2004, Solano County voted 59 percent no on the $1 toll increase proposed by Regional Measure 2. In 2016, the county's voters also rejected a half-cent sales tax increase for local transportation projects and gave less than 60 percent support to BART's $3.5 billion bond measure (it needed two-thirds to pass -- and got it because of strong support in the other two BART counties -- Alameda and San Francisco). The result on Regional Measure 3: 70 percent "no."

Contra Costa County's support for transportation measures has also trended down. Voters supported Regional Measure 1 with a 68 percent yes vote, but gave just 51 percent support to Regional Measure 2. The county's voters also rejected a half-cent transportation sales tax in 2016. The Measure 3 result: 55 percent "no."

6. The "super yes" counties: The strong support for the bridge toll increase in Santa Clara and San Francisco counties bears out their past strong support for transportation measures. San Francisco gave 69 percent support to both RM1 and RM2 -- and 65 percent to RM3. City voters also enthusiastically supported the 2016 BART bond measure (though in the same election they soundly rejected a sales tax increase that would have been split between transportation and homeless services). Santa Clara County has given strong support to all three regional measures and to countywide sales taxes for BART and other transportation project.

7. Counterfactual: What if the "super yes" counties had been less "yes"? Some Regional Measure 3 critics say that the strong support in Santa Clara and San Francisco counties suggests the vote was unfairly stacked against counties that were less enthusiastic about the new tolls. If you took those two counties out of the mix, they point out, the measure would have lost.

OK, but: The two counties are home to roughly 2.8 million residents. There's no reason to exclude them simply because they've voted in large numbers for toll increases. It might be more realistic to look at how the regionwide results might look if San Francisco and Santa Clara hadn't voted so strongly in favor of RM3. What if voters there had voted yes at the same rate as the county with the median result?

Alameda County, which voted 53.9 percent "yes," proved to be the median of the nine counties in this election (four counties gave stronger support, four counties expressed lower support). If Santa Clara and San Francisco had voted yes at Alameda's 53.9 percent rate, the measure would still have passed with a 51.3 percent yes vote.

Sponsored

And if the "super yes" counties had voted for RM3 at the lowest rate of the five other yes counties -- Napa's 50.7 percent -- the toll increase would still have passed, though only with 50.08 percent of the vote.

lower waypoint
next waypoint
California Legislature Halts 'Science of Reading' Mandate, Prompting Calls for Thorough ReviewProtesters Shut Down I-880 Freeway in Oakland as Part of 'Economic Blockade' for GazaForced Sterilization Survivors Undertake Own Healing After Feeling 'Silenced Again' by StateHalf Moon Bay Prepares to Break Ground on Farmworker HousingHow Aaron Peskin Shakes Up S.F.’s Mayoral RaceSilicon Valley Readies for Low-Simitian House Race Recount — but How Does It Work?Feds Abruptly Close East Bay Women’s Prison Following Sexual Abuse ScandalsRecall of Alameda County District Attorney Pamela Price Qualifies for a VotePlanned Parenthood Northern California Workers Unionize With SEIU Local 1021are u addicted to ur phone