Originally posted Jan. 7, 2017
I
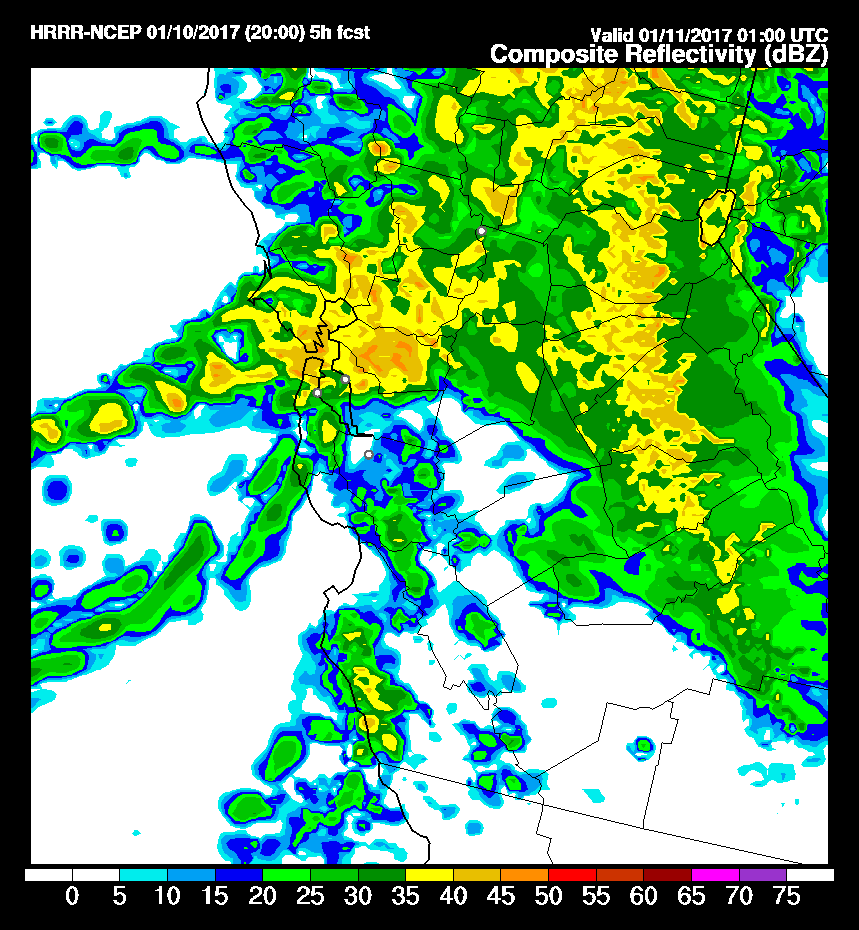
f you're obsessively following the latest rainy wallop hitting the Bay Are, here are three views that will show you the action as rendered in one case by Doppler radar and in the others by a combination of weather models, supercomputers and digital visualization geniuses.
1. San Francisco Bay Area Doppler radar, via Weather Underground: This is old hat if you're a weather watcher. For online news producers, this rendering of our regional weather radar is great because it's easy to embed and it updates every time you refresh the page.
[http_redir]
2. Earth: This is a visualization of precipitation for the next three hours based on output from the National Centers for Environmental Prediction Global Forecasting System (GFS, for short). You can find a little background on the visualization here: California's Storm: The Coolest View You Will See Today. A user tip: Experiment with the visualization. Click on the label that says "Earth" in the bottom left-hand corner, and you'll open up a menu that will give you a choice of a variety of different views -- of surface winds, for instance, or for winds at the 850-millibar level (about 5,000 feet above sea level).
[http_redir]