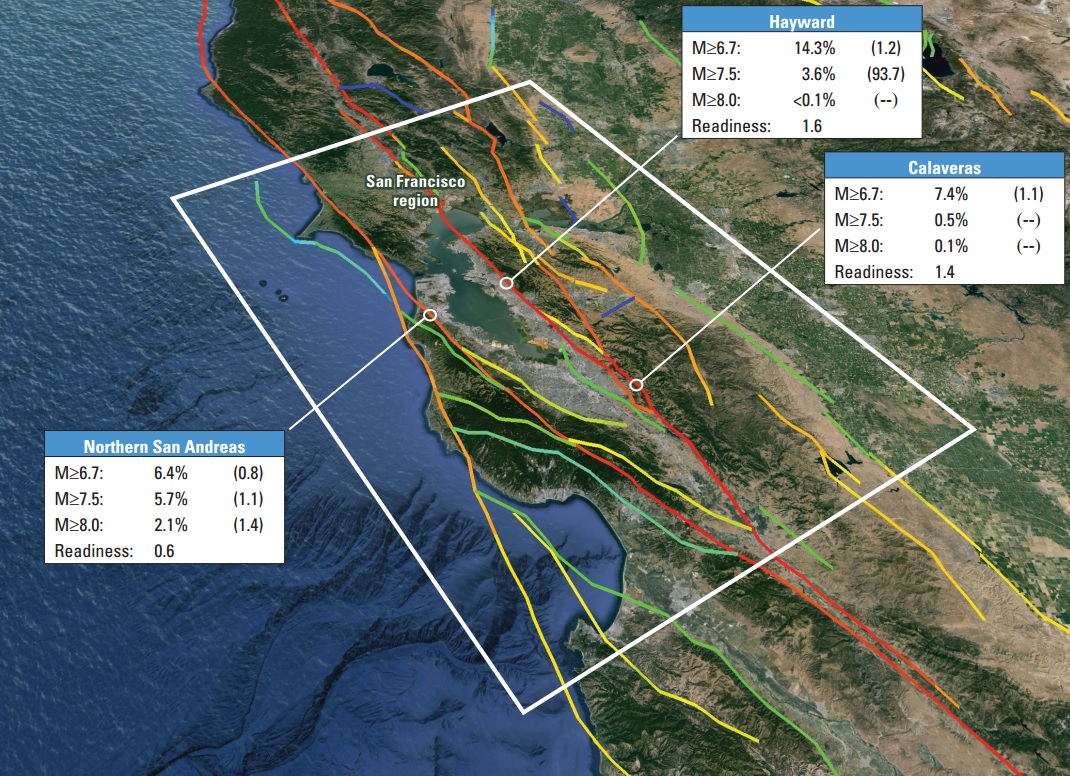
And for local interest: The new model says the highest probability of a temblor of 6.7 magnitude or above is on the Hayward Fault, which runs from Point Pinole, north of Richmond, south along the face of the East Bay Hills to Fremont. The last major quake on the fault, estimated between 6.8 and 7.0 magnitude, occurred in 1868. UCERF3 calculates the likelihood of a repeat sometime in the next 30 years at 14.3 percent.
The Calaveras Fault, which runs through the East Bay Hills from near Danville to east of Gilroy, has a 7.4 percent chance of a 6.7 quake in the next 30 years, the model says. The San Andreas, which produced the 1906 disaster, has a 6.4 percent chance of a 6.7 quake in the next three decades.
The San Andreas, alone among the major Bay Area faults, has an appreciable likelihood of bigger quakes: a 5.7 percent chance of a 7.5 quake and a 2.1 percent chance of an 8.0 quake in the next 30 years.
One more set of percentages: The new forecast says the likelihood of a 6.0 earthquake somewhere in the Bay Area in the 30 years from 2014 onward is 100 percent. (We've already had one: last August's South Napa Earthquake.) The likelihood of a 6.7 shake in the region over the next three decades: 72 percent -- an increase from the 63 percent likelihood calculated in 2007 (the last earthquake in that range nearby: Loma Prieta, 1989). The 30-year probability of a 7-magnitude temblor hereabouts: 51 percent.
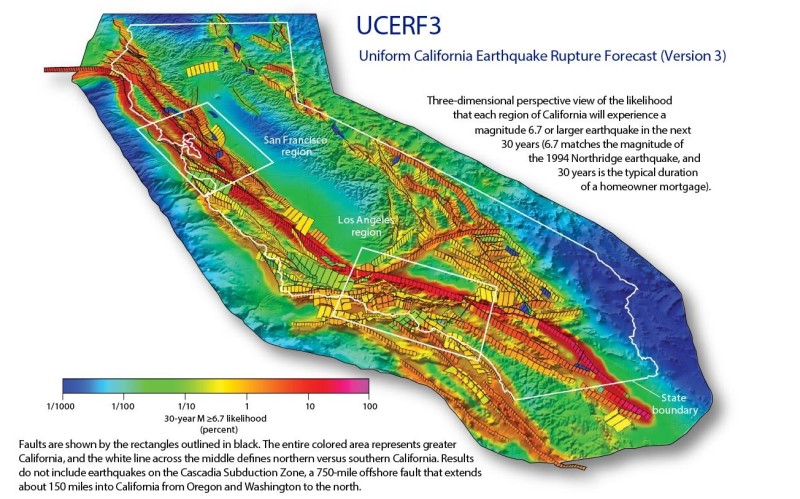
The UCERF3 model calculations are based on scientists' newly refined knowledge about the dense web of faults underlying much of California and about their behavior.
The USGS notes that when researchers from a working group on earthquake probabilities issued their first forecast, in 1988, their model considered only 16 faults throughout the state. The Northridge Earthquake, occurring on a previously unrecognized fault, spurred a new effort to search for new faults and to investigate their potential for causing significant damage. By 2007, when the last model forecast was released, about 200 California faults had been discovered. UCERF3 includes 350.
As important as filling in the blanks in the state's seismic map has been research into how faults rupture. The new model accounts for "multifault" ruptures: temblors that have leaped from one fault to another.
"One of the limitations of our previous model was that we treated each of the faults as separate and isolated, said USGS scientist Ned Field, the lead author of a new paper on UCERF3. "The new model is much more sophisticated in acknowledging the complete interconnectedness of the faults in California."
Speaking to KQED's Mina Kim, Field hastened to add that, the new forecast notwithstanding, powerful multifault earthquakes, those of magnitude 8 and above, "are exceedingly rare. These are on the order of every 500 years, so we're not saying these are going to happen very often."
So, aside from the interesting research findings and your midnight quake terrors, why do you care about all this?
Field said the public should take the new forecast "as a reminder that they should live every day like it will be the day of the big one." He also said the new research could aid public agencies in designing critical facilities like hospitals, schools and bridges.
Field also noted that the new forecast represents a lower risk for relatively simple structures like single-family homes and that could lead to lower rates for earthquake insurance.
The USGS partner organizations that contributed to the new model include the Southern California Earthquake Center, the California Geological Survey and the California Earthquake Authority.