The map below shows state-by-state felon voting laws and population impacts as reported by the The Sentencing Project, based on 2010 data. Note: among the states that deny voting rights to some felons who have completed the entirety of their sentences (including parole), restrictions vary significantly, and often depend on the severity of the crime.
[See article and infographic below map]
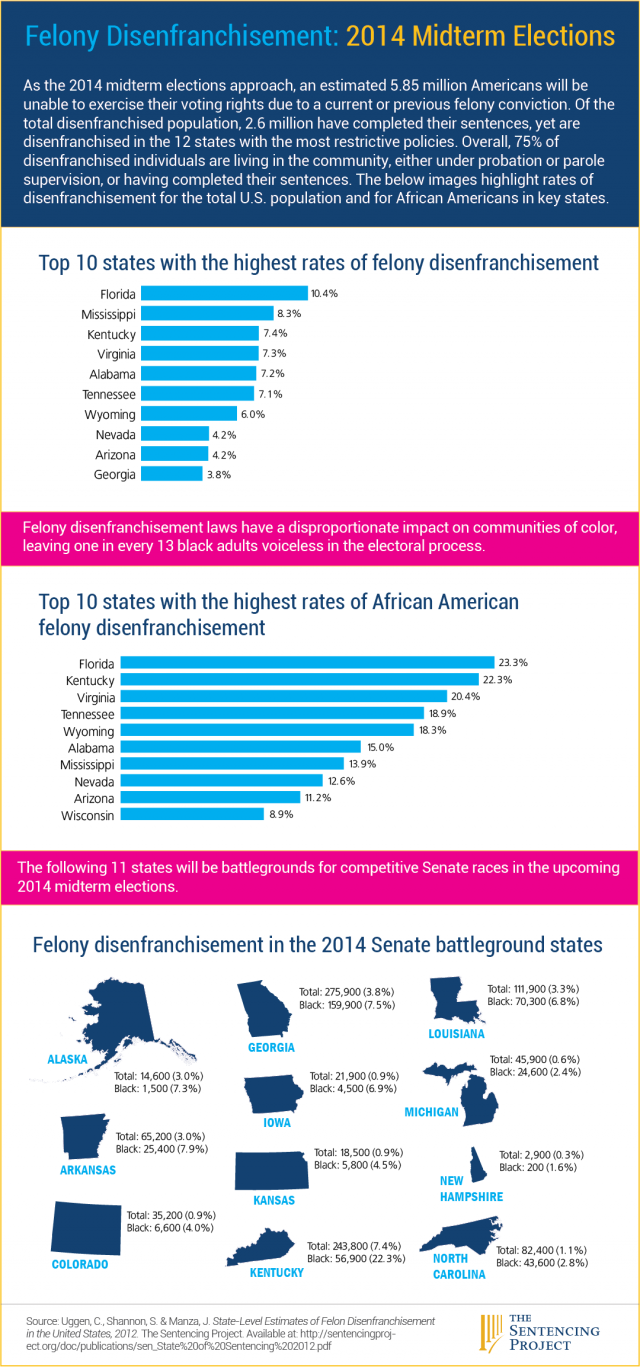
Roughly 5.85 million Americans are not able to vote in the midterm elections due to current or previous felony convictions, according to the Sentencing Project, a criminal justice advocacy group. Of this population, about 75 percent live in the community, and almost half -- an estimated 2.6 million people -- have completed their sentences altogether but remain disenfranchised in the 12 states with the most restrictive voting policies.
In Florida the state with the highest felon disenfranchisement rate, about 1 in 10 voting-age residents can't vote because of current or previous sentences, according to the group's report.
