Everyone looks forward to Burning Man, but for different reasons. You either can't wait to get back to the playa or you can't wait to enjoy the city minus thousands of people (no brunch lines! more space to swing your arms in yoga classes!). San Franciscans talk a lot about this mass exodus, but is it really that major?
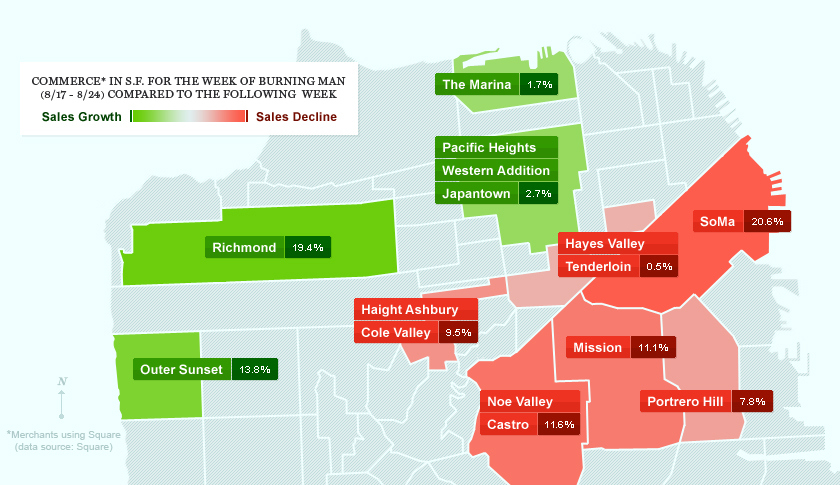
According to Fortune, who used data from Square to chart the economic impact during the week of Burning Man, that depends on where you live. SOMA (a.k.a. techie central) saw the biggest dip at 20.6%, followed by Noe Valley/Castro at 11.6% and the Mission at 11.1%. Hoods that are not into the trek to northern Nevada are the Richmond, which saw a 19.4% growth, and the Outer Sunset with a 13.8% increase. While we're at it, someone should make maps of the economic impact of Russian River days and that Beyonce concert.