upper waypoint

It's Official: Bay Area Has Highest Income Inequality in California

Save ArticleSave Article
Failed to save article

Please try again

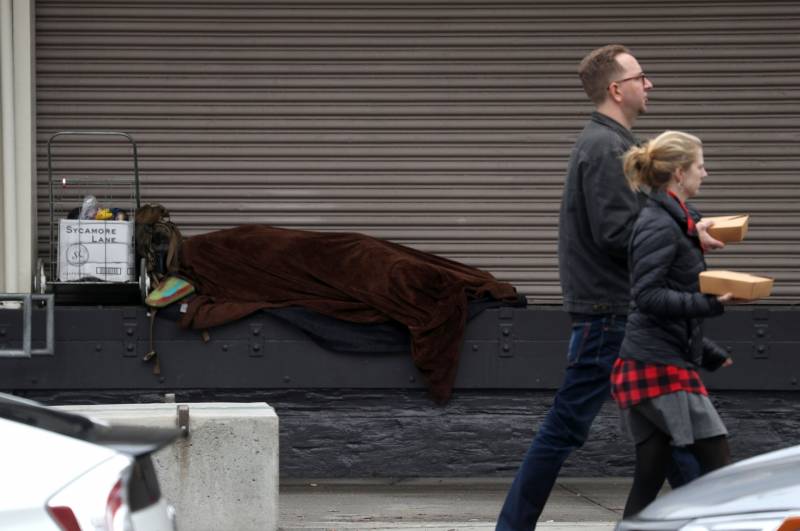
A homeless person sleeps on a loading dock on Dec. 5, 2019, in San Francisco. (Justin Sullivan/Getty Images)

It’s official: The gap between the Bay Area’s haves and have-nots is wider than anywhere else in the state.

Top income earners in the Bay Area make 12.2 times as much as those at the bottom of the economic ladder, according to new research from the Public Policy Institute of California, which analyzed 2018 U.S. Census Bureau data, the most recent available.

Bay Area residents in the 90th percentile of incomes earned $384,000 a year, compared to just $32,000 for those in the bottom 10th percentile.

After the Bay Area, the income gap was widest in the Sacramento region, PPIC found, with the 90th percentile there earning $232,000 and the 10th percentile earning just $19,000. It was narrowest in the Inland Empire region, which includes Imperial, Riverside and San Bernardino counties. There, the 10th percentile earns $20,000 and the 90th makes $190,000.

The divisions have made California one of the most economically unequal states in the country. Nationally, just five other states — the District of Columbia, Missouri, New Mexico, New York and Louisiana — have higher levels of income inequality, according to PPIC.

“Unfortunately, I was looking for more of a story of improvement than we see in this data,” said Sarah E. Bohn, vice president of research at PPIC.

Sponsored

Despite California’s strong economy, low- and middle-income earners have seen fewer gains than those in the top bracket in recent decades. Incomes for families in the 90th percentile have increased 60% since 1980, PPIC found, while incomes for the 10th percentile increased by just 20% during the same time.

“It’s clear that low-income families don’t seem to be able to make as much economic progress as we would like," Bohn said.

More on income inequality

A September analysis of census data from the California Budget and Policy Center found a similar gulf between the state’s rich and poor, but worsening economic outcomes for those at the bottom. Between 2006 and 2018, that report found income for the top 5% of households grew by 18.6%. For households in the bottom 20%, it fell 20%.

PPIC’s analysis did not include figures from individual counties, but 2018 census data shows the widest income disparities in the Bay Area are in San Francisco County, where the top 5% of households makes an average of $808,105 annually, compared with $16,184 for the lowest 20%. San Mateo County had the second-highest income gap in the region, with the richest earning $810,917 per year while the bottom fifth made $25,039.

“Economists think there are incentives to move up the economic ladder, but when the disparities are so large, does that incentive fade away because it’s not possible to make that leap, to invest in the things that move you up?” Bohn asked. “That’s the bigger concern that I have.”

Erica Hellerstein is a journalist with the Mercury News. This article is part of The California Divide, a collaboration among newsrooms examining income inequity and economic survival in California.

lower waypoint
next waypoint
California Law Letting Property Owners Split Lots to Build New Homes Is 'Unconstitutional,' Judge RulesAlameda: The Island That Almost Wasn’tJust Days Left to Apply for California Program That Helps Pay for Your First HouseIn Fresno’s Chinatown, High-Speed Rail Sparks Hope and Debate Within ResidentsUC Regent John Pérez on the Gaza Protests Roiling College CampusesNPR's Sarah McCammon on Leaving the Evangelical ChurchIs California Headed For Another Tax Revolt?KQED Youth Takeover: We’re Getting a WNBA TeamUSC Cancels Main Graduation Ceremony Amid Ongoing Gaza ProtestsThis Literary Expert Reveals the Key Problem Undermining American Education