The DOJ didn't reliably track gun all sales before 2014, but their data on handguns shows a steady increase in sales, from 200,000 in 2010 to 288,331 in 2016 as of the end of July.
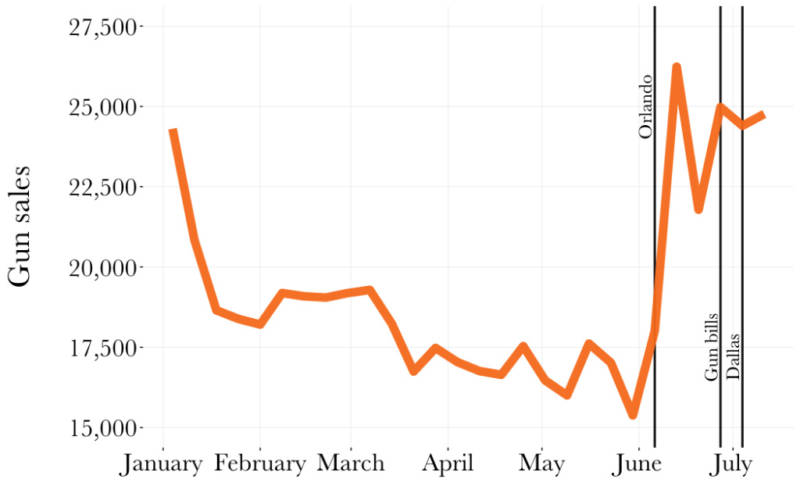
Sales spiking this summer
Nine of 2016's ten busiest days for gun sales have come after a gunman opened fire in an Orlando nightclub on June 12, killing 49 people. The single busiest day was Friday, July 1, 2016, when the DROS system tracked 5,907 sales across California (another 61 sales are still pending).
That same day, Jerry Brown signed a series of six gun control measures. The second biggest day for sales was the next day, when California dealers sold another 5,612 guns.
The third and fourth biggest days for gun sales came the following week on July 7 and 8, in the days after the shooting in Dallas that killed five police officers.
Weekly 2016 gun sales
"The reason why we're seeing another spike in gun sales is fear of gun control," Winkler said. "One of the ironies of gun control is that when reform is proposed, many people go out and purchase guns thinking that those guns may soon be banned."
Winkler said the debate over Proposition 63, the gun control measure supported by Lt. Gov. Gavin Newsom, will keep gun control in the public eye through November. He predicted that will concern Second Amendment advocates, keeping sales at high levels.
Counties buying guns at varying rates
At their current rate, sales are on pace to surpass last year in every one of California's most populous counties. That includes six counties in greater Los Angeles, as well areas across the state, including San Francisco, San Diego and Sacramento counties.
While by far the most guns have been sold in Los Angeles County, the per capita rate is among the lowest in the state.
"People living in urban areas are far less likely to own guns," UCLA's Winkler said. "And far less likely to be the type of gun rights supporter who would go out and buy guns as a protest against gun control laws."
Just under one gun per hundred residents has been sold in Los Angeles this year. Meanwhile, the Inland Empire and more rural northern California counties have higher rates. In Lassen, Shasta, and Trinity counties, gun sales per capita are about four times greater than in L.A.
Gun sales for counties with more than one million residents
| COUNTY |
GUNS SOLD (THROUGH JULY 21) |
GUNS SOLD PER 100 RESIDENTS |
| Sacramento |
28,071 |
1.9 |
| San Bernardino |
38,404 |
1.8 |
| Riverside |
41,736 |
1.8 |
| Contra Costa |
15,357 |
1.4 |
| Orange |
43,690 |
1.4 |
| San Diego |
41,965 |
1.3 |
| Santa Clara |
17,167 |
0.9 |
| Los Angeles |
90,716 |
0.9 |
| Alameda |
13,891 |
0.9 |
The data captures sales through July 21, 2016. Pending sales could add as many as 5,927 guns to the totals. Nearly all pending sales were in July, and could further push up totals following the Dallas shooting.
So far this year 6,355 firearms sales have been denied by the state. That's about one rejection for every 100 sales.
