“It is just so encouraging,” he said. “Even though they’re performing below average, [they] are trending upward.”
One possible reason for the overall improvement, the report points out, is the students’ age. They were 4 when the pandemic started in 2020 and didn’t begin school until after most places had returned to full-time, in-person instruction. That means they didn’t miss key lessons in literacy and math in the early years of elementary school.
These students gave researchers hope about the potential that the nation can build back some of the slide that began long before COVID-19.
2. But 13-year-olds are hurting.
The report paints a less optimistic picture about 13-year-olds. Compared to the last assessment, students showed no significant improvement in reading or math.
Scores in reading remain below where they were at the start of the pandemic on average, and that includes Hispanic students, white students, female students, students who are economically disadvantaged and suburban students.
Reading scores from this test, on average, are not significantly different from performance in the first-ever administered test in 1971.
“The lack of progress in 13-year-olds raises huge questions and ought to serve as a catalyst for change,” Lesley Muldoon, the executive director of the National Assessment Governing Board, said during a press briefing. Her organization sets policy related to NAEP.
For these 13-year-old students, unlike their 9-year-old counterparts, the pandemic was the backdrop for much of their elementary school experience. In 2020, they were in second or third grade. Those critical years for literacy and math skills were disrupted by school closures, and this stagnant performance may be one consequence.
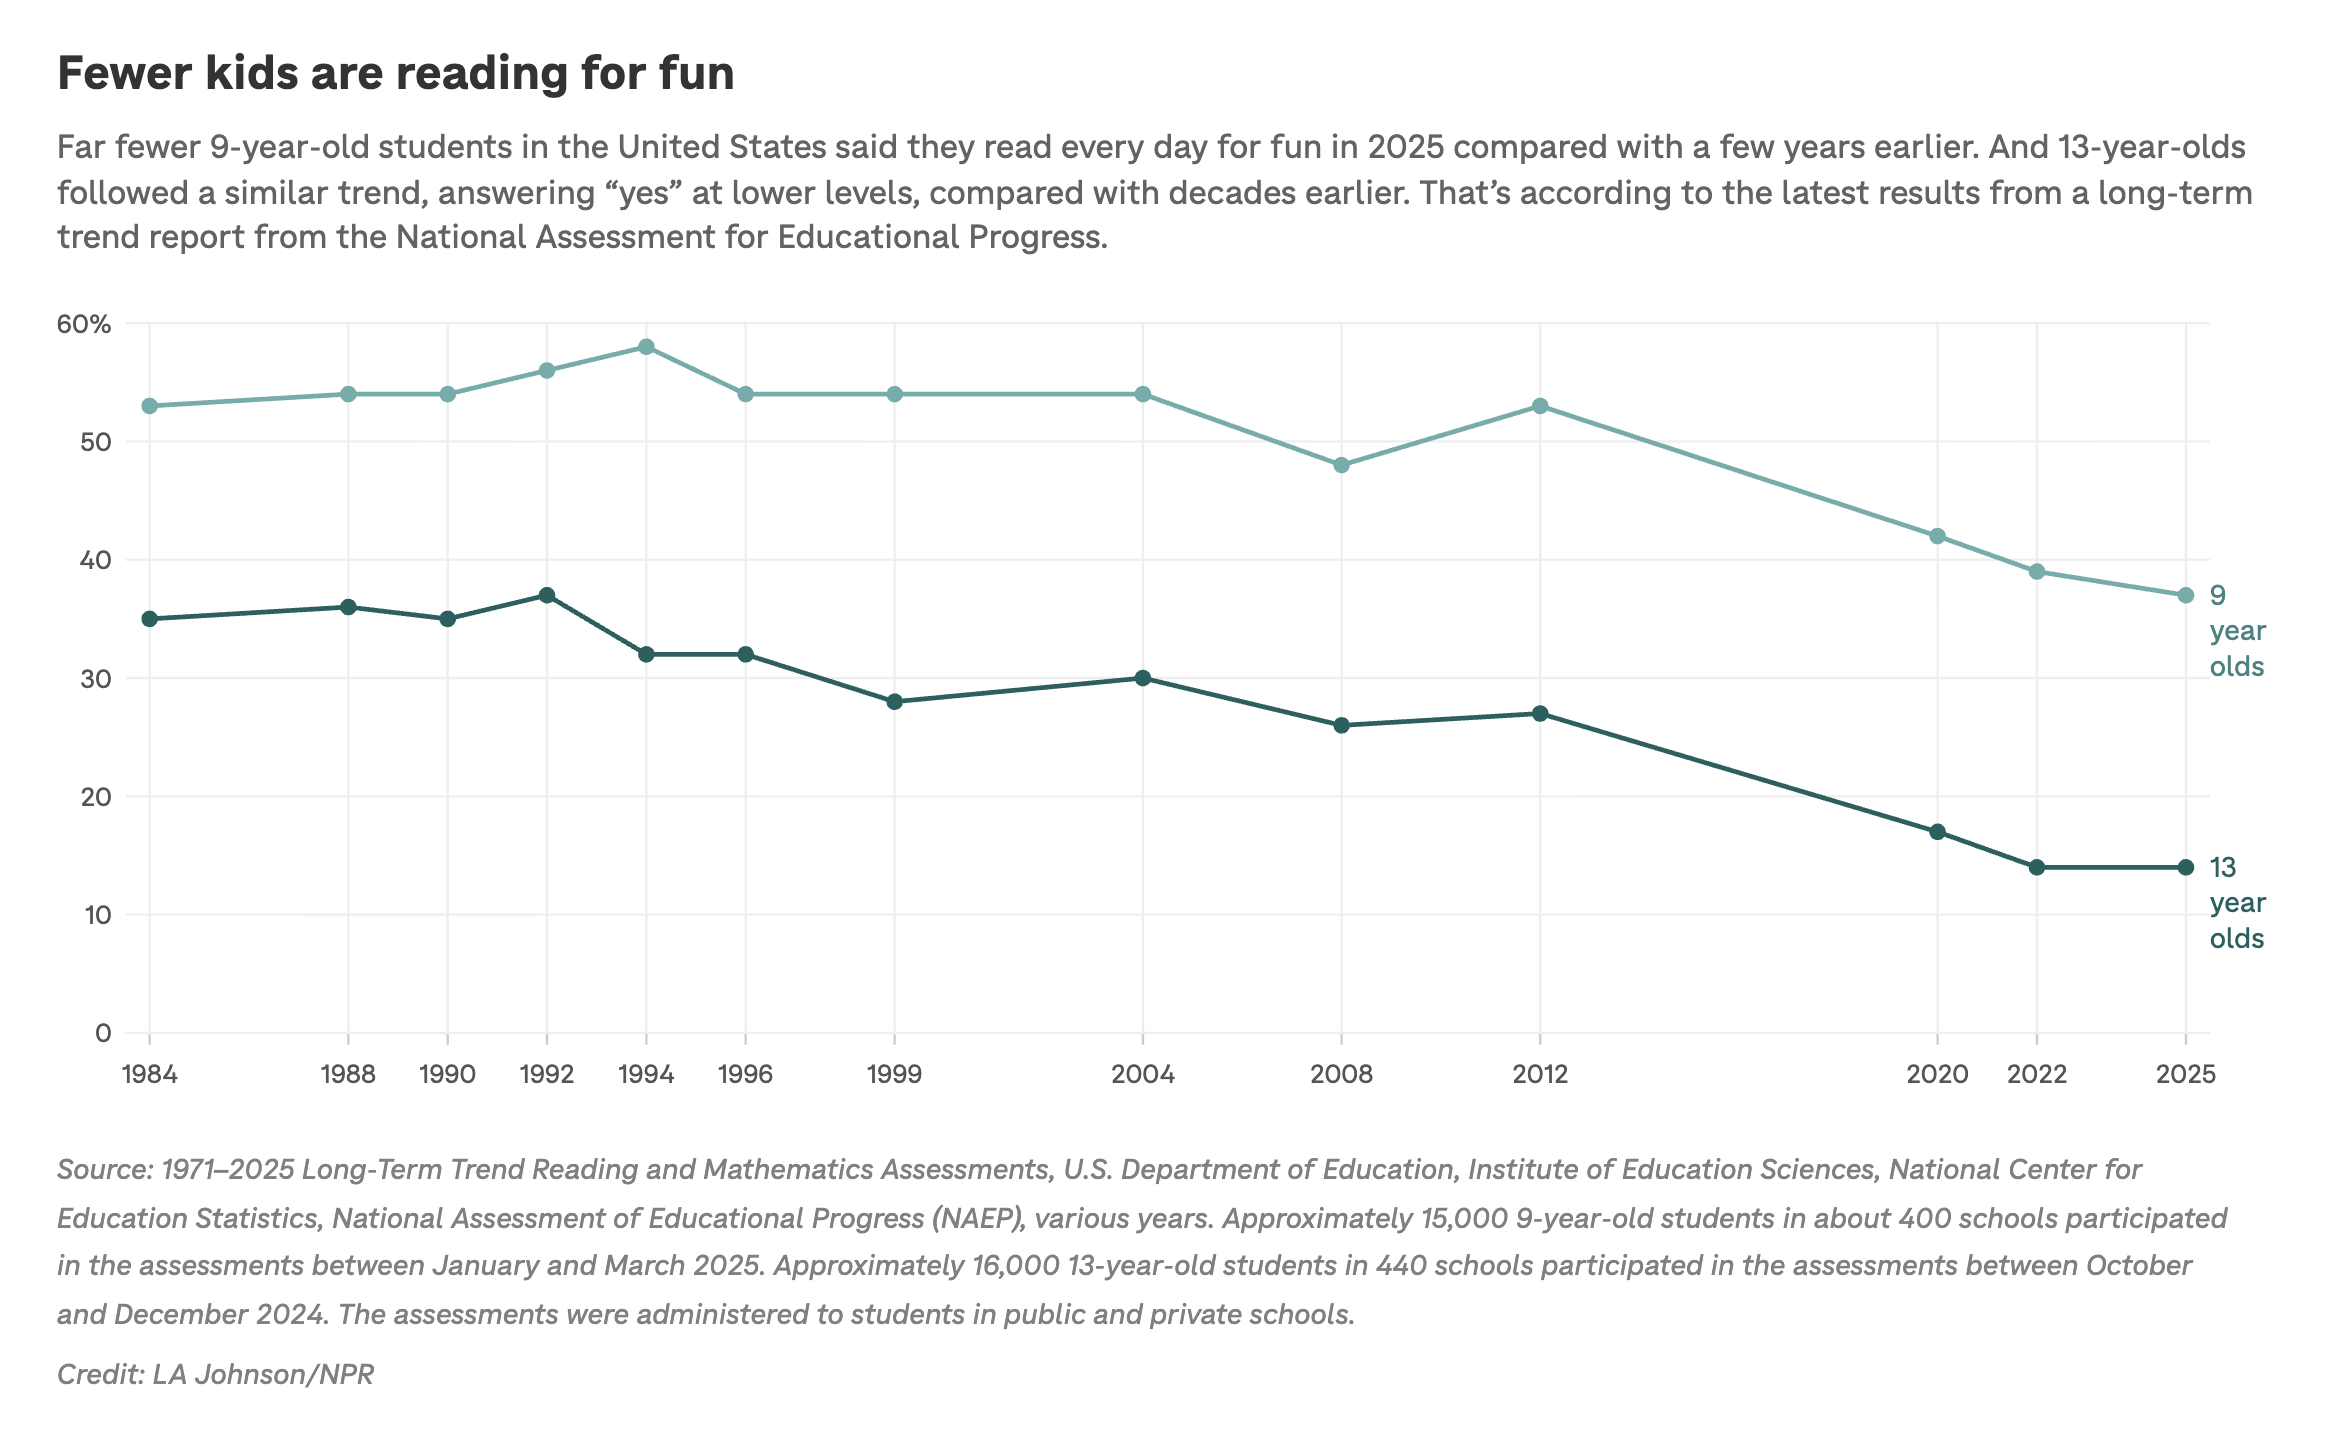
3. Fewer students are reading for pleasure — than ever.
At the same time, the report found that reading is a pastime for a shrinking number of kids.
In 1984, 35% of 13-year-old students reported reading for fun on a daily basis. In 2022 and 2025, only 14% said the same. A far greater share of 9-year-olds — 37% — indicated they read for fun every day, but that’s sharply down from decades earlier.
4. Math progress erased for 13-year-olds.
From 1978 to 2012, the average math scores on the LTT for 13-year-olds improved by 21 points. The climbing scores were a bright spot in more than 50 years of data. This report shows that most of those gains have been erased.
The lowest-performing students now show no gains at all compared with the 1978 math test results.
“As a nation, we have to bring more focus to the middle school years,” Muldoon told reporters. “It’ll take a lot of collective work, but we’ve seen progress before, and it’s possible to see it again.”
5. This is the last we’ll see of the long-term trend report for a while.
This is the first NAEP long-term trend report released since the Trump administration began making cuts to the U.S. Education Department in 2025. Those cuts included laying off more than half the workers at the Institute of Education Sciences, the arm of the department charged with measuring student achievement and overseeing and processing the data that comes from the tests students take.
After those cuts, the department also canceled about a dozen national and state assessments of student progress through 2032 — one of those being the next iteration of these tests. (Since then, plans have been announced to restore some of those exams.)
Still, sudents won’t see these questions again until 2033.