Q: Is that really so tragic?
A: One can reasonably argue that it’s not so bad to be back where we were in 2000. Many children born 30 years ago, who would have been about 9 years old then, are educated adults and leading good lives today.
But it is troubling that the lowest achieving students in our schools lost the most ground between 2020 and 2022. Students in the bottom 10 percent in achievement lost four to five times more than students in the top 10 percent. In math, for example, that’s a drop of 12 points versus a three-point drop.
If these children don’t catch up, they will be at a far greater risk of not learning to read well enough to function in our economy or of dropping out of high school because they cannot pass minimum math requirements. Based on another set of plummeting test scores during the pandemic, the consulting firm McKinsey & Company estimated that the current generation of less-educated students could reduce the size of the U.S. economy by $128 billion to $188 billion a year.
Q: How can student achievement around the country be hit so hard if we reported in July 2022 that the pace of learning was back to normal? Was that earlier report wrong?
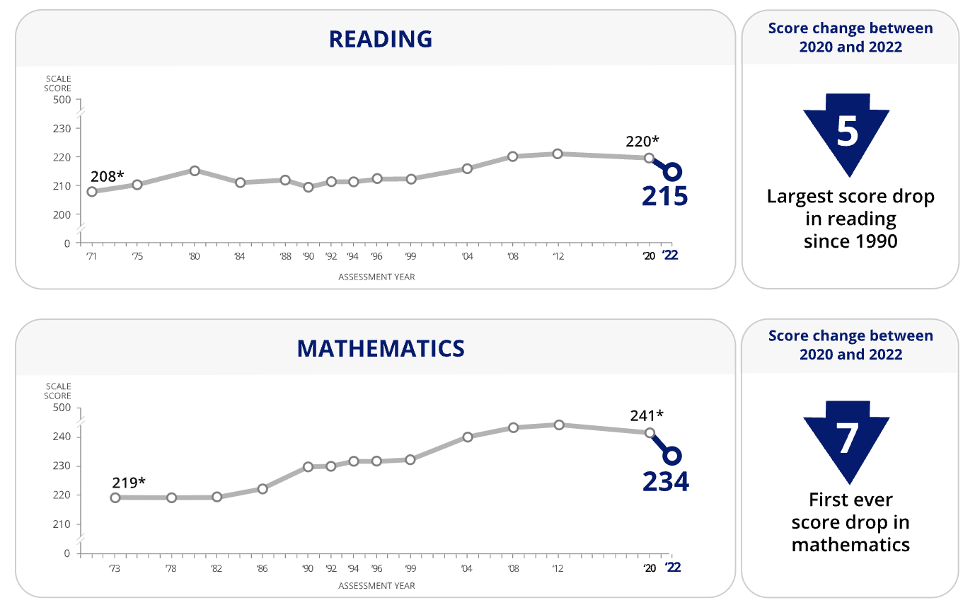
A: Both reports are consistent with each other and show nearly identical declines in student test scores. The recent Department of Education report reflects just two snapshots of NAEP test scores: one taken in early 2020 before the pandemic and one in early 2022. Between these two time periods, the achievement of 9-year-olds plummeted.
The assessment organization NWEA measures children two to three times during the year using a test called Measures of Academic Progress or MAP, which is taken by millions of elementary and middle school students around the country every year. MAP scores plummeted dramatically in 2020-21 and then started to rebound slightly for many but not all children in 2021-22. Students at each grade level remained far behind where they had been before the pandemic, but they weren’t deteriorating further.
I liken it to the difference between a quarterly and an annual report in finance. A company may be making less revenue today than two years ago, but a quarterly report will show more detailed ups and downs. NWEA’s details show that most of the academic decline occurred in 2020 and 2021, but not so much in 2022. The Department of Education’s NAEP report cannot pinpoint the exact timing of the slide between 2000 and 2022.
Q: So is there learning loss?
A: Students haven’t regressed. It’s not that individual children used to know how to read and then stopped being able to read. The NAEP test implies and the MAP test directly documents that children continued to get better in reading and math during the pandemic. But students missed hours of instruction for many reasons: family tragedies, closed schools, teachers out with COVID, inefficient remote instruction. So students learned less than usual.
My best analogy, which I’ve used before, is a cross-country road trip. Imagine that students were traveling at 55 miles an hour, ran out of gas and started walking instead. According to the NWEA report, now they’re back in their cars and humming along again at 55 miles an hour. Some are traveling at 60 miles an hour, catching up slightly, but they’re still far away from the destination that they would have reached if they hadn’t run out of gas.
It’s this distance from the destination that educators are describing when they talk about learning loss. Some people like to call this problem “missed learning” or “lost learning.” Whatever you want to call it, it means that today’s 9-year-olds – or third and fourth graders – cannot read and multiply as well as 9-year-olds did 10 years ago.
Q: How could scores decline nationally, but not in cities or rural areas?
A: In math, it’s a simpler story. Everyone deteriorated. High achievers and low achievers, along with Black, white and Hispanic students. City, suburban and country students all posted lower math scores.
But in reading, test scores in urban school districts didn’t decline between 2020 and 2022. They were also unchanged in rural districts and throughout the West.
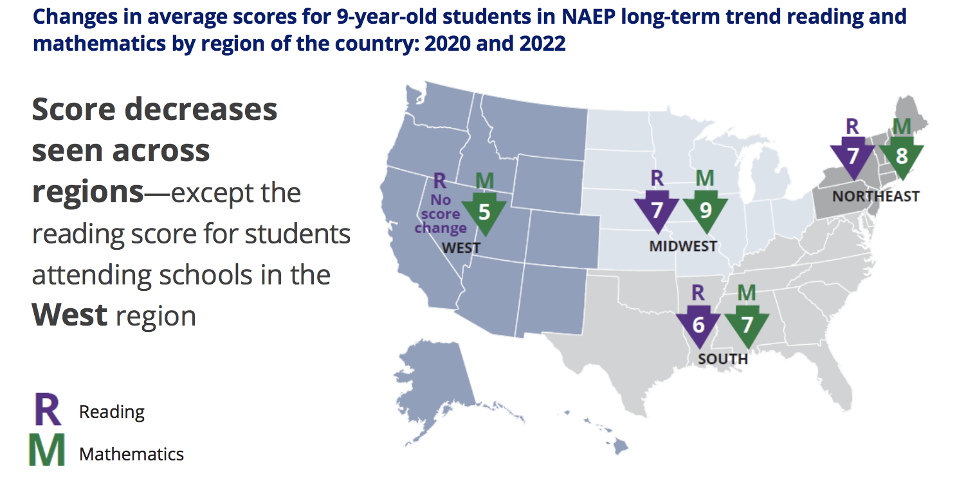
I talked with Grady Wilburn, a statistician in the assessment division at the National Center for Education Statistics, who drilled down into the data with me. There were not substantial changes in the racial or income composition of these regions between 2020 and 2022 that could explain why reading achievement held stable. Hypothetically, if cities had gentrified during the pandemic, higher income students would have had higher test scores and could have masked the score declines. But that did not happen.
We also looked at different combinations of race, income and geography. Nationally, Black students scored six points lower in reading, but in the cities, Black 9-year olds scored the same in 2022 as they did before the pandemic hit in 2020. Also unchanged were the scores of white city students, Hispanic city students and city students who are poor enough to qualify for free lunch. In rural areas, both Black and Hispanic students held steady too, but white students in rural areas did deteriorate a bit.
“We were puzzled by these numbers too,” said Wilburn. “Our commissioner has been saying maybe that’s one place that researchers should dive into, to better understand what city and rural communities may have done.”
Meanwhile, the scores of Black, white, Hispanic and free-lunch eligible students in the suburbs as well as small towns all declined sharply during the pandemic. This means that the national declines in test scores were primarily driven by suburban 9-year-olds.
One possibility is that city and rural families read more at home. Perhaps brothers and sisters read to each other. Another possibility is that suburban schools deliver a vastly superior education to students that, in normal times, is very effective in teaching young elementary school children to read well. When school days were disrupted during the pandemic, student achievement suffered more. The more effective school is, the more students might suffer when they get less of it.
Q: Can we tell from this NAEP report whether school closures and remote instruction are to blame?
A: No. But the fact that city schools, where students were most likely to have missed more in-person days, held steady in reading (see above) is a sign that remote learning wasn’t always so detrimental. Suburban and small town students, who tended to have more in-person days, fared worse.
Accompanying the NAEP test was a student survey, which asked students if they learned remotely even once during the 2020-21 school year. But it didn’t ask 9-year-olds to count the number of remote days, so it’s impossible to say if more days of remote school led to worse outcomes.
A separate analysis of NWEA’s MAP scores, circulated in May 2022, found that students who learned remotely lost far more ground. It indicated that remote instruction was the primary driver of widening achievement gaps between rich and poor and between children of color and white students.
A more detailed report from the Department of Education on student achievement during the pandemic is expected in October. It will list state achievement scores for fourth and eighth graders on another NAEP test. Hopefully, we can unravel more of these knots together.
*Correction: An earlier version of this story mistakenly described the history of test scores. Scores rose strongly in the 2000s, not the 2010s.