Visualization: How San Francisco's Population Changes Throughout the Day
What Are Traffic Waves and Why Do They Happen So Much?
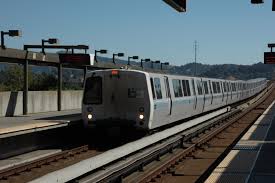
You Can't Ride BART Across the Bay This Weekend So May As Well Learn Something About It Instead
Preview: What Different Stages of California's High-Speed Rail Will Look Like [Interactive Map]
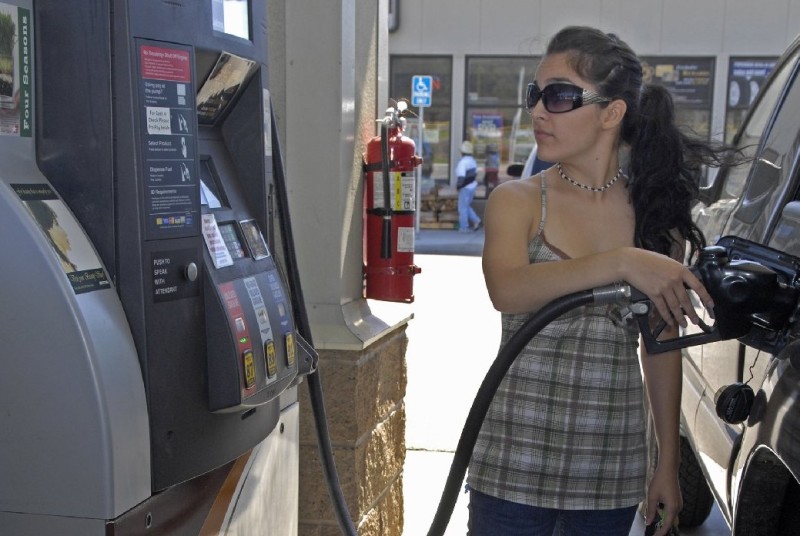
Forget Miles per Gallon! The Case for Switching to Gallons per Mile
Chart: How BART Pay Compares to Pay at Other Big Transit Agencies in California
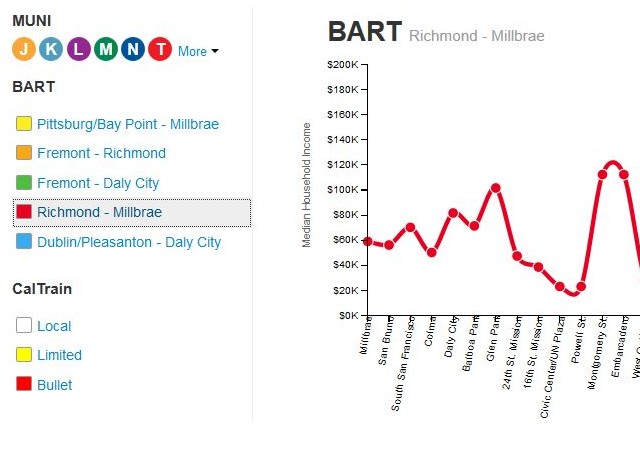
A Public Transit Guide to Income Inequality in the Bay Area
Player sponsored by
window.__IS_SSR__=true
window.__INITIAL_STATE__={
"attachmentsReducer": {
"audio_0": {
"type": "attachments",
"id": "audio_0",
"imgSizes": {
"kqedFullSize": {
"file": "https://ww2.kqed.org/news/wp-content/themes/KQED-unified/img/audio_bgs/background0.jpg"
}
}
},
"audio_1": {
"type": "attachments",
"id": "audio_1",
"imgSizes": {
"kqedFullSize": {
"file": "https://ww2.kqed.org/news/wp-content/themes/KQED-unified/img/audio_bgs/background1.jpg"
}
}
},
"audio_2": {
"type": "attachments",
"id": "audio_2",
"imgSizes": {
"kqedFullSize": {
"file": "https://ww2.kqed.org/news/wp-content/themes/KQED-unified/img/audio_bgs/background2.jpg"
}
}
},
"audio_3": {
"type": "attachments",
"id": "audio_3",
"imgSizes": {
"kqedFullSize": {
"file": "https://ww2.kqed.org/news/wp-content/themes/KQED-unified/img/audio_bgs/background3.jpg"
}
}
},
"audio_4": {
"type": "attachments",
"id": "audio_4",
"imgSizes": {
"kqedFullSize": {
"file": "https://ww2.kqed.org/news/wp-content/themes/KQED-unified/img/audio_bgs/background4.jpg"
}
}
},
"placeholder": {
"type": "attachments",
"id": "placeholder",
"imgSizes": {
"thumbnail": {
"file": "https://cdn.kqed.org/wp-content/uploads/2024/12/KQED-Default-Image-816638274-2000x1333-1-160x107.jpg",
"width": 160,
"height": 107,
"mimeType": "image/jpeg"
},
"medium": {
"file": "https://cdn.kqed.org/wp-content/uploads/2024/12/KQED-Default-Image-816638274-2000x1333-1-800x533.jpg",
"width": 800,
"height": 533,
"mimeType": "image/jpeg"
},
"medium_large": {
"file": "https://cdn.kqed.org/wp-content/uploads/2024/12/KQED-Default-Image-816638274-2000x1333-1-768x512.jpg",
"width": 768,
"height": 512,
"mimeType": "image/jpeg"
},
"large": {
"file": "https://cdn.kqed.org/wp-content/uploads/2024/12/KQED-Default-Image-816638274-2000x1333-1-1020x680.jpg",
"width": 1020,
"height": 680,
"mimeType": "image/jpeg"
},
"1536x1536": {
"file": "https://cdn.kqed.org/wp-content/uploads/2024/12/KQED-Default-Image-816638274-2000x1333-1-1536x1024.jpg",
"width": 1536,
"height": 1024,
"mimeType": "image/jpeg"
},
"fd-lrg": {
"file": "https://cdn.kqed.org/wp-content/uploads/2024/12/KQED-Default-Image-816638274-2000x1333-1-1536x1024.jpg",
"width": 1536,
"height": 1024,
"mimeType": "image/jpeg"
},
"fd-med": {
"file": "https://cdn.kqed.org/wp-content/uploads/2024/12/KQED-Default-Image-816638274-2000x1333-1-1020x680.jpg",
"width": 1020,
"height": 680,
"mimeType": "image/jpeg"
},
"fd-sm": {
"file": "https://cdn.kqed.org/wp-content/uploads/2024/12/KQED-Default-Image-816638274-2000x1333-1-800x533.jpg",
"width": 800,
"height": 533,
"mimeType": "image/jpeg"
},
"post-thumbnail": {
"file": "https://cdn.kqed.org/wp-content/uploads/2024/12/KQED-Default-Image-816638274-2000x1333-1-672x372.jpg",
"width": 672,
"height": 372,
"mimeType": "image/jpeg"
},
"twentyfourteen-full-width": {
"file": "https://cdn.kqed.org/wp-content/uploads/2024/12/KQED-Default-Image-816638274-2000x1333-1-1038x576.jpg",
"width": 1038,
"height": 576,
"mimeType": "image/jpeg"
},
"xxsmall": {
"file": "https://cdn.kqed.org/wp-content/uploads/2024/12/KQED-Default-Image-816638274-2000x1333-1-160x107.jpg",
"width": 160,
"height": 107,
"mimeType": "image/jpeg"
},
"xsmall": {
"file": "https://cdn.kqed.org/wp-content/uploads/2024/12/KQED-Default-Image-816638274-2000x1333-1-672x372.jpg",
"width": 672,
"height": 372,
"mimeType": "image/jpeg"
},
"small": {
"file": "https://cdn.kqed.org/wp-content/uploads/2024/12/KQED-Default-Image-816638274-2000x1333-1-672x372.jpg",
"width": 672,
"height": 372,
"mimeType": "image/jpeg"
},
"xlarge": {
"file": "https://cdn.kqed.org/wp-content/uploads/2024/12/KQED-Default-Image-816638274-2000x1333-1-1020x680.jpg",
"width": 1020,
"height": 680,
"mimeType": "image/jpeg"
},
"full-width": {
"file": "https://cdn.kqed.org/wp-content/uploads/2024/12/KQED-Default-Image-816638274-2000x1333-1-1920x1280.jpg",
"width": 1920,
"height": 1280,
"mimeType": "image/jpeg"
},
"guest-author-32": {
"file": "https://cdn.kqed.org/wp-content/uploads/2025/01/KQED-Default-Image-816638274-1333x1333-1-160x160.jpg",
"width": 32,
"height": 32,
"mimeType": "image/jpeg"
},
"guest-author-50": {
"file": "https://cdn.kqed.org/wp-content/uploads/2025/01/KQED-Default-Image-816638274-1333x1333-1-160x160.jpg",
"width": 50,
"height": 50,
"mimeType": "image/jpeg"
},
"guest-author-64": {
"file": "https://cdn.kqed.org/wp-content/uploads/2025/01/KQED-Default-Image-816638274-1333x1333-1-160x160.jpg",
"width": 64,
"height": 64,
"mimeType": "image/jpeg"
},
"guest-author-96": {
"file": "https://cdn.kqed.org/wp-content/uploads/2025/01/KQED-Default-Image-816638274-1333x1333-1-160x160.jpg",
"width": 96,
"height": 96,
"mimeType": "image/jpeg"
},
"guest-author-128": {
"file": "https://cdn.kqed.org/wp-content/uploads/2025/01/KQED-Default-Image-816638274-1333x1333-1-160x160.jpg",
"width": 128,
"height": 128,
"mimeType": "image/jpeg"
},
"detail": {
"file": "https://cdn.kqed.org/wp-content/uploads/2025/01/KQED-Default-Image-816638274-1333x1333-1-160x160.jpg",
"width": 160,
"height": 160,
"mimeType": "image/jpeg"
},
"kqedFullSize": {
"file": "https://cdn.kqed.org/wp-content/uploads/2024/12/KQED-Default-Image-816638274-2000x1333-1.jpg",
"width": 2000,
"height": 1333
}
}
},
"lowdown_20845": {
"type": "attachments",
"id": "lowdown_20845",
"meta": {
"index": "attachments_1716263798",
"site": "lowdown",
"id": "20845",
"found": true
},
"parent": 11327,
"imgSizes": {
"thumbnail": {
"file": "https://ww2.kqed.org/app/uploads/sites/26/2016/01/Screen-Shot-2016-01-27-at-1.54.58-PM-400x257.png",
"width": 400,
"mimeType": "image/png",
"height": 257
},
"post-thumbnail": {
"file": "https://ww2.kqed.org/app/uploads/sites/26/2016/01/Screen-Shot-2016-01-27-at-1.54.58-PM-613x372.png",
"width": 613,
"mimeType": "image/png",
"height": 372
},
"kqedFullSize": {
"file": "https://ww2.kqed.org/app/uploads/sites/26/2016/01/Screen-Shot-2016-01-27-at-1.54.58-PM.png",
"width": 613,
"height": 394
},
"guest-author-96": {
"file": "https://ww2.kqed.org/app/uploads/sites/26/2016/01/Screen-Shot-2016-01-27-at-1.54.58-PM-96x96.png",
"width": 96,
"mimeType": "image/png",
"height": 96
},
"guest-author-64": {
"file": "https://ww2.kqed.org/app/uploads/sites/26/2016/01/Screen-Shot-2016-01-27-at-1.54.58-PM-64x64.png",
"width": 64,
"mimeType": "image/png",
"height": 64
},
"detail": {
"file": "https://ww2.kqed.org/app/uploads/sites/26/2016/01/Screen-Shot-2016-01-27-at-1.54.58-PM-75x75.png",
"width": 75,
"mimeType": "image/png",
"height": 75
},
"guest-author-32": {
"file": "https://ww2.kqed.org/app/uploads/sites/26/2016/01/Screen-Shot-2016-01-27-at-1.54.58-PM-32x32.png",
"width": 32,
"mimeType": "image/png",
"height": 32
},
"guest-author-128": {
"file": "https://ww2.kqed.org/app/uploads/sites/26/2016/01/Screen-Shot-2016-01-27-at-1.54.58-PM-128x128.png",
"width": 128,
"mimeType": "image/png",
"height": 128
}
},
"publishDate": 1453931757,
"modified": 1453931757,
"caption": null,
"description": null,
"title": "Screen Shot 2016-01-27 at 1.54.58 PM",
"credit": null,
"status": "inherit",
"isLoading": false,
"fetchFailed": false
},
"lowdown_10504": {
"type": "attachments",
"id": "lowdown_10504",
"meta": {
"index": "attachments_1716263798",
"site": "lowdown",
"id": "10504",
"found": true
},
"parent": 10492,
"imgSizes": {
"twentyfourteen-full-width": {
"file": "https://ww2.kqed.org/app/uploads/sites/26/2013/11/401_Gridlock-1038x576.jpg",
"width": 1038,
"mimeType": "image/jpeg",
"height": 576
},
"thumbnail": {
"file": "https://ww2.kqed.org/app/uploads/sites/26/2013/11/401_Gridlock-400x266.jpg",
"width": 400,
"mimeType": "image/jpeg",
"height": 266
},
"fd-sm": {
"file": "https://ww2.kqed.org/app/uploads/sites/26/2013/11/401_Gridlock-320x213.jpg",
"width": 320,
"mimeType": "image/jpeg",
"height": 213
},
"post-thumbnail": {
"file": "https://ww2.kqed.org/app/uploads/sites/26/2013/11/401_Gridlock-672x372.jpg",
"width": 672,
"mimeType": "image/jpeg",
"height": 372
},
"kqedFullSize": {
"file": "https://ww2.kqed.org/app/uploads/sites/26/2013/11/401_Gridlock.jpg",
"width": 1537,
"height": 1024
},
"large": {
"file": "https://ww2.kqed.org/app/uploads/sites/26/2013/11/401_Gridlock-1440x959.jpg",
"width": 1440,
"mimeType": "image/jpeg",
"height": 959
},
"guest-author-96": {
"file": "https://ww2.kqed.org/app/uploads/sites/26/2013/11/401_Gridlock-96x96.jpg",
"width": 96,
"mimeType": "image/jpeg",
"height": 96
},
"medium": {
"file": "https://ww2.kqed.org/app/uploads/sites/26/2013/11/401_Gridlock-800x533.jpg",
"width": 800,
"mimeType": "image/jpeg",
"height": 533
},
"guest-author-64": {
"file": "https://ww2.kqed.org/app/uploads/sites/26/2013/11/401_Gridlock-64x64.jpg",
"width": 64,
"mimeType": "image/jpeg",
"height": 64
},
"guest-author-32": {
"file": "https://ww2.kqed.org/app/uploads/sites/26/2013/11/401_Gridlock-32x32.jpg",
"width": 32,
"mimeType": "image/jpeg",
"height": 32
},
"fd-lrg": {
"file": "https://ww2.kqed.org/app/uploads/sites/26/2013/11/401_Gridlock-1180x786.jpg",
"width": 1180,
"mimeType": "image/jpeg",
"height": 786
},
"fd-med": {
"file": "https://ww2.kqed.org/app/uploads/sites/26/2013/11/401_Gridlock-768x512.jpg",
"width": 768,
"mimeType": "image/jpeg",
"height": 512
},
"detail": {
"file": "https://ww2.kqed.org/app/uploads/sites/26/2013/11/401_Gridlock-75x75.jpg",
"width": 75,
"mimeType": "image/jpeg",
"height": 75
},
"guest-author-128": {
"file": "https://ww2.kqed.org/app/uploads/sites/26/2013/11/401_Gridlock-128x128.jpg",
"width": 128,
"mimeType": "image/jpeg",
"height": 128
}
},
"publishDate": 1384368301,
"modified": 1384368301,
"caption": "Wikipedia",
"description": null,
"title": "401_Gridlock",
"credit": null,
"status": "inherit",
"isLoading": false,
"fetchFailed": false
},
"lowdown_8420": {
"type": "attachments",
"id": "lowdown_8420",
"meta": {
"index": "attachments_1716263798",
"site": "lowdown",
"id": "8420",
"found": true
},
"parent": 8366,
"imgSizes": {
"thumbnail": {
"file": "https://ww2.kqed.org/app/uploads/sites/26/2013/07/staffatlakemerritt380-400x308.png",
"width": 400,
"mimeType": "image/png",
"height": 308
},
"fd-sm": {
"file": "https://ww2.kqed.org/app/uploads/sites/26/2013/07/staffatlakemerritt380-320x247.png",
"width": 320,
"mimeType": "image/png",
"height": 247
},
"post-thumbnail": {
"file": "https://ww2.kqed.org/app/uploads/sites/26/2013/07/staffatlakemerritt380-581x372.png",
"width": 581,
"mimeType": "image/png",
"height": 372
},
"kqedFullSize": {
"file": "https://ww2.kqed.org/app/uploads/sites/26/2013/07/staffatlakemerritt380.png",
"width": 581,
"height": 448
},
"guest-author-96": {
"file": "https://ww2.kqed.org/app/uploads/sites/26/2013/07/staffatlakemerritt380-96x96.png",
"width": 96,
"mimeType": "image/png",
"height": 96
},
"guest-author-64": {
"file": "https://ww2.kqed.org/app/uploads/sites/26/2013/07/staffatlakemerritt380-64x64.png",
"width": 64,
"mimeType": "image/png",
"height": 64
},
"detail": {
"file": "https://ww2.kqed.org/app/uploads/sites/26/2013/07/staffatlakemerritt380-75x75.png",
"width": 75,
"mimeType": "image/png",
"height": 75
},
"guest-author-32": {
"file": "https://ww2.kqed.org/app/uploads/sites/26/2013/07/staffatlakemerritt380-32x32.png",
"width": 32,
"mimeType": "image/png",
"height": 32
},
"guest-author-128": {
"file": "https://ww2.kqed.org/app/uploads/sites/26/2013/07/staffatlakemerritt380-128x128.png",
"width": 128,
"mimeType": "image/png",
"height": 128
}
},
"publishDate": 1372901277,
"modified": 1438387707,
"caption": "No, not the original Star Trek cast: BART employees in the early 1970s.",
"description": null,
"title": "staffatlakemerritt380",
"credit": "BART.gov",
"status": "inherit",
"isLoading": false,
"fetchFailed": false
},
"lowdown_15509": {
"type": "attachments",
"id": "lowdown_15509",
"meta": {
"index": "attachments_1716263798",
"site": "lowdown",
"id": "15509",
"found": true
},
"parent": 14507,
"imgSizes": {
"twentyfourteen-full-width": {
"file": "https://ww2.kqed.org/app/uploads/sites/26/2015/01/screenshot-e1420744870746-971x576.png",
"width": 971,
"mimeType": "image/png",
"height": 576
},
"thumbnail": {
"file": "https://ww2.kqed.org/app/uploads/sites/26/2015/01/screenshot-e1420744870746-400x270.png",
"width": 400,
"mimeType": "image/png",
"height": 270
},
"fd-sm": {
"file": "https://ww2.kqed.org/app/uploads/sites/26/2015/01/screenshot-e1420744870746-320x216.png",
"width": 320,
"mimeType": "image/png",
"height": 216
},
"post-thumbnail": {
"file": "https://ww2.kqed.org/app/uploads/sites/26/2015/01/screenshot-e1420744870746-672x372.png",
"width": 672,
"mimeType": "image/png",
"height": 372
},
"kqedFullSize": {
"file": "https://ww2.kqed.org/app/uploads/sites/26/2015/01/screenshot-e1420744870746.png",
"width": 971,
"height": 655
},
"fd-med": {
"file": "https://ww2.kqed.org/app/uploads/sites/26/2015/01/screenshot-e1420744870746-768x518.png",
"width": 768,
"mimeType": "image/png",
"height": 518
},
"guest-author-96": {
"file": "https://ww2.kqed.org/app/uploads/sites/26/2015/01/screenshot-e1420744870746-96x96.png",
"width": 96,
"mimeType": "image/png",
"height": 96
},
"medium": {
"file": "https://ww2.kqed.org/app/uploads/sites/26/2015/01/screenshot-e1420744870746-800x540.png",
"width": 800,
"mimeType": "image/png",
"height": 540
},
"guest-author-64": {
"file": "https://ww2.kqed.org/app/uploads/sites/26/2015/01/screenshot-e1420744870746-64x64.png",
"width": 64,
"mimeType": "image/png",
"height": 64
},
"detail": {
"file": "https://ww2.kqed.org/app/uploads/sites/26/2015/01/screenshot-e1420744870746-75x75.png",
"width": 75,
"mimeType": "image/png",
"height": 75
},
"guest-author-32": {
"file": "https://ww2.kqed.org/app/uploads/sites/26/2015/01/screenshot-e1420744870746-32x32.png",
"width": 32,
"mimeType": "image/png",
"height": 32
},
"guest-author-128": {
"file": "https://ww2.kqed.org/app/uploads/sites/26/2015/01/screenshot-e1420744870746-128x128.png",
"width": 128,
"mimeType": "image/png",
"height": 128
}
},
"publishDate": 1420683450,
"modified": 1420683450,
"caption": null,
"description": null,
"title": "screenshot",
"credit": null,
"status": "inherit",
"isLoading": false,
"fetchFailed": false
},
"lowdown_11046": {
"type": "attachments",
"id": "lowdown_11046",
"meta": {
"index": "attachments_1716263798",
"site": "lowdown",
"id": "11046",
"found": true
},
"parent": 10976,
"imgSizes": {
"twentyfourteen-full-width": {
"file": "https://ww2.kqed.org/app/uploads/sites/26/2013/12/Pumping_gas-e1432223442903-1038x576.jpg",
"width": 1038,
"mimeType": "image/jpeg",
"height": 576
},
"thumbnail": {
"file": "https://ww2.kqed.org/app/uploads/sites/26/2013/12/Pumping_gas-e1432223442903-400x268.jpg",
"width": 400,
"mimeType": "image/jpeg",
"height": 268
},
"fd-sm": {
"file": "https://ww2.kqed.org/app/uploads/sites/26/2013/12/Pumping_gas-e1432223442903-960x643.jpg",
"width": 960,
"mimeType": "image/jpeg",
"height": 643
},
"post-thumbnail": {
"file": "https://ww2.kqed.org/app/uploads/sites/26/2013/12/Pumping_gas-e1432223442903-672x372.jpg",
"width": 672,
"mimeType": "image/jpeg",
"height": 372
},
"kqedFullSize": {
"file": "https://ww2.kqed.org/app/uploads/sites/26/2013/12/Pumping_gas-e1432223442903.jpg",
"width": 1039,
"height": 696
},
"fd-med": {
"file": "https://ww2.kqed.org/app/uploads/sites/26/2013/12/Pumping_gas-e1386795596726-768x762.jpg",
"width": 768,
"mimeType": "image/jpeg",
"height": 762
},
"guest-author-96": {
"file": "https://ww2.kqed.org/app/uploads/sites/26/2013/12/Pumping_gas-e1432223442903-96x96.jpg",
"width": 96,
"mimeType": "image/jpeg",
"height": 96
},
"medium": {
"file": "https://ww2.kqed.org/app/uploads/sites/26/2013/12/Pumping_gas-e1432223442903-800x536.jpg",
"width": 800,
"mimeType": "image/jpeg",
"height": 536
},
"guest-author-64": {
"file": "https://ww2.kqed.org/app/uploads/sites/26/2013/12/Pumping_gas-e1432223442903-64x64.jpg",
"width": 64,
"mimeType": "image/jpeg",
"height": 64
},
"detail": {
"file": "https://ww2.kqed.org/app/uploads/sites/26/2013/12/Pumping_gas-e1432223442903-75x75.jpg",
"width": 75,
"mimeType": "image/jpeg",
"height": 75
},
"guest-author-32": {
"file": "https://ww2.kqed.org/app/uploads/sites/26/2013/12/Pumping_gas-e1432223442903-32x32.jpg",
"width": 32,
"mimeType": "image/jpeg",
"height": 32
},
"guest-author-128": {
"file": "https://ww2.kqed.org/app/uploads/sites/26/2013/12/Pumping_gas-e1432223442903-128x128.jpg",
"width": 128,
"mimeType": "image/jpeg",
"height": 128
}
},
"publishDate": 1386795572,
"modified": 1432223403,
"caption": "Wikipedia",
"description": null,
"title": "Pumping_gas",
"credit": null,
"status": "inherit",
"isLoading": false,
"fetchFailed": false
},
"lowdown_10121": {
"type": "attachments",
"id": "lowdown_10121",
"meta": {
"index": "attachments_1716263798",
"site": "lowdown",
"id": "10121",
"found": true
},
"parent": 10104,
"imgSizes": {
"kqedFullSize": {
"file": "https://ww2.kqed.org/app/uploads/sites/26/2013/10/bart.jpg",
"width": 275,
"height": 183
},
"guest-author-96": {
"file": "https://ww2.kqed.org/app/uploads/sites/26/2013/10/bart-96x96.jpg",
"width": 96,
"mimeType": "image/jpeg",
"height": 96
},
"guest-author-64": {
"file": "https://ww2.kqed.org/app/uploads/sites/26/2013/10/bart-64x64.jpg",
"width": 64,
"mimeType": "image/jpeg",
"height": 64
},
"detail": {
"file": "https://ww2.kqed.org/app/uploads/sites/26/2013/10/bart-75x75.jpg",
"width": 75,
"mimeType": "image/jpeg",
"height": 75
},
"guest-author-32": {
"file": "https://ww2.kqed.org/app/uploads/sites/26/2013/10/bart-32x32.jpg",
"width": 32,
"mimeType": "image/jpeg",
"height": 32
},
"guest-author-128": {
"file": "https://ww2.kqed.org/app/uploads/sites/26/2013/10/bart-128x128.jpg",
"width": 128,
"mimeType": "image/jpeg",
"height": 128
}
},
"publishDate": 1382082243,
"modified": 1382082243,
"caption": "Wikipedia",
"description": null,
"title": "bart",
"credit": null,
"status": "inherit",
"isLoading": false,
"fetchFailed": false
},
"lowdown_9863": {
"type": "attachments",
"id": "lowdown_9863",
"meta": {
"index": "attachments_1716263798",
"site": "lowdown",
"id": "9863",
"found": true
},
"parent": 9833,
"imgSizes": {
"thumbnail": {
"file": "https://ww2.kqed.org/app/uploads/sites/26/2013/10/Muni_lines-e1381472746836-400x281.jpg",
"width": 400,
"mimeType": "image/jpeg",
"height": 281
},
"fd-sm": {
"file": "https://ww2.kqed.org/app/uploads/sites/26/2013/10/Muni_lines-e1381472746836-320x225.jpg",
"width": 320,
"mimeType": "image/jpeg",
"height": 225
},
"post-thumbnail": {
"file": "https://ww2.kqed.org/app/uploads/sites/26/2013/10/Muni_lines-e1381472746836-640x372.jpg",
"width": 640,
"mimeType": "image/jpeg",
"height": 372
},
"kqedFullSize": {
"file": "https://ww2.kqed.org/app/uploads/sites/26/2013/10/Muni_lines-e1381472746836.jpg",
"width": 640,
"height": 450
},
"guest-author-96": {
"file": "https://ww2.kqed.org/app/uploads/sites/26/2013/10/Muni_lines-e1381472746836-96x96.jpg",
"width": 96,
"mimeType": "image/jpeg",
"height": 96
},
"guest-author-64": {
"file": "https://ww2.kqed.org/app/uploads/sites/26/2013/10/Muni_lines-e1381472746836-64x64.jpg",
"width": 64,
"mimeType": "image/jpeg",
"height": 64
},
"detail": {
"file": "https://ww2.kqed.org/app/uploads/sites/26/2013/10/Muni_lines-e1381472746836-75x75.jpg",
"width": 75,
"mimeType": "image/jpeg",
"height": 75
},
"guest-author-32": {
"file": "https://ww2.kqed.org/app/uploads/sites/26/2013/10/Muni_lines-e1381472746836-32x32.jpg",
"width": 32,
"mimeType": "image/jpeg",
"height": 32
},
"guest-author-128": {
"file": "https://ww2.kqed.org/app/uploads/sites/26/2013/10/Muni_lines-e1381472746836-128x128.jpg",
"width": 128,
"mimeType": "image/jpeg",
"height": 128
}
},
"publishDate": 1381360349,
"modified": 1381360349,
"caption": null,
"description": null,
"title": "Muni_lines",
"credit": null,
"status": "inherit",
"isLoading": false,
"fetchFailed": false
}
},
"audioPlayerReducer": {
"postId": "stream_live",
"isPaused": true,
"isPlaying": false,
"pfsActive": false,
"pledgeModalIsOpen": true,
"playerDrawerIsOpen": false
},
"authorsReducer": {
"matthewgreen": {
"type": "authors",
"id": "1263",
"meta": {
"index": "authors_1716337520",
"id": "1263",
"found": true
},
"name": "Matthew Green",
"firstName": "Matthew",
"lastName": "Green",
"slug": "matthewgreen",
"email": "mgreen@kqed.org",
"display_author_email": false,
"staff_mastheads": [],
"title": "KQED Editor/Reporter",
"bio": "Matthew Green is a digital media producer for KQED News. He previously produced \u003ca href=\"http://www.kqed.org/lowdown\">The Lowdown\u003c/a>, KQED’s multimedia news education blog. Matthew's written for numerous Bay Area publications, including the Oakland Tribune and San Francisco Chronicle. He also taught journalism classes at Fremont High School in East Oakland.\r\n\r\nEmail: mgreen@kqed.org; Twitter: @MGreenKQED",
"avatar": "https://secure.gravatar.com/avatar/3bf498d1267ca02c8494f33d8cfc575e?s=600&d=blank&r=g",
"twitter": "MGreenKQED",
"facebook": null,
"instagram": null,
"linkedin": null,
"sites": [
{
"site": "news",
"roles": []
},
{
"site": "lowdown",
"roles": []
},
{
"site": "science",
"roles": []
},
{
"site": "education",
"roles": []
},
{
"site": "quest",
"roles": []
},
{
"site": "liveblog",
"roles": []
}
],
"headData": {
"title": "Matthew Green | KQED",
"description": "KQED Editor/Reporter",
"ogImgSrc": "https://secure.gravatar.com/avatar/3bf498d1267ca02c8494f33d8cfc575e?s=600&d=blank&r=g",
"twImgSrc": "https://secure.gravatar.com/avatar/3bf498d1267ca02c8494f33d8cfc575e?s=600&d=blank&r=g"
},
"isLoading": false,
"link": "/author/matthewgreen"
},
"lewislehe": {
"type": "authors",
"id": "7527",
"meta": {
"index": "authors_1716337520",
"id": "7527",
"found": true
},
"name": "Lewis Lehe",
"firstName": "Lewis",
"lastName": "Lehe",
"slug": "lewislehe",
"email": "lewis500@berkeley.edu",
"display_author_email": false,
"staff_mastheads": [],
"title": null,
"bio": "Lewis Lehe is a PhD student in Civil Engineering at the UC Berkeley, where he researches electronic road tolling and runs the \u003ca href=\"http://vudlab.com\"> VUDlab \u003c/a>(Visualizing Urban Data Idealab). He also creates data visualizations under the brand “Setosa” at \u003ca href=\"http://setosa.io\"> setosa.io\u003c/a>.",
"avatar": "https://secure.gravatar.com/avatar/2a29abb9aab370fd65426407746f10c5?s=600&d=blank&r=g",
"twitter": null,
"facebook": null,
"instagram": null,
"linkedin": null,
"sites": [
{
"site": "lowdown",
"roles": [
"contributor"
]
}
],
"headData": {
"title": "Lewis Lehe | KQED",
"description": null,
"ogImgSrc": "https://secure.gravatar.com/avatar/2a29abb9aab370fd65426407746f10c5?s=600&d=blank&r=g",
"twImgSrc": "https://secure.gravatar.com/avatar/2a29abb9aab370fd65426407746f10c5?s=600&d=blank&r=g"
},
"isLoading": false,
"link": "/author/lewislehe"
}
},
"breakingNewsReducer": {},
"pagesReducer": {},
"postsReducer": {
"stream_live": {
"type": "live",
"id": "stream_live",
"audioUrl": "https://streams.kqed.org/kqedradio",
"title": "Live Stream",
"excerpt": "Live Stream information currently unavailable.",
"link": "/radio",
"featImg": "",
"label": {
"name": "KQED Live",
"link": "/"
}
},
"stream_kqedNewscast": {
"type": "posts",
"id": "stream_kqedNewscast",
"audioUrl": "https://www.kqed.org/.stream/anon/radio/RDnews/newscast.mp3?_=1",
"title": "KQED Newscast",
"featImg": "",
"label": {
"name": "88.5 FM",
"link": "/"
}
},
"lowdown_11327": {
"type": "posts",
"id": "lowdown_11327",
"meta": {
"index": "posts_1716263798",
"site": "lowdown",
"id": "11327",
"score": null,
"sort": [
1453924826000
]
},
"parent": 0,
"labelTerm": {
"site": "lowdown"
},
"blocks": [],
"publishDate": 1453924826,
"format": "aside",
"disqusTitle": "Visualization: How San Francisco's Population Changes Throughout the Day",
"title": "Visualization: How San Francisco's Population Changes Throughout the Day",
"headTitle": "The Lowdown | KQED News",
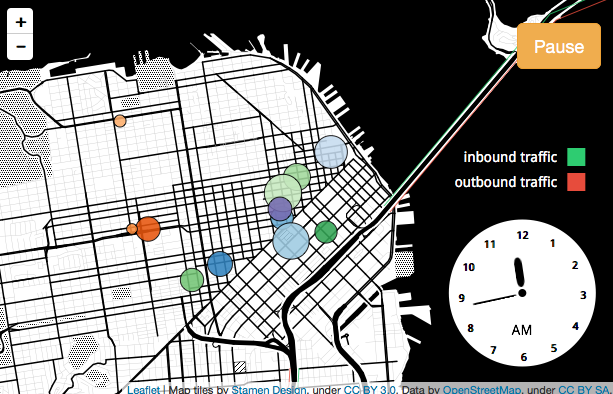
"content": "\u003cp>San Francisco's about to get a lot more crowded. \u003c/p>\n\u003cp>Roughly a million visitors are expected to flood into the Bay Area for Super Bowl week, which start on Monday in advance of the big game in Santa Clara on February 7. \u003c/p>\n\u003cp>And, obviously, that's not the norm. \u003c/p>\n\u003cp>But even during the course of a regular weekday, San Francisco's population changes pretty dramatically. \u003c/p>\n\u003cp>During regular Monday - Friday business hours, the city's population surges by at least 20 percent -- or more than 160,000 people. \u003c/p>\n\u003cp>[ad fullwidth]\u003c/p>\n\u003cp>That's according to the American Community Survey, which calculates a statistic called the \u003ca href=\"http://www.census.gov/hhes/commuting/data/daytimepop.html\" target=\"_blank\">Commuter-Adjusted Daytime Population\u003c/a> to estimate the number of people present in a particular city during normal business hours. Calculated by adding the number of non-working residents to the total working population, the figure underscores the idea that many cities dramatically expand and contract throughout the course of a day -- their true populations determined by much more than simply the number of people who actually live there. It also highlights the additional challenges faced by local governments responsible for planning and building infrastructure for both residents and all inbound travelers.\u003c/p>\n\u003cp>The San Francisco Municipal Transportation Agency inadvertently made it possible to visualize the rhythm of this daily migration. The agency's \u003ca href=\"http://sfpark.org/\" target=\"_blank\">SF Park\u003c/a> program, which raises and lowers the price of public parking over the course of the day, allows app developers to access real-time data on the number of cars parked in its municipal garages at any given time. Using figures from Monday, July 15, 2013, and combining that with traffic data from the California Department of Transportation's highway sensors, we created a visualization of a normal day in the life of San Francisco's central business district.\u003c/p>\n\u003cp>Mouse over each circle or line on the chart to see data for that specific garage. Use the time slider at the bottom to change the pace.\u003c/p>\n\u003cp>The circles represent public parking garages, their sizes changing according to \"occupancy\" -- the number of cars parked in each garage. Meanwhile, the thickness of the green and red highway lines shows the frequency of inbound and outbound traffic (respectively).\u003c/p>\n\u003cp>\u003c!-- iframe plugin v.4.3 wordpress.org/plugins/iframe/ -->\u003cbr>\n\u003ciframe src=\"https://lewis500.github.io/parking/\" frameborder=\"0\" scrolling=\"no\" width=\"100%\" height=\"900\" class=\"iframe-class\">\u003c/iframe>\u003c/p>\n\u003cp>Of course, this sketch is just a microcosm of San Francisco's daily migration trends: it only includes cars in public garages and doesn't account for the hundreds of thousands of commuters who use public transportation to commute into the city every day. It does, however, illustrate the constant ebb and flow of the city's population and the unique rhythms generated by these transitions.\u003c/p>\n\u003cp>The chart below, using \u003ca href=\"http://www.census.gov/hhes/commuting/files/ACS/top20-commuter-adjusted-population.pdf\" target=\"_blank\">Census data\u003c/a>, shows the population breakdown of the largest cities in the country as they appear during the middle of a standard business day. For San Francisco, 265,000 workers come into the city and 103,000 head out. The leader in overall daily migration change is Washington, D.C., where the daytime population is a whopping 79 percent higher than it is at night.\u003c/p>\n\u003cp>\u003c/p>\n\u003cp>\u003c!-- iframe plugin v.4.3 wordpress.org/plugins/iframe/ -->\u003cbr>\n\u003ciframe src=\"http://lewis500.github.io/parking/index2.html\" frameborder=\"0\" scrolling=\"no\" width=\"800\" height=\"540\" class=\"iframe-class\">\u003c/iframe>\u003c/p>\n\n",
"disqusIdentifier": "11327 http://blogs.kqed.org/lowdown/?p=11327",
"disqusUrl": "https://ww2.kqed.org/lowdown/2016/01/27/interactive-how-san-franciscos-population-ebbs-and-flows-during-throughout-the-day/",
"stats": {
"hasVideo": false,
"hasChartOrMap": true,
"hasAudio": false,
"hasPolis": false,
"wordCount": 496,
"hasGoogleForm": false,
"hasGallery": false,
"hasHearkenModule": false,
"iframeSrcs": [
"https://lewis500.github.io/parking/",
"http://lewis500.github.io/parking/index2.html"
],
"paragraphCount": 15
},
"modified": 1524244301,
"excerpt": null,
"headData": {
"twImgId": "",
"twTitle": "",
"ogTitle": "",
"ogImgId": "",
"twDescription": "",
"description": "San Francisco's about to get a lot more crowded. Roughly a million visitors are expected to flood into the Bay Area for Super Bowl week, which start on Monday in advance of the big game in Santa Clara on February 7. And, obviously, that's not the norm. But even during the course of a regular",
"title": "Visualization: How San Francisco's Population Changes Throughout the Day | KQED",
"ogDescription": "",
"schema": {
"@context": "https://schema.org",
"@type": "Article",
"headline": "Visualization: How San Francisco's Population Changes Throughout the Day",
"datePublished": "2016-01-27T12:00:26-08:00",
"dateModified": "2018-04-20T10:11:41-07:00",
"image": "https://cdn.kqed.org/wp-content/uploads/2020/02/KQED-OG-Image@1x.png"
}
},
"guestAuthors": [],
"slug": "interactive-how-san-franciscos-population-ebbs-and-flows-during-throughout-the-day",
"status": "publish",
"customPermalink": "2014/01/10/how-city-populations-change/",
"path": "/lowdown/11327/interactive-how-san-franciscos-population-ebbs-and-flows-during-throughout-the-day",
"audioTrackLength": null,
"parsedContent": [
{
"type": "contentString",
"content": "\u003cdiv class=\"post-body\">\u003cp>\u003cp>San Francisco's about to get a lot more crowded. \u003c/p>\n\u003cp>Roughly a million visitors are expected to flood into the Bay Area for Super Bowl week, which start on Monday in advance of the big game in Santa Clara on February 7. \u003c/p>\n\u003cp>And, obviously, that's not the norm. \u003c/p>\n\u003cp>But even during the course of a regular weekday, San Francisco's population changes pretty dramatically. \u003c/p>\n\u003cp>During regular Monday - Friday business hours, the city's population surges by at least 20 percent -- or more than 160,000 people. \u003c/p>\n\u003cp>\u003c/p>\u003c/div>",
"attributes": {
"named": {},
"numeric": []
}
},
{
"type": "component",
"content": "",
"name": "ad",
"attributes": {
"named": {
"label": "fullwidth"
},
"numeric": [
"fullwidth"
]
}
},
{
"type": "contentString",
"content": "\u003cdiv class=\"post-body\">\u003cp>\u003c/p>\n\u003cp>That's according to the American Community Survey, which calculates a statistic called the \u003ca href=\"http://www.census.gov/hhes/commuting/data/daytimepop.html\" target=\"_blank\">Commuter-Adjusted Daytime Population\u003c/a> to estimate the number of people present in a particular city during normal business hours. Calculated by adding the number of non-working residents to the total working population, the figure underscores the idea that many cities dramatically expand and contract throughout the course of a day -- their true populations determined by much more than simply the number of people who actually live there. It also highlights the additional challenges faced by local governments responsible for planning and building infrastructure for both residents and all inbound travelers.\u003c/p>\n\u003cp>The San Francisco Municipal Transportation Agency inadvertently made it possible to visualize the rhythm of this daily migration. The agency's \u003ca href=\"http://sfpark.org/\" target=\"_blank\">SF Park\u003c/a> program, which raises and lowers the price of public parking over the course of the day, allows app developers to access real-time data on the number of cars parked in its municipal garages at any given time. Using figures from Monday, July 15, 2013, and combining that with traffic data from the California Department of Transportation's highway sensors, we created a visualization of a normal day in the life of San Francisco's central business district.\u003c/p>\n\u003cp>Mouse over each circle or line on the chart to see data for that specific garage. Use the time slider at the bottom to change the pace.\u003c/p>\n\u003cp>The circles represent public parking garages, their sizes changing according to \"occupancy\" -- the number of cars parked in each garage. Meanwhile, the thickness of the green and red highway lines shows the frequency of inbound and outbound traffic (respectively).\u003c/p>\n\u003cp>\u003c!-- iframe plugin v.4.3 wordpress.org/plugins/iframe/ -->\u003cbr>\n\u003ciframe src=\"https://lewis500.github.io/parking/\" frameborder=\"0\" scrolling=\"no\" width=\"100%\" height=\"900\" class=\"iframe-class\">\u003c/iframe>\u003c/p>\n\u003cp>Of course, this sketch is just a microcosm of San Francisco's daily migration trends: it only includes cars in public garages and doesn't account for the hundreds of thousands of commuters who use public transportation to commute into the city every day. It does, however, illustrate the constant ebb and flow of the city's population and the unique rhythms generated by these transitions.\u003c/p>\n\u003cp>The chart below, using \u003ca href=\"http://www.census.gov/hhes/commuting/files/ACS/top20-commuter-adjusted-population.pdf\" target=\"_blank\">Census data\u003c/a>, shows the population breakdown of the largest cities in the country as they appear during the middle of a standard business day. For San Francisco, 265,000 workers come into the city and 103,000 head out. The leader in overall daily migration change is Washington, D.C., where the daytime population is a whopping 79 percent higher than it is at night.\u003c/p>\n\u003cp>\u003c/p>\n\u003cp>\u003c!-- iframe plugin v.4.3 wordpress.org/plugins/iframe/ -->\u003cbr>\n\u003ciframe src=\"http://lewis500.github.io/parking/index2.html\" frameborder=\"0\" scrolling=\"no\" width=\"800\" height=\"540\" class=\"iframe-class\">\u003c/iframe>\u003c/p>\n\n\u003c/div>\u003c/p>",
"attributes": {
"named": {},
"numeric": []
}
}
],
"link": "/lowdown/11327/interactive-how-san-franciscos-population-ebbs-and-flows-during-throughout-the-day",
"authors": [
"7527",
"1263"
],
"categories": [
"lowdown_391",
"lowdown_566",
"lowdown_457",
"lowdown_243"
],
"tags": [
"lowdown_2337",
"lowdown_238",
"lowdown_346"
],
"featImg": "lowdown_20845",
"label": "lowdown"
},
"lowdown_10492": {
"type": "posts",
"id": "lowdown_10492",
"meta": {
"index": "posts_1716263798",
"site": "lowdown",
"id": "10492",
"score": null,
"sort": [
1451332827000
]
},
"parent": 0,
"labelTerm": {
"site": "lowdown"
},
"blocks": [],
"publishDate": 1451332827,
"format": "aside",
"disqusTitle": "What Are Traffic Waves and Why Do They Happen So Much?",
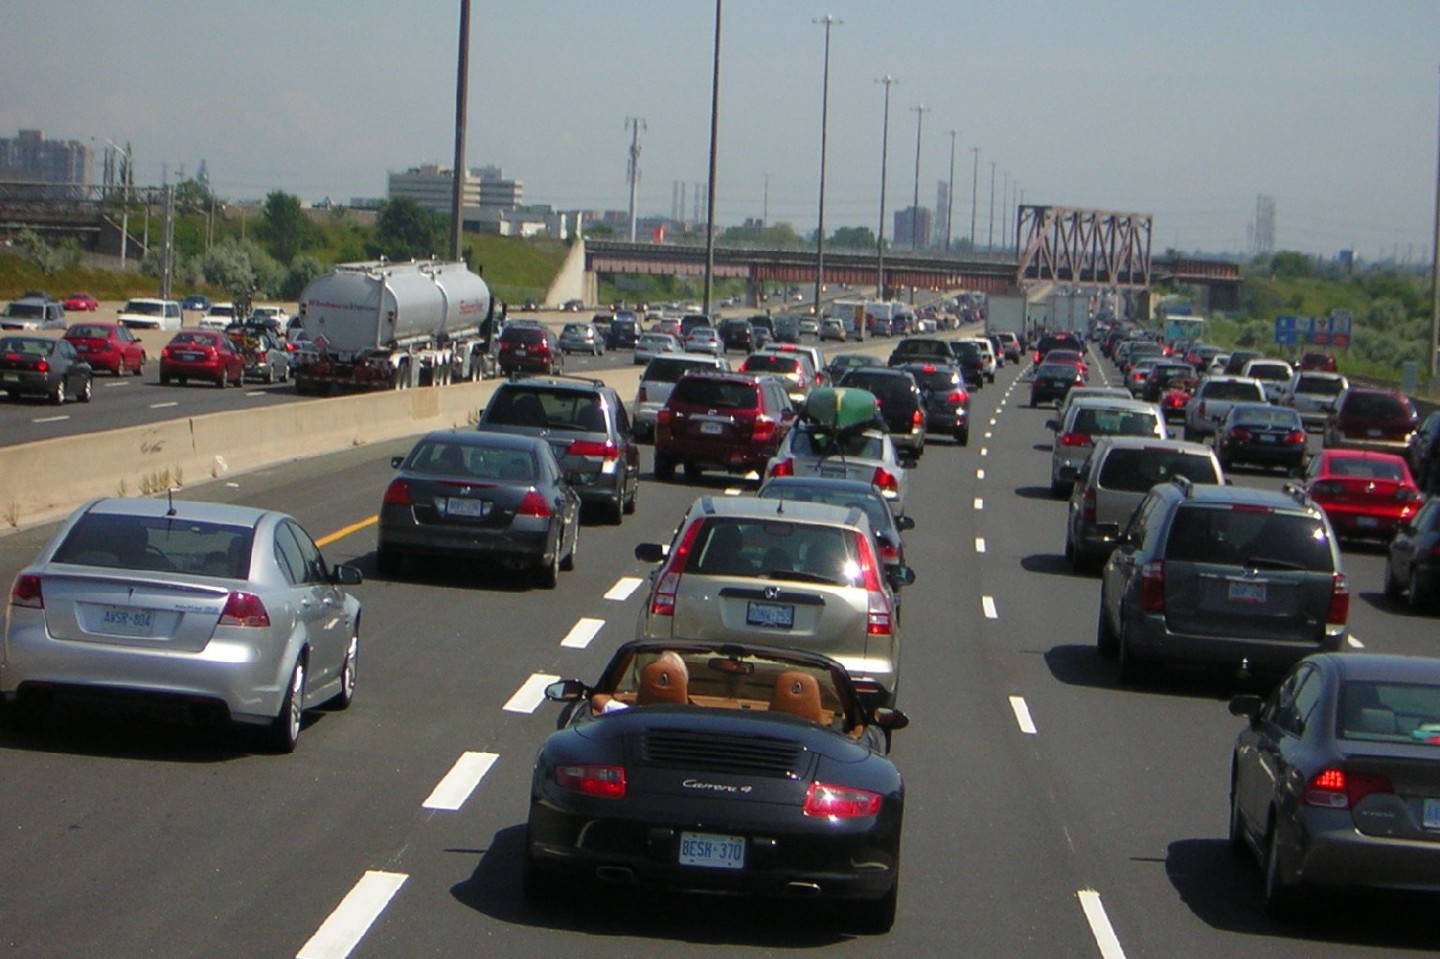
"title": "What Are Traffic Waves and Why Do They Happen So Much?",
"headTitle": "The Lowdown | KQED News",
"content": "\u003cp>\u003cem>Select a car from the bunch, click \"Hit the Brakes\" to slow it down and watch the traffic wave form. The red bars show deceleration levels (braking) and the green, acceleration (speeding up). Mouse over any car to see its velocity and acceleration at any given point during the wave (assuming all the cars are in the same single lane).\u003c/em>\u003c/p>\n\u003cdiv align=\"center\">\n\u003c!-- iframe plugin v.4.3 wordpress.org/plugins/iframe/ -->\u003cbr>\n\u003ciframe src=\"https://lewis500.github.io/waves/road.html\" width=\"800\" height=\"750\" frameborder=\"0\" scrolling=\"no\" class=\"iframe-class\">\u003c/iframe>\n\u003c/div>\n\u003cp>Who doesn't love sitting in traffic?\u003c/p>\n\u003cp>Especially when there's no apparent reason for it: no crashes, no tolls, no flaming mattresses.\u003c/p>\n\u003cp>Just a sudden, infuriating slowdown that forces you to slam on the brakes, spill coffee all over yourself and slow to a glacial crawl, usually when you're already late for something important -- a job interview, for instance.\u003c/p>\n\u003cp>And then, when all hope seems lost, the congestion breaks as seemingly spontaneously as it began. And you're on your way again ... for a good 2 minutes before the whole thing repeats itself.\u003c/p>\n\u003cp>[ad fullwidth]\u003c/p>\n\u003cp>Welcome to the world of traffic waves, a phenomenon that's been exasperating drivers since cars started rolling off Ford's assembly line a century ago.\u003c!--more-->\u003c/p>\n\u003cp>On average, Americans spend upwards of 40 hours a year stuck in traffic, according to Texas A&M's \u003ca href=\"http://mobility.tamu.edu\" target=\"_blank\" rel=\"noopener noreferrer\">annual mobility study\u003c/a>. That figure rises to more than 60 hours in some of the most congested metro areas, like Los Angeles, Washington D.C. and -- yup, you guessed it -- San Francisco. And, contrary to popular belief, much of this congestion is NOT because of major impediments, but simply a result of annoying driving habits that arise when there are just too many cars on the road.\u003c/p>\n\u003cp>The simplest explanation for why traffic waves happen is that we drivers have relatively slow reaction times: if the car in front of you suddenly slows down, it'll likely take you a second or so to hit the brakes. The slower your reaction time, the more you have to brake to keep a safe distance. Same deal for the car behind you, which has to brake even harder than you did in order to slow down that much faster. And so on down the road, like a domino-like effect.\u003c/p>\n\u003cp>To illustrate this concept, Lewis Lehe, a civil engineer and programmer, created the above visualization.\u003c/p>\n\u003cp>The equation he uses is known as the \u003ca href=\"http://en.wikipedia.org/wiki/Intelligent_driver_model\">Intelligent Driver Model\u003c/a>, which was first proposed in 2000 by researchers at Germany's Dresden University of Technology (the designers created \u003ca href=\"http://www.traffic-simulation.de\" target=\"_blank\" rel=\"noopener noreferrer\">this\u003c/a> Java applet demonstration).\u003c/p>\n\u003cp>The formal equations that explain these traffic patterns in terms of individual behavior are called \u003ca href=\"http://en.wikipedia.org/wiki/Microscopic_traffic_flow_model#Car-following_models\">car following models\u003c/a>. They were first developed by researchers at General Motors in the 1950s. This is the simplest such formula:\u003c/p>\n\u003cp>\u003ca href=\"http://ww2.kqed.org/lowdown/wp-content/uploads/sites/26/2013/11/lambda-formula.jpg\">\u003cimg class=\"size-medium wp-image-10529 alignnone\" src=\"http://ww2.kqed.org/lowdown/wp-content/uploads/sites/26/2013/11/lambda-formula-300x56.jpg\" alt=\"lambda formula\" width=\"300\" height=\"56\">\u003c/a>\u003c/p>\n\u003cp>Here, \u003cem>a \u003c/em>is the car's acceleration, Δ\u003cem>v\u003c/em> is the difference in velocity compared with the car behind it,\u003cem> T \u003c/em>is reaction time and ƛ is some constant that researchers estimate from data. The equation says, \"At time\u003cem> t\u003c/em>, you accelerate at a rate proportional to the difference in speed between your car and the speed of the car you're following, but with a gap of \u003cem>T\u003c/em> seconds.\"\u003c/p>\n\u003cp>Put simply, if you're going faster than the car in front of you, then you slow down. And if you're going slower, you speed up.\u003c/p>\n\u003cp>This equation produces the graph below. At the 10-second mark, the grey car slows down, and the cars that brake later have to slow down to subsequently lower minimum speeds. Each line shows the history of the speed of a different car. Drag the slider to graphically see a traffic wave unfold. Note how the cars at the bottom of the chart get closer together with time, as speeds even out.\u003cbr>\n\u003c!-- iframe plugin v.4.3 wordpress.org/plugins/iframe/ -->\u003cbr>\n\u003ciframe src=\"http://lewis500.github.io/waves/chart.html\" width=\"1000\" height=\"450\" frameborder=\"0\" scrolling=\"no\" class=\"iframe-class\">\u003c/iframe>\u003c/p>\n\u003cp>Over time, congestion researchers have developed more complex models of traffic behavior that include realistic conditions and incorporate additional traffic data. For example, our \"simple\" equation assumes that the car in front of you will impact your behavior even if it's a mile away. Some of the first improvements to the equation added terms for the size of that gap and the understanding that cars can slow down much faster than they can speed up. You can read more about the history of car-following models \u003ca href=\"http://ocw.mit.edu/courses/civil-and-environmental-engineering/1-225j-transportation-flow-systems-fall-2002/lecture-notes/carfollowinga.pdf\" target=\"_blank\" rel=\"noopener noreferrer\">here\u003c/a>.\u003c/p>\n\u003chr>\n\u003cp>\u003c/p>\n\u003cp>\u003cem>Lewis Lehe is a PhD student in Civil Engineering at the UC Berkeley, where he researches electronic road tolling and runs the \u003ca href=\"http://vudlab.com\"> Visualizing Urban Data idealab\u003c/a>.\u003c/em>\u003c/p>\n\n",
"disqusIdentifier": "10492 http://blogs.kqed.org/lowdown/?p=10492",
"disqusUrl": "https://ww2.kqed.org/lowdown/2015/12/28/visualization-what-are-traffic-waves-and-why-do-they-happen-so-often/",
"stats": {
"hasVideo": false,
"hasChartOrMap": true,
"hasAudio": false,
"hasPolis": false,
"wordCount": 741,
"hasGoogleForm": false,
"hasGallery": false,
"hasHearkenModule": false,
"iframeSrcs": [
"https://lewis500.github.io/waves/road.html",
"http://lewis500.github.io/waves/chart.html"
],
"paragraphCount": 19
},
"modified": 1646092187,
"excerpt": null,
"headData": {
"twImgId": "",
"twTitle": "",
"ogTitle": "",
"ogImgId": "",
"twDescription": "",
"description": "Select a car from the bunch, click “Hit the Brakes” to slow it down and watch the traffic wave form. The red bars show deceleration levels (braking) and the green, acceleration (speeding up). Mouse over any car to see its velocity and acceleration at any given point during the wave (assuming all the cars are",
"title": "What Are Traffic Waves and Why Do They Happen So Much? - The Lowdown",
"ogDescription": "",
"schema": {
"@context": "https://schema.org",
"@type": "Article",
"headline": "What Are Traffic Waves and Why Do They Happen So Much?",
"datePublished": "2015-12-28T12:00:27-08:00",
"dateModified": "2022-02-28T15:49:47-08:00",
"image": "https://cdn.kqed.org/wp-content/uploads/2020/02/KQED-OG-Image@1x.png"
}
},
"guestAuthors": [],
"slug": "visualization-what-are-traffic-waves-and-why-do-they-happen-so-often",
"status": "publish",
"customPermalink": "2013/11/12/traffic-waves/",
"excludeFromSiteSearch": "Include",
"path": "/lowdown/10492/visualization-what-are-traffic-waves-and-why-do-they-happen-so-often",
"audioTrackLength": null,
"parsedContent": [
{
"type": "contentString",
"content": "\u003cdiv class=\"post-body\">\u003cp>\u003cp>\u003cem>Select a car from the bunch, click \"Hit the Brakes\" to slow it down and watch the traffic wave form. The red bars show deceleration levels (braking) and the green, acceleration (speeding up). Mouse over any car to see its velocity and acceleration at any given point during the wave (assuming all the cars are in the same single lane).\u003c/em>\u003c/p>\n\u003cdiv align=\"center\">\n\u003c!-- iframe plugin v.4.3 wordpress.org/plugins/iframe/ -->\u003cbr>\n\u003ciframe src=\"https://lewis500.github.io/waves/road.html\" width=\"800\" height=\"750\" frameborder=\"0\" scrolling=\"no\" class=\"iframe-class\">\u003c/iframe>\n\u003c/div>\n\u003cp>Who doesn't love sitting in traffic?\u003c/p>\n\u003cp>Especially when there's no apparent reason for it: no crashes, no tolls, no flaming mattresses.\u003c/p>\n\u003cp>Just a sudden, infuriating slowdown that forces you to slam on the brakes, spill coffee all over yourself and slow to a glacial crawl, usually when you're already late for something important -- a job interview, for instance.\u003c/p>\n\u003cp>And then, when all hope seems lost, the congestion breaks as seemingly spontaneously as it began. And you're on your way again ... for a good 2 minutes before the whole thing repeats itself.\u003c/p>\n\u003cp>\u003c/p>\u003c/div>",
"attributes": {
"named": {},
"numeric": []
}
},
{
"type": "component",
"content": "",
"name": "ad",
"attributes": {
"named": {
"label": "fullwidth"
},
"numeric": [
"fullwidth"
]
}
},
{
"type": "contentString",
"content": "\u003cdiv class=\"post-body\">\u003cp>\u003c/p>\n\u003cp>Welcome to the world of traffic waves, a phenomenon that's been exasperating drivers since cars started rolling off Ford's assembly line a century ago.\u003c!--more-->\u003c/p>\n\u003cp>On average, Americans spend upwards of 40 hours a year stuck in traffic, according to Texas A&M's \u003ca href=\"http://mobility.tamu.edu\" target=\"_blank\" rel=\"noopener noreferrer\">annual mobility study\u003c/a>. That figure rises to more than 60 hours in some of the most congested metro areas, like Los Angeles, Washington D.C. and -- yup, you guessed it -- San Francisco. And, contrary to popular belief, much of this congestion is NOT because of major impediments, but simply a result of annoying driving habits that arise when there are just too many cars on the road.\u003c/p>\n\u003cp>The simplest explanation for why traffic waves happen is that we drivers have relatively slow reaction times: if the car in front of you suddenly slows down, it'll likely take you a second or so to hit the brakes. The slower your reaction time, the more you have to brake to keep a safe distance. Same deal for the car behind you, which has to brake even harder than you did in order to slow down that much faster. And so on down the road, like a domino-like effect.\u003c/p>\n\u003cp>To illustrate this concept, Lewis Lehe, a civil engineer and programmer, created the above visualization.\u003c/p>\n\u003cp>The equation he uses is known as the \u003ca href=\"http://en.wikipedia.org/wiki/Intelligent_driver_model\">Intelligent Driver Model\u003c/a>, which was first proposed in 2000 by researchers at Germany's Dresden University of Technology (the designers created \u003ca href=\"http://www.traffic-simulation.de\" target=\"_blank\" rel=\"noopener noreferrer\">this\u003c/a> Java applet demonstration).\u003c/p>\n\u003cp>The formal equations that explain these traffic patterns in terms of individual behavior are called \u003ca href=\"http://en.wikipedia.org/wiki/Microscopic_traffic_flow_model#Car-following_models\">car following models\u003c/a>. They were first developed by researchers at General Motors in the 1950s. This is the simplest such formula:\u003c/p>\n\u003cp>\u003ca href=\"http://ww2.kqed.org/lowdown/wp-content/uploads/sites/26/2013/11/lambda-formula.jpg\">\u003cimg class=\"size-medium wp-image-10529 alignnone\" src=\"http://ww2.kqed.org/lowdown/wp-content/uploads/sites/26/2013/11/lambda-formula-300x56.jpg\" alt=\"lambda formula\" width=\"300\" height=\"56\">\u003c/a>\u003c/p>\n\u003cp>Here, \u003cem>a \u003c/em>is the car's acceleration, Δ\u003cem>v\u003c/em> is the difference in velocity compared with the car behind it,\u003cem> T \u003c/em>is reaction time and ƛ is some constant that researchers estimate from data. The equation says, \"At time\u003cem> t\u003c/em>, you accelerate at a rate proportional to the difference in speed between your car and the speed of the car you're following, but with a gap of \u003cem>T\u003c/em> seconds.\"\u003c/p>\n\u003cp>Put simply, if you're going faster than the car in front of you, then you slow down. And if you're going slower, you speed up.\u003c/p>\n\u003cp>This equation produces the graph below. At the 10-second mark, the grey car slows down, and the cars that brake later have to slow down to subsequently lower minimum speeds. Each line shows the history of the speed of a different car. Drag the slider to graphically see a traffic wave unfold. Note how the cars at the bottom of the chart get closer together with time, as speeds even out.\u003cbr>\n\u003c!-- iframe plugin v.4.3 wordpress.org/plugins/iframe/ -->\u003cbr>\n\u003ciframe src=\"http://lewis500.github.io/waves/chart.html\" width=\"1000\" height=\"450\" frameborder=\"0\" scrolling=\"no\" class=\"iframe-class\">\u003c/iframe>\u003c/p>\n\u003cp>Over time, congestion researchers have developed more complex models of traffic behavior that include realistic conditions and incorporate additional traffic data. For example, our \"simple\" equation assumes that the car in front of you will impact your behavior even if it's a mile away. Some of the first improvements to the equation added terms for the size of that gap and the understanding that cars can slow down much faster than they can speed up. You can read more about the history of car-following models \u003ca href=\"http://ocw.mit.edu/courses/civil-and-environmental-engineering/1-225j-transportation-flow-systems-fall-2002/lecture-notes/carfollowinga.pdf\" target=\"_blank\" rel=\"noopener noreferrer\">here\u003c/a>.\u003c/p>\n\u003chr>\n\u003cp>\u003c/p>\n\u003cp>\u003cem>Lewis Lehe is a PhD student in Civil Engineering at the UC Berkeley, where he researches electronic road tolling and runs the \u003ca href=\"http://vudlab.com\"> Visualizing Urban Data idealab\u003c/a>.\u003c/em>\u003c/p>\n\n\u003c/div>\u003c/p>",
"attributes": {
"named": {},
"numeric": []
}
}
],
"link": "/lowdown/10492/visualization-what-are-traffic-waves-and-why-do-they-happen-so-often",
"authors": [
"1263",
"7527"
],
"categories": [
"lowdown_391",
"lowdown_566",
"lowdown_1",
"lowdown_243",
"lowdown_2408"
],
"tags": [
"lowdown_423",
"lowdown_2337",
"lowdown_422",
"lowdown_424"
],
"featImg": "lowdown_10504",
"label": "lowdown"
},
"lowdown_8366": {
"type": "posts",
"id": "lowdown_8366",
"meta": {
"index": "posts_1716263798",
"site": "lowdown",
"id": "8366",
"score": null,
"sort": [
1438390844000
]
},
"parent": 0,
"labelTerm": {
"site": "lowdown"
},
"blocks": [],
"publishDate": 1438390844,
"format": "standard",
"disqusTitle": "You Can't Ride BART Across the Bay This Weekend So May As Well Learn Something About It Instead",
"title": "You Can't Ride BART Across the Bay This Weekend So May As Well Learn Something About It Instead",
"headTitle": "The Lowdown | KQED News",
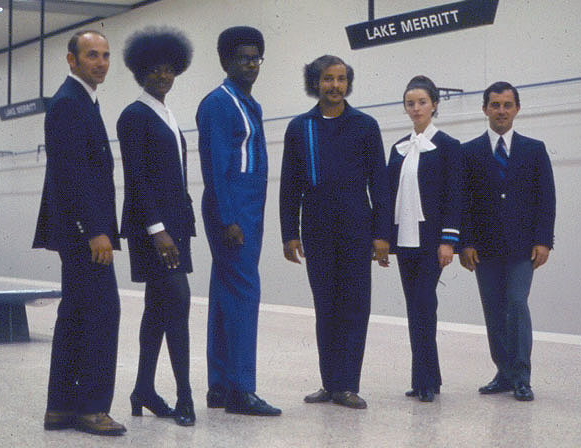
"content": "\u003cp>Bay Area traffic might suck, but when BART's not running, it sucks a whole lot more.\u003c/p>\n\u003cp>That'll likely be made painfully clear all day Saturday and Sunday (August 1 and 2) when \u003ca href=\"http://ww2.kqed.org/news/2015/07/31/bart-riders-brace-for-weekend-without-transbay-train-service\" target=\"_blank\">BART closes\u003c/a> the Transbay Tube for major track repairs, severing a major transportation artery between the East Bay and San Francisco, and forcing thousands of disgruntled riders into buses, cars and ferries.\u003c/p>\n\u003cp>Love it or hate it, there's little denying how crucial a role BART plays in keeping the Bay Area mobile.\u003c/p>\n\u003cp>So, what better time for a little BART 101? If anything, it'll help pass the time while you're at a standstill on the highway.\u003c/p>\n\u003cp>\u003cem>(Note: Much of the following historical information is adapted from \u003ca href=\"http://www.bart.gov/about/history/\" target=\"_blank\">BART's official history\u003c/a>.)\u003c/em>\u003c/p>\n\u003cp>[ad fullwidth]\u003c/p>\n\u003cp>The Bay Area Rapid Transit system transports nearly 400,000 passengers on an average weekday. It's the nation’s fifth-largest rail system, with 104-miles of track stretching from the far reaches of the Bay Area's eastern suburbs to San Francisco International Airport, south of the city.\u003c/p>\n\u003cp>So when trains don't run, things get real messy real quick.\u003c/p>\n\u003cp>Which makes it all the more surprising that BART hasn't been around for that long: operations started just over 40 years ago. Compare that to New York City’s much larger subway system, that started running in 1904, or Boston’s even older rail network that first rolled in 1897.\u003c/p>\n\u003cp>So how'd we get around before BART?\u003c/p>\n\u003ch4>The Key System\u003c/h4>\n\u003cp>In 1903, a privately-run mass transit network called the Key System (or Key Route) began providing bus and streetcar service in Oakland, Berkeley and various of other East Bay cities. In the 1940s and 1950s, the network also operated regular commuter rail service to San Francisco via the lower deck of the Bay Bridge. But by 1958, in the face of booming highway construction and rapidly rising car ownership rates, transbay service was dismantled. (\u003ca href=\"http://books.google.com/books?id=5MLwbXZc9NIC&pg=PA127&lpg=PA127&dq=key+system+1948&source=bl&ots=4SQBjPJc_E&sig=S4stF2kx3s0bt4DIpfCB7UBI-RY&hl=en&sa=X&ei=AfZeUt6VPKSiiQLN0YDQAQ&ved=0CHIQ6AEwCA#v=onepage&q&f=false\" target=\"_blank\">The Key System: San Francisco and the Eastshore Empire\u003c/a>, by Walter Rice and Emiliano Echeverria, provides an interesting history of the system.)\u003c/p>\n\u003cp>Two years later, a newly formed public agency called AC Transit bought the Key System's existing East Bay bus routes (the streetcars had been phased out by 1948).\u003c/p>\n\u003cp>\u003cem>Check out this lengthy but heartily entertaining Key System promo video ... with a nice little revisionist history of California, replete with descriptions like this: \"Life in Spanish California was leisurely and gay. A warmhearted people in a kind and bountiful land expressed themselves in colorful fiestas. Where … lovely senoritas and dashing caballeros danced the exciting steps of old Castile.\"\u003c/em>\u003c/p>\n\u003cp>https://youtu.be/LhNDZV1uDUg\u003c/p>\n\u003ch4>BART is born\u003c/h4>\n\u003cp>By 1950, nearly \u003ca href=\"http://www.bayareacensus.ca.gov/bayarea.htm\" target=\"_blank\">2.7 million people lived in the Bay Area\u003c/a>, about a million more than the previous decade. It was the beginning of a regional population boom that would continue to grow by roughly a million people every decade for the next fifty years, guaranteeing increasingly heavy congestion on roadways.\u003c/p>\n\u003cp>A state commission created years earlier to study the Bay Area's long-term transportation needs, recommended the construction of a five-county rapid rail network linking major commercial centers to suburban communities.\u003c/p>\n\u003cp>In its 1957 report, the commission said:\u003c/p>\n\u003cfigure id=\"attachment_8401\" class=\"wp-caption alignleft\" style=\"max-width: 203px\">\u003ca href=\"http://ww2.kqed.org/lowdown/wp-content/uploads/sites/26/2013/07/tubelowered380_BART.go_.png\">\u003cimg class=\"size-medium wp-image-8401 \" src=\"http://ww2.kqed.org/lowdown/wp-content/uploads/sites/26/2013/07/tubelowered380_BART.go_-300x381.png\" alt=\"A segment of the transbay tube is lowered into the Bay (courtesy of bart.gov).\" width=\"203\" height=\"259\">\u003c/a>\u003cfigcaption class=\"wp-caption-text\">A segment of the transbay tube is lowered into the Bay/BART.gov\u003c/figcaption>\u003c/figure>\n\u003cp>\u003cem>\"If the Bay Area is to be preserved as a fine place to live and work, a regional rapid transit system is essential to prevent total dependence on automobiles and freeways.\"\u003c/em>\u003c/p>\n\u003cp>The original plan included San Mateo and Marin counties, both of which eventually bailed amidst cost concerns (as well as controversy over the feasibility of running a line across the Golden Gate Bridge). The final proposal included a 71.5 mile electric rail system with 33 stations in 17 cities spread across the counties of Alameda, Contra Costa and San Francisco. Among the largest public works projects in history, the total cost was projected at just shy of $1 billion, with the brunt of funding from a bond measure approved by voters in the 1962 general election. The project ended up with a price tag of more than $1.6 billion.\u003c/p>\n\u003cp>BART construction officially commenced in June 1964. President Lyndon Johnson presided over the groundbreaking ceremony of the 4.4-mile Diablo Test Track between Concord and Walnut Creek. By January 1966, construction of the Oakland subway began, and in November of that year, the first of 57 giant steel and concrete sections of the 3.8 mile transbay tube was lowered to the bottom of the Bay. The tube was completed in August 1969, and for a brief window, the public was allowed to bike and walk through it.\u003c/p>\n\u003cp>https://www.youtube.com/watch?v=GUA_F01c4f0\u003c/p>\n\u003ch4>Big wheels start turning\u003c/h4>\n\u003cp>After 466 days, workers completed a 3.2-mile bore through the hard rock of the Berkeley Hills in February 1967, and that summer, crews started construction of a subway section about 100 feet below Market Street in San Francisco.\u003c/p>\n\u003cp>BART began offering service to the public on September 11, 1972, on a 28-mile segment between Fremont and MacArthur stations. The day before, the Oakland Tribune published a 40-page special section, declaring: \"BART is no longer a dream. It's here and it's yours.\"\u003c/p>\n\u003cp>Transbay rides, however, didn't begin until September 16, 1974.\u003c/p>\n\u003cp>In the end, the monumental project took many years longer and hundreds of millions of dollars more to complete than originally anticipated.\u003c/p>\n\u003cp>\u003c/p>\n\u003cp>Today the system has 44 stations serviced by a 669-car electric fleet that many considered downright revolutionary. In 1973, the first full year of operation, BART's average weekday ridership was about 32,000. By 2014, the average had risen to 403,680, totaling roughly\u003ca href=\"https://www.bart.gov/sites/default/files/docs/2014BARTFactsheet_Final%20011614.pdf\" target=\"_blank\"> 122 million trips annually\u003c/a>. The system had its highest daily ridership on Nov. 3, 2010, the day of the Giant's World Series victory parade, with 522,200 recorded exits. This summer's Warriors victory parade was a close second, with \u003ca href=\"https://www.bart.gov/news/articles/2015/news20150620\" target=\"_blank\">more than 551,000\u003c/a> rowdy riders.\u003c/p>\n\n",
"disqusIdentifier": "8366 http://blogs.kqed.org/lowdown/?p=8366",
"disqusUrl": "https://ww2.kqed.org/lowdown/2015/07/31/a-brief-history-of-bart-and-how-we-got-around-before-it/",
"stats": {
"hasVideo": true,
"hasChartOrMap": false,
"hasAudio": false,
"hasPolis": false,
"wordCount": 1011,
"hasGoogleForm": false,
"hasGallery": false,
"hasHearkenModule": false,
"iframeSrcs": [],
"paragraphCount": 25
},
"modified": 1438466789,
"excerpt": null,
"headData": {
"twImgId": "",
"twTitle": "",
"ogTitle": "",
"ogImgId": "",
"twDescription": "",
"description": "Bay Area traffic might suck, but when BART's not running, it sucks a whole lot more. That'll likely be made painfully clear all day Saturday and Sunday (August 1 and 2) when BART closes the Transbay Tube for major track repairs, severing a major transportation artery between the East Bay and San Francisco, and forcing",
"title": "You Can't Ride BART Across the Bay This Weekend So May As Well Learn Something About It Instead | KQED",
"ogDescription": "",
"schema": {
"@context": "https://schema.org",
"@type": "Article",
"headline": "You Can't Ride BART Across the Bay This Weekend So May As Well Learn Something About It Instead",
"datePublished": "2015-07-31T18:00:44-07:00",
"dateModified": "2015-08-01T15:06:29-07:00",
"image": "https://cdn.kqed.org/wp-content/uploads/2020/02/KQED-OG-Image@1x.png"
}
},
"guestAuthors": [],
"slug": "a-brief-history-of-bart-and-how-we-got-around-before-it",
"status": "publish",
"customPermalink": "2013/07/03/a-brief-history-of-bart-and-how-we-got-around-before-it/",
"path": "/lowdown/8366/a-brief-history-of-bart-and-how-we-got-around-before-it",
"audioTrackLength": null,
"parsedContent": [
{
"type": "contentString",
"content": "\u003cdiv class=\"post-body\">\u003cp>\u003cp>Bay Area traffic might suck, but when BART's not running, it sucks a whole lot more.\u003c/p>\n\u003cp>That'll likely be made painfully clear all day Saturday and Sunday (August 1 and 2) when \u003ca href=\"http://ww2.kqed.org/news/2015/07/31/bart-riders-brace-for-weekend-without-transbay-train-service\" target=\"_blank\">BART closes\u003c/a> the Transbay Tube for major track repairs, severing a major transportation artery between the East Bay and San Francisco, and forcing thousands of disgruntled riders into buses, cars and ferries.\u003c/p>\n\u003cp>Love it or hate it, there's little denying how crucial a role BART plays in keeping the Bay Area mobile.\u003c/p>\n\u003cp>So, what better time for a little BART 101? If anything, it'll help pass the time while you're at a standstill on the highway.\u003c/p>\n\u003cp>\u003cem>(Note: Much of the following historical information is adapted from \u003ca href=\"http://www.bart.gov/about/history/\" target=\"_blank\">BART's official history\u003c/a>.)\u003c/em>\u003c/p>\n\u003cp>\u003c/p>\u003c/div>",
"attributes": {
"named": {},
"numeric": []
}
},
{
"type": "component",
"content": "",
"name": "ad",
"attributes": {
"named": {
"label": "fullwidth"
},
"numeric": [
"fullwidth"
]
}
},
{
"type": "contentString",
"content": "\u003cdiv class=\"post-body\">\u003cp>\u003c/p>\n\u003cp>The Bay Area Rapid Transit system transports nearly 400,000 passengers on an average weekday. It's the nation’s fifth-largest rail system, with 104-miles of track stretching from the far reaches of the Bay Area's eastern suburbs to San Francisco International Airport, south of the city.\u003c/p>\n\u003cp>So when trains don't run, things get real messy real quick.\u003c/p>\n\u003cp>Which makes it all the more surprising that BART hasn't been around for that long: operations started just over 40 years ago. Compare that to New York City’s much larger subway system, that started running in 1904, or Boston’s even older rail network that first rolled in 1897.\u003c/p>\n\u003cp>So how'd we get around before BART?\u003c/p>\n\u003ch4>The Key System\u003c/h4>\n\u003cp>In 1903, a privately-run mass transit network called the Key System (or Key Route) began providing bus and streetcar service in Oakland, Berkeley and various of other East Bay cities. In the 1940s and 1950s, the network also operated regular commuter rail service to San Francisco via the lower deck of the Bay Bridge. But by 1958, in the face of booming highway construction and rapidly rising car ownership rates, transbay service was dismantled. (\u003ca href=\"http://books.google.com/books?id=5MLwbXZc9NIC&pg=PA127&lpg=PA127&dq=key+system+1948&source=bl&ots=4SQBjPJc_E&sig=S4stF2kx3s0bt4DIpfCB7UBI-RY&hl=en&sa=X&ei=AfZeUt6VPKSiiQLN0YDQAQ&ved=0CHIQ6AEwCA#v=onepage&q&f=false\" target=\"_blank\">The Key System: San Francisco and the Eastshore Empire\u003c/a>, by Walter Rice and Emiliano Echeverria, provides an interesting history of the system.)\u003c/p>\n\u003cp>Two years later, a newly formed public agency called AC Transit bought the Key System's existing East Bay bus routes (the streetcars had been phased out by 1948).\u003c/p>\n\u003cp>\u003cem>Check out this lengthy but heartily entertaining Key System promo video ... with a nice little revisionist history of California, replete with descriptions like this: \"Life in Spanish California was leisurely and gay. A warmhearted people in a kind and bountiful land expressed themselves in colorful fiestas. Where … lovely senoritas and dashing caballeros danced the exciting steps of old Castile.\"\u003c/em>\u003c/p>\u003c/p>\u003cp>\u003cspan class='utils-parseShortcode-shortcodes-__youtubeShortcode__embedYoutube'>\n \u003cspan class='utils-parseShortcode-shortcodes-__youtubeShortcode__embedYoutubeInside'>\n \u003ciframe\n loading='lazy'\n class='utils-parseShortcode-shortcodes-__youtubeShortcode__youtubePlayer'\n type='text/html'\n src='//www.youtube.com/embed/LhNDZV1uDUg'\n title='//www.youtube.com/embed/LhNDZV1uDUg'\n allowfullscreen='true'\n style='border:0;'>\u003c/iframe>\n \u003c/span>\n \u003c/span>\u003c/p>\u003cp>\u003ch4>BART is born\u003c/h4>\n\u003cp>By 1950, nearly \u003ca href=\"http://www.bayareacensus.ca.gov/bayarea.htm\" target=\"_blank\">2.7 million people lived in the Bay Area\u003c/a>, about a million more than the previous decade. It was the beginning of a regional population boom that would continue to grow by roughly a million people every decade for the next fifty years, guaranteeing increasingly heavy congestion on roadways.\u003c/p>\n\u003cp>A state commission created years earlier to study the Bay Area's long-term transportation needs, recommended the construction of a five-county rapid rail network linking major commercial centers to suburban communities.\u003c/p>\n\u003cp>In its 1957 report, the commission said:\u003c/p>\n\u003cfigure id=\"attachment_8401\" class=\"wp-caption alignleft\" style=\"max-width: 203px\">\u003ca href=\"http://ww2.kqed.org/lowdown/wp-content/uploads/sites/26/2013/07/tubelowered380_BART.go_.png\">\u003cimg class=\"size-medium wp-image-8401 \" src=\"http://ww2.kqed.org/lowdown/wp-content/uploads/sites/26/2013/07/tubelowered380_BART.go_-300x381.png\" alt=\"A segment of the transbay tube is lowered into the Bay (courtesy of bart.gov).\" width=\"203\" height=\"259\">\u003c/a>\u003cfigcaption class=\"wp-caption-text\">A segment of the transbay tube is lowered into the Bay/BART.gov\u003c/figcaption>\u003c/figure>\n\u003cp>\u003cem>\"If the Bay Area is to be preserved as a fine place to live and work, a regional rapid transit system is essential to prevent total dependence on automobiles and freeways.\"\u003c/em>\u003c/p>\n\u003cp>The original plan included San Mateo and Marin counties, both of which eventually bailed amidst cost concerns (as well as controversy over the feasibility of running a line across the Golden Gate Bridge). The final proposal included a 71.5 mile electric rail system with 33 stations in 17 cities spread across the counties of Alameda, Contra Costa and San Francisco. Among the largest public works projects in history, the total cost was projected at just shy of $1 billion, with the brunt of funding from a bond measure approved by voters in the 1962 general election. The project ended up with a price tag of more than $1.6 billion.\u003c/p>\n\u003cp>BART construction officially commenced in June 1964. President Lyndon Johnson presided over the groundbreaking ceremony of the 4.4-mile Diablo Test Track between Concord and Walnut Creek. By January 1966, construction of the Oakland subway began, and in November of that year, the first of 57 giant steel and concrete sections of the 3.8 mile transbay tube was lowered to the bottom of the Bay. The tube was completed in August 1969, and for a brief window, the public was allowed to bike and walk through it.\u003c/p>\u003c/p>\u003cp>\u003cspan class='utils-parseShortcode-shortcodes-__youtubeShortcode__embedYoutube'>\n \u003cspan class='utils-parseShortcode-shortcodes-__youtubeShortcode__embedYoutubeInside'>\n \u003ciframe\n loading='lazy'\n class='utils-parseShortcode-shortcodes-__youtubeShortcode__youtubePlayer'\n type='text/html'\n src='//www.youtube.com/embed/GUA_F01c4f0'\n title='//www.youtube.com/embed/GUA_F01c4f0'\n allowfullscreen='true'\n style='border:0;'>\u003c/iframe>\n \u003c/span>\n \u003c/span>\u003c/p>\u003cp>\u003ch4>Big wheels start turning\u003c/h4>\n\u003cp>After 466 days, workers completed a 3.2-mile bore through the hard rock of the Berkeley Hills in February 1967, and that summer, crews started construction of a subway section about 100 feet below Market Street in San Francisco.\u003c/p>\n\u003cp>BART began offering service to the public on September 11, 1972, on a 28-mile segment between Fremont and MacArthur stations. The day before, the Oakland Tribune published a 40-page special section, declaring: \"BART is no longer a dream. It's here and it's yours.\"\u003c/p>\n\u003cp>Transbay rides, however, didn't begin until September 16, 1974.\u003c/p>\n\u003cp>In the end, the monumental project took many years longer and hundreds of millions of dollars more to complete than originally anticipated.\u003c/p>\n\u003cp>\u003c/p>\n\u003cp>Today the system has 44 stations serviced by a 669-car electric fleet that many considered downright revolutionary. In 1973, the first full year of operation, BART's average weekday ridership was about 32,000. By 2014, the average had risen to 403,680, totaling roughly\u003ca href=\"https://www.bart.gov/sites/default/files/docs/2014BARTFactsheet_Final%20011614.pdf\" target=\"_blank\"> 122 million trips annually\u003c/a>. The system had its highest daily ridership on Nov. 3, 2010, the day of the Giant's World Series victory parade, with 522,200 recorded exits. This summer's Warriors victory parade was a close second, with \u003ca href=\"https://www.bart.gov/news/articles/2015/news20150620\" target=\"_blank\">more than 551,000\u003c/a> rowdy riders.\u003c/p>\n\n\u003c/div>\u003c/p>",
"attributes": {
"named": {},
"numeric": []
}
}
],
"link": "/lowdown/8366/a-brief-history-of-bart-and-how-we-got-around-before-it",
"authors": [
"1263"
],
"categories": [
"lowdown_566"
],
"tags": [
"lowdown_375",
"lowdown_2337"
],
"featImg": "lowdown_8420",
"label": "lowdown"
},
"lowdown_14507": {
"type": "posts",
"id": "lowdown_14507",
"meta": {
"index": "posts_1716263798",
"site": "lowdown",
"id": "14507",
"score": null,
"sort": [
1420683709000
]
},
"parent": 0,
"labelTerm": {
"site": "lowdown"
},
"blocks": [],
"publishDate": 1420683709,
"format": "aside",
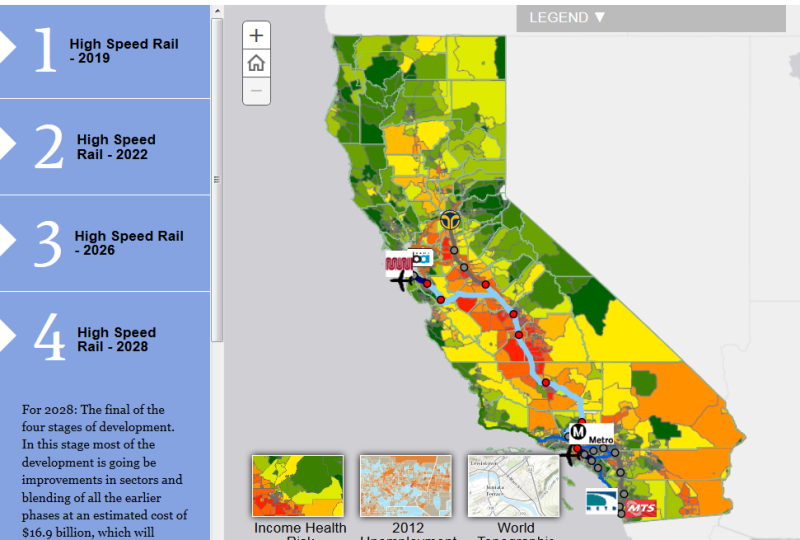
"disqusTitle": "Preview: What Different Stages of California's High-Speed Rail Will Look Like [Interactive Map]",
"title": "Preview: What Different Stages of California's High-Speed Rail Will Look Like [Interactive Map]",
"headTitle": "The Lowdown | KQED News",
"content": "\u003cp>\u003cimg class=\"alignright wp-image-15509 size-medium\" src=\"http://ww2.kqed.org/lowdown/wp-content/uploads/sites/26/2015/01/screenshot-e1420744870746-300x202.png\" alt=\"\" width=\"300\" height=\"202\">Even the Golden Gate Bridge, that most hallowed of local landmarks, had its naysayers.\u003c/p>\n\u003cp>Photographer Ansel Adams worried the bridge would despoil the pristine view (he later made peace with it). Ferry companies lobbied hard to kill the project. And even the Commonwealth Club of California passed a resolution, stating the timing was “inopportune,” according to historian \u003ca href=\"https://books.google.com/books?id=ZzTfd8zY-B0C&dq=Commonwealth+Club+of+California+passed+a+resolution,+stating+the+timing+was+%E2%80%9Cinopportune.%E2%80%9D\" target=\"_blank\">Kevin Starr\u003c/a>.\u003c/p>\n\u003cp>\u003c!--more-->\u003c/p>\n\u003cp>Costly public infrastructure projects have always faced strong opposition. And that makes sense, given the leap of faith required: they're huge, long-term investments, often completed over budget and past schedule and with hard-to-imagine benefits. Take BART, for instance: love it or hate it, few today would challenge the indispensability of the regional transit system. But at the time of conception and construction, skeptics abounded; a 1962 funding measure was only narrowly approved by voters.\u003c/p>\n\u003cp>California's high-speed rail plan is no exception.\u003c/p>\n\u003cp>[ad fullwidth]\u003c/p>\n\u003cp>The proposed system, slated for completion in 2028, would connect the Los Angeles and San Francisco metro areas via the Central Valley; total estimated commute time: under 3 hours. Following on the heels of Europe, China and Japan, it would be the first bona fide high-speed rail system in the United States.\u003c/p>\n\u003cp>But in the six years since voters passed a $10 billion bond measure to jump-start the project, not a single track has been laid, the effort stalled by a steady steam of political opposition, fierce litigation and funding uncertainty. Critics argue the project is a boondoggle that will exhaust precious state funds and be sorely mismanaged, underused and antiquated by the time it's done.\u003c/p>\n\u003cp>On Tuesday, though, the project got a much needed boost, as Governor Jerry Brown, a staunch proponent, declared tentative victory. Flanked by dignitaries and workers in decorative hardhats, and within earshot of protestors, Brown presided over a ceremonial groundbreaking on the site of a planned Fresno station (although there didn't actually seem to be any literal breaking of ground).\u003c/p>\n\u003cp>\"Everything big runs into opposition,\" \u003ca href=\"http://www.sacbee.com/news/politics-government/capitol-alert/article5519280.html\" target=\"_blank\">Brown intoned at the event\u003c/a>. \"People do get pusillanimous. I wanted to use that word because that's the adjective I'm going to affix to all the critics. You can go look it up right now on your cell phone. Means weak of spirit.\" (\u003ca href=\"//www.merriam-webster.com/dictionary/pusillanimous\" target=\"_blank\">Merriam-Webster\u003c/a> actually defines it as \"\u003cspan class=\"ssens\">lacking courage and resolution,\" but close enough.) \u003c/span>\u003c/p>\n\u003cp>He added: \"There's no anti-texting rule on the trains. So that's another reason [to ride]. If there's no other reason, it's you can use your iPhone. And enjoy it. And you can have a martini or whatever you people drink.\"\u003c/p>\n\u003cp>All of which begs the question: where exactly will the train take you while you're sipping that fancy cocktail? Plans have changed repeatedly since the original rail proposal was floated years ago. Fortunately, the folks at UC Davis' \u003ca href=\"http://ice.ucdavis.edu/\" target=\"_blank\">Information Center for the Environment\u003c/a> created this interesting interactive \"story map,\" in partnership with the \u003ca href=\"http://www.hsr.ca.gov/\" target=\"_blank\">California High Speed Rail Authority\u003c/a> and Esri. The map, which suggests the designers support for the project, illustrates the different proposed phases as they currently stand, detailing the stations, fares and local transit lines along the way. It can also be viewed layered with farmland conversion data, as well as unemployment and \u003ca href=\"http://oehha.ca.gov/ej/ces2.html\" target=\"_blank\">environmental health figures\u003c/a>, a nod to advocates who claim the project will be a major economic boon to some of California's poorest regions.\u003c/p>\n\u003cp>Map data is based on the High-Speed Rail Authority's 2014 \u003ca href=\"http://hsr.ca.gov/docs/about/business_plans/BPlan_2014_Business_Plan_Final.pdf\" target=\"_blank\">business plan\u003c/a> released in April. It includes the most recent plans for the controversial \"blended system,\" wherein operations of the HSR system are shared with portions of other rail systems (including Caltrain and the Southern California Regional Rail Authority).\u003c/p>\n\u003cp>\u003c/p>\n\u003cp>\u003c!-- iframe plugin v.4.3 wordpress.org/plugins/iframe/ -->\u003cbr>\n\u003ciframe src=\"//ice.ucdavis.edu/hsr/\" width=\"950\" height=\"750\" frameborder=\"0\" allowfullscreen=\"allowfullscreen\" scrolling=\"yes\" class=\"iframe-class\">\u003c/iframe>\u003c/p>\n\n",
"disqusIdentifier": "14507 http://blogs.kqed.org/lowdown/?p=14507",
"disqusUrl": "https://ww2.kqed.org/lowdown/2015/01/07/what-the-different-stages-of-californias-high-speed-rail-project-will-look-like-interactive-map/",
"stats": {
"hasVideo": false,
"hasChartOrMap": true,
"hasAudio": false,
"hasPolis": false,
"wordCount": 618,
"hasGoogleForm": false,
"hasGallery": false,
"hasHearkenModule": false,
"iframeSrcs": [
"//ice.ucdavis.edu/hsr/"
],
"paragraphCount": 15
},
"modified": 1516902892,
"excerpt": null,
"headData": {
"twImgId": "",
"twTitle": "",
"ogTitle": "",
"ogImgId": "",
"twDescription": "",
"description": "Even the Golden Gate Bridge, that most hallowed of local landmarks, had its naysayers. Photographer Ansel Adams worried the bridge would despoil the pristine view (he later made peace with it). Ferry companies lobbied hard to kill the project. And even the Commonwealth Club of California passed a resolution, stating the timing was “inopportune,” according",
"title": "Preview: What Different Stages of California's High-Speed Rail Will Look Like [Interactive Map] | KQED",
"ogDescription": "",
"schema": {
"@context": "https://schema.org",
"@type": "Article",
"headline": "Preview: What Different Stages of California's High-Speed Rail Will Look Like [Interactive Map]",
"datePublished": "2015-01-07T18:21:49-08:00",
"dateModified": "2018-01-25T09:54:52-08:00",
"image": "https://cdn.kqed.org/wp-content/uploads/2020/02/KQED-OG-Image@1x.png"
}
},
"guestAuthors": [],
"slug": "what-the-different-stages-of-californias-high-speed-rail-project-will-look-like-interactive-map",
"status": "publish",
"path": "/lowdown/14507/what-the-different-stages-of-californias-high-speed-rail-project-will-look-like-interactive-map",
"audioTrackLength": null,
"parsedContent": [
{
"type": "contentString",
"content": "\u003cdiv class=\"post-body\">\u003cp>\u003cp>\u003cimg class=\"alignright wp-image-15509 size-medium\" src=\"http://ww2.kqed.org/lowdown/wp-content/uploads/sites/26/2015/01/screenshot-e1420744870746-300x202.png\" alt=\"\" width=\"300\" height=\"202\">Even the Golden Gate Bridge, that most hallowed of local landmarks, had its naysayers.\u003c/p>\n\u003cp>Photographer Ansel Adams worried the bridge would despoil the pristine view (he later made peace with it). Ferry companies lobbied hard to kill the project. And even the Commonwealth Club of California passed a resolution, stating the timing was “inopportune,” according to historian \u003ca href=\"https://books.google.com/books?id=ZzTfd8zY-B0C&dq=Commonwealth+Club+of+California+passed+a+resolution,+stating+the+timing+was+%E2%80%9Cinopportune.%E2%80%9D\" target=\"_blank\">Kevin Starr\u003c/a>.\u003c/p>\n\u003cp>\u003c!--more-->\u003c/p>\n\u003cp>Costly public infrastructure projects have always faced strong opposition. And that makes sense, given the leap of faith required: they're huge, long-term investments, often completed over budget and past schedule and with hard-to-imagine benefits. Take BART, for instance: love it or hate it, few today would challenge the indispensability of the regional transit system. But at the time of conception and construction, skeptics abounded; a 1962 funding measure was only narrowly approved by voters.\u003c/p>\n\u003cp>California's high-speed rail plan is no exception.\u003c/p>\n\u003cp>\u003c/p>\u003c/div>",
"attributes": {
"named": {},
"numeric": []
}
},
{
"type": "component",
"content": "",
"name": "ad",
"attributes": {
"named": {
"label": "fullwidth"
},
"numeric": [
"fullwidth"
]
}
},
{
"type": "contentString",
"content": "\u003cdiv class=\"post-body\">\u003cp>\u003c/p>\n\u003cp>The proposed system, slated for completion in 2028, would connect the Los Angeles and San Francisco metro areas via the Central Valley; total estimated commute time: under 3 hours. Following on the heels of Europe, China and Japan, it would be the first bona fide high-speed rail system in the United States.\u003c/p>\n\u003cp>But in the six years since voters passed a $10 billion bond measure to jump-start the project, not a single track has been laid, the effort stalled by a steady steam of political opposition, fierce litigation and funding uncertainty. Critics argue the project is a boondoggle that will exhaust precious state funds and be sorely mismanaged, underused and antiquated by the time it's done.\u003c/p>\n\u003cp>On Tuesday, though, the project got a much needed boost, as Governor Jerry Brown, a staunch proponent, declared tentative victory. Flanked by dignitaries and workers in decorative hardhats, and within earshot of protestors, Brown presided over a ceremonial groundbreaking on the site of a planned Fresno station (although there didn't actually seem to be any literal breaking of ground).\u003c/p>\n\u003cp>\"Everything big runs into opposition,\" \u003ca href=\"http://www.sacbee.com/news/politics-government/capitol-alert/article5519280.html\" target=\"_blank\">Brown intoned at the event\u003c/a>. \"People do get pusillanimous. I wanted to use that word because that's the adjective I'm going to affix to all the critics. You can go look it up right now on your cell phone. Means weak of spirit.\" (\u003ca href=\"//www.merriam-webster.com/dictionary/pusillanimous\" target=\"_blank\">Merriam-Webster\u003c/a> actually defines it as \"\u003cspan class=\"ssens\">lacking courage and resolution,\" but close enough.) \u003c/span>\u003c/p>\n\u003cp>He added: \"There's no anti-texting rule on the trains. So that's another reason [to ride]. If there's no other reason, it's you can use your iPhone. And enjoy it. And you can have a martini or whatever you people drink.\"\u003c/p>\n\u003cp>All of which begs the question: where exactly will the train take you while you're sipping that fancy cocktail? Plans have changed repeatedly since the original rail proposal was floated years ago. Fortunately, the folks at UC Davis' \u003ca href=\"http://ice.ucdavis.edu/\" target=\"_blank\">Information Center for the Environment\u003c/a> created this interesting interactive \"story map,\" in partnership with the \u003ca href=\"http://www.hsr.ca.gov/\" target=\"_blank\">California High Speed Rail Authority\u003c/a> and Esri. The map, which suggests the designers support for the project, illustrates the different proposed phases as they currently stand, detailing the stations, fares and local transit lines along the way. It can also be viewed layered with farmland conversion data, as well as unemployment and \u003ca href=\"http://oehha.ca.gov/ej/ces2.html\" target=\"_blank\">environmental health figures\u003c/a>, a nod to advocates who claim the project will be a major economic boon to some of California's poorest regions.\u003c/p>\n\u003cp>Map data is based on the High-Speed Rail Authority's 2014 \u003ca href=\"http://hsr.ca.gov/docs/about/business_plans/BPlan_2014_Business_Plan_Final.pdf\" target=\"_blank\">business plan\u003c/a> released in April. It includes the most recent plans for the controversial \"blended system,\" wherein operations of the HSR system are shared with portions of other rail systems (including Caltrain and the Southern California Regional Rail Authority).\u003c/p>\n\u003cp>\u003c/p>\n\u003cp>\u003c!-- iframe plugin v.4.3 wordpress.org/plugins/iframe/ -->\u003cbr>\n\u003ciframe src=\"//ice.ucdavis.edu/hsr/\" width=\"950\" height=\"750\" frameborder=\"0\" allowfullscreen=\"allowfullscreen\" scrolling=\"yes\" class=\"iframe-class\">\u003c/iframe>\u003c/p>\n\n\u003c/div>\u003c/p>",
"attributes": {
"named": {},
"numeric": []
}
}
],
"link": "/lowdown/14507/what-the-different-stages-of-californias-high-speed-rail-project-will-look-like-interactive-map",
"authors": [
"1263"
],
"categories": [
"lowdown_566",
"lowdown_242",
"lowdown_457"
],
"tags": [
"lowdown_567",
"lowdown_96"
],
"featImg": "lowdown_15509",
"label": "lowdown"
},
"lowdown_10976": {
"type": "posts",
"id": "lowdown_10976",
"meta": {
"index": "posts_1716263798",
"site": "lowdown",
"id": "10976",
"score": null,
"sort": [
1386783880000
]
},
"parent": 0,
"labelTerm": {
"site": "lowdown"
},
"blocks": [],
"publishDate": 1386783880,
"format": "standard",
"disqusTitle": "Forget Miles per Gallon! The Case for Switching to Gallons per Mile",
"title": "Forget Miles per Gallon! The Case for Switching to Gallons per Mile",
"headTitle": "The Lowdown | KQED News",
"content": "\u003cp>To begin, a quiz:\u003c/p>\n\u003cp>Bob and Jane Smith have two vehicles: One is a \u003cstrong>15 MPG \u003c/strong>(miles per gallon)\u003cstrong> \u003c/strong>pickup truck that Bob uses for his construction job. The other is a \u003cstrong>28 MPG\u003c/strong> sedan that his wife Jane uses for her work commute. The couple wants to upgrade to something more fuel efficient, but only has the cash to replace one of their vehicles. Assuming each drives \u003ca href=\"http://www.fhwa.dot.gov/ohim/onh00/bar8.htm\">the average American\u003c/a> distance of about 13,500 miles per year, which of the following options would save the most gas?\u003c/p>\n\u003cp> \u003c/p>\n\u003cp>\u003cstrong>a. Replacing the 28 MPG sedan with a 38 MPG \u003c/strong>\u003cstrong>compact\u003c/strong>\u003c/p>\n\u003cp>\u003cem>OR\u003c/em>\u003c/p>\n\u003cp>[ad fullwidth]\u003c/p>\n\u003cp>\u003cstrong>b. Replacing the 15 MPG truck with a 20 MPG truck\u003c!--more-->\u003c/strong>\u003c/p>\n\u003cp>The first option seems to make the most sense. But -- as you may have predicted -- it's not the right answer. In fact, choice b saves nearly twice as much gas (even though the new truck still requires way more gas than the old car). Here's the math to prove it:\u003c/p>\n\u003cp>\u003ca href=\"http://ww2.kqed.org/lowdown/wp-content/uploads/sites/26/2013/12/fornula1test.jpg\">\u003cimg class=\"alignnone wp-image-10981\" src=\"http://ww2.kqed.org/lowdown/wp-content/uploads/sites/26/2013/12/fornula1test-640x145.jpg\" alt=\"fornula1(test\" width=\"500\" height=\"100\">\u003c/a>\u003c/p>\n\u003cp>If you guessed wrong, you're not alone. In a 2008 \u003ca href=\"http://nsmn1.uh.edu/dgraur/niv/theMPGIllusion.pdf\" target=\"_blank\">study\u003c/a> published in Science Magazine, Richard P. Larrick and Jack B. Soll of Duke University suggest \"there is a systematic misconception in judging fuel efficiency when it is expressed as miles per gallon.\" Namely, most drivers think gas usage falls linearly (in a straight line) as MPG increases. But the actual relationship between the two is curved: one additional MPG has significantly greater impact in the gas consumption of an inefficient vehicle than it does in a more efficient one. Essentially, it's the law of diminishing returns. The authors call this the \"\u003ca href=\"http://www.mpgillusion.com/\">MPG Illusion\u003c/a>,\" and note that encouraging gas guzzlers to upgrade to slightly more efficient vehicles actually has a much more positive impact than is commonly perceived.\u003c/p>\n\u003cp>\"The environment would benefit most if all (car-driving) consumers chased highly efficient cars that get 40 MPG, not 14, and incentives should be tied to achieving such efficiency,\" the authors write. But, they argue, the impact of encouraging people who drive gas guzzling SUVs that get a measly 12 MPG to switch to ones that get a slightly less measly 14 MPG is certainly not negligible. \"The 2 MPG improvement is actually a significant one in terms of reduction in gas consumption.\"\u003c/p>\n\u003cp>That logic is illustrated here:\u003c/p>\n\u003cp>\u003c!-- iframe plugin v.4.3 wordpress.org/plugins/iframe/ -->\u003cbr>\n\u003ciframe src=\"https://lewis500.github.io/miles/linechart1.html\" frameborder=\"0\" scrolling=\"no\" width=\"800\" height=\"540\" class=\"iframe-class\">\u003c/iframe>\u003c/p>\n\u003cp>It's true that 15 to 20 MPG is a bigger \u003cem>percentage\u003c/em> jump than going from 28 to 38 MPG, But even when comparing proportions, the same logic holds true. The chart below shows the savings from a 50 percent boost in MPG. Note that the higher the MPG, the less gas a 50 percent boost saves.\u003c/p>\n\u003cp>\u003c!-- iframe plugin v.4.3 wordpress.org/plugins/iframe/ -->\u003cbr>\n\u003ciframe src=\"https://lewis500.github.io/miles/linechart2.html\" frameborder=\"0\" scrolling=\"no\" width=\"800\" height=\"540\" class=\"iframe-class\">\u003c/iframe>\u003c/p>\n\u003ch4>The case for switching to gallons per mile\u003c/h4>\n\u003cp>MPG, the study's authors argue, is a somewhat misleading measurement of fuel efficiency. Because it's a fraction with miles in the numerator and gallons in the denominator, it's a convenient measure for calculating answers in terms of miles. For example: \"If my car has 5 gallons left in the tank, and it gets 30 miles per gallon, how many miles can I go without stopping for gas?\"\u003c/p>\n\u003cp>\u003ca href=\"http://ww2.kqed.org/lowdown/wp-content/uploads/sites/26/2013/12/form2a2.jpg\">\u003cimg class=\"size-medium wp-image-11060 alignnone\" src=\"http://ww2.kqed.org/lowdown/wp-content/uploads/sites/26/2013/12/form2a2-300x82.jpg\" alt=\"form2a\" width=\"300\" height=\"82\">\u003c/a>\u003c/p>\n\u003cp>In most cases, however, it's more useful to express your calculations in terms of gallons, since it is gallons, after all -- not miles -- that matter to your budget and the environment (especially considering that burning 100 gallons \u003ca href=\"http://www.eia.gov/tools/faqs/faq.cfm?id=307&t=11\">emits one ton\u003c/a> of CO2). Therefore, it makes sense to flip the fraction, converting it to gallons per mile (GPM):\u003c/p>\n\u003cp>\u003ca href=\"http://ww2.kqed.org/lowdown/wp-content/uploads/sites/26/2013/12/form3a1.jpg\">\u003cimg class=\"alignnone wp-image-11041\" src=\"http://ww2.kqed.org/lowdown/wp-content/uploads/sites/26/2013/12/form3a1-300x71.jpg\" alt=\"form3a\" width=\"320\" height=\"87\">\u003c/a>\u003c/p>\n\u003cp>But because the small numbers can get confusing, it's easier to instead express this as gallons per hundred miles (GPHM):\u003c/p>\n\u003cp>\u003ca href=\"http://ww2.kqed.org/lowdown/wp-content/uploads/sites/26/2013/12/form4a.jpg\">\u003cimg class=\"alignnone size-full wp-image-11001\" title=\"\" src=\"http://ww2.kqed.org/lowdown/wp-content/uploads/sites/26/2013/12/form4a.jpg\" alt=\"form4a\" width=\"418\" height=\"85\" srcset=\"https://ww2.kqed.org/app/uploads/sites/26/2013/12/form4a.jpg 418w, https://ww2.kqed.org/app/uploads/sites/26/2013/12/form4a-400x81.jpg 400w, https://ww2.kqed.org/app/uploads/sites/26/2013/12/form4a-320x65.jpg 320w\" sizes=\"(max-width: 418px) 100vw, 418px\">\u003c/a>\u003c/p>\n\u003cp>When you put gallons in the numerator, comparing fuel usage is easy. The chart below shows how a 1 GPHM drop \u003cem>always\u003c/em> saves the same amount of gasoline regardless of the vehicle's fuel efficiency.\u003c/p>\n\u003cp>\u003c!-- iframe plugin v.4.3 wordpress.org/plugins/iframe/ -->\u003cbr>\n\u003ciframe src=\"https://lewis500.github.io/miles/linechart3.html\" frameborder=\"0\" scrolling=\"no\" width=\"800\" height=\"540\" class=\"iframe-class\">\u003c/iframe>\u003c/p>\n\u003ch4>Policy implications\u003c/h4>\n\u003cp>So does this mean it's fine to buy a new gas guzzler as long as it's just a teeny bit more efficient than your old one?\u003c/p>\n\u003cp>Just the opposite. The higher the fuel efficiency of your replacement vehicle, the more gas you save. That's why Larrick and Soll argue that \"removing the most inefficient vehicles is where policy and popular opinion should be focused.\" Ideally, all drivers of gas guzzlers would make a giant leap and swap their SUVs for very efficient small hybrids ... or bicycles. But that's a pretty unlikely possibility. So, given the restraints of reality, it's more important to encourage drivers of gas guzzlers to switch to normal cars, than it is to nudge drivers of normal cars to switch to hybrids.\u003c/p>\n\u003cp>The federal government has already taken steps in this direction: the Office of Information and Regulatory Affairs this year came out with \"gallons per 100 miles\" stickers, which they're are encouraging car dealerships to start using them in showrooms.\u003c/p>\n\u003cp>\u003ca href=\"http://www.fueleconomy.gov/feg/label/learn-more-gasoline-label.shtml\">\u003cimg src=\"http://lewis500.github.io/miles/styles/gaslabel.jpg\" alt=\"\" width=\"500px\">\u003c/a>\u003c/p>\n\u003chr>\n\u003cp>\u003c/p>\n\u003cp>\u003cem>Lewis Lehe is a PhD student in Civil Engineering at the UC Berkeley, where he researches electronic road tolling and runs the \u003ca href=\"http://vudlab.com\"> Visualizing Urban Data idealab\u003c/a>.\u003c/em>\u003c/p>\n\n",
"disqusIdentifier": "10976 http://blogs.kqed.org/lowdown/?p=10976",
"disqusUrl": "https://ww2.kqed.org/lowdown/2013/12/11/forget-miles-per-gallon-why-we-should-be-measuring-gallons-per-mile/",
"stats": {
"hasVideo": false,
"hasChartOrMap": true,
"hasAudio": false,
"hasPolis": false,
"wordCount": 860,
"hasGoogleForm": false,
"hasGallery": false,
"hasHearkenModule": false,
"iframeSrcs": [
"https://lewis500.github.io/miles/linechart1.html",
"https://lewis500.github.io/miles/linechart2.html",
"https://lewis500.github.io/miles/linechart3.html"
],
"paragraphCount": 28
},
"modified": 1524073033,
"excerpt": null,
"headData": {
"twImgId": "",
"twTitle": "",
"ogTitle": "",
"ogImgId": "",
"twDescription": "",
"description": "To begin, a quiz: Bob and Jane Smith have two vehicles: One is a 15 MPG (miles per gallon) pickup truck that Bob uses for his construction job. The other is a 28 MPG sedan that his wife Jane uses for her work commute. The couple wants to upgrade to something more fuel efficient, but only has the cash",
"title": "Forget Miles per Gallon! The Case for Switching to Gallons per Mile | KQED",
"ogDescription": "",
"schema": {
"@context": "https://schema.org",
"@type": "Article",
"headline": "Forget Miles per Gallon! The Case for Switching to Gallons per Mile",
"datePublished": "2013-12-11T09:44:40-08:00",
"dateModified": "2018-04-18T10:37:13-07:00",
"image": "https://cdn.kqed.org/wp-content/uploads/2020/02/KQED-OG-Image@1x.png"
}
},
"guestAuthors": [],
"slug": "forget-miles-per-gallon-why-we-should-be-measuring-gallons-per-mile",
"status": "publish",
"customPermalink": "2013/12/10/gas-mileage/",
"path": "/lowdown/10976/forget-miles-per-gallon-why-we-should-be-measuring-gallons-per-mile",
"audioTrackLength": null,
"parsedContent": [
{
"type": "contentString",
"content": "\u003cdiv class=\"post-body\">\u003cp>\u003cp>To begin, a quiz:\u003c/p>\n\u003cp>Bob and Jane Smith have two vehicles: One is a \u003cstrong>15 MPG \u003c/strong>(miles per gallon)\u003cstrong> \u003c/strong>pickup truck that Bob uses for his construction job. The other is a \u003cstrong>28 MPG\u003c/strong> sedan that his wife Jane uses for her work commute. The couple wants to upgrade to something more fuel efficient, but only has the cash to replace one of their vehicles. Assuming each drives \u003ca href=\"http://www.fhwa.dot.gov/ohim/onh00/bar8.htm\">the average American\u003c/a> distance of about 13,500 miles per year, which of the following options would save the most gas?\u003c/p>\n\u003cp> \u003c/p>\n\u003cp>\u003cstrong>a. Replacing the 28 MPG sedan with a 38 MPG \u003c/strong>\u003cstrong>compact\u003c/strong>\u003c/p>\n\u003cp>\u003cem>OR\u003c/em>\u003c/p>\n\u003cp>\u003c/p>\u003c/div>",
"attributes": {
"named": {},
"numeric": []
}
},
{
"type": "component",
"content": "",
"name": "ad",
"attributes": {
"named": {
"label": "fullwidth"
},
"numeric": [
"fullwidth"
]
}
},
{
"type": "contentString",
"content": "\u003cdiv class=\"post-body\">\u003cp>\u003c/p>\n\u003cp>\u003cstrong>b. Replacing the 15 MPG truck with a 20 MPG truck\u003c!--more-->\u003c/strong>\u003c/p>\n\u003cp>The first option seems to make the most sense. But -- as you may have predicted -- it's not the right answer. In fact, choice b saves nearly twice as much gas (even though the new truck still requires way more gas than the old car). Here's the math to prove it:\u003c/p>\n\u003cp>\u003ca href=\"http://ww2.kqed.org/lowdown/wp-content/uploads/sites/26/2013/12/fornula1test.jpg\">\u003cimg class=\"alignnone wp-image-10981\" src=\"http://ww2.kqed.org/lowdown/wp-content/uploads/sites/26/2013/12/fornula1test-640x145.jpg\" alt=\"fornula1(test\" width=\"500\" height=\"100\">\u003c/a>\u003c/p>\n\u003cp>If you guessed wrong, you're not alone. In a 2008 \u003ca href=\"http://nsmn1.uh.edu/dgraur/niv/theMPGIllusion.pdf\" target=\"_blank\">study\u003c/a> published in Science Magazine, Richard P. Larrick and Jack B. Soll of Duke University suggest \"there is a systematic misconception in judging fuel efficiency when it is expressed as miles per gallon.\" Namely, most drivers think gas usage falls linearly (in a straight line) as MPG increases. But the actual relationship between the two is curved: one additional MPG has significantly greater impact in the gas consumption of an inefficient vehicle than it does in a more efficient one. Essentially, it's the law of diminishing returns. The authors call this the \"\u003ca href=\"http://www.mpgillusion.com/\">MPG Illusion\u003c/a>,\" and note that encouraging gas guzzlers to upgrade to slightly more efficient vehicles actually has a much more positive impact than is commonly perceived.\u003c/p>\n\u003cp>\"The environment would benefit most if all (car-driving) consumers chased highly efficient cars that get 40 MPG, not 14, and incentives should be tied to achieving such efficiency,\" the authors write. But, they argue, the impact of encouraging people who drive gas guzzling SUVs that get a measly 12 MPG to switch to ones that get a slightly less measly 14 MPG is certainly not negligible. \"The 2 MPG improvement is actually a significant one in terms of reduction in gas consumption.\"\u003c/p>\n\u003cp>That logic is illustrated here:\u003c/p>\n\u003cp>\u003c!-- iframe plugin v.4.3 wordpress.org/plugins/iframe/ -->\u003cbr>\n\u003ciframe src=\"https://lewis500.github.io/miles/linechart1.html\" frameborder=\"0\" scrolling=\"no\" width=\"800\" height=\"540\" class=\"iframe-class\">\u003c/iframe>\u003c/p>\n\u003cp>It's true that 15 to 20 MPG is a bigger \u003cem>percentage\u003c/em> jump than going from 28 to 38 MPG, But even when comparing proportions, the same logic holds true. The chart below shows the savings from a 50 percent boost in MPG. Note that the higher the MPG, the less gas a 50 percent boost saves.\u003c/p>\n\u003cp>\u003c!-- iframe plugin v.4.3 wordpress.org/plugins/iframe/ -->\u003cbr>\n\u003ciframe src=\"https://lewis500.github.io/miles/linechart2.html\" frameborder=\"0\" scrolling=\"no\" width=\"800\" height=\"540\" class=\"iframe-class\">\u003c/iframe>\u003c/p>\n\u003ch4>The case for switching to gallons per mile\u003c/h4>\n\u003cp>MPG, the study's authors argue, is a somewhat misleading measurement of fuel efficiency. Because it's a fraction with miles in the numerator and gallons in the denominator, it's a convenient measure for calculating answers in terms of miles. For example: \"If my car has 5 gallons left in the tank, and it gets 30 miles per gallon, how many miles can I go without stopping for gas?\"\u003c/p>\n\u003cp>\u003ca href=\"http://ww2.kqed.org/lowdown/wp-content/uploads/sites/26/2013/12/form2a2.jpg\">\u003cimg class=\"size-medium wp-image-11060 alignnone\" src=\"http://ww2.kqed.org/lowdown/wp-content/uploads/sites/26/2013/12/form2a2-300x82.jpg\" alt=\"form2a\" width=\"300\" height=\"82\">\u003c/a>\u003c/p>\n\u003cp>In most cases, however, it's more useful to express your calculations in terms of gallons, since it is gallons, after all -- not miles -- that matter to your budget and the environment (especially considering that burning 100 gallons \u003ca href=\"http://www.eia.gov/tools/faqs/faq.cfm?id=307&t=11\">emits one ton\u003c/a> of CO2). Therefore, it makes sense to flip the fraction, converting it to gallons per mile (GPM):\u003c/p>\n\u003cp>\u003ca href=\"http://ww2.kqed.org/lowdown/wp-content/uploads/sites/26/2013/12/form3a1.jpg\">\u003cimg class=\"alignnone wp-image-11041\" src=\"http://ww2.kqed.org/lowdown/wp-content/uploads/sites/26/2013/12/form3a1-300x71.jpg\" alt=\"form3a\" width=\"320\" height=\"87\">\u003c/a>\u003c/p>\n\u003cp>But because the small numbers can get confusing, it's easier to instead express this as gallons per hundred miles (GPHM):\u003c/p>\n\u003cp>\u003ca href=\"http://ww2.kqed.org/lowdown/wp-content/uploads/sites/26/2013/12/form4a.jpg\">\u003cimg class=\"alignnone size-full wp-image-11001\" title=\"\" src=\"http://ww2.kqed.org/lowdown/wp-content/uploads/sites/26/2013/12/form4a.jpg\" alt=\"form4a\" width=\"418\" height=\"85\" srcset=\"https://ww2.kqed.org/app/uploads/sites/26/2013/12/form4a.jpg 418w, https://ww2.kqed.org/app/uploads/sites/26/2013/12/form4a-400x81.jpg 400w, https://ww2.kqed.org/app/uploads/sites/26/2013/12/form4a-320x65.jpg 320w\" sizes=\"(max-width: 418px) 100vw, 418px\">\u003c/a>\u003c/p>\n\u003cp>When you put gallons in the numerator, comparing fuel usage is easy. The chart below shows how a 1 GPHM drop \u003cem>always\u003c/em> saves the same amount of gasoline regardless of the vehicle's fuel efficiency.\u003c/p>\n\u003cp>\u003c!-- iframe plugin v.4.3 wordpress.org/plugins/iframe/ -->\u003cbr>\n\u003ciframe src=\"https://lewis500.github.io/miles/linechart3.html\" frameborder=\"0\" scrolling=\"no\" width=\"800\" height=\"540\" class=\"iframe-class\">\u003c/iframe>\u003c/p>\n\u003ch4>Policy implications\u003c/h4>\n\u003cp>So does this mean it's fine to buy a new gas guzzler as long as it's just a teeny bit more efficient than your old one?\u003c/p>\n\u003cp>Just the opposite. The higher the fuel efficiency of your replacement vehicle, the more gas you save. That's why Larrick and Soll argue that \"removing the most inefficient vehicles is where policy and popular opinion should be focused.\" Ideally, all drivers of gas guzzlers would make a giant leap and swap their SUVs for very efficient small hybrids ... or bicycles. But that's a pretty unlikely possibility. So, given the restraints of reality, it's more important to encourage drivers of gas guzzlers to switch to normal cars, than it is to nudge drivers of normal cars to switch to hybrids.\u003c/p>\n\u003cp>The federal government has already taken steps in this direction: the Office of Information and Regulatory Affairs this year came out with \"gallons per 100 miles\" stickers, which they're are encouraging car dealerships to start using them in showrooms.\u003c/p>\n\u003cp>\u003ca href=\"http://www.fueleconomy.gov/feg/label/learn-more-gasoline-label.shtml\">\u003cimg src=\"http://lewis500.github.io/miles/styles/gaslabel.jpg\" alt=\"\" width=\"500px\">\u003c/a>\u003c/p>\n\u003chr>\n\u003cp>\u003c/p>\n\u003cp>\u003cem>Lewis Lehe is a PhD student in Civil Engineering at the UC Berkeley, where he researches electronic road tolling and runs the \u003ca href=\"http://vudlab.com\"> Visualizing Urban Data idealab\u003c/a>.\u003c/em>\u003c/p>\n\n\u003c/div>\u003c/p>",
"attributes": {
"named": {},
"numeric": []
}
}
],
"link": "/lowdown/10976/forget-miles-per-gallon-why-we-should-be-measuring-gallons-per-mile",
"authors": [
"7527"
],
"categories": [
"lowdown_391",
"lowdown_566",
"lowdown_243",
"lowdown_2408"
],
"tags": [
"lowdown_440",
"lowdown_442",
"lowdown_441"
],
"featImg": "lowdown_11046",
"label": "lowdown"
},
"lowdown_10104": {
"type": "posts",
"id": "lowdown_10104",
"meta": {
"index": "posts_1716263798",
"site": "lowdown",
"id": "10104",
"score": null,
"sort": [
1382094039000
]
},
"parent": 0,
"labelTerm": {
"site": "lowdown"
},
"blocks": [],
"publishDate": 1382094039,
"format": "aside",
"disqusTitle": "Chart: How BART Pay Compares to Pay at Other Big Transit Agencies in California",
"title": "Chart: How BART Pay Compares to Pay at Other Big Transit Agencies in California",
"headTitle": "The Lowdown | KQED News",
"content": "\u003cfigure id=\"attachment_10121\" class=\"wp-caption alignleft\" style=\"max-width: 275px\">\u003ca href=\"http://ww2.kqed.org/lowdown/wp-content/uploads/sites/26/2013/10/bart.jpg\">\u003cimg class=\"size-full wp-image-10121\" title=\"\" src=\"http://ww2.kqed.org/lowdown/wp-content/uploads/sites/26/2013/10/bart.jpg\" alt=\"Wikipedia\" width=\"275\" height=\"183\">\u003c/a>\u003cfigcaption class=\"wp-caption-text\">Wikipedia\u003c/figcaption>\u003c/figure>\n\u003cp>Ah, BART. Never a dull moment.\u003c/p>\n\u003cp>If only its unions and management could learn the virtues of unity and cooperation that our elected officials in Washington have so magnanimously exhibited (hmmm ...).\u003c/p>\n\u003cp>Well, it's happened again. At the stroke of midnight, following a breakdown in negotiations, unionized BART workers went on strike, grinding the entire rail network to a disgruntled halt just in time for the Friday morning commute.\u003c!--more-->\u003c/p>\n\u003cp>Deja vu? If only.\u003c/p>\n\u003cp>This marks the second walk-out in less than four months, the latest chapter in a long-running battle over a fiercely contested labor contract.\u003c/p>\n\u003cp>[ad fullwidth]\u003c/p>\n\u003cp>Unions representing BART workers are lobbying for their first pay raise since the last contract four years ago. BART management, meanwhile, wants workers to contribute to their pensions (currently they don't contribute anything) and to pay more for health care coverage (workers now pay a flat-rate of $92, regardless of how many dependents). Negotiators claimed to have reached consensus on pay and benefits by Thursday night, but talks broke down over last-minute workplace rules proposed by management, according to a spokesperson for the Service Employees International Union.\u003c/p>\n\u003cp>The five-day strike in July, which hobbled transportation throughout the Bay Area, came about after negotiators failed to reach an agreement before the expiration of the old contract. Trains started running again only after Governor Jerry Brown ordered a 60-day cooling off period.\u003c/p>\n\u003cp>How long this strike might last? It's anyone's guess.\u003c/p>\n\u003cp>According to recent polls, residents in the generally labor-friendly Bay Area have shown an overall lack of public support for the demands of BART employees. The dearth in sympathy stems, in part, from the fact that average annual gross pay among BART union workers is -- at $76,551 -- is not only higher than that of any other major transportation agency in the state, but also tops the average salaries of any other public agency in the Bay Area (transportation or otherwise), according to the San Jose Mercury News' \u003ca href=\"http://www.mercurynews.com/salaries/bay-area\" target=\"_blank\">public employee salaries database\u003c/a>.\u003c/p>\n\u003cp>The charts below use the Merc's data to compare average gross pay across agencies. The figures include the salaries of both management and union workers, which, as some readers have insightfully noted, are somewhat deceiving in that they don't give an accurate representation of what unionized workers (isolated from management) actually make. This data are available in the Merc's database, but would need to be parsed per individual agency, which I have not done in these charts except for BART.\u003c/p>\n\u003cp>The charts are intended to place the salary data in a context. Take a look -- hopefully it'll help pass the time if you happen to find yourself sitting in some nasty traffic.\u003c/p>\n\u003cp>\u003c!-- iframe plugin v.4.3 wordpress.org/plugins/iframe/ -->\u003cbr>\n\u003ciframe style=\"border: none\" src=\"//e.infogr.am/-matthewgreen111_1382059714\" frameborder=\"0\" scrolling=\"no\" width=\"620\" height=\"920\" class=\"iframe-class\">\u003c/iframe>\u003c/p>\n\u003cp>\u003c/p>\n\u003cp>\u003c!-- iframe plugin v.4.3 wordpress.org/plugins/iframe/ -->\u003cbr>\n\u003ciframe style=\"border: none\" src=\"//e.infogr.am/-matthewgreen111_1382114673\" frameborder=\"0\" scrolling=\"no\" width=\"620\" height=\"900\" class=\"iframe-class\">\u003c/iframe>\u003c/p>\n\n",
"disqusIdentifier": "10104 http://blogs.kqed.org/lowdown/?p=10104",
"disqusUrl": "https://ww2.kqed.org/lowdown/2013/10/18/chart-bart-pay-as-compared-to-other-major-state-transportation-agencies/",
"stats": {
"hasVideo": false,
"hasChartOrMap": true,
"hasAudio": false,
"hasPolis": false,
"wordCount": 458,
"hasGoogleForm": false,
"hasGallery": false,
"hasHearkenModule": false,
"iframeSrcs": [
"//e.infogr.am/-matthewgreen111_1382059714",
"//e.infogr.am/-matthewgreen111_1382114673"
],
"paragraphCount": 15
},
"modified": 1431564017,
"excerpt": null,
"headData": {
"twImgId": "",
"twTitle": "",
"ogTitle": "",
"ogImgId": "",
"twDescription": "",
"description": "Ah, BART. Never a dull moment. If only its unions and management could learn the virtues of unity and cooperation that our elected officials in Washington have so magnanimously exhibited (hmmm ...). Well, it's happened again. At the stroke of midnight, following a breakdown in negotiations, unionized BART workers went on strike, grinding the entire rail",
"title": "Chart: How BART Pay Compares to Pay at Other Big Transit Agencies in California | KQED",
"ogDescription": "",
"schema": {
"@context": "https://schema.org",
"@type": "Article",
"headline": "Chart: How BART Pay Compares to Pay at Other Big Transit Agencies in California",
"datePublished": "2013-10-18T04:00:39-07:00",
"dateModified": "2015-05-13T17:40:17-07:00",
"image": "https://cdn.kqed.org/wp-content/uploads/2020/02/KQED-OG-Image@1x.png"
}
},
"guestAuthors": [],
"slug": "chart-bart-pay-as-compared-to-other-major-state-transportation-agencies",
"status": "publish",
"customPermalink": "bart-pay/",
"path": "/lowdown/10104/chart-bart-pay-as-compared-to-other-major-state-transportation-agencies",
"audioTrackLength": null,
"parsedContent": [
{
"type": "contentString",
"content": "\u003cdiv class=\"post-body\">\u003cp>\u003cfigure id=\"attachment_10121\" class=\"wp-caption alignleft\" style=\"max-width: 275px\">\u003ca href=\"http://ww2.kqed.org/lowdown/wp-content/uploads/sites/26/2013/10/bart.jpg\">\u003cimg class=\"size-full wp-image-10121\" title=\"\" src=\"http://ww2.kqed.org/lowdown/wp-content/uploads/sites/26/2013/10/bart.jpg\" alt=\"Wikipedia\" width=\"275\" height=\"183\">\u003c/a>\u003cfigcaption class=\"wp-caption-text\">Wikipedia\u003c/figcaption>\u003c/figure>\n\u003cp>Ah, BART. Never a dull moment.\u003c/p>\n\u003cp>If only its unions and management could learn the virtues of unity and cooperation that our elected officials in Washington have so magnanimously exhibited (hmmm ...).\u003c/p>\n\u003cp>Well, it's happened again. At the stroke of midnight, following a breakdown in negotiations, unionized BART workers went on strike, grinding the entire rail network to a disgruntled halt just in time for the Friday morning commute.\u003c!--more-->\u003c/p>\n\u003cp>Deja vu? If only.\u003c/p>\n\u003cp>This marks the second walk-out in less than four months, the latest chapter in a long-running battle over a fiercely contested labor contract.\u003c/p>\n\u003cp>\u003c/p>\u003c/div>",
"attributes": {
"named": {},
"numeric": []
}
},
{
"type": "component",
"content": "",
"name": "ad",
"attributes": {
"named": {
"label": "fullwidth"
},
"numeric": [
"fullwidth"
]
}
},
{
"type": "contentString",
"content": "\u003cdiv class=\"post-body\">\u003cp>\u003c/p>\n\u003cp>Unions representing BART workers are lobbying for their first pay raise since the last contract four years ago. BART management, meanwhile, wants workers to contribute to their pensions (currently they don't contribute anything) and to pay more for health care coverage (workers now pay a flat-rate of $92, regardless of how many dependents). Negotiators claimed to have reached consensus on pay and benefits by Thursday night, but talks broke down over last-minute workplace rules proposed by management, according to a spokesperson for the Service Employees International Union.\u003c/p>\n\u003cp>The five-day strike in July, which hobbled transportation throughout the Bay Area, came about after negotiators failed to reach an agreement before the expiration of the old contract. Trains started running again only after Governor Jerry Brown ordered a 60-day cooling off period.\u003c/p>\n\u003cp>How long this strike might last? It's anyone's guess.\u003c/p>\n\u003cp>According to recent polls, residents in the generally labor-friendly Bay Area have shown an overall lack of public support for the demands of BART employees. The dearth in sympathy stems, in part, from the fact that average annual gross pay among BART union workers is -- at $76,551 -- is not only higher than that of any other major transportation agency in the state, but also tops the average salaries of any other public agency in the Bay Area (transportation or otherwise), according to the San Jose Mercury News' \u003ca href=\"http://www.mercurynews.com/salaries/bay-area\" target=\"_blank\">public employee salaries database\u003c/a>.\u003c/p>\n\u003cp>The charts below use the Merc's data to compare average gross pay across agencies. The figures include the salaries of both management and union workers, which, as some readers have insightfully noted, are somewhat deceiving in that they don't give an accurate representation of what unionized workers (isolated from management) actually make. This data are available in the Merc's database, but would need to be parsed per individual agency, which I have not done in these charts except for BART.\u003c/p>\n\u003cp>The charts are intended to place the salary data in a context. Take a look -- hopefully it'll help pass the time if you happen to find yourself sitting in some nasty traffic.\u003c/p>\n\u003cp>\u003c!-- iframe plugin v.4.3 wordpress.org/plugins/iframe/ -->\u003cbr>\n\u003ciframe style=\"border: none\" src=\"//e.infogr.am/-matthewgreen111_1382059714\" frameborder=\"0\" scrolling=\"no\" width=\"620\" height=\"920\" class=\"iframe-class\">\u003c/iframe>\u003c/p>\n\u003cp>\u003c/p>\n\u003cp>\u003c!-- iframe plugin v.4.3 wordpress.org/plugins/iframe/ -->\u003cbr>\n\u003ciframe style=\"border: none\" src=\"//e.infogr.am/-matthewgreen111_1382114673\" frameborder=\"0\" scrolling=\"no\" width=\"620\" height=\"900\" class=\"iframe-class\">\u003c/iframe>\u003c/p>\n\n\u003c/div>\u003c/p>",
"attributes": {
"named": {},
"numeric": []
}
}
],
"link": "/lowdown/10104/chart-bart-pay-as-compared-to-other-major-state-transportation-agencies",
"authors": [
"1263"
],
"categories": [
"lowdown_566",
"lowdown_1",
"lowdown_243"
],
"tags": [
"lowdown_416",
"lowdown_376"
],
"featImg": "lowdown_10121",
"label": "lowdown"
},
"lowdown_9833": {
"type": "posts",
"id": "lowdown_9833",
"meta": {
"index": "posts_1716263798",
"site": "lowdown",
"id": "9833",
"score": null,
"sort": [
1381492835000
]
},
"parent": 0,
"labelTerm": {
"site": "lowdown"
},
"blocks": [],
"publishDate": 1381492835,
"format": "aside",
"disqusTitle": "A Public Transit Guide to Income Inequality in the Bay Area",
"title": "A Public Transit Guide to Income Inequality in the Bay Area",
"headTitle": "The Lowdown | KQED News",
"content": "\u003cp>As Bay Area commuters once again brace for the possibility of a prolonged BART strike and look to alternative transportation means, it seems apropos to feature this innovative multimedia piece: a collection of some of the region's major public transit lines and the dramatic income disparities that exist among the communities living along those routes.\u003c/p>\n\u003cdiv>\n\u003c!-- iframe plugin v.4.3 wordpress.org/plugins/iframe/ -->\u003cbr>\n\u003ciframe style=\"width: 1000px;height: 500px\" src=\"https://dangrover.github.io/sf-transit-inequality/embeddable.html#\" scrolling=\"no\" width=\"1000\" height=\"500\" class=\"iframe-class\" frameborder=\"0\">\u003c/iframe>\n\u003c/div>\n\u003cp>Created by designers \u003ca href=\"https://twitter.com/dangrover\" target=\"_blank\" rel=\"noopener noreferrer\">Dan Grover\u003c/a> and \u003ca href=\"https://twitter.com/mikez\" target=\"_blank\" rel=\"noopener noreferrer\">Michael Belfrage\u003c/a>, the interactive project presents a striking landscape of wealth and poverty in the Bay Area, the two extremes often co-existing within a stone's throw of one another. To show this, they gathered 2010 U.S. Census data on median household incomes and used the value from the specific census tract that each transit stop is located within. One important thing to note when looking at the graphic is that population density is not taken into account, although \u003ca href=\"http://libguides.lib.msu.edu/tracts\" target=\"_blank\" rel=\"noopener noreferrer\">census tracts\u003c/a> typically encompass a population between 2,500 to 8,000 people. Also, because the income data is only for the specific census tract that the stop is located in, it does not represent the median income of an entire city. For instance, the median household income for the Union City BART station is close to $140,00, almost double the median income of that city as a whole. That figure, though, only reflects the small census tract where the station is located (you can see that census tract on \u003ca href=\"http://ww2.kqed.org/lowdown/wp-content/uploads/sites/26/2013/10/Union-City.jpg\" target=\"_blank\" rel=\"noopener noreferrer\">this map\u003c/a>).\u003c/p>\n\u003cp>The endeavor was inspired by a similar project published recently on the \u003ca href=\"http://www.newyorker.com/sandbox/business/subway.html\" target=\"_blank\" rel=\"noopener noreferrer\">The New Yorker's\u003c/a> website that juxtaposes New York subway stops with corresponding household income data, showing similarly wide wealth gaps in geographically concentrated areas.\u003c/p>\n\u003cp>Some interesting takeaways the Bay Area graphic:\u003c/p>\n\u003cul>\n\u003cli>Of BART's five lines, the Pittsburgh/Bay Point route runs through the widest income gap: in Lafayette, median household income is $153,488, while five stops and 14 miles west, at Oakland's 12th Street station, it's a mere $17,349, a disparity of roughly $136,000.\u003c/li>\n\u003cli>Of the 19 Muni lines surveyed, the biggest gap in median household income lies along the 1-California bus route, where the difference between highest (California and 30th Ave.) and lowest (Sacramento and Battery) median income stops is nearly $140,000.\u003c/li>\n\u003cli>The lowest median income tracts in the Bay Area are generally located near the civic centers of San Francisco and Oakland, in addition to some downtown locales, where the residential population is significantly smaller, homelessness is prevalent and the concentration of single room occupancy housing is often higher.\u003c/li>\n\u003cli>On CalTrain, the biggest income gap falls between two neighboring stations less than three miles apart: Redwood City, where median income is just above $30,000, and Atherton, where it's more than $193,000.\u003c/li>\n\u003c/ul>\n\u003cp>Choose a transit line and then mouse over the different stops on the chart for income data.\u003c/p>\n\u003cp>[ad fullwidth]\u003c/p>\n\u003cp>\u003c/p>\n\u003cp>(To view the interactive in its native habitat, \u003ca href=\"http://dangrover.github.io/sf-transit-inequality/\" target=\"_blank\" rel=\"noopener noreferrer\">click here\u003c/a>)\u003c/p>\n\n",
"disqusIdentifier": "9833 http://blogs.kqed.org/lowdown/?p=9833",
"disqusUrl": "https://ww2.kqed.org/lowdown/2013/10/11/a-commuters-guide-to-income-inequality-in-the-bay-area-as-shown-through-public-transit-lines/",
"stats": {
"hasVideo": false,
"hasChartOrMap": true,
"hasAudio": false,
"hasPolis": false,
"wordCount": 487,
"hasGoogleForm": false,
"hasGallery": false,
"hasHearkenModule": false,
"iframeSrcs": [
"https://dangrover.github.io/sf-transit-inequality/embeddable.html#"
],
"paragraphCount": 8
},
"modified": 1618861700,
"excerpt": null,
"headData": {
"twImgId": "",
"twTitle": "",
"ogTitle": "",
"ogImgId": "",
"twDescription": "",
"description": "As Bay Area commuters once again brace for the possibility of a prolonged BART strike and look to alternative transportation means, it seems apropos to feature this innovative multimedia piece: a collection of some of the region’s major public transit lines and the dramatic income disparities that exist among the communities living along those routes.",
"title": "A Public Transit Guide to Income Inequality in the Bay Area - The Lowdown",
"ogDescription": "",
"schema": {
"@context": "https://schema.org",
"@type": "Article",
"headline": "A Public Transit Guide to Income Inequality in the Bay Area",
"datePublished": "2013-10-11T05:00:35-07:00",
"dateModified": "2021-04-19T12:48:20-07:00",
"image": "https://cdn.kqed.org/wp-content/uploads/2020/02/KQED-OG-Image@1x.png"
}
},
"guestAuthors": [],
"slug": "a-commuters-guide-to-income-inequality-in-the-bay-area-as-shown-through-public-transit-lines",
"status": "publish",
"customPermalink": "public-transit-wealth-inequality/",
"templateType": "standard",
"featuredImageType": "standard",
"path": "/lowdown/9833/a-commuters-guide-to-income-inequality-in-the-bay-area-as-shown-through-public-transit-lines",
"audioTrackLength": null,
"parsedContent": [
{
"type": "contentString",
"content": "\u003cdiv class=\"post-body\">\u003cp>\u003cp>As Bay Area commuters once again brace for the possibility of a prolonged BART strike and look to alternative transportation means, it seems apropos to feature this innovative multimedia piece: a collection of some of the region's major public transit lines and the dramatic income disparities that exist among the communities living along those routes.\u003c/p>\n\u003cdiv>\n\u003c!-- iframe plugin v.4.3 wordpress.org/plugins/iframe/ -->\u003cbr>\n\u003ciframe style=\"width: 1000px;height: 500px\" src=\"https://dangrover.github.io/sf-transit-inequality/embeddable.html#\" scrolling=\"no\" width=\"1000\" height=\"500\" class=\"iframe-class\" frameborder=\"0\">\u003c/iframe>\n\u003c/div>\n\u003cp>Created by designers \u003ca href=\"https://twitter.com/dangrover\" target=\"_blank\" rel=\"noopener noreferrer\">Dan Grover\u003c/a> and \u003ca href=\"https://twitter.com/mikez\" target=\"_blank\" rel=\"noopener noreferrer\">Michael Belfrage\u003c/a>, the interactive project presents a striking landscape of wealth and poverty in the Bay Area, the two extremes often co-existing within a stone's throw of one another. To show this, they gathered 2010 U.S. Census data on median household incomes and used the value from the specific census tract that each transit stop is located within. One important thing to note when looking at the graphic is that population density is not taken into account, although \u003ca href=\"http://libguides.lib.msu.edu/tracts\" target=\"_blank\" rel=\"noopener noreferrer\">census tracts\u003c/a> typically encompass a population between 2,500 to 8,000 people. Also, because the income data is only for the specific census tract that the stop is located in, it does not represent the median income of an entire city. For instance, the median household income for the Union City BART station is close to $140,00, almost double the median income of that city as a whole. That figure, though, only reflects the small census tract where the station is located (you can see that census tract on \u003ca href=\"http://ww2.kqed.org/lowdown/wp-content/uploads/sites/26/2013/10/Union-City.jpg\" target=\"_blank\" rel=\"noopener noreferrer\">this map\u003c/a>).\u003c/p>\n\u003cp>The endeavor was inspired by a similar project published recently on the \u003ca href=\"http://www.newyorker.com/sandbox/business/subway.html\" target=\"_blank\" rel=\"noopener noreferrer\">The New Yorker's\u003c/a> website that juxtaposes New York subway stops with corresponding household income data, showing similarly wide wealth gaps in geographically concentrated areas.\u003c/p>\n\u003cp>Some interesting takeaways the Bay Area graphic:\u003c/p>\n\u003cul>\n\u003cli>Of BART's five lines, the Pittsburgh/Bay Point route runs through the widest income gap: in Lafayette, median household income is $153,488, while five stops and 14 miles west, at Oakland's 12th Street station, it's a mere $17,349, a disparity of roughly $136,000.\u003c/li>\n\u003cli>Of the 19 Muni lines surveyed, the biggest gap in median household income lies along the 1-California bus route, where the difference between highest (California and 30th Ave.) and lowest (Sacramento and Battery) median income stops is nearly $140,000.\u003c/li>\n\u003cli>The lowest median income tracts in the Bay Area are generally located near the civic centers of San Francisco and Oakland, in addition to some downtown locales, where the residential population is significantly smaller, homelessness is prevalent and the concentration of single room occupancy housing is often higher.\u003c/li>\n\u003cli>On CalTrain, the biggest income gap falls between two neighboring stations less than three miles apart: Redwood City, where median income is just above $30,000, and Atherton, where it's more than $193,000.\u003c/li>\n\u003c/ul>\n\u003cp>Choose a transit line and then mouse over the different stops on the chart for income data.\u003c/p>\n\u003cp>\u003c/p>\u003c/div>",
"attributes": {
"named": {},
"numeric": []
}
},
{
"type": "component",
"content": "",
"name": "ad",
"attributes": {
"named": {
"label": "fullwidth"
},
"numeric": [
"fullwidth"
]
}
},
{
"type": "contentString",
"content": "\u003cdiv class=\"post-body\">\u003cp>\u003c/p>\n\u003cp>\u003c/p>\n\u003cp>(To view the interactive in its native habitat, \u003ca href=\"http://dangrover.github.io/sf-transit-inequality/\" target=\"_blank\" rel=\"noopener noreferrer\">click here\u003c/a>)\u003c/p>\n\n\u003c/div>\u003c/p>",
"attributes": {
"named": {},
"numeric": []
}
}
],
"link": "/lowdown/9833/a-commuters-guide-to-income-inequality-in-the-bay-area-as-shown-through-public-transit-lines",
"authors": [
"1263"
],
"categories": [
"lowdown_391",
"lowdown_566",
"lowdown_451",
"lowdown_242"
],
"tags": [
"lowdown_308",
"lowdown_276",
"lowdown_415"
],
"featImg": "lowdown_9863",
"label": "lowdown"
}
},
"programsReducer": {
"all-things-considered": {
"id": "all-things-considered",
"title": "All Things Considered",
"info": "Every weekday, \u003cem>All Things Considered\u003c/em> hosts Robert Siegel, Audie Cornish, Ari Shapiro, and Kelly McEvers present the program's trademark mix of news, interviews, commentaries, reviews, and offbeat features. Michel Martin hosts on the weekends.",
"airtime": "MON-FRI 1pm-2pm, 4:30pm-6:30pm\u003cbr />SAT-SUN 5pm-6pm",
"imageSrc": "https://cdn.kqed.org/wp-content/uploads/2024/04/All-Things-Considered-Podcast-Tile-360x360-1.jpg",
"officialWebsiteLink": "https://www.npr.org/programs/all-things-considered/",
"meta": {
"site": "news",
"source": "npr"
},
"link": "/radio/program/all-things-considered"
},
"american-suburb-podcast": {
"id": "american-suburb-podcast",
"title": "American Suburb: The Podcast",
"tagline": "The flip side of gentrification, told through one town",
"info": "Gentrification is changing cities across America, forcing people from neighborhoods they have long called home. Call them the displaced. Now those priced out of the Bay Area are looking for a better life in an unlikely place. American Suburb follows this migration to one California town along the Delta, 45 miles from San Francisco. But is this once sleepy suburb ready for them?",
"imageSrc": "https://cdn.kqed.org/wp-content/uploads/2024/04/American-Suburb-Podcast-Tile-703x703-1.jpg",
"officialWebsiteLink": "/news/series/american-suburb-podcast",
"meta": {
"site": "news",
"source": "kqed",
"order": 19
},
"link": "/news/series/american-suburb-podcast/",
"subscribe": {
"npr": "https://rpb3r.app.goo.gl/RBrW",
"apple": "https://itunes.apple.com/WebObjects/MZStore.woa/wa/viewPodcast?mt=2&id=1287748328",
"tuneIn": "https://tunein.com/radio/American-Suburb-p1086805/",
"rss": "https://ww2.kqed.org/news/series/american-suburb-podcast/feed/podcast",
"google": "https://podcasts.google.com/feed/aHR0cHM6Ly9mZWVkcy5tZWdhcGhvbmUuZm0vS1FJTkMzMDExODgxNjA5"
}
},
"baycurious": {
"id": "baycurious",
"title": "Bay Curious",
"tagline": "Exploring the Bay Area, one question at a time",
"info": "KQED’s new podcast, Bay Curious, gets to the bottom of the mysteries — both profound and peculiar — that give the Bay Area its unique identity. And we’ll do it with your help! You ask the questions. You decide what Bay Curious investigates. And you join us on the journey to find the answers.",
"imageSrc": "https://cdn.kqed.org/wp-content/uploads/2024/04/Bay-Curious-Podcast-Tile-703x703-1.jpg",
"imageAlt": "KQED Bay Curious",
"officialWebsiteLink": "/news/series/baycurious",
"meta": {
"site": "news",
"source": "kqed",
"order": 3
},
"link": "/podcasts/baycurious",
"subscribe": {
"apple": "https://podcasts.apple.com/us/podcast/bay-curious/id1172473406",
"npr": "https://www.npr.org/podcasts/500557090/bay-curious",
"rss": "https://ww2.kqed.org/news/category/bay-curious-podcast/feed/podcast",
"amazon": "https://music.amazon.com/podcasts/9a90d476-aa04-455d-9a4c-0871ed6216d4/bay-curious",
"stitcher": "https://www.stitcher.com/podcast/kqed/bay-curious",
"spotify": "https://open.spotify.com/show/6O76IdmhixfijmhTZLIJ8k"
}
},
"bbc-world-service": {
"id": "bbc-world-service",
"title": "BBC World Service",
"info": "The day's top stories from BBC News compiled twice daily in the week, once at weekends.",
"airtime": "MON-FRI 9pm-10pm, TUE-FRI 1am-2am",
"imageSrc": "https://cdn.kqed.org/wp-content/uploads/2024/04/BBC-World-Service-Podcast-Tile-360x360-1.jpg",
"officialWebsiteLink": "https://www.bbc.co.uk/sounds/play/live:bbc_world_service",
"meta": {
"site": "news",
"source": "BBC World Service"
},
"link": "/radio/program/bbc-world-service",
"subscribe": {
"apple": "https://itunes.apple.com/us/podcast/global-news-podcast/id135067274?mt=2",
"tuneIn": "https://tunein.com/radio/BBC-World-Service-p455581/",
"rss": "https://podcasts.files.bbci.co.uk/p02nq0gn.rss"
}
},
"californiareport": {
"id": "californiareport",
"title": "The California Report",
"tagline": "California, day by day",
"info": "KQED’s statewide radio news program providing daily coverage of issues, trends and public policy decisions.",
"imageSrc": "https://cdn.kqed.org/wp-content/uploads/2024/04/The-California-Report-Podcast-Tile-703x703-1.jpg",
"imageAlt": "KQED The California Report",
"officialWebsiteLink": "/californiareport",
"meta": {
"site": "news",
"source": "kqed",
"order": 8
},
"link": "/californiareport",
"subscribe": {
"apple": "https://podcasts.apple.com/us/podcast/kqeds-the-california-report/id79681292",
"amazon": "https://music.amazon.com/podcasts/26099305-72af-4542-9dde-ac1807fe36d5/kqed-s-the-california-report",
"npr": "https://www.npr.org/podcasts/432285393/the-california-report",
"stitcher": "https://www.stitcher.com/podcast/kqedfm-kqeds-the-california-report-podcast-8838",
"rss": "https://ww2.kqed.org/news/tag/tcram/feed/podcast"
}
},
"californiareportmagazine": {
"id": "californiareportmagazine",
"title": "The California Report Magazine",
"tagline": "Your state, your stories",
"info": "Every week, The California Report Magazine takes you on a road trip for the ears: to visit the places and meet the people who make California unique. The in-depth storytelling podcast from the California Report.",
"airtime": "FRI 4:30pm-5pm, 6:30pm-7pm, 11pm-11:30pm",
"imageSrc": "https://cdn.kqed.org/wp-content/uploads/2024/04/The-California-Report-Magazine-Podcast-Tile-703x703-1.jpg",
"imageAlt": "KQED The California Report Magazine",
"officialWebsiteLink": "/californiareportmagazine",
"meta": {
"site": "news",
"source": "kqed",
"order": 10
},
"link": "/californiareportmagazine",
"subscribe": {
"apple": "https://podcasts.apple.com/us/podcast/the-california-report-magazine/id1314750545",
"google": "https://podcasts.google.com/feed/aHR0cHM6Ly9mZWVkcy5tZWdhcGhvbmUuZm0vS1FJTkM3NjkwNjk1OTAz",
"npr": "https://www.npr.org/podcasts/564733126/the-california-report-magazine",
"stitcher": "https://www.stitcher.com/podcast/kqed/the-california-report-magazine",
"rss": "https://ww2.kqed.org/news/tag/tcrmag/feed/podcast"
}
},
"city-arts": {
"id": "city-arts",
"title": "City Arts & Lectures",
"info": "A one-hour radio program to hear celebrated writers, artists and thinkers address contemporary ideas and values, often discussing the creative process. Please note: tapes or transcripts are not available",
"imageSrc": "https://ww2.kqed.org/radio/wp-content/uploads/sites/50/2018/05/cityartsandlecture-300x300.jpg",
"officialWebsiteLink": "https://www.cityarts.net/",
"airtime": "SUN 1pm-2pm, TUE 10pm, WED 1am",
"meta": {
"site": "news",
"source": "City Arts & Lectures"
},
"link": "https://www.cityarts.net",
"subscribe": {
"tuneIn": "https://tunein.com/radio/City-Arts-and-Lectures-p692/",
"rss": "https://www.cityarts.net/feed/"
}
},
"closealltabs": {
"id": "closealltabs",
"title": "Close All Tabs",
"tagline": "Your irreverent guide to the trends redefining our world",
"info": "Close All Tabs breaks down how digital culture shapes our world through thoughtful insights and irreverent humor.",
"imageSrc": "https://cdn.kqed.org/wp-content/uploads/2025/02/CAT_2_Tile-scaled.jpg",
"imageAlt": "KQED Close All Tabs",
"officialWebsiteLink": "/podcasts/closealltabs",
"meta": {
"site": "news",
"source": "kqed",
"order": 1
},
"link": "/podcasts/closealltabs",
"subscribe": {
"apple": "https://podcasts.apple.com/us/podcast/close-all-tabs/id214663465",
"rss": "https://feeds.megaphone.fm/KQINC6993880386",
"amazon": "https://music.amazon.com/podcasts/92d9d4ac-67a3-4eed-b10a-fb45d45b1ef2/close-all-tabs",
"spotify": "https://open.spotify.com/show/6LAJFHnGK1pYXYzv6SIol6?si=deb0cae19813417c"
}
},
"code-switch-life-kit": {
"id": "code-switch-life-kit",
"title": "Code Switch / Life Kit",
"info": "\u003cem>Code Switch\u003c/em>, which listeners will hear in the first part of the hour, has fearless and much-needed conversations about race. Hosted by journalists of color, the show tackles the subject of race head-on, exploring how it impacts every part of society — from politics and pop culture to history, sports and more.\u003cbr />\u003cbr />\u003cem>Life Kit\u003c/em>, which will be in the second part of the hour, guides you through spaces and feelings no one prepares you for — from finances to mental health, from workplace microaggressions to imposter syndrome, from relationships to parenting. The show features experts with real world experience and shares their knowledge. Because everyone needs a little help being human.\u003cbr />\u003cbr />\u003ca href=\"https://www.npr.org/podcasts/510312/codeswitch\">\u003cem>Code Switch\u003c/em> offical site and podcast\u003c/a>\u003cbr />\u003ca href=\"https://www.npr.org/lifekit\">\u003cem>Life Kit\u003c/em> offical site and podcast\u003c/a>\u003cbr />",
"airtime": "SUN 9pm-10pm",
"imageSrc": "https://cdn.kqed.org/wp-content/uploads/2024/04/Code-Switch-Life-Kit-Podcast-Tile-360x360-1.jpg",
"meta": {
"site": "radio",
"source": "npr"
},
"link": "/radio/program/code-switch-life-kit",
"subscribe": {
"apple": "https://podcasts.apple.com/podcast/1112190608?mt=2&at=11l79Y&ct=nprdirectory",
"google": "https://podcasts.google.com/feed/aHR0cHM6Ly93d3cubnByLm9yZy9yc3MvcG9kY2FzdC5waHA_aWQ9NTEwMzEy",
"spotify": "https://open.spotify.com/show/3bExJ9JQpkwNhoHvaIIuyV",
"rss": "https://feeds.npr.org/510312/podcast.xml"
}
},
"commonwealth-club": {
"id": "commonwealth-club",
"title": "Commonwealth Club of California Podcast",
"info": "The Commonwealth Club of California is the nation's oldest and largest public affairs forum. As a non-partisan forum, The Club brings to the public airwaves diverse viewpoints on important topics. The Club's weekly radio broadcast - the oldest in the U.S., dating back to 1924 - is carried across the nation on public radio stations and is now podcasting. Our website archive features audio of our recent programs, as well as selected speeches from our long and distinguished history. This podcast feed is usually updated twice a week and is always un-edited.",
"airtime": "THU 10pm, FRI 1am",
"imageSrc": "https://cdn.kqed.org/wp-content/uploads/2024/04/Commonwealth-Club-Podcast-Tile-360x360-1.jpg",
"officialWebsiteLink": "https://www.commonwealthclub.org/podcasts",
"meta": {
"site": "news",
"source": "Commonwealth Club of California"
},
"link": "/radio/program/commonwealth-club",
"subscribe": {
"apple": "https://itunes.apple.com/us/podcast/commonwealth-club-of-california-podcast/id976334034?mt=2",
"google": "https://podcasts.google.com/feed/aHR0cDovL3d3dy5jb21tb253ZWFsdGhjbHViLm9yZy9hdWRpby9wb2RjYXN0L3dlZWtseS54bWw",
"tuneIn": "https://tunein.com/radio/Commonwealth-Club-of-California-p1060/"
}
},
"forum": {
"id": "forum",
"title": "Forum",
"tagline": "The conversation starts here",
"info": "KQED’s live call-in program discussing local, state, national and international issues, as well as in-depth interviews.",
"airtime": "MON-FRI 9am-11am, 10pm-11pm",
"imageSrc": "https://cdn.kqed.org/wp-content/uploads/2024/04/Forum-Podcast-Tile-703x703-1.jpg",
"imageAlt": "KQED Forum with Mina Kim and Alexis Madrigal",
"officialWebsiteLink": "/forum",
"meta": {
"site": "news",
"source": "kqed",
"order": 9
},
"link": "/forum",
"subscribe": {
"apple": "https://podcasts.apple.com/us/podcast/kqeds-forum/id73329719",
"google": "https://podcasts.google.com/feed/aHR0cHM6Ly9mZWVkcy5tZWdhcGhvbmUuZm0vS1FJTkM5NTU3MzgxNjMz",
"npr": "https://www.npr.org/podcasts/432307980/forum",
"stitcher": "https://www.stitcher.com/podcast/kqedfm-kqeds-forum-podcast",
"rss": "https://feeds.megaphone.fm/KQINC9557381633"
}
},
"freakonomics-radio": {
"id": "freakonomics-radio",
"title": "Freakonomics Radio",
"info": "Freakonomics Radio is a one-hour award-winning podcast and public-radio project hosted by Stephen Dubner, with co-author Steve Levitt as a regular guest. It is produced in partnership with WNYC.",
"imageSrc": "https://ww2.kqed.org/news/wp-content/uploads/sites/10/2018/05/freakonomicsRadio.png",
"officialWebsiteLink": "http://freakonomics.com/",
"airtime": "SUN 1am-2am, SAT 3pm-4pm",
"meta": {
"site": "radio",
"source": "WNYC"
},
"link": "/radio/program/freakonomics-radio",
"subscribe": {
"npr": "https://rpb3r.app.goo.gl/4s8b",
"apple": "https://itunes.apple.com/us/podcast/freakonomics-radio/id354668519",
"tuneIn": "https://tunein.com/podcasts/WNYC-Podcasts/Freakonomics-Radio-p272293/",
"rss": "https://feeds.feedburner.com/freakonomicsradio"
}
},
"fresh-air": {
"id": "fresh-air",
"title": "Fresh Air",
"info": "Hosted by Terry Gross, \u003cem>Fresh Air from WHYY\u003c/em> is the Peabody Award-winning weekday magazine of contemporary arts and issues. One of public radio's most popular programs, Fresh Air features intimate conversations with today's biggest luminaries.",
"airtime": "MON-FRI 7pm-8pm",
"imageSrc": "https://cdn.kqed.org/wp-content/uploads/2024/04/Fresh-Air-Podcast-Tile-360x360-1.jpg",
"officialWebsiteLink": "https://www.npr.org/programs/fresh-air/",
"meta": {
"site": "radio",
"source": "npr"
},
"link": "/radio/program/fresh-air",
"subscribe": {
"npr": "https://rpb3r.app.goo.gl/4s8b",
"apple": "https://itunes.apple.com/WebObjects/MZStore.woa/wa/viewPodcast?s=143441&mt=2&id=214089682&at=11l79Y&ct=nprdirectory",
"tuneIn": "https://tunein.com/radio/Fresh-Air-p17/",
"rss": "https://feeds.npr.org/381444908/podcast.xml"
}
},
"here-and-now": {
"id": "here-and-now",
"title": "Here & Now",
"info": "A live production of NPR and WBUR Boston, in collaboration with stations across the country, Here & Now reflects the fluid world of news as it's happening in the middle of the day, with timely, in-depth news, interviews and conversation. Hosted by Robin Young, Jeremy Hobson and Tonya Mosley.",
"airtime": "MON-THU 11am-12pm",
"imageSrc": "https://cdn.kqed.org/wp-content/uploads/2024/04/Here-And-Now-Podcast-Tile-360x360-1.jpg",
"officialWebsiteLink": "http://www.wbur.org/hereandnow",
"meta": {
"site": "news",
"source": "npr"
},
"link": "/radio/program/here-and-now",
"subsdcribe": {
"apple": "https://itunes.apple.com/WebObjects/MZStore.woa/wa/viewPodcast?mt=2&id=426698661",
"tuneIn": "https://tunein.com/radio/Here--Now-p211/",
"rss": "https://feeds.npr.org/510051/podcast.xml"
}
},
"hidden-brain": {
"id": "hidden-brain",
"title": "Hidden Brain",
"info": "Shankar Vedantam uses science and storytelling to reveal the unconscious patterns that drive human behavior, shape our choices and direct our relationships.",
"imageSrc": "https://ww2.kqed.org/radio/wp-content/uploads/sites/50/2018/05/hiddenbrain.jpg",
"officialWebsiteLink": "https://www.npr.org/series/423302056/hidden-brain",
"airtime": "SUN 7pm-8pm",
"meta": {
"site": "news",
"source": "NPR"
},
"link": "/radio/program/hidden-brain",
"subscribe": {
"apple": "https://itunes.apple.com/us/podcast/hidden-brain/id1028908750?mt=2",
"tuneIn": "https://tunein.com/podcasts/Science-Podcasts/Hidden-Brain-p787503/",
"rss": "https://feeds.npr.org/510308/podcast.xml"
}
},
"how-i-built-this": {
"id": "how-i-built-this",
"title": "How I Built This with Guy Raz",
"info": "Guy Raz dives into the stories behind some of the world's best known companies. How I Built This weaves a narrative journey about innovators, entrepreneurs and idealists—and the movements they built.",
"imageSrc": "https://ww2.kqed.org/news/wp-content/uploads/sites/10/2018/05/howIBuiltThis.png",
"officialWebsiteLink": "https://www.npr.org/podcasts/510313/how-i-built-this",
"airtime": "SUN 7:30pm-8pm",
"meta": {
"site": "news",
"source": "npr"
},
"link": "/radio/program/how-i-built-this",
"subscribe": {
"npr": "https://rpb3r.app.goo.gl/3zxy",
"apple": "https://itunes.apple.com/us/podcast/how-i-built-this-with-guy-raz/id1150510297?mt=2",
"tuneIn": "https://tunein.com/podcasts/Arts--Culture-Podcasts/How-I-Built-This-p910896/",
"rss": "https://feeds.npr.org/510313/podcast.xml"
}
},
"hyphenacion": {
"id": "hyphenacion",
"title": "Hyphenación",
"tagline": "Where conversation and cultura meet",
"info": "What kind of no sabo word is Hyphenación? For us, it’s about living within a hyphenation. Like being a third-gen Mexican-American from the Texas border now living that Bay Area Chicano life. Like Xorje! Each week we bring together a couple of hyphenated Latinos to talk all about personal life choices: family, careers, relationships, belonging … everything is on the table. ",
"imageSrc": "https://cdn.kqed.org/wp-content/uploads/2025/03/Hyphenacion_FinalAssets_PodcastTile.png",
"imageAlt": "KQED Hyphenación",
"officialWebsiteLink": "/podcasts/hyphenacion",
"meta": {
"site": "news",
"source": "kqed",
"order": 15
},
"link": "/podcasts/hyphenacion",
"subscribe": {
"apple": "https://podcasts.apple.com/us/podcast/hyphenaci%C3%B3n/id1191591838",
"spotify": "https://open.spotify.com/show/2p3Fifq96nw9BPcmFdIq0o?si=39209f7b25774f38",
"youtube": "https://www.youtube.com/c/kqedarts",
"amazon": "https://music.amazon.com/podcasts/6c3dd23c-93fb-4aab-97ba-1725fa6315f1/hyphenaci%C3%B3n",
"rss": "https://feeds.megaphone.fm/KQINC2275451163"
}
},
"jerrybrown": {
"id": "jerrybrown",
"title": "The Political Mind of Jerry Brown",
"tagline": "Lessons from a lifetime in politics",
"info": "The Political Mind of Jerry Brown brings listeners the wisdom of the former Governor, Mayor, and presidential candidate. Scott Shafer interviewed Brown for more than 40 hours, covering the former governor's life and half-century in the political game – and Brown has some lessons he'd like to share. ",
"imageSrc": "https://cdn.kqed.org/wp-content/uploads/2024/04/The-Political-Mind-of-Jerry-Brown-Podcast-Tile-703x703-1.jpg",
"imageAlt": "KQED The Political Mind of Jerry Brown",
"officialWebsiteLink": "/podcasts/jerrybrown",
"meta": {
"site": "news",
"source": "kqed",
"order": 18
},
"link": "/podcasts/jerrybrown",
"subscribe": {
"npr": "https://www.npr.org/podcasts/790253322/the-political-mind-of-jerry-brown",
"apple": "https://itunes.apple.com/us/podcast/id1492194549",
"rss": "https://ww2.kqed.org/news/series/jerrybrown/feed/podcast/",
"tuneIn": "http://tun.in/pjGcK",
"stitcher": "https://www.stitcher.com/podcast/kqed/the-political-mind-of-jerry-brown",
"spotify": "https://open.spotify.com/show/54C1dmuyFyKMFttY6X2j6r?si=K8SgRCoISNK6ZbjpXrX5-w",
"amazon": "https://music.amazon.com/podcasts/44420f75-3b0e-4301-ab3b-16da6b09e543/the-political-mind-of-jerry-brown"
}
},
"latino-usa": {
"id": "latino-usa",
"title": "Latino USA",
"airtime": "MON 1am-2am, SUN 6pm-7pm",
"info": "Latino USA, the radio journal of news and culture, is the only national, English-language radio program produced from a Latino perspective.",
"imageSrc": "https://ww2.kqed.org/radio/wp-content/uploads/sites/50/2018/04/latinoUsa.jpg",
"officialWebsiteLink": "http://latinousa.org/",
"meta": {
"site": "news",
"source": "npr"
},
"link": "/radio/program/latino-usa",
"subscribe": {
"npr": "https://rpb3r.app.goo.gl/xtTd",
"apple": "https://itunes.apple.com/WebObjects/MZStore.woa/wa/viewPodcast?s=143441&mt=2&id=79681317&at=11l79Y&ct=nprdirectory",
"tuneIn": "https://tunein.com/radio/Latino-USA-p621/",
"rss": "https://feeds.npr.org/510016/podcast.xml"
}
},
"marketplace": {
"id": "marketplace",
"title": "Marketplace",
"info": "Our flagship program, helmed by Kai Ryssdal, examines what the day in money delivered, through stories, conversations, newsworthy numbers and more. Updated Monday through Friday at about 3:30 p.m. PT.",
"airtime": "MON-FRI 4pm-4:30pm, MON-WED 6:30pm-7pm",
"imageSrc": "https://cdn.kqed.org/wp-content/uploads/2024/04/Marketplace-Podcast-Tile-360x360-1.jpg",
"officialWebsiteLink": "https://www.marketplace.org/",
"meta": {
"site": "news",
"source": "American Public Media"
},
"link": "/radio/program/marketplace",
"subscribe": {
"apple": "https://itunes.apple.com/WebObjects/MZStore.woa/wa/viewPodcast?s=143441&mt=2&id=201853034&at=11l79Y&ct=nprdirectory",
"tuneIn": "https://tunein.com/radio/APM-Marketplace-p88/",
"rss": "https://feeds.publicradio.org/public_feeds/marketplace-pm/rss/rss"
}
},
"masters-of-scale": {
"id": "masters-of-scale",
"title": "Masters of Scale",
"info": "Masters of Scale is an original podcast in which LinkedIn co-founder and Greylock Partner Reid Hoffman sets out to describe and prove theories that explain how great entrepreneurs take their companies from zero to a gazillion in ingenious fashion.",
"airtime": "Every other Wednesday June 12 through October 16 at 8pm (repeats Thursdays at 2am)",
"imageSrc": "https://cdn.kqed.org/wp-content/uploads/2024/04/Masters-of-Scale-Podcast-Tile-360x360-1.jpg",
"officialWebsiteLink": "https://mastersofscale.com/",
"meta": {
"site": "radio",
"source": "WaitWhat"
},
"link": "/radio/program/masters-of-scale",
"subscribe": {
"apple": "http://mastersofscale.app.link/",
"rss": "https://rss.art19.com/masters-of-scale"
}
},
"mindshift": {
"id": "mindshift",
"title": "MindShift",
"tagline": "A podcast about the future of learning and how we raise our kids",
"info": "The MindShift podcast explores the innovations in education that are shaping how kids learn. Hosts Ki Sung and Katrina Schwartz introduce listeners to educators, researchers, parents and students who are developing effective ways to improve how kids learn. We cover topics like how fed-up administrators are developing surprising tactics to deal with classroom disruptions; how listening to podcasts are helping kids develop reading skills; the consequences of overparenting; and why interdisciplinary learning can engage students on all ends of the traditional achievement spectrum. This podcast is part of the MindShift education site, a division of KQED News. KQED is an NPR/PBS member station based in San Francisco. You can also visit the MindShift website for episodes and supplemental blog posts or tweet us \u003ca href=\"https://twitter.com/MindShiftKQED\">@MindShiftKQED\u003c/a> or visit us at \u003ca href=\"/mindshift\">MindShift.KQED.org\u003c/a>",
"imageSrc": "https://cdn.kqed.org/wp-content/uploads/2024/04/Mindshift-Podcast-Tile-703x703-1.jpg",
"imageAlt": "KQED MindShift: How We Will Learn",
"officialWebsiteLink": "/mindshift/",
"meta": {
"site": "news",
"source": "kqed",
"order": 12
},
"link": "/podcasts/mindshift",
"subscribe": {
"apple": "https://podcasts.apple.com/us/podcast/mindshift-podcast/id1078765985",
"google": "https://podcasts.google.com/feed/aHR0cHM6Ly9mZWVkcy5tZWdhcGhvbmUuZm0vS1FJTkM1NzY0NjAwNDI5",
"npr": "https://www.npr.org/podcasts/464615685/mind-shift-podcast",
"stitcher": "https://www.stitcher.com/podcast/kqed/stories-teachers-share",
"spotify": "https://open.spotify.com/show/0MxSpNYZKNprFLCl7eEtyx"
}
},
"morning-edition": {
"id": "morning-edition",
"title": "Morning Edition",
"info": "\u003cem>Morning Edition\u003c/em> takes listeners around the country and the world with multi-faceted stories and commentaries every weekday. Hosts Steve Inskeep, David Greene and Rachel Martin bring you the latest breaking news and features to prepare you for the day.",
"airtime": "MON-FRI 3am-9am",
"imageSrc": "https://cdn.kqed.org/wp-content/uploads/2024/04/Morning-Edition-Podcast-Tile-360x360-1.jpg",
"officialWebsiteLink": "https://www.npr.org/programs/morning-edition/",
"meta": {
"site": "news",
"source": "npr"
},
"link": "/radio/program/morning-edition"
},
"onourwatch": {
"id": "onourwatch",
"title": "On Our Watch",
"tagline": "Deeply-reported investigative journalism",
"info": "For decades, the process for how police police themselves has been inconsistent – if not opaque. In some states, like California, these proceedings were completely hidden. After a new police transparency law unsealed scores of internal affairs files, our reporters set out to examine these cases and the shadow world of police discipline. On Our Watch brings listeners into the rooms where officers are questioned and witnesses are interrogated to find out who this system is really protecting. Is it the officers, or the public they've sworn to serve?",
"imageSrc": "https://cdn.kqed.org/wp-content/uploads/2024/04/On-Our-Watch-Podcast-Tile-703x703-1.jpg",
"imageAlt": "On Our Watch from NPR and KQED",
"officialWebsiteLink": "/podcasts/onourwatch",
"meta": {
"site": "news",
"source": "kqed",
"order": 11
},
"link": "/podcasts/onourwatch",
"subscribe": {
"apple": "https://podcasts.apple.com/podcast/id1567098962",
"google": "https://podcasts.google.com/feed/aHR0cHM6Ly9mZWVkcy5ucHIub3JnLzUxMDM2MC9wb2RjYXN0LnhtbD9zYz1nb29nbGVwb2RjYXN0cw",
"npr": "https://rpb3r.app.goo.gl/onourwatch",
"spotify": "https://open.spotify.com/show/0OLWoyizopu6tY1XiuX70x",
"tuneIn": "https://tunein.com/radio/On-Our-Watch-p1436229/",
"stitcher": "https://www.stitcher.com/show/on-our-watch",
"rss": "https://feeds.npr.org/510360/podcast.xml"
}
},
"on-the-media": {
"id": "on-the-media",
"title": "On The Media",
"info": "Our weekly podcast explores how the media 'sausage' is made, casts an incisive eye on fluctuations in the marketplace of ideas, and examines threats to the freedom of information and expression in America and abroad. For one hour a week, the show tries to lift the veil from the process of \"making media,\" especially news media, because it's through that lens that we see the world and the world sees us",
"airtime": "SUN 2pm-3pm, MON 12am-1am",
"imageSrc": "https://ww2.kqed.org/radio/wp-content/uploads/sites/50/2018/04/onTheMedia.png",
"officialWebsiteLink": "https://www.wnycstudios.org/shows/otm",
"meta": {
"site": "news",
"source": "wnyc"
},
"link": "/radio/program/on-the-media",
"subscribe": {
"apple": "https://itunes.apple.com/us/podcast/on-the-media/id73330715?mt=2",
"tuneIn": "https://tunein.com/radio/On-the-Media-p69/",
"rss": "http://feeds.wnyc.org/onthemedia"
}
},
"pbs-newshour": {
"id": "pbs-newshour",
"title": "PBS NewsHour",
"info": "Analysis, background reports and updates from the PBS NewsHour putting today's news in context.",
"airtime": "MON-FRI 3pm-4pm",
"imageSrc": "https://cdn.kqed.org/wp-content/uploads/2024/04/PBS-News-Hour-Podcast-Tile-360x360-1.jpg",
"officialWebsiteLink": "https://www.pbs.org/newshour/",
"meta": {
"site": "news",
"source": "pbs"
},
"link": "/radio/program/pbs-newshour",
"subscribe": {
"apple": "https://itunes.apple.com/us/podcast/pbs-newshour-full-show/id394432287?mt=2",
"tuneIn": "https://tunein.com/radio/PBS-NewsHour---Full-Show-p425698/",
"rss": "https://www.pbs.org/newshour/feeds/rss/podcasts/show"
}
},
"perspectives": {
"id": "perspectives",
"title": "Perspectives",
"tagline": "KQED's series of daily listener commentaries since 1991",
"info": "KQED's series of daily listener commentaries since 1991.",
"imageSrc": "https://cdn.kqed.org/wp-content/uploads/2025/01/Perspectives_Tile_Final.jpg",
"imageAlt": "KQED Perspectives",
"officialWebsiteLink": "/perspectives/",
"meta": {
"site": "radio",
"source": "kqed",
"order": 14
},
"link": "/perspectives",
"subscribe": {
"apple": "https://podcasts.apple.com/us/podcast/id73801135",
"npr": "https://www.npr.org/podcasts/432309616/perspectives",
"rss": "https://ww2.kqed.org/perspectives/category/perspectives/feed/",
"google": "https://podcasts.google.com/feed/aHR0cHM6Ly93dzIua3FlZC5vcmcvcGVyc3BlY3RpdmVzL2NhdGVnb3J5L3BlcnNwZWN0aXZlcy9mZWVkLw"
}
},
"planet-money": {
"id": "planet-money",
"title": "Planet Money",
"info": "The economy explained. Imagine you could call up a friend and say, Meet me at the bar and tell me what's going on with the economy. Now imagine that's actually a fun evening.",
"airtime": "SUN 3pm-4pm",
"imageSrc": "https://ww2.kqed.org/radio/wp-content/uploads/sites/50/2018/04/planetmoney.jpg",
"officialWebsiteLink": "https://www.npr.org/sections/money/",
"meta": {
"site": "news",
"source": "npr"
},
"link": "/radio/program/planet-money",
"subscribe": {
"npr": "https://rpb3r.app.goo.gl/M4f5",
"apple": "https://itunes.apple.com/us/podcast/planet-money/id290783428?mt=2",
"tuneIn": "https://tunein.com/podcasts/Business--Economics-Podcasts/Planet-Money-p164680/",
"rss": "https://feeds.npr.org/510289/podcast.xml"
}
},
"politicalbreakdown": {
"id": "politicalbreakdown",
"title": "Political Breakdown",
"tagline": "Politics from a personal perspective",
"info": "Political Breakdown is a new series that explores the political intersection of California and the nation. Each week hosts Scott Shafer and Marisa Lagos are joined with a new special guest to unpack politics -- with personality — and offer an insider’s glimpse at how politics happens.",
"airtime": "THU 6:30pm-7pm",
"imageSrc": "https://cdn.kqed.org/wp-content/uploads/2024/04/Political-Breakdown-2024-Podcast-Tile-703x703-1.jpg",
"imageAlt": "KQED Political Breakdown",
"officialWebsiteLink": "/podcasts/politicalbreakdown",
"meta": {
"site": "radio",
"source": "kqed",
"order": 5
},
"link": "/podcasts/politicalbreakdown",
"subscribe": {
"apple": "https://podcasts.apple.com/us/podcast/political-breakdown/id1327641087",
"amazon": "https://music.amazon.com/podcasts/e0c2d153-ad36-4c8d-901d-f1da6a724824/political-breakdown",
"npr": "https://www.npr.org/podcasts/572155894/political-breakdown",
"stitcher": "https://www.stitcher.com/podcast/kqed/political-breakdown",
"spotify": "https://open.spotify.com/show/07RVyIjIdk2WDuVehvBMoN",
"rss": "https://ww2.kqed.org/news/tag/political-breakdown/feed/podcast"
}
},
"possible": {
"id": "possible",
"title": "Possible",
"info": "Possible is hosted by entrepreneur Reid Hoffman and writer Aria Finger. Together in Possible, Hoffman and Finger lead enlightening discussions about building a brighter collective future. The show features interviews with visionary guests like Trevor Noah, Sam Altman and Janette Sadik-Khan. Possible paints an optimistic portrait of the world we can create through science, policy, business, art and our shared humanity. It asks: What if everything goes right for once? How can we get there? Each episode also includes a short fiction story generated by advanced AI GPT-4, serving as a thought-provoking springboard to speculate how humanity could leverage technology for good.",
"airtime": "SUN 2pm",
"imageSrc": "https://cdn.kqed.org/wp-content/uploads/2024/04/Possible-Podcast-Tile-360x360-1.jpg",
"officialWebsiteLink": "https://www.possible.fm/",
"meta": {
"site": "news",
"source": "Possible"
},
"link": "/radio/program/possible",
"subscribe": {
"apple": "https://podcasts.apple.com/us/podcast/possible/id1677184070",
"spotify": "https://open.spotify.com/show/730YpdUSNlMyPQwNnyjp4k"
}
},
"pri-the-world": {
"id": "pri-the-world",
"title": "PRI's The World: Latest Edition",
"info": "Each weekday, host Marco Werman and his team of producers bring you the world's most interesting stories in an hour of radio that reminds us just how small our planet really is.",
"airtime": "MON-FRI 2pm-3pm",
"imageSrc": "https://cdn.kqed.org/wp-content/uploads/2024/04/The-World-Podcast-Tile-360x360-1.jpg",
"officialWebsiteLink": "https://www.pri.org/programs/the-world",
"meta": {
"site": "news",
"source": "PRI"
},
"link": "/radio/program/pri-the-world",
"subscribe": {
"apple": "https://itunes.apple.com/us/podcast/pris-the-world-latest-edition/id278196007?mt=2",
"tuneIn": "https://tunein.com/podcasts/News--Politics-Podcasts/PRIs-The-World-p24/",
"rss": "http://feeds.feedburner.com/pri/theworld"
}
},
"radiolab": {
"id": "radiolab",
"title": "Radiolab",
"info": "A two-time Peabody Award-winner, Radiolab is an investigation told through sounds and stories, and centered around one big idea. In the Radiolab world, information sounds like music and science and culture collide. Hosted by Jad Abumrad and Robert Krulwich, the show is designed for listeners who demand skepticism, but appreciate wonder. WNYC Studios is the producer of other leading podcasts including Freakonomics Radio, Death, Sex & Money, On the Media and many more.",
"airtime": "SUN 12am-1am, SAT 2pm-3pm",
"imageSrc": "https://ww2.kqed.org/radio/wp-content/uploads/sites/50/2018/04/radiolab1400.png",
"officialWebsiteLink": "https://www.wnycstudios.org/shows/radiolab/",
"meta": {
"site": "science",
"source": "WNYC"
},
"link": "/radio/program/radiolab",
"subscribe": {
"apple": "https://itunes.apple.com/us/podcast/radiolab/id152249110?mt=2",
"tuneIn": "https://tunein.com/radio/RadioLab-p68032/",
"rss": "https://feeds.wnyc.org/radiolab"
}
},
"reveal": {
"id": "reveal",
"title": "Reveal",
"info": "Created by The Center for Investigative Reporting and PRX, Reveal is public radios first one-hour weekly radio show and podcast dedicated to investigative reporting. Credible, fact based and without a partisan agenda, Reveal combines the power and artistry of driveway moment storytelling with data-rich reporting on critically important issues. The result is stories that inform and inspire, arming our listeners with information to right injustices, hold the powerful accountable and improve lives.Reveal is hosted by Al Letson and showcases the award-winning work of CIR and newsrooms large and small across the nation. In a radio and podcast market crowded with choices, Reveal focuses on important and often surprising stories that illuminate the world for our listeners.",
"airtime": "SAT 4pm-5pm",
"imageSrc": "https://ww2.kqed.org/radio/wp-content/uploads/sites/50/2018/04/reveal300px.png",
"officialWebsiteLink": "https://www.revealnews.org/episodes/",
"meta": {
"site": "news",
"source": "npr"
},
"link": "/radio/program/reveal",
"subscribe": {
"apple": "https://itunes.apple.com/us/podcast/reveal/id886009669",
"tuneIn": "https://tunein.com/radio/Reveal-p679597/",
"rss": "http://feeds.revealradio.org/revealpodcast"
}
},
"rightnowish": {
"id": "rightnowish",
"title": "Rightnowish",
"tagline": "Art is where you find it",
"info": "Rightnowish digs into life in the Bay Area right now… ish. Journalist Pendarvis Harshaw takes us to galleries painted on the sides of liquor stores in West Oakland. We'll dance in warehouses in the Bayview, make smoothies with kids in South Berkeley, and listen to classical music in a 1984 Cutlass Supreme in Richmond. Every week, Pen talks to movers and shakers about how the Bay Area shapes what they create, and how they shape the place we call home.",
"imageSrc": "https://cdn.kqed.org/wp-content/uploads/2024/04/Rightnowish-Podcast-Tile-500x500-1.jpg",
"imageAlt": "KQED Rightnowish with Pendarvis Harshaw",
"officialWebsiteLink": "/podcasts/rightnowish",
"meta": {
"site": "arts",
"source": "kqed",
"order": 16
},
"link": "/podcasts/rightnowish",
"subscribe": {
"npr": "https://www.npr.org/podcasts/721590300/rightnowish",
"rss": "https://ww2.kqed.org/arts/programs/rightnowish/feed/podcast",
"apple": "https://podcasts.apple.com/us/podcast/rightnowish/id1482187648",
"stitcher": "https://www.stitcher.com/podcast/kqed/rightnowish",
"google": "https://podcasts.google.com/feed/aHR0cHM6Ly9mZWVkcy5tZWdhcGhvbmUuZm0vS1FJTkMxMjU5MTY3NDc4",
"spotify": "https://open.spotify.com/show/7kEJuafTzTVan7B78ttz1I"
}
},
"science-friday": {
"id": "science-friday",
"title": "Science Friday",
"info": "Science Friday is a weekly science talk show, broadcast live over public radio stations nationwide. Each week, the show focuses on science topics that are in the news and tries to bring an educated, balanced discussion to bear on the scientific issues at hand. Panels of expert guests join host Ira Flatow, a veteran science journalist, to discuss science and to take questions from listeners during the call-in portion of the program.",
"airtime": "FRI 11am-1pm",
"imageSrc": "https://cdn.kqed.org/wp-content/uploads/2024/04/Science-Friday-Podcast-Tile-360x360-1.jpg",
"officialWebsiteLink": "https://www.wnycstudios.org/shows/science-friday",
"meta": {
"site": "news",
"source": "npr"
},
"link": "/radio/program/science-friday",
"subscribe": {
"apple": "https://itunes.apple.com/WebObjects/MZStore.woa/wa/viewPodcast?s=143441&mt=2&id=73329284&at=11l79Y&ct=nprdirectory",
"tuneIn": "https://tunein.com/radio/Science-Friday-p394/",
"rss": "http://feeds.wnyc.org/science-friday"
}
},
"snap-judgment": {
"id": "snap-judgment",
"title": "Snap Judgment",
"tagline": "Real stories with killer beats",
"info": "The Snap Judgment radio show and podcast mixes real stories with killer beats to produce cinematic, dramatic radio. Snap's musical brand of storytelling dares listeners to see the world through the eyes of another. This is storytelling... with a BEAT!! Snap first aired on public radio stations nationwide in July 2010. Today, Snap Judgment airs on over 450 public radio stations and is brought to the airwaves by KQED & PRX.",
"airtime": "SAT 1pm-2pm, 9pm-10pm",
"imageSrc": "https://cdn.kqed.org/wp-content/uploads/2024/05/Snap-Judgment-Podcast-Tile-703x703-1.jpg",
"imageAlt": "KQED Snap Judgment",
"officialWebsiteLink": "https://snapjudgment.org",
"meta": {
"site": "arts",
"source": "kqed",
"order": 4
},
"link": "https://snapjudgment.org",
"subscribe": {
"apple": "https://podcasts.apple.com/us/podcast/snap-judgment/id283657561",
"npr": "https://www.npr.org/podcasts/449018144/snap-judgment",
"stitcher": "https://www.pandora.com/podcast/snap-judgment/PC:241?source=stitcher-sunset",
"spotify": "https://open.spotify.com/show/3Cct7ZWmxHNAtLgBTqjC5v",
"rss": "https://snap.feed.snapjudgment.org/"
}
},
"soldout": {
"id": "soldout",
"title": "SOLD OUT: Rethinking Housing in America",
"tagline": "A new future for housing",
"info": "Sold Out: Rethinking Housing in America",
"imageSrc": "https://cdn.kqed.org/wp-content/uploads/2024/04/Sold-Out-Podcast-Tile-703x703-1.jpg",
"imageAlt": "KQED Sold Out: Rethinking Housing in America",
"officialWebsiteLink": "/podcasts/soldout",
"meta": {
"site": "news",
"source": "kqed",
"order": 13
},
"link": "/podcasts/soldout",
"subscribe": {
"npr": "https://www.npr.org/podcasts/911586047/s-o-l-d-o-u-t-a-new-future-for-housing",
"apple": "https://podcasts.apple.com/us/podcast/introducing-sold-out-rethinking-housing-in-america/id1531354937",
"rss": "https://feeds.megaphone.fm/soldout",
"spotify": "https://open.spotify.com/show/38dTBSk2ISFoPiyYNoKn1X",
"stitcher": "https://www.stitcher.com/podcast/kqed/sold-out-rethinking-housing-in-america",
"tunein": "https://tunein.com/radio/SOLD-OUT-Rethinking-Housing-in-America-p1365871/"
}
},
"spooked": {
"id": "spooked",
"title": "Spooked",
"tagline": "True-life supernatural stories",
"info": "",
"imageSrc": "https://cdn.kqed.org/wp-content/uploads/2024/10/Spooked-Podcast-Tile-703x703-1.jpg",
"imageAlt": "KQED Spooked",
"officialWebsiteLink": "https://spookedpodcast.org/",
"meta": {
"site": "news",
"source": "kqed",
"order": 7
},
"link": "https://spookedpodcast.org/",
"subscribe": {
"apple": "https://podcasts.apple.com/us/podcast/spooked/id1279361017",
"npr": "https://www.npr.org/podcasts/549547848/snap-judgment-presents-spooked",
"spotify": "https://open.spotify.com/show/76571Rfl3m7PLJQZKQIGCT",
"rss": "https://feeds.simplecast.com/TBotaapn"
}
},
"tech-nation": {
"id": "tech-nation",
"title": "Tech Nation Radio Podcast",
"info": "Tech Nation is a weekly public radio program, hosted by Dr. Moira Gunn. Founded in 1993, it has grown from a simple interview show to a multi-faceted production, featuring conversations with noted technology and science leaders, and a weekly science and technology-related commentary.",
"airtime": "FRI 10pm",
"imageSrc": "https://cdn.kqed.org/wp-content/uploads/2024/04/Tech-Nation-Radio-Podcast-Tile-360x360-1.jpg",
"officialWebsiteLink": "http://technation.podomatic.com/",
"meta": {
"site": "science",
"source": "Tech Nation Media"
},
"link": "/radio/program/tech-nation",
"subscribe": {
"rss": "https://technation.podomatic.com/rss2.xml"
}
},
"ted-radio-hour": {
"id": "ted-radio-hour",
"title": "TED Radio Hour",
"info": "The TED Radio Hour is a journey through fascinating ideas, astonishing inventions, fresh approaches to old problems, and new ways to think and create.",
"airtime": "SUN 3pm-4pm, SAT 10pm-11pm",
"imageSrc": "https://ww2.kqed.org/radio/wp-content/uploads/sites/50/2018/04/tedRadioHour.jpg",
"officialWebsiteLink": "https://www.npr.org/programs/ted-radio-hour/?showDate=2018-06-22",
"meta": {
"site": "news",
"source": "npr"
},
"link": "/radio/program/ted-radio-hour",
"subscribe": {
"npr": "https://rpb3r.app.goo.gl/8vsS",
"apple": "https://itunes.apple.com/WebObjects/MZStore.woa/wa/viewPodcast?s=143441&mt=2&id=523121474&at=11l79Y&ct=nprdirectory",
"tuneIn": "https://tunein.com/radio/TED-Radio-Hour-p418021/",
"rss": "https://feeds.npr.org/510298/podcast.xml"
}
},
"thebay": {
"id": "thebay",
"title": "The Bay",
"tagline": "Local news to keep you rooted",
"info": "Host Devin Katayama walks you through the biggest story of the day with reporters and newsmakers.",
"imageSrc": "https://cdn.kqed.org/wp-content/uploads/2024/04/The-Bay-Podcast-Tile-703x703-1.jpg",
"imageAlt": "KQED The Bay",
"officialWebsiteLink": "/podcasts/thebay",
"meta": {
"site": "radio",
"source": "kqed",
"order": 2
},
"link": "/podcasts/thebay",
"subscribe": {
"apple": "https://podcasts.apple.com/us/podcast/the-bay/id1350043452",
"amazon": "https://music.amazon.com/podcasts/d800ea4c-7a2c-42f2-b861-edaf78a5db0b/the-bay",
"npr": "https://www.npr.org/podcasts/586725995/the-bay",
"stitcher": "https://www.stitcher.com/podcast/kqed/the-bay",
"spotify": "https://open.spotify.com/show/4BIKBKIujizLHlIlBNaAqQ",
"rss": "https://feeds.megaphone.fm/KQINC8259786327"
}
},
"thelatest": {
"id": "thelatest",
"title": "The Latest",
"tagline": "Trusted local news in real time",
"info": "",
"imageSrc": "https://cdn.kqed.org/wp-content/uploads/2025/05/The-Latest-2025-Podcast-Tile-703x703-1.jpg",
"imageAlt": "KQED The Latest",
"officialWebsiteLink": "/thelatest",
"meta": {
"site": "news",
"source": "kqed",
"order": 6
},
"link": "/thelatest",
"subscribe": {
"apple": "https://podcasts.apple.com/us/podcast/the-latest-from-kqed/id1197721799",
"npr": "https://www.npr.org/podcasts/1257949365/the-latest-from-k-q-e-d",
"spotify": "https://open.spotify.com/show/5KIIXMgM9GTi5AepwOYvIZ?si=bd3053fec7244dba",
"rss": "https://feeds.megaphone.fm/KQINC9137121918"
}
},
"theleap": {
"id": "theleap",
"title": "The Leap",
"tagline": "What if you closed your eyes, and jumped?",
"info": "Stories about people making dramatic, risky changes, told by award-winning public radio reporter Judy Campbell.",
"imageSrc": "https://cdn.kqed.org/wp-content/uploads/2024/04/The-Leap-Podcast-Tile-703x703-1.jpg",
"imageAlt": "KQED The Leap",
"officialWebsiteLink": "/podcasts/theleap",
"meta": {
"site": "news",
"source": "kqed",
"order": 17
},
"link": "/podcasts/theleap",
"subscribe": {
"apple": "https://podcasts.apple.com/us/podcast/the-leap/id1046668171",
"npr": "https://www.npr.org/podcasts/447248267/the-leap",
"stitcher": "https://www.stitcher.com/podcast/kqed/the-leap",
"spotify": "https://open.spotify.com/show/3sSlVHHzU0ytLwuGs1SD1U",
"rss": "https://ww2.kqed.org/news/programs/the-leap/feed/podcast"
}
},
"the-moth-radio-hour": {
"id": "the-moth-radio-hour",
"title": "The Moth Radio Hour",
"info": "Since its launch in 1997, The Moth has presented thousands of true stories, told live and without notes, to standing-room-only crowds worldwide. Moth storytellers stand alone, under a spotlight, with only a microphone and a roomful of strangers. The storyteller and the audience embark on a high-wire act of shared experience which is both terrifying and exhilarating. Since 2008, The Moth podcast has featured many of our favorite stories told live on Moth stages around the country. For information on all of our programs and live events, visit themoth.org.",
"airtime": "SAT 8pm-9pm and SUN 11am-12pm",
"imageSrc": "https://ww2.kqed.org/radio/wp-content/uploads/sites/50/2018/04/theMoth.jpg",
"officialWebsiteLink": "https://themoth.org/",
"meta": {
"site": "arts",
"source": "prx"
},
"link": "/radio/program/the-moth-radio-hour",
"subscribe": {
"apple": "https://itunes.apple.com/us/podcast/the-moth-podcast/id275699983?mt=2",
"tuneIn": "https://tunein.com/radio/The-Moth-p273888/",
"rss": "http://feeds.themoth.org/themothpodcast"
}
},
"the-new-yorker-radio-hour": {
"id": "the-new-yorker-radio-hour",
"title": "The New Yorker Radio Hour",
"info": "The New Yorker Radio Hour is a weekly program presented by the magazine's editor, David Remnick, and produced by WNYC Studios and The New Yorker. Each episode features a diverse mix of interviews, profiles, storytelling, and an occasional burst of humor inspired by the magazine, and shaped by its writers, artists, and editors. This isn't a radio version of a magazine, but something all its own, reflecting the rich possibilities of audio storytelling and conversation. Theme music for the show was composed and performed by Merrill Garbus of tUnE-YArDs.",
"airtime": "SAT 10am-11am",
"imageSrc": "https://cdn.kqed.org/wp-content/uploads/2024/04/The-New-Yorker-Podcast-Tile-360x360-1.jpg",
"officialWebsiteLink": "https://www.wnycstudios.org/shows/tnyradiohour",
"meta": {
"site": "arts",
"source": "WNYC"
},
"link": "/radio/program/the-new-yorker-radio-hour",
"subscribe": {
"apple": "https://itunes.apple.com/us/podcast/id1050430296",
"tuneIn": "https://tunein.com/podcasts/WNYC-Podcasts/New-Yorker-Radio-Hour-p803804/",
"rss": "https://feeds.feedburner.com/newyorkerradiohour"
}
},
"the-sam-sanders-show": {
"id": "the-sam-sanders-show",
"title": "The Sam Sanders Show",
"info": "One of public radio's most dynamic voices, Sam Sanders helped launch The NPR Politics Podcast and hosted NPR's hit show It's Been A Minute. Now, the award-winning host returns with something brand new, The Sam Sanders Show. Every week, Sam Sanders and friends dig into the culture that shapes our lives: what's driving the biggest trends, how artists really think, and even the memes you can't stop scrolling past. Sam is beloved for his way of unpacking the world and bringing you up close to fresh currents and engaging conversations. The Sam Sanders Show is smart, funny and always a good time.",
"airtime": "FRI 12-1pm AND SAT 11am-12pm",
"imageSrc": "https://cdn.kqed.org/wp-content/uploads/2025/11/The-Sam-Sanders-Show-Podcast-Tile-400x400-1.jpg",
"officialWebsiteLink": "https://www.kcrw.com/shows/the-sam-sanders-show/latest",
"meta": {
"site": "arts",
"source": "KCRW"
},
"link": "https://www.kcrw.com/shows/the-sam-sanders-show/latest",
"subscribe": {
"rss": "https://feed.cdnstream1.com/zjb/feed/download/ac/28/59/ac28594c-e1d0-4231-8728-61865cdc80e8.xml"
}
},
"the-splendid-table": {
"id": "the-splendid-table",
"title": "The Splendid Table",
"info": "\u003cem>The Splendid Table\u003c/em> hosts our nation's conversations about cooking, sustainability and food culture.",
"imageSrc": "https://cdn.kqed.org/wp-content/uploads/2024/04/The-Splendid-Table-Podcast-Tile-360x360-1.jpg",
"officialWebsiteLink": "https://www.splendidtable.org/",
"airtime": "SUN 10-11 pm",
"meta": {
"site": "radio",
"source": "npr"
},
"link": "/radio/program/the-splendid-table"
},
"this-american-life": {
"id": "this-american-life",
"title": "This American Life",
"info": "This American Life is a weekly public radio show, heard by 2.2 million people on more than 500 stations. Another 2.5 million people download the weekly podcast. It is hosted by Ira Glass, produced in collaboration with Chicago Public Media, delivered to stations by PRX The Public Radio Exchange, and has won all of the major broadcasting awards.",
"airtime": "SAT 12pm-1pm, 7pm-8pm",
"imageSrc": "https://ww2.kqed.org/radio/wp-content/uploads/sites/50/2018/04/thisAmericanLife.png",
"officialWebsiteLink": "https://www.thisamericanlife.org/",
"meta": {
"site": "news",
"source": "wbez"
},
"link": "/radio/program/this-american-life",
"subscribe": {
"apple": "https://itunes.apple.com/WebObjects/MZStore.woa/wa/viewPodcast?s=143441&mt=2&id=201671138&at=11l79Y&ct=nprdirectory",
"rss": "https://www.thisamericanlife.org/podcast/rss.xml"
}
},
"tinydeskradio": {
"id": "tinydeskradio",
"title": "Tiny Desk Radio",
"info": "We're bringing the best of Tiny Desk to the airwaves, only on public radio.",
"airtime": "SUN 8pm and SAT 9pm",
"imageSrc": "https://cdn.kqed.org/wp-content/uploads/2025/04/300x300-For-Member-Station-Logo-Tiny-Desk-Radio-@2x.png",
"officialWebsiteLink": "https://www.npr.org/series/g-s1-52030/tiny-desk-radio",
"meta": {
"site": "news",
"source": "npr"
},
"link": "/radio/program/tinydeskradio",
"subscribe": {
"rss": "https://feeds.npr.org/g-s1-52030/rss.xml"
}
},
"wait-wait-dont-tell-me": {
"id": "wait-wait-dont-tell-me",
"title": "Wait Wait... Don't Tell Me!",
"info": "Peter Sagal and Bill Kurtis host the weekly NPR News quiz show alongside some of the best and brightest news and entertainment personalities.",
"airtime": "SUN 10am-11am, SAT 11am-12pm, SAT 6pm-7pm",
"imageSrc": "https://cdn.kqed.org/wp-content/uploads/2024/04/Wait-Wait-Podcast-Tile-300x300-1.jpg",
"officialWebsiteLink": "https://www.npr.org/programs/wait-wait-dont-tell-me/",
"meta": {
"site": "news",
"source": "npr"
},
"link": "/radio/program/wait-wait-dont-tell-me",
"subscribe": {
"npr": "https://rpb3r.app.goo.gl/Xogv",
"apple": "https://itunes.apple.com/WebObjects/MZStore.woa/wa/viewPodcast?s=143441&mt=2&id=121493804&at=11l79Y&ct=nprdirectory",
"tuneIn": "https://tunein.com/radio/Wait-Wait-Dont-Tell-Me-p46/",
"rss": "https://feeds.npr.org/344098539/podcast.xml"
}
},
"weekend-edition-saturday": {
"id": "weekend-edition-saturday",
"title": "Weekend Edition Saturday",
"info": "Weekend Edition Saturday wraps up the week's news and offers a mix of analysis and features on a wide range of topics, including arts, sports, entertainment, and human interest stories. The two-hour program is hosted by NPR's Peabody Award-winning Scott Simon.",
"airtime": "SAT 5am-10am",
"imageSrc": "https://cdn.kqed.org/wp-content/uploads/2024/04/Weekend-Edition-Podcast-Tile-360x360-1.jpg",
"officialWebsiteLink": "https://www.npr.org/programs/weekend-edition-saturday/",
"meta": {
"site": "news",
"source": "npr"
},
"link": "/radio/program/weekend-edition-saturday"
},
"weekend-edition-sunday": {
"id": "weekend-edition-sunday",
"title": "Weekend Edition Sunday",
"info": "Weekend Edition Sunday features interviews with newsmakers, artists, scientists, politicians, musicians, writers, theologians and historians. The program has covered news events from Nelson Mandela's 1990 release from a South African prison to the capture of Saddam Hussein.",
"airtime": "SUN 5am-10am",
"imageSrc": "https://cdn.kqed.org/wp-content/uploads/2024/04/Weekend-Edition-Podcast-Tile-360x360-1.jpg",
"officialWebsiteLink": "https://www.npr.org/programs/weekend-edition-sunday/",
"meta": {
"site": "news",
"source": "npr"
},
"link": "/radio/program/weekend-edition-sunday"
}
},
"racesReducer": {},
"racesGenElectionReducer": {},
"radioSchedulesReducer": {},
"listsReducer": {
"posts/lowdown?category=transportation": {
"isFetching": false,
"latestQuery": {
"from": 0,
"postsToRender": 9
},
"tag": null,
"vitalsOnly": true,
"totalRequested": 7,
"isLoading": false,
"isLoadingMore": true,
"total": {
"value": 7,
"relation": "eq"
},
"items": [
"lowdown_11327",
"lowdown_10492",
"lowdown_8366",
"lowdown_14507",
"lowdown_10976",
"lowdown_10104",
"lowdown_9833"
]
}
},
"recallGuideReducer": {
"intros": {},
"policy": {},
"candidates": {}
},
"savedArticleReducer": {
"articles": [],
"status": {}
},
"pfsSessionReducer": {},
"subscriptionsReducer": {},
"termsReducer": {
"about": {
"name": "About",
"type": "terms",
"id": "about",
"slug": "about",
"link": "/about",
"taxonomy": "site"
},
"arts": {
"name": "Arts & Culture",
"grouping": [
"arts",
"pop",
"trulyca"
],
"description": "KQED Arts provides daily in-depth coverage of the Bay Area's music, art, film, performing arts, literature and arts news, as well as cultural commentary and criticism.",
"type": "terms",
"id": "arts",
"slug": "arts",
"link": "/arts",
"taxonomy": "site"
},
"artschool": {
"name": "Art School",
"parent": "arts",
"type": "terms",
"id": "artschool",
"slug": "artschool",
"link": "/artschool",
"taxonomy": "site"
},
"bayareabites": {
"name": "KQED food",
"grouping": [
"food",
"bayareabites",
"checkplease"
],
"parent": "food",
"type": "terms",
"id": "bayareabites",
"slug": "bayareabites",
"link": "/food",
"taxonomy": "site"
},
"bayareahiphop": {
"name": "Bay Area Hiphop",
"type": "terms",
"id": "bayareahiphop",
"slug": "bayareahiphop",
"link": "/bayareahiphop",
"taxonomy": "site"
},
"campaign21": {
"name": "Campaign 21",
"type": "terms",
"id": "campaign21",
"slug": "campaign21",
"link": "/campaign21",
"taxonomy": "site"
},
"checkplease": {
"name": "KQED food",
"grouping": [
"food",
"bayareabites",
"checkplease"
],
"parent": "food",
"type": "terms",
"id": "checkplease",
"slug": "checkplease",
"link": "/food",
"taxonomy": "site"
},
"education": {
"name": "Education",
"grouping": [
"education"
],
"type": "terms",
"id": "education",
"slug": "education",
"link": "/education",
"taxonomy": "site"
},
"elections": {
"name": "Elections",
"type": "terms",
"id": "elections",
"slug": "elections",
"link": "/elections",
"taxonomy": "site"
},
"events": {
"name": "Events",
"type": "terms",
"id": "events",
"slug": "events",
"link": "/events",
"taxonomy": "site"
},
"event": {
"name": "Event",
"alias": "events",
"type": "terms",
"id": "event",
"slug": "event",
"link": "/event",
"taxonomy": "site"
},
"filmschoolshorts": {
"name": "Film School Shorts",
"type": "terms",
"id": "filmschoolshorts",
"slug": "filmschoolshorts",
"link": "/filmschoolshorts",
"taxonomy": "site"
},
"food": {
"name": "KQED food",
"grouping": [
"food",
"bayareabites",
"checkplease"
],
"type": "terms",
"id": "food",
"slug": "food",
"link": "/food",
"taxonomy": "site"
},
"forum": {
"name": "Forum",
"relatedContentQuery": "posts/forum?",
"parent": "news",
"type": "terms",
"id": "forum",
"slug": "forum",
"link": "/forum",
"taxonomy": "site"
},
"futureofyou": {
"name": "Future of You",
"grouping": [
"science",
"futureofyou"
],
"parent": "science",
"type": "terms",
"id": "futureofyou",
"slug": "futureofyou",
"link": "/futureofyou",
"taxonomy": "site"
},
"jpepinheart": {
"name": "KQED food",
"relatedContentQuery": "posts/food,bayareabites,checkplease",
"parent": "food",
"type": "terms",
"id": "jpepinheart",
"slug": "jpepinheart",
"link": "/food",
"taxonomy": "site"
},
"liveblog": {
"name": "Live Blog",
"type": "terms",
"id": "liveblog",
"slug": "liveblog",
"link": "/liveblog",
"taxonomy": "site"
},
"livetv": {
"name": "Live TV",
"parent": "tv",
"type": "terms",
"id": "livetv",
"slug": "livetv",
"link": "/livetv",
"taxonomy": "site"
},
"lowdown": {
"name": "The Lowdown",
"relatedContentQuery": "posts/lowdown?",
"parent": "news",
"type": "terms",
"id": "lowdown",
"slug": "lowdown",
"link": "/lowdown",
"taxonomy": "site"
},
"mindshift": {
"name": "Mindshift",
"parent": "news",
"description": "MindShift explores the future of education by highlighting the innovative – and sometimes counterintuitive – ways educators and parents are helping all children succeed.",
"type": "terms",
"id": "mindshift",
"slug": "mindshift",
"link": "/mindshift",
"taxonomy": "site"
},
"news": {
"name": "News",
"grouping": [
"news",
"forum"
],
"type": "terms",
"id": "news",
"slug": "news",
"link": "/news",
"taxonomy": "site"
},
"perspectives": {
"name": "Perspectives",
"parent": "radio",
"type": "terms",
"id": "perspectives",
"slug": "perspectives",
"link": "/perspectives",
"taxonomy": "site"
},
"podcasts": {
"name": "Podcasts",
"type": "terms",
"id": "podcasts",
"slug": "podcasts",
"link": "/podcasts",
"taxonomy": "site"
},
"pop": {
"name": "Pop",
"parent": "arts",
"type": "terms",
"id": "pop",
"slug": "pop",
"link": "/pop",
"taxonomy": "site"
},
"pressroom": {
"name": "Pressroom",
"type": "terms",
"id": "pressroom",
"slug": "pressroom",
"link": "/pressroom",
"taxonomy": "site"
},
"quest": {
"name": "Quest",
"parent": "science",
"type": "terms",
"id": "quest",
"slug": "quest",
"link": "/quest",
"taxonomy": "site"
},
"radio": {
"name": "Radio",
"grouping": [
"forum",
"perspectives"
],
"description": "Listen to KQED Public Radio – home of Forum and The California Report – on 88.5 FM in San Francisco, 89.3 FM in Sacramento, 88.3 FM in Santa Rosa and 88.1 FM in Martinez.",
"type": "terms",
"id": "radio",
"slug": "radio",
"link": "/radio",
"taxonomy": "site"
},
"root": {
"name": "KQED",
"image": "https://ww2.kqed.org/app/uploads/2020/02/KQED-OG-Image@1x.png",
"imageWidth": 1200,
"imageHeight": 630,
"headData": {
"title": "KQED | News, Radio, Podcasts, TV | Public Media for Northern California",
"description": "KQED provides public radio, television, and independent reporting on issues that matter to the Bay Area. We’re the NPR and PBS member station for Northern California."
},
"type": "terms",
"id": "root",
"slug": "root",
"link": "/root",
"taxonomy": "site"
},
"science": {
"name": "Science",
"grouping": [
"science",
"futureofyou"
],
"description": "KQED Science brings you award-winning science and environment coverage from the Bay Area and beyond.",
"type": "terms",
"id": "science",
"slug": "science",
"link": "/science",
"taxonomy": "site"
},
"stateofhealth": {
"name": "State of Health",
"parent": "science",
"type": "terms",
"id": "stateofhealth",
"slug": "stateofhealth",
"link": "/stateofhealth",
"taxonomy": "site"
},
"support": {
"name": "Support",
"type": "terms",
"id": "support",
"slug": "support",
"link": "/support",
"taxonomy": "site"
},
"thedolist": {
"name": "The Do List",
"parent": "arts",
"type": "terms",
"id": "thedolist",
"slug": "thedolist",
"link": "/thedolist",
"taxonomy": "site"
},
"trulyca": {
"name": "Truly CA",
"grouping": [
"arts",
"pop",
"trulyca"
],
"parent": "arts",
"type": "terms",
"id": "trulyca",
"slug": "trulyca",
"link": "/trulyca",
"taxonomy": "site"
},
"tv": {
"name": "TV",
"type": "terms",
"id": "tv",
"slug": "tv",
"link": "/tv",
"taxonomy": "site"
},
"voterguide": {
"name": "Voter Guide",
"parent": "elections",
"alias": "elections",
"type": "terms",
"id": "voterguide",
"slug": "voterguide",
"link": "/voterguide",
"taxonomy": "site"
},
"guiaelectoral": {
"name": "Guia Electoral",
"parent": "elections",
"alias": "elections",
"type": "terms",
"id": "guiaelectoral",
"slug": "guiaelectoral",
"link": "/guiaelectoral",
"taxonomy": "site"
},
"lowdown_566": {
"type": "terms",
"id": "lowdown_566",
"meta": {
"index": "terms_1716263798",
"site": "lowdown",
"id": "566",
"found": true
},
"relationships": {},
"featImg": null,
"name": "CA Transportation",
"description": "How we get around",
"taxonomy": "category",
"headData": {
"twImgId": null,
"twTitle": null,
"ogTitle": null,
"ogImgId": null,
"twDescription": null,
"description": "How we get around",
"title": "CA Transportation Archives | KQED Arts",
"ogDescription": null,
"imageData": {
"ogImageSize": {
"file": "https://cdn.kqed.org/wp-content/uploads/2020/02/KQED-OG-Image@1x.png",
"width": 1200,
"height": 630
},
"twImageSize": {
"file": "https://cdn.kqed.org/wp-content/uploads/2020/02/KQED-OG-Image@1x.png"
},
"twitterCard": "summary_large_image"
}
},
"ttid": 571,
"slug": "transportation",
"isLoading": false,
"link": "/lowdown/category/transportation"
},
"lowdown_391": {
"type": "terms",
"id": "lowdown_391",
"meta": {
"index": "terms_1716263798",
"site": "lowdown",
"id": "391",
"found": true
},
"relationships": {},
"featImg": null,
"name": "By the Numbers",
"description": "Interactive charts and videos explaining the math of news",
"taxonomy": "category",
"headData": {
"twImgId": null,
"twTitle": null,
"ogTitle": null,
"ogImgId": null,
"twDescription": null,
"description": "Interactive charts and videos explaining the math of news",
"title": "By the Numbers Archives | KQED Arts",
"ogDescription": null
},
"ttid": 394,
"slug": "math-assets",
"isLoading": false,
"link": "/lowdown/category/math-assets"
},
"lowdown_457": {
"type": "terms",
"id": "lowdown_457",
"meta": {
"index": "terms_1716263798",
"site": "lowdown",
"id": "457",
"found": true
},
"relationships": {},
"featImg": null,
"name": "Multimedia",
"description": "A collection of original and featured multimedia resources ",
"taxonomy": "category",
"headData": {
"twImgId": null,
"twTitle": null,
"ogTitle": null,
"ogImgId": null,
"twDescription": null,
"description": "A collection of original and featured multimedia resources",
"title": "Multimedia Archives | KQED Arts",
"ogDescription": null
},
"ttid": 462,
"slug": "multimedia",
"isLoading": false,
"link": "/lowdown/category/multimedia"
},
"lowdown_243": {
"type": "terms",
"id": "lowdown_243",
"meta": {
"index": "terms_1716263798",
"site": "lowdown",
"id": "243",
"found": true
},
"relationships": {},
"featImg": null,
"name": "Timelines & Visualizations",
"description": "Includes multimedia timelines, Prezis, and additional exploratory presentation formats",
"taxonomy": "category",
"headData": {
"twImgId": null,
"twTitle": null,
"ogTitle": null,
"ogImgId": null,
"twDescription": null,
"description": "Includes multimedia timelines, Prezis, and additional exploratory presentation formats",
"title": "Timelines & Visualizations Archives | KQED Arts",
"ogDescription": null
},
"ttid": 245,
"slug": "multimedia-presentations",
"isLoading": false,
"link": "/lowdown/category/multimedia-presentations"
},
"lowdown_2337": {
"type": "terms",
"id": "lowdown_2337",
"meta": {
"index": "terms_1716263798",
"site": "lowdown",
"id": "2337",
"found": true
},
"relationships": {},
"featImg": null,
"name": "featured",
"description": null,
"taxonomy": "tag",
"headData": {
"twImgId": null,
"twTitle": null,
"ogTitle": null,
"ogImgId": null,
"twDescription": null,
"description": null,
"title": "featured Archives | KQED Arts",
"ogDescription": null
},
"ttid": 2349,
"slug": "featured",
"isLoading": false,
"link": "/lowdown/tag/featured"
},
"lowdown_238": {
"type": "terms",
"id": "lowdown_238",
"meta": {
"index": "terms_1716263798",
"site": "lowdown",
"id": "238",
"found": true
},
"relationships": {},
"featImg": null,
"name": "population",
"description": null,
"taxonomy": "tag",
"headData": {
"twImgId": null,
"twTitle": null,
"ogTitle": null,
"ogImgId": null,
"twDescription": null,
"description": null,
"title": "population Archives | KQED Arts",
"ogDescription": null
},
"ttid": 240,
"slug": "population",
"isLoading": false,
"link": "/lowdown/tag/population"
},
"lowdown_346": {
"type": "terms",
"id": "lowdown_346",
"meta": {
"index": "terms_1716263798",
"site": "lowdown",
"id": "346",
"found": true
},
"relationships": {},
"featImg": null,
"name": "San Francisco",
"description": null,
"taxonomy": "tag",
"headData": {
"twImgId": null,
"twTitle": null,
"ogTitle": null,
"ogImgId": null,
"twDescription": null,
"description": null,
"title": "San Francisco Archives | KQED Arts",
"ogDescription": null
},
"ttid": 349,
"slug": "san-francisco",
"isLoading": false,
"link": "/lowdown/tag/san-francisco"
},
"lowdown_1": {
"type": "terms",
"id": "lowdown_1",
"meta": {
"index": "terms_1716263798",
"site": "lowdown",
"id": "1",
"found": true
},
"relationships": {},
"featImg": null,
"name": "Lowdown",
"description": null,
"taxonomy": "category",
"headData": {
"twImgId": null,
"twTitle": null,
"ogTitle": null,
"ogImgId": null,
"twDescription": null,
"description": null,
"title": "Lowdown Archives | KQED Arts",
"ogDescription": null
},
"ttid": 1,
"slug": "lowdown",
"isLoading": false,
"link": "/lowdown/category/lowdown"
},
"lowdown_2408": {
"type": "terms",
"id": "lowdown_2408",
"meta": {
"index": "terms_1716263798",
"site": "lowdown",
"id": "2408",
"found": true
},
"relationships": {},
"featImg": null,
"name": "Transportation & Traffic",
"description": "How we get around.",
"taxonomy": "category",
"headData": {
"twImgId": null,
"twTitle": null,
"ogTitle": null,
"ogImgId": null,
"twDescription": null,
"description": "How we get around.",
"title": "Transportation & Traffic Archives | KQED Arts",
"ogDescription": null
},
"ttid": 2418,
"slug": "traffic",
"isLoading": false,
"link": "/lowdown/category/traffic"
},
"lowdown_423": {
"type": "terms",
"id": "lowdown_423",
"meta": {
"index": "terms_1716263798",
"site": "lowdown",
"id": "423",
"found": true
},
"relationships": {},
"featImg": null,
"name": "congestion",
"description": null,
"taxonomy": "tag",
"headData": {
"twImgId": null,
"twTitle": null,
"ogTitle": null,
"ogImgId": null,
"twDescription": null,
"description": null,
"title": "congestion Archives | KQED Arts",
"ogDescription": null
},
"ttid": 426,
"slug": "congestion",
"isLoading": false,
"link": "/lowdown/tag/congestion"
},
"lowdown_422": {
"type": "terms",
"id": "lowdown_422",
"meta": {
"index": "terms_1716263798",
"site": "lowdown",
"id": "422",
"found": true
},
"relationships": {},
"featImg": null,
"name": "traffic",
"description": null,
"taxonomy": "tag",
"headData": {
"twImgId": null,
"twTitle": null,
"ogTitle": null,
"ogImgId": null,
"twDescription": null,
"description": null,
"title": "traffic Archives | KQED Arts",
"ogDescription": null
},
"ttid": 425,
"slug": "traffic",
"isLoading": false,
"link": "/lowdown/tag/traffic"
},
"lowdown_424": {
"type": "terms",
"id": "lowdown_424",
"meta": {
"index": "terms_1716263798",
"site": "lowdown",
"id": "424",
"found": true
},
"relationships": {},
"featImg": null,
"name": "traffic waves",
"description": null,
"taxonomy": "tag",
"headData": {
"twImgId": null,
"twTitle": null,
"ogTitle": null,
"ogImgId": null,
"twDescription": null,
"description": null,
"title": "traffic waves Archives | KQED Arts",
"ogDescription": null
},
"ttid": 427,
"slug": "traffic-waves",
"isLoading": false,
"link": "/lowdown/tag/traffic-waves"
},
"lowdown_375": {
"type": "terms",
"id": "lowdown_375",
"meta": {
"index": "terms_1716263798",
"site": "lowdown",
"id": "375",
"found": true
},
"relationships": {},
"featImg": null,
"name": "BART",
"description": null,
"taxonomy": "tag",
"headData": {
"twImgId": null,
"twTitle": null,
"ogTitle": null,
"ogImgId": null,
"twDescription": null,
"description": null,
"title": "BART Archives | KQED Arts",
"ogDescription": null
},
"ttid": 378,
"slug": "bart",
"isLoading": false,
"link": "/lowdown/tag/bart"
},
"lowdown_242": {
"type": "terms",
"id": "lowdown_242",
"meta": {
"index": "terms_1716263798",
"site": "lowdown",
"id": "242",
"found": true
},
"relationships": {},
"featImg": null,
"name": "Interactive Maps",
"description": "Interactive maps ",
"taxonomy": "category",
"headData": {
"twImgId": null,
"twTitle": null,
"ogTitle": null,
"ogImgId": null,
"twDescription": null,
"description": "Interactive maps",
"title": "Interactive Maps Archives | KQED Arts",
"ogDescription": null
},
"ttid": 244,
"slug": "maps",
"isLoading": false,
"link": "/lowdown/category/maps"
},
"lowdown_567": {
"type": "terms",
"id": "lowdown_567",
"meta": {
"index": "terms_1716263798",
"site": "lowdown",
"id": "567",
"found": true
},
"relationships": {},
"featImg": null,
"name": "High-Speed Rail",
"description": null,
"taxonomy": "tag",
"headData": {
"twImgId": null,
"twTitle": null,
"ogTitle": null,
"ogImgId": null,
"twDescription": null,
"description": null,
"title": "High-Speed Rail Archives | KQED Arts",
"ogDescription": null
},
"ttid": 572,
"slug": "high-speed-rail",
"isLoading": false,
"link": "/lowdown/tag/high-speed-rail"
},
"lowdown_96": {
"type": "terms",
"id": "lowdown_96",
"meta": {
"index": "terms_1716263798",
"site": "lowdown",
"id": "96",
"found": true
},
"relationships": {},
"featImg": null,
"name": "state parks",
"description": null,
"taxonomy": "tag",
"headData": {
"twImgId": null,
"twTitle": null,
"ogTitle": null,
"ogImgId": null,
"twDescription": null,
"description": null,
"title": "state parks Archives | KQED Arts",
"ogDescription": null
},
"ttid": 97,
"slug": "state-parks",
"isLoading": false,
"link": "/lowdown/tag/state-parks"
},
"lowdown_440": {
"type": "terms",
"id": "lowdown_440",
"meta": {
"index": "terms_1716263798",
"site": "lowdown",
"id": "440",
"found": true
},
"relationships": {},
"featImg": null,
"name": "fuel efficiency",
"description": null,
"taxonomy": "tag",
"headData": {
"twImgId": null,
"twTitle": null,
"ogTitle": null,
"ogImgId": null,
"twDescription": null,
"description": null,
"title": "fuel efficiency Archives | KQED Arts",
"ogDescription": null
},
"ttid": 443,
"slug": "fuel-efficiency",
"isLoading": false,
"link": "/lowdown/tag/fuel-efficiency"
},
"lowdown_442": {
"type": "terms",
"id": "lowdown_442",
"meta": {
"index": "terms_1716263798",
"site": "lowdown",
"id": "442",
"found": true
},
"relationships": {},
"featImg": null,
"name": "gas",
"description": null,
"taxonomy": "tag",
"headData": {
"twImgId": null,
"twTitle": null,
"ogTitle": null,
"ogImgId": null,
"twDescription": null,
"description": null,
"title": "gas Archives | KQED Arts",
"ogDescription": null
},
"ttid": 445,
"slug": "gas",
"isLoading": false,
"link": "/lowdown/tag/gas"
},
"lowdown_441": {
"type": "terms",
"id": "lowdown_441",
"meta": {
"index": "terms_1716263798",
"site": "lowdown",
"id": "441",
"found": true
},
"relationships": {},
"featImg": null,
"name": "MPG",
"description": null,
"taxonomy": "tag",
"headData": {
"twImgId": null,
"twTitle": null,
"ogTitle": null,
"ogImgId": null,
"twDescription": null,
"description": null,
"title": "MPG Archives | KQED Arts",
"ogDescription": null
},
"ttid": 444,
"slug": "mpg",
"isLoading": false,
"link": "/lowdown/tag/mpg"
},
"lowdown_416": {
"type": "terms",
"id": "lowdown_416",
"meta": {
"index": "terms_1716263798",
"site": "lowdown",
"id": "416",
"found": true
},
"relationships": {},
"featImg": null,
"name": "BART pay",
"description": null,
"taxonomy": "tag",
"headData": {
"twImgId": null,
"twTitle": null,
"ogTitle": null,
"ogImgId": null,
"twDescription": null,
"description": null,
"title": "BART pay Archives | KQED Arts",
"ogDescription": null
},
"ttid": 419,
"slug": "bart-pay",
"isLoading": false,
"link": "/lowdown/tag/bart-pay"
},
"lowdown_376": {
"type": "terms",
"id": "lowdown_376",
"meta": {
"index": "terms_1716263798",
"site": "lowdown",
"id": "376",
"found": true
},
"relationships": {},
"featImg": null,
"name": "strike",
"description": null,
"taxonomy": "tag",
"headData": {
"twImgId": null,
"twTitle": null,
"ogTitle": null,
"ogImgId": null,
"twDescription": null,
"description": null,
"title": "strike Archives | KQED Arts",
"ogDescription": null
},
"ttid": 379,
"slug": "strike",
"isLoading": false,
"link": "/lowdown/tag/strike"
},
"lowdown_451": {
"type": "terms",
"id": "lowdown_451",
"meta": {
"index": "terms_1716263798",
"site": "lowdown",
"id": "451",
"found": true
},
"relationships": {},
"featImg": null,
"name": "Income Inequality",
"description": "Opportunity, inequality and the struggle to make a buck",
"taxonomy": "category",
"headData": {
"twImgId": null,
"twTitle": null,
"ogTitle": null,
"ogImgId": null,
"twDescription": null,
"description": "Opportunity, inequality and the struggle to make a buck",
"title": "Income Inequality Archives | KQED Arts",
"ogDescription": null
},
"ttid": 454,
"slug": "wealth-and-poverty",
"isLoading": false,
"link": "/lowdown/category/wealth-and-poverty"
},
"lowdown_308": {
"type": "terms",
"id": "lowdown_308",
"meta": {
"index": "terms_1716263798",
"site": "lowdown",
"id": "308",
"found": true
},
"relationships": {},
"featImg": null,
"name": "bay area",
"description": null,
"taxonomy": "tag",
"headData": {
"twImgId": null,
"twTitle": null,
"ogTitle": null,
"ogImgId": null,
"twDescription": null,
"description": null,
"title": "bay area Archives | KQED Arts",
"ogDescription": null
},
"ttid": 311,
"slug": "bay-area",
"isLoading": false,
"link": "/lowdown/tag/bay-area"
},
"lowdown_276": {
"type": "terms",
"id": "lowdown_276",
"meta": {
"index": "terms_1716263798",
"site": "lowdown",
"id": "276",
"found": true
},
"relationships": {},
"featImg": null,
"name": "income inequality",
"description": null,
"taxonomy": "tag",
"headData": {
"twImgId": null,
"twTitle": null,
"ogTitle": null,
"ogImgId": null,
"twDescription": null,
"description": null,
"title": "income inequality Archives | KQED Arts",
"ogDescription": null
},
"ttid": 278,
"slug": "income-inequality",
"isLoading": false,
"link": "/lowdown/tag/income-inequality"
},
"lowdown_415": {
"type": "terms",
"id": "lowdown_415",
"meta": {
"index": "terms_1716263798",
"site": "lowdown",
"id": "415",
"found": true
},
"relationships": {},
"featImg": null,
"name": "transit",
"description": null,
"taxonomy": "tag",
"headData": {
"twImgId": null,
"twTitle": null,
"ogTitle": null,
"ogImgId": null,
"twDescription": null,
"description": null,
"title": "transit Archives | KQED Arts",
"ogDescription": null
},
"ttid": 418,
"slug": "transit",
"isLoading": false,
"link": "/lowdown/tag/transit"
}
},
"userAgentReducer": {
"userAgent": "Mozilla/5.0 AppleWebKit/537.36 (KHTML, like Gecko; compatible; ClaudeBot/1.0; +claudebot@anthropic.com)",
"isBot": true
},
"userPermissionsReducer": {
"wpLoggedIn": false
},
"localStorageReducer": {},
"browserHistoryReducer": [],
"eventsReducer": {},
"fssReducer": {},
"tvDailyScheduleReducer": {},
"tvWeeklyScheduleReducer": {},
"tvPrimetimeScheduleReducer": {},
"tvMonthlyScheduleReducer": {},
"userAccountReducer": {
"user": {
"email": null,
"emailStatus": "EMAIL_UNVALIDATED",
"loggedStatus": "LOGGED_OUT",
"loggingChecked": false,
"articles": [],
"firstName": null,
"lastName": null,
"phoneNumber": null,
"fetchingMembership": false,
"membershipError": false,
"memberships": [
{
"id": null,
"startDate": null,
"firstName": null,
"lastName": null,
"familyNumber": null,
"memberNumber": null,
"memberSince": null,
"expirationDate": null,
"pfsEligible": false,
"isSustaining": false,
"membershipLevel": "Prospect",
"membershipStatus": "Non Member",
"lastGiftDate": null,
"renewalDate": null,
"lastDonationAmount": null
}
]
},
"authModal": {
"isOpen": false,
"view": "LANDING_VIEW"
},
"error": null
},
"youthMediaReducer": {},
"checkPleaseReducer": {
"filterData": {
"region": {
"key": "Restaurant Region",
"filters": [
"Any Region"
]
},
"cuisine": {
"key": "Restaurant Cuisine",
"filters": [
"Any Cuisine"
]
}
},
"restaurantDataById": {},
"restaurantIdsSorted": [],
"error": null
},
"location": {
"pathname": "/lowdown/category/transportation",
"previousPathname": "/"
}
}