Charts and infographics illustrating key statistics
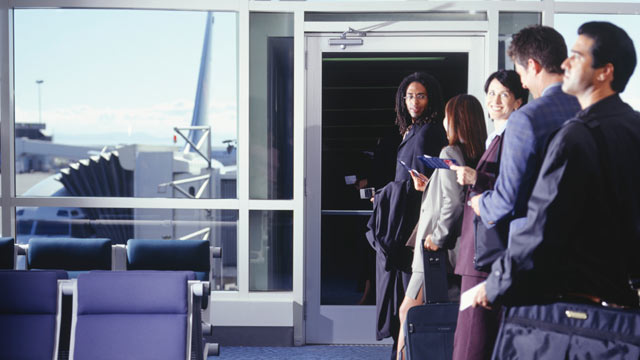
Looking for the Fastest Way to Board a Plane? Go Ask An Astrophysicist
Burned Out: Why Western Wildfires Have Gotten Bigger, Meaner and Harder to Control
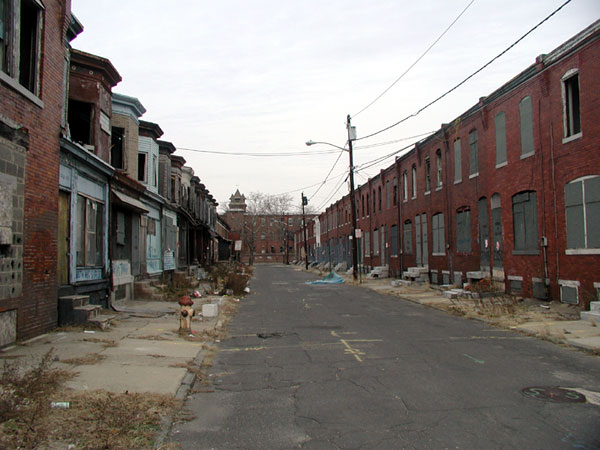
How Many Americans Live in Poverty, and What Does That Actually Mean? (with Lesson Plan)
MAP: It's Equal Pay Day! How Big Is the Gender Wage Gap Where You Live?
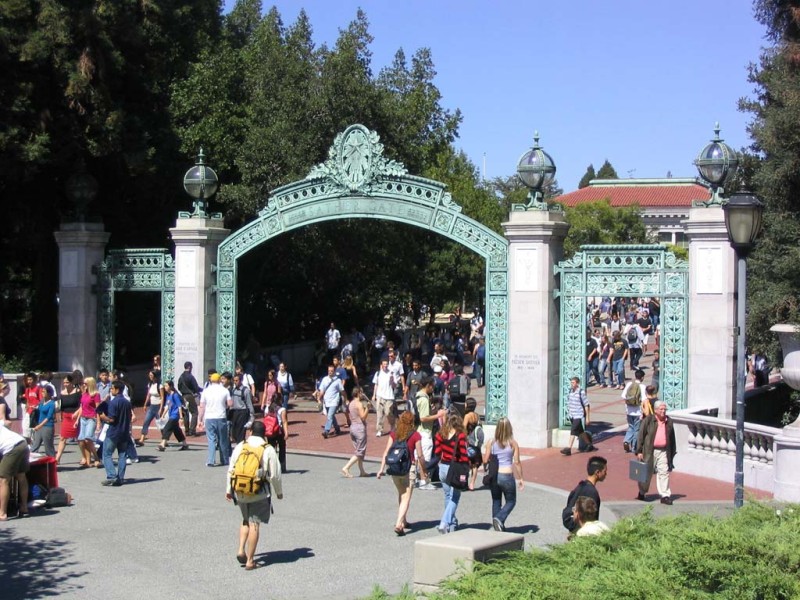
INTERACTIVE: The Rising Cost of California's Public Universities
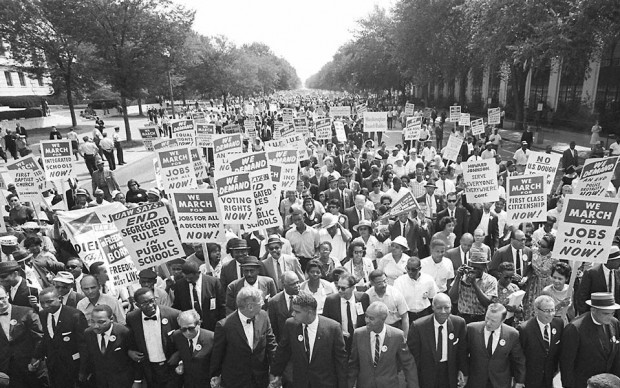
Unfinished Business: Would Martin Luther King Be Satisfied with the Pace of Progress?
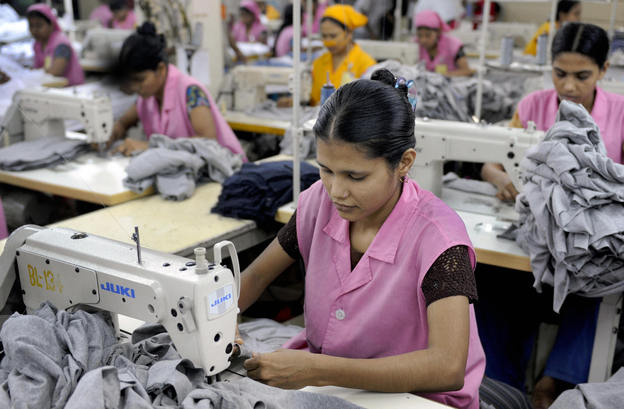
The High Cost of Cheap Fashion (with Lesson Plan)
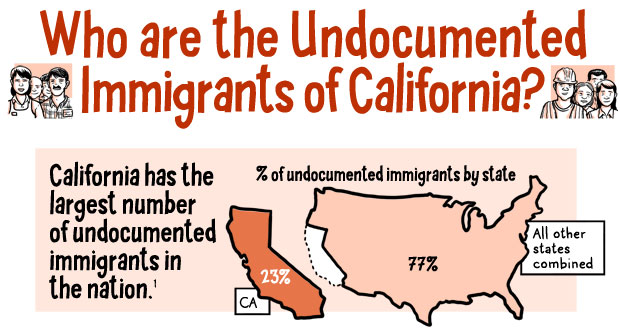
Who Are California's Undocumented Immigrants? A Cartoon Explainer
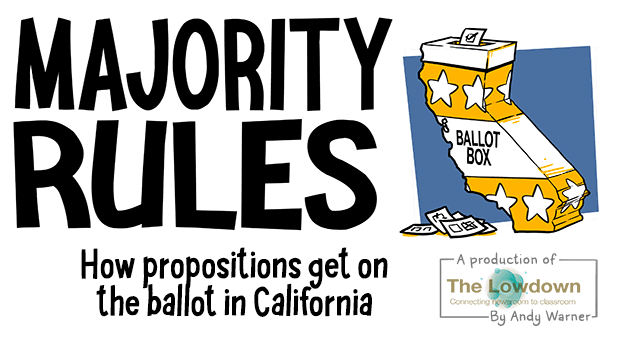
Majority Rules: California's Proposition Process Explained
Sponsored
Player sponsored by
window.__IS_SSR__=true
window.__INITIAL_STATE__={
"attachmentsReducer": {
"audio_0": {
"type": "attachments",
"id": "audio_0",
"imgSizes": {
"kqedFullSize": {
"file": "https://ww2.kqed.org/news/wp-content/themes/KQED-unified/img/audio_bgs/background0.jpg"
}
}
},
"audio_1": {
"type": "attachments",
"id": "audio_1",
"imgSizes": {
"kqedFullSize": {
"file": "https://ww2.kqed.org/news/wp-content/themes/KQED-unified/img/audio_bgs/background1.jpg"
}
}
},
"audio_2": {
"type": "attachments",
"id": "audio_2",
"imgSizes": {
"kqedFullSize": {
"file": "https://ww2.kqed.org/news/wp-content/themes/KQED-unified/img/audio_bgs/background2.jpg"
}
}
},
"audio_3": {
"type": "attachments",
"id": "audio_3",
"imgSizes": {
"kqedFullSize": {
"file": "https://ww2.kqed.org/news/wp-content/themes/KQED-unified/img/audio_bgs/background3.jpg"
}
}
},
"audio_4": {
"type": "attachments",
"id": "audio_4",
"imgSizes": {
"kqedFullSize": {
"file": "https://ww2.kqed.org/news/wp-content/themes/KQED-unified/img/audio_bgs/background4.jpg"
}
}
},
"placeholder": {
"type": "attachments",
"id": "placeholder",
"imgSizes": {
"thumbnail": {
"file": "https://cdn.kqed.org/wp-content/uploads/2024/12/KQED-Default-Image-816638274-2000x1333-1-160x107.jpg",
"width": 160,
"height": 107,
"mimeType": "image/jpeg"
},
"medium": {
"file": "https://cdn.kqed.org/wp-content/uploads/2024/12/KQED-Default-Image-816638274-2000x1333-1-800x533.jpg",
"width": 800,
"height": 533,
"mimeType": "image/jpeg"
},
"medium_large": {
"file": "https://cdn.kqed.org/wp-content/uploads/2024/12/KQED-Default-Image-816638274-2000x1333-1-768x512.jpg",
"width": 768,
"height": 512,
"mimeType": "image/jpeg"
},
"large": {
"file": "https://cdn.kqed.org/wp-content/uploads/2024/12/KQED-Default-Image-816638274-2000x1333-1-1020x680.jpg",
"width": 1020,
"height": 680,
"mimeType": "image/jpeg"
},
"1536x1536": {
"file": "https://cdn.kqed.org/wp-content/uploads/2024/12/KQED-Default-Image-816638274-2000x1333-1-1536x1024.jpg",
"width": 1536,
"height": 1024,
"mimeType": "image/jpeg"
},
"fd-lrg": {
"file": "https://cdn.kqed.org/wp-content/uploads/2024/12/KQED-Default-Image-816638274-2000x1333-1-1536x1024.jpg",
"width": 1536,
"height": 1024,
"mimeType": "image/jpeg"
},
"fd-med": {
"file": "https://cdn.kqed.org/wp-content/uploads/2024/12/KQED-Default-Image-816638274-2000x1333-1-1020x680.jpg",
"width": 1020,
"height": 680,
"mimeType": "image/jpeg"
},
"fd-sm": {
"file": "https://cdn.kqed.org/wp-content/uploads/2024/12/KQED-Default-Image-816638274-2000x1333-1-800x533.jpg",
"width": 800,
"height": 533,
"mimeType": "image/jpeg"
},
"post-thumbnail": {
"file": "https://cdn.kqed.org/wp-content/uploads/2024/12/KQED-Default-Image-816638274-2000x1333-1-672x372.jpg",
"width": 672,
"height": 372,
"mimeType": "image/jpeg"
},
"twentyfourteen-full-width": {
"file": "https://cdn.kqed.org/wp-content/uploads/2024/12/KQED-Default-Image-816638274-2000x1333-1-1038x576.jpg",
"width": 1038,
"height": 576,
"mimeType": "image/jpeg"
},
"xxsmall": {
"file": "https://cdn.kqed.org/wp-content/uploads/2024/12/KQED-Default-Image-816638274-2000x1333-1-160x107.jpg",
"width": 160,
"height": 107,
"mimeType": "image/jpeg"
},
"xsmall": {
"file": "https://cdn.kqed.org/wp-content/uploads/2024/12/KQED-Default-Image-816638274-2000x1333-1-672x372.jpg",
"width": 672,
"height": 372,
"mimeType": "image/jpeg"
},
"small": {
"file": "https://cdn.kqed.org/wp-content/uploads/2024/12/KQED-Default-Image-816638274-2000x1333-1-672x372.jpg",
"width": 672,
"height": 372,
"mimeType": "image/jpeg"
},
"xlarge": {
"file": "https://cdn.kqed.org/wp-content/uploads/2024/12/KQED-Default-Image-816638274-2000x1333-1-1020x680.jpg",
"width": 1020,
"height": 680,
"mimeType": "image/jpeg"
},
"full-width": {
"file": "https://cdn.kqed.org/wp-content/uploads/2024/12/KQED-Default-Image-816638274-2000x1333-1-1920x1280.jpg",
"width": 1920,
"height": 1280,
"mimeType": "image/jpeg"
},
"guest-author-32": {
"file": "https://cdn.kqed.org/wp-content/uploads/2025/01/KQED-Default-Image-816638274-1333x1333-1-160x160.jpg",
"width": 32,
"height": 32,
"mimeType": "image/jpeg"
},
"guest-author-50": {
"file": "https://cdn.kqed.org/wp-content/uploads/2025/01/KQED-Default-Image-816638274-1333x1333-1-160x160.jpg",
"width": 50,
"height": 50,
"mimeType": "image/jpeg"
},
"guest-author-64": {
"file": "https://cdn.kqed.org/wp-content/uploads/2025/01/KQED-Default-Image-816638274-1333x1333-1-160x160.jpg",
"width": 64,
"height": 64,
"mimeType": "image/jpeg"
},
"guest-author-96": {
"file": "https://cdn.kqed.org/wp-content/uploads/2025/01/KQED-Default-Image-816638274-1333x1333-1-160x160.jpg",
"width": 96,
"height": 96,
"mimeType": "image/jpeg"
},
"guest-author-128": {
"file": "https://cdn.kqed.org/wp-content/uploads/2025/01/KQED-Default-Image-816638274-1333x1333-1-160x160.jpg",
"width": 128,
"height": 128,
"mimeType": "image/jpeg"
},
"detail": {
"file": "https://cdn.kqed.org/wp-content/uploads/2025/01/KQED-Default-Image-816638274-1333x1333-1-160x160.jpg",
"width": 160,
"height": 160,
"mimeType": "image/jpeg"
},
"kqedFullSize": {
"file": "https://cdn.kqed.org/wp-content/uploads/2024/12/KQED-Default-Image-816638274-2000x1333-1.jpg",
"width": 2000,
"height": 1333
}
}
},
"lowdown_15446": {
"type": "attachments",
"id": "lowdown_15446",
"meta": {
"index": "attachments_1716263798",
"site": "lowdown",
"id": "15446",
"found": true
},
"parent": 15427,
"imgSizes": {
"thumbnail": {
"file": "https://ww2.kqed.org/app/uploads/sites/26/2015/01/gty_boarding_airplane_mi_130319_wmain-400x225.jpg",
"width": 400,
"mimeType": "image/jpeg",
"height": 225
},
"fd-sm": {
"file": "https://ww2.kqed.org/app/uploads/sites/26/2015/01/gty_boarding_airplane_mi_130319_wmain-320x180.jpg",
"width": 320,
"mimeType": "image/jpeg",
"height": 180
},
"kqedFullSize": {
"file": "https://ww2.kqed.org/app/uploads/sites/26/2015/01/gty_boarding_airplane_mi_130319_wmain.jpg",
"width": 640,
"height": 360
},
"guest-author-96": {
"file": "https://ww2.kqed.org/app/uploads/sites/26/2015/01/gty_boarding_airplane_mi_130319_wmain-96x96.jpg",
"width": 96,
"mimeType": "image/jpeg",
"height": 96
},
"guest-author-64": {
"file": "https://ww2.kqed.org/app/uploads/sites/26/2015/01/gty_boarding_airplane_mi_130319_wmain-64x64.jpg",
"width": 64,
"mimeType": "image/jpeg",
"height": 64
},
"detail": {
"file": "https://ww2.kqed.org/app/uploads/sites/26/2015/01/gty_boarding_airplane_mi_130319_wmain-75x75.jpg",
"width": 75,
"mimeType": "image/jpeg",
"height": 75
},
"guest-author-32": {
"file": "https://ww2.kqed.org/app/uploads/sites/26/2015/01/gty_boarding_airplane_mi_130319_wmain-32x32.jpg",
"width": 32,
"mimeType": "image/jpeg",
"height": 32
},
"guest-author-128": {
"file": "https://ww2.kqed.org/app/uploads/sites/26/2015/01/gty_boarding_airplane_mi_130319_wmain-128x128.jpg",
"width": 128,
"mimeType": "image/jpeg",
"height": 128
}
},
"publishDate": 1420514390,
"modified": 1420514390,
"caption": null,
"description": null,
"title": "gty_boarding_airplane_mi_130319_wmain",
"credit": null,
"status": "inherit",
"fetchFailed": false,
"isLoading": false
},
"lowdown_13989": {
"type": "attachments",
"id": "lowdown_13989",
"meta": {
"index": "attachments_1716263798",
"site": "lowdown",
"id": "13989",
"found": true
},
"parent": 13974,
"imgSizes": {
"thumbnail": {
"file": "https://ww2.kqed.org/app/uploads/sites/26/2014/09/Wildfires_slice1-e1432168220748-400x190.jpg",
"width": 400,
"mimeType": "image/jpeg",
"height": 190
},
"fd-sm": {
"file": "https://ww2.kqed.org/app/uploads/sites/26/2014/09/Wildfires_slice1-320x260.jpg",
"width": 320,
"mimeType": "image/jpeg",
"height": 260
},
"post-thumbnail": {
"file": "https://ww2.kqed.org/app/uploads/sites/26/2014/09/Wildfires_slice1-620x372.jpg",
"width": 620,
"mimeType": "image/jpeg",
"height": 372
},
"kqedFullSize": {
"file": "https://ww2.kqed.org/app/uploads/sites/26/2014/09/Wildfires_slice1-e1432168220748.jpg",
"width": 616,
"height": 292
},
"guest-author-96": {
"file": "https://ww2.kqed.org/app/uploads/sites/26/2014/09/Wildfires_slice1-e1432168220748-96x96.jpg",
"width": 96,
"mimeType": "image/jpeg",
"height": 96
},
"guest-author-64": {
"file": "https://ww2.kqed.org/app/uploads/sites/26/2014/09/Wildfires_slice1-e1432168220748-64x64.jpg",
"width": 64,
"mimeType": "image/jpeg",
"height": 64
},
"detail": {
"file": "https://ww2.kqed.org/app/uploads/sites/26/2014/09/Wildfires_slice1-e1432168220748-75x75.jpg",
"width": 75,
"mimeType": "image/jpeg",
"height": 75
},
"guest-author-32": {
"file": "https://ww2.kqed.org/app/uploads/sites/26/2014/09/Wildfires_slice1-e1432168220748-32x32.jpg",
"width": 32,
"mimeType": "image/jpeg",
"height": 32
},
"guest-author-128": {
"file": "https://ww2.kqed.org/app/uploads/sites/26/2014/09/Wildfires_slice1-e1432168220748-128x128.jpg",
"width": 128,
"mimeType": "image/jpeg",
"height": 128
}
},
"publishDate": 1409846529,
"modified": 1409846529,
"caption": null,
"description": null,
"title": null,
"credit": null,
"status": "inherit",
"fetchFailed": false,
"isLoading": false
},
"lowdown_26444": {
"type": "attachments",
"id": "lowdown_26444",
"meta": {
"index": "attachments_1716263798",
"site": "lowdown",
"id": "26444",
"found": true
},
"parent": 26431,
"imgSizes": {
"small": {
"file": "https://ww2.kqed.org/app/uploads/sites/26/2017/04/Camden_NJ_poverty-520x390.jpeg",
"width": 520,
"mimeType": "image/jpeg",
"height": 390
},
"thumbnail": {
"file": "https://ww2.kqed.org/app/uploads/sites/26/2017/04/Camden_NJ_poverty-160x120.jpeg",
"width": 160,
"mimeType": "image/jpeg",
"height": 120
},
"post-thumbnail": {
"file": "https://ww2.kqed.org/app/uploads/sites/26/2017/04/Camden_NJ_poverty-600x372.jpeg",
"width": 600,
"mimeType": "image/jpeg",
"height": 372
},
"xsmall": {
"file": "https://ww2.kqed.org/app/uploads/sites/26/2017/04/Camden_NJ_poverty-375x281.jpeg",
"width": 375,
"mimeType": "image/jpeg",
"height": 281
},
"kqedFullSize": {
"file": "https://ww2.kqed.org/app/uploads/sites/26/2017/04/Camden_NJ_poverty.jpeg",
"width": 600,
"height": 450
},
"guest-author-50": {
"file": "https://ww2.kqed.org/app/uploads/sites/26/2017/04/Camden_NJ_poverty-50x50.jpeg",
"width": 50,
"mimeType": "image/jpeg",
"height": 50
},
"guest-author-96": {
"file": "https://ww2.kqed.org/app/uploads/sites/26/2017/04/Camden_NJ_poverty-96x96.jpeg",
"width": 96,
"mimeType": "image/jpeg",
"height": 96
},
"guest-author-64": {
"file": "https://ww2.kqed.org/app/uploads/sites/26/2017/04/Camden_NJ_poverty-64x64.jpeg",
"width": 64,
"mimeType": "image/jpeg",
"height": 64
},
"detail": {
"file": "https://ww2.kqed.org/app/uploads/sites/26/2017/04/Camden_NJ_poverty-150x150.jpeg",
"width": 150,
"mimeType": "image/jpeg",
"height": 150
},
"guest-author-32": {
"file": "https://ww2.kqed.org/app/uploads/sites/26/2017/04/Camden_NJ_poverty-32x32.jpeg",
"width": 32,
"mimeType": "image/jpeg",
"height": 32
},
"guest-author-128": {
"file": "https://ww2.kqed.org/app/uploads/sites/26/2017/04/Camden_NJ_poverty-128x128.jpeg",
"width": 128,
"mimeType": "image/jpeg",
"height": 128
},
"xxsmall": {
"file": "https://ww2.kqed.org/app/uploads/sites/26/2017/04/Camden_NJ_poverty-240x180.jpeg",
"width": 240,
"mimeType": "image/jpeg",
"height": 180
}
},
"publishDate": 1491367178,
"modified": 1491368106,
"caption": "A street in Camden, NJ, one of the poorest cities in the United States.",
"description": null,
"title": "Camden_NJ_poverty",
"credit": "\u003ca href=\"https://commons.wikimedia.org/wiki/File:Camden_NJ_poverty.jpg\" target=\"_blank\">Wikimedia Commons\u003c/a>",
"status": "inherit",
"fetchFailed": false,
"isLoading": false
},
"lowdown_21845": {
"type": "attachments",
"id": "lowdown_21845",
"meta": {
"index": "attachments_1716263798",
"site": "lowdown",
"id": "21845",
"found": true
},
"parent": 12443,
"imgSizes": {
"twentyfourteen-full-width": {
"file": "https://ww2.kqed.org/app/uploads/sites/26/2016/04/Equal-Pay-Day-1038x576.png",
"width": 1038,
"mimeType": "image/png",
"height": 576
},
"thumbnail": {
"file": "https://ww2.kqed.org/app/uploads/sites/26/2016/04/Equal-Pay-Day-400x209.png",
"width": 400,
"mimeType": "image/png",
"height": 209
},
"fd-sm": {
"file": "https://ww2.kqed.org/app/uploads/sites/26/2016/04/Equal-Pay-Day-960x502.png",
"width": 960,
"mimeType": "image/png",
"height": 502
},
"post-thumbnail": {
"file": "https://ww2.kqed.org/app/uploads/sites/26/2016/04/Equal-Pay-Day-672x372.png",
"width": 672,
"mimeType": "image/png",
"height": 372
},
"kqedFullSize": {
"file": "https://ww2.kqed.org/app/uploads/sites/26/2016/04/Equal-Pay-Day.png",
"width": 1200,
"height": 628
},
"guest-author-96": {
"file": "https://ww2.kqed.org/app/uploads/sites/26/2016/04/Equal-Pay-Day-96x96.png",
"width": 96,
"mimeType": "image/png",
"height": 96
},
"medium": {
"file": "https://ww2.kqed.org/app/uploads/sites/26/2016/04/Equal-Pay-Day-800x419.png",
"width": 800,
"mimeType": "image/png",
"height": 419
},
"guest-author-64": {
"file": "https://ww2.kqed.org/app/uploads/sites/26/2016/04/Equal-Pay-Day-64x64.png",
"width": 64,
"mimeType": "image/png",
"height": 64
},
"guest-author-32": {
"file": "https://ww2.kqed.org/app/uploads/sites/26/2016/04/Equal-Pay-Day-32x32.png",
"width": 32,
"mimeType": "image/png",
"height": 32
},
"fd-med": {
"file": "https://ww2.kqed.org/app/uploads/sites/26/2016/04/Equal-Pay-Day-1180x618.png",
"width": 1180,
"mimeType": "image/png",
"height": 618
},
"detail": {
"file": "https://ww2.kqed.org/app/uploads/sites/26/2016/04/Equal-Pay-Day-75x75.png",
"width": 75,
"mimeType": "image/png",
"height": 75
},
"medium_large": {
"file": "https://ww2.kqed.org/app/uploads/sites/26/2016/04/Equal-Pay-Day-768x402.png",
"width": 768,
"mimeType": "image/png",
"height": 402
},
"guest-author-128": {
"file": "https://ww2.kqed.org/app/uploads/sites/26/2016/04/Equal-Pay-Day-128x128.png",
"width": 128,
"mimeType": "image/png",
"height": 128
}
},
"publishDate": 1460416797,
"modified": 1460416797,
"caption": null,
"description": null,
"title": "Equal-Pay-Day",
"credit": null,
"status": "inherit",
"fetchFailed": false,
"isLoading": false
},
"lowdown_3072": {
"type": "attachments",
"id": "lowdown_3072",
"meta": {
"index": "attachments_1716263798",
"site": "lowdown",
"id": "3072",
"found": true
},
"parent": 2849,
"imgSizes": {
"twentyfourteen-full-width": {
"file": "https://ww2.kqed.org/app/uploads/sites/26/2012/07/UC-Berkeley-Sather-Gate_0-1024x576.jpg",
"width": 1024,
"mimeType": "image/jpeg",
"height": 576
},
"thumbnail": {
"file": "https://ww2.kqed.org/app/uploads/sites/26/2012/07/UC-Berkeley-Sather-Gate_0-400x300.jpg",
"width": 400,
"mimeType": "image/jpeg",
"height": 300
},
"fd-sm": {
"file": "https://ww2.kqed.org/app/uploads/sites/26/2012/07/UC-Berkeley-Sather-Gate_0-320x240.jpg",
"width": 320,
"mimeType": "image/jpeg",
"height": 240
},
"post-thumbnail": {
"file": "https://ww2.kqed.org/app/uploads/sites/26/2012/07/UC-Berkeley-Sather-Gate_0-672x372.jpg",
"width": 672,
"mimeType": "image/jpeg",
"height": 372
},
"kqedFullSize": {
"file": "https://ww2.kqed.org/app/uploads/sites/26/2012/07/UC-Berkeley-Sather-Gate_0.jpg",
"width": 1024,
"height": 768
},
"fd-med": {
"file": "https://ww2.kqed.org/app/uploads/sites/26/2012/07/UC-Berkeley-Sather-Gate_0-768x576.jpg",
"width": 768,
"mimeType": "image/jpeg",
"height": 576
},
"guest-author-96": {
"file": "https://ww2.kqed.org/app/uploads/sites/26/2012/07/UC-Berkeley-Sather-Gate_0-96x96.jpg",
"width": 96,
"mimeType": "image/jpeg",
"height": 96
},
"medium": {
"file": "https://ww2.kqed.org/app/uploads/sites/26/2012/07/UC-Berkeley-Sather-Gate_0-800x600.jpg",
"width": 800,
"mimeType": "image/jpeg",
"height": 600
},
"guest-author-64": {
"file": "https://ww2.kqed.org/app/uploads/sites/26/2012/07/UC-Berkeley-Sather-Gate_0-64x64.jpg",
"width": 64,
"mimeType": "image/jpeg",
"height": 64
},
"detail": {
"file": "https://ww2.kqed.org/app/uploads/sites/26/2012/07/UC-Berkeley-Sather-Gate_0-75x75.jpg",
"width": 75,
"mimeType": "image/jpeg",
"height": 75
},
"guest-author-32": {
"file": "https://ww2.kqed.org/app/uploads/sites/26/2012/07/UC-Berkeley-Sather-Gate_0-32x32.jpg",
"width": 32,
"mimeType": "image/jpeg",
"height": 32
},
"guest-author-128": {
"file": "https://ww2.kqed.org/app/uploads/sites/26/2012/07/UC-Berkeley-Sather-Gate_0-128x128.jpg",
"width": 128,
"mimeType": "image/jpeg",
"height": 128
}
},
"publishDate": 1343438898,
"modified": 1688069020,
"caption": "Students UC Berkeley's Sather Gate",
"description": null,
"title": "UC-Berkeley-Sather-Gate_0",
"credit": "Wikimedia",
"status": "inherit",
"altTag": null,
"fetchFailed": false,
"isLoading": false
},
"lowdown_9232": {
"type": "attachments",
"id": "lowdown_9232",
"meta": {
"index": "attachments_1716263798",
"site": "lowdown",
"id": "9232",
"found": true
},
"parent": 9030,
"imgSizes": {
"thumbnail": {
"file": "https://ww2.kqed.org/app/uploads/sites/26/2013/09/1963-e1418943788899-400x250.jpg",
"width": 400,
"mimeType": "image/jpeg",
"height": 250
},
"fd-sm": {
"file": "https://ww2.kqed.org/app/uploads/sites/26/2013/09/1963-e1418943788899-320x200.jpg",
"width": 320,
"mimeType": "image/jpeg",
"height": 200
},
"post-thumbnail": {
"file": "https://ww2.kqed.org/app/uploads/sites/26/2013/09/1963-e1418943788899-620x372.jpg",
"width": 620,
"mimeType": "image/jpeg",
"height": 372
},
"kqedFullSize": {
"file": "https://ww2.kqed.org/app/uploads/sites/26/2013/09/1963-e1418943788899.jpg",
"width": 620,
"height": 388
},
"guest-author-96": {
"file": "https://ww2.kqed.org/app/uploads/sites/26/2013/09/1963-e1418943788899-96x96.jpg",
"width": 96,
"mimeType": "image/jpeg",
"height": 96
},
"guest-author-64": {
"file": "https://ww2.kqed.org/app/uploads/sites/26/2013/09/1963-e1418943788899-64x64.jpg",
"width": 64,
"mimeType": "image/jpeg",
"height": 64
},
"detail": {
"file": "https://ww2.kqed.org/app/uploads/sites/26/2013/09/1963-e1418943788899-75x75.jpg",
"width": 75,
"mimeType": "image/jpeg",
"height": 75
},
"guest-author-32": {
"file": "https://ww2.kqed.org/app/uploads/sites/26/2013/09/1963-e1418943788899-32x32.jpg",
"width": 32,
"mimeType": "image/jpeg",
"height": 32
},
"guest-author-128": {
"file": "https://ww2.kqed.org/app/uploads/sites/26/2013/09/1963-e1418943788899-128x128.jpg",
"width": 128,
"mimeType": "image/jpeg",
"height": 128
}
},
"publishDate": 1378341821,
"modified": 1378341821,
"caption": null,
"description": "(FILES) US civil rights leader Martin Luther KIng (3rd from L) walks with supporters during the \"March on Washington\" 28 August, 1963 after which, King delivered the \"I Have a Dream\" speech from the steps of the LIncoln Memorial. 28 August, 2003 marks the 40th anniversary of the famous speech, which is credited with mobilizing supporters of desegregation and prompted the 1964 Civil Rights Act. King was assassinated on 04 April 1968 in Memphis, Tennessee. James Earl Ray confessed to shooting King and was sentenced to 99 years in prison. AFP PHOTO/FILES (Photo credit should read -/AFP/Getty Images)",
"title": "1963",
"credit": null,
"status": "inherit",
"fetchFailed": false,
"isLoading": false
},
"lowdown_8009": {
"type": "attachments",
"id": "lowdown_8009",
"meta": {
"index": "attachments_1716263798",
"site": "lowdown",
"id": "8009",
"found": true
},
"parent": 7943,
"imgSizes": {
"thumbnail": {
"file": "https://ww2.kqed.org/app/uploads/sites/26/2013/06/bang_garment_workers-400x262.jpg",
"width": 400,
"mimeType": "image/jpeg",
"height": 262
},
"fd-sm": {
"file": "https://ww2.kqed.org/app/uploads/sites/26/2013/06/bang_garment_workers-320x210.jpg",
"width": 320,
"mimeType": "image/jpeg",
"height": 210
},
"post-thumbnail": {
"file": "https://ww2.kqed.org/app/uploads/sites/26/2013/06/bang_garment_workers-624x372.jpg",
"width": 624,
"mimeType": "image/jpeg",
"height": 372
},
"kqedFullSize": {
"file": "https://ww2.kqed.org/app/uploads/sites/26/2013/06/bang_garment_workers.jpg",
"width": 624,
"height": 409
},
"guest-author-96": {
"file": "https://ww2.kqed.org/app/uploads/sites/26/2013/06/bang_garment_workers-96x96.jpg",
"width": 96,
"mimeType": "image/jpeg",
"height": 96
},
"guest-author-64": {
"file": "https://ww2.kqed.org/app/uploads/sites/26/2013/06/bang_garment_workers-64x64.jpg",
"width": 64,
"mimeType": "image/jpeg",
"height": 64
},
"detail": {
"file": "https://ww2.kqed.org/app/uploads/sites/26/2013/06/bang_garment_workers-75x75.jpg",
"width": 75,
"mimeType": "image/jpeg",
"height": 75
},
"guest-author-32": {
"file": "https://ww2.kqed.org/app/uploads/sites/26/2013/06/bang_garment_workers-32x32.jpg",
"width": 32,
"mimeType": "image/jpeg",
"height": 32
},
"guest-author-128": {
"file": "https://ww2.kqed.org/app/uploads/sites/26/2013/06/bang_garment_workers-128x128.jpg",
"width": 128,
"mimeType": "image/jpeg",
"height": 128
}
},
"publishDate": 1370307807,
"modified": 1482357921,
"caption": null,
"description": "Garment workers sew T-shirts at a factory in Dhaka, Bangladesh, in 2009. Bangladesh, the world's second-largest clothing exporter, has lured clothing makers through a combination of low wages and light regulation.",
"title": "bang_garment_workers",
"credit": "AFP/Getty Images ",
"status": "inherit",
"fetchFailed": false,
"isLoading": false
},
"lowdown_16665": {
"type": "attachments",
"id": "lowdown_16665",
"meta": {
"index": "attachments_1716263798",
"site": "lowdown",
"id": "16665",
"found": true
},
"parent": 16663,
"imgSizes": {
"thumbnail": {
"file": "https://ww2.kqed.org/app/uploads/sites/26/2015/03/Undocumented_slice1-400x213.jpg",
"width": 400,
"mimeType": "image/jpeg",
"height": 213
},
"fd-sm": {
"file": "https://ww2.kqed.org/app/uploads/sites/26/2015/03/Undocumented_slice1-320x170.jpg",
"width": 320,
"mimeType": "image/jpeg",
"height": 170
},
"kqedFullSize": {
"file": "https://ww2.kqed.org/app/uploads/sites/26/2015/03/Undocumented_slice1.jpg",
"width": 620,
"height": 330
},
"guest-author-96": {
"file": "https://ww2.kqed.org/app/uploads/sites/26/2015/03/Undocumented_slice1-96x96.jpg",
"width": 96,
"mimeType": "image/jpeg",
"height": 96
},
"guest-author-64": {
"file": "https://ww2.kqed.org/app/uploads/sites/26/2015/03/Undocumented_slice1-64x64.jpg",
"width": 64,
"mimeType": "image/jpeg",
"height": 64
},
"detail": {
"file": "https://ww2.kqed.org/app/uploads/sites/26/2015/03/Undocumented_slice1-75x75.jpg",
"width": 75,
"mimeType": "image/jpeg",
"height": 75
},
"guest-author-32": {
"file": "https://ww2.kqed.org/app/uploads/sites/26/2015/03/Undocumented_slice1-32x32.jpg",
"width": 32,
"mimeType": "image/jpeg",
"height": 32
},
"guest-author-128": {
"file": "https://ww2.kqed.org/app/uploads/sites/26/2015/03/Undocumented_slice1-128x128.jpg",
"width": 128,
"mimeType": "image/jpeg",
"height": 128
}
},
"publishDate": 1426525949,
"modified": 1426535096,
"caption": null,
"description": null,
"title": null,
"credit": null,
"status": "inherit",
"fetchFailed": false,
"isLoading": false
},
"lowdown_24202": {
"type": "attachments",
"id": "lowdown_24202",
"meta": {
"index": "attachments_1716263798",
"site": "lowdown",
"id": "24202",
"found": true
},
"parent": 14882,
"imgSizes": {
"thumbnail": {
"file": "https://ww2.kqed.org/app/uploads/sites/26/2016/10/props_featured-400x218.png",
"width": 400,
"mimeType": "image/png",
"height": 218
},
"kqedFullSize": {
"file": "https://ww2.kqed.org/app/uploads/sites/26/2016/10/props_featured.png",
"width": 620,
"height": 338
},
"guest-author-50": {
"file": "https://ww2.kqed.org/app/uploads/sites/26/2016/10/props_featured-50x50.png",
"width": 50,
"mimeType": "image/png",
"height": 50
},
"guest-author-96": {
"file": "https://ww2.kqed.org/app/uploads/sites/26/2016/10/props_featured-96x96.png",
"width": 96,
"mimeType": "image/png",
"height": 96
},
"guest-author-64": {
"file": "https://ww2.kqed.org/app/uploads/sites/26/2016/10/props_featured-64x64.png",
"width": 64,
"mimeType": "image/png",
"height": 64
},
"detail": {
"file": "https://ww2.kqed.org/app/uploads/sites/26/2016/10/props_featured-150x150.png",
"width": 150,
"mimeType": "image/png",
"height": 150
},
"guest-author-32": {
"file": "https://ww2.kqed.org/app/uploads/sites/26/2016/10/props_featured-32x32.png",
"width": 32,
"mimeType": "image/png",
"height": 32
},
"guest-author-128": {
"file": "https://ww2.kqed.org/app/uploads/sites/26/2016/10/props_featured-128x128.png",
"width": 128,
"mimeType": "image/png",
"height": 128
}
},
"publishDate": 1476726358,
"modified": 1476726358,
"caption": null,
"description": null,
"title": "props_featured",
"credit": null,
"status": "inherit",
"fetchFailed": false,
"isLoading": false
}
},
"audioPlayerReducer": {
"postId": "stream_live",
"isPaused": true,
"isPlaying": false,
"pfsActive": false,
"pledgeModalIsOpen": true,
"playerDrawerIsOpen": false
},
"authorsReducer": {
"matthewgreen": {
"type": "authors",
"id": "1263",
"meta": {
"index": "authors_1716337520",
"id": "1263",
"found": true
},
"name": "Matthew Green",
"firstName": "Matthew",
"lastName": "Green",
"slug": "matthewgreen",
"email": "mgreen@kqed.org",
"display_author_email": false,
"staff_mastheads": [],
"title": "KQED Editor/Reporter",
"bio": "Matthew Green is a digital media producer for KQED News. He previously produced \u003ca href=\"http://www.kqed.org/lowdown\">The Lowdown\u003c/a>, KQED’s multimedia news education blog. Matthew's written for numerous Bay Area publications, including the Oakland Tribune and San Francisco Chronicle. He also taught journalism classes at Fremont High School in East Oakland.\r\n\r\nEmail: mgreen@kqed.org; Twitter: @MGreenKQED",
"avatar": "https://secure.gravatar.com/avatar/3bf498d1267ca02c8494f33d8cfc575e?s=600&d=blank&r=g",
"twitter": "MGreenKQED",
"facebook": null,
"instagram": null,
"linkedin": null,
"sites": [
{
"site": "news",
"roles": []
},
{
"site": "lowdown",
"roles": []
},
{
"site": "science",
"roles": []
},
{
"site": "education",
"roles": []
},
{
"site": "quest",
"roles": []
},
{
"site": "liveblog",
"roles": []
}
],
"headData": {
"title": "Matthew Green | KQED",
"description": "KQED Editor/Reporter",
"ogImgSrc": "https://secure.gravatar.com/avatar/3bf498d1267ca02c8494f33d8cfc575e?s=600&d=blank&r=g",
"twImgSrc": "https://secure.gravatar.com/avatar/3bf498d1267ca02c8494f33d8cfc575e?s=600&d=blank&r=g"
},
"isLoading": false,
"link": "/author/matthewgreen"
},
"andywarner": {
"type": "authors",
"id": "7506",
"meta": {
"index": "authors_1716337520",
"id": "7506",
"found": true
},
"name": "Andy Warner",
"firstName": "Andy",
"lastName": "Warner",
"slug": "andywarner",
"email": "eridisc@gmail.com",
"display_author_email": false,
"staff_mastheads": [],
"title": null,
"bio": "Andy Warner's comic journalism has been published by Symbolia, Slate, \u003ca href=\"http://popsci.com/\">popsci.com\u003c/a>, American Public Media, Campus Progress and more. You can see more of his work at: \u003ca href=\"http://andywarnercomics.com/\">andywarnercomics.com\u003c/a>.",
"avatar": "https://secure.gravatar.com/avatar/2983c68805617a24b2c98bc90911aa2b?s=600&d=blank&r=g",
"twitter": null,
"facebook": null,
"instagram": null,
"linkedin": null,
"sites": [
{
"site": "lowdown",
"roles": [
"author"
]
}
],
"headData": {
"title": "Andy Warner | KQED",
"description": null,
"ogImgSrc": "https://secure.gravatar.com/avatar/2983c68805617a24b2c98bc90911aa2b?s=600&d=blank&r=g",
"twImgSrc": "https://secure.gravatar.com/avatar/2983c68805617a24b2c98bc90911aa2b?s=600&d=blank&r=g"
},
"isLoading": false,
"link": "/author/andywarner"
}
},
"breakingNewsReducer": {},
"pagesReducer": {},
"postsReducer": {
"stream_live": {
"type": "live",
"id": "stream_live",
"audioUrl": "https://streams.kqed.org/kqedradio",
"title": "Live Stream",
"excerpt": "Live Stream information currently unavailable.",
"link": "/radio",
"featImg": "",
"label": {
"name": "KQED Live",
"link": "/"
}
},
"stream_kqedNewscast": {
"type": "posts",
"id": "stream_kqedNewscast",
"audioUrl": "https://www.kqed.org/.stream/anon/radio/RDnews/newscast.mp3?_=1",
"title": "KQED Newscast",
"featImg": "",
"label": {
"name": "88.5 FM",
"link": "/"
}
},
"lowdown_15427": {
"type": "posts",
"id": "lowdown_15427",
"meta": {
"index": "posts_1716263798",
"site": "lowdown",
"id": "15427",
"score": null,
"sort": [
1514478016000
]
},
"parent": 0,
"labelTerm": {
"site": "lowdown"
},
"blocks": [],
"publishDate": 1514478016,
"format": "video",
"disqusTitle": "Looking for the Fastest Way to Board a Plane? Go Ask An Astrophysicist",
"title": "Looking for the Fastest Way to Board a Plane? Go Ask An Astrophysicist",
"headTitle": "The Lowdown | KQED News",
"content": "\u003cp>If you're braving the \"friendly,\" crowded skies this holiday season, brace yourself for the inevitably glacial pace of the boarding process.\u003c/p>\n\u003cp>The boarding methods of most commercial airlines are not quite the gold standard of efficiency.\u003c/p>\n\u003cp>So, what's the fastest way to get in your seat? I mean, come on, we're not exactly talking rocket science here.\u003c/p>\n\u003cp>As it turns out, it's actually a fairly complicated puzzle to decipher: a intricate enough problem to tantalize the likes of an astrophysicist.\u003c/p>\n\u003cfigure id=\"attachment_15443\" class=\"wp-caption alignnone\" style=\"max-width: 889px\">\u003ca href=\"http://ww2.kqed.org/lowdown/wp-content/uploads/sites/26/2015/01/vox_boarding.png\">\u003cimg class=\"wp-image-15443 size-full\" src=\"http://ww2.kqed.org/lowdown/wp-content/uploads/sites/26/2015/01/vox_boarding.png\" alt=\"Courtesy of Vox\" width=\"889\" height=\"579\" srcset=\"https://ww2.kqed.org/app/uploads/sites/26/2015/01/vox_boarding.png 889w, https://ww2.kqed.org/app/uploads/sites/26/2015/01/vox_boarding-400x261.png 400w, https://ww2.kqed.org/app/uploads/sites/26/2015/01/vox_boarding-800x521.png 800w, https://ww2.kqed.org/app/uploads/sites/26/2015/01/vox_boarding-768x500.png 768w, https://ww2.kqed.org/app/uploads/sites/26/2015/01/vox_boarding-320x208.png 320w\" sizes=\"(max-width: 889px) 100vw, 889px\">\u003c/a>\u003cfigcaption class=\"wp-caption-text\">Courtesy of Vox.com\u003c/figcaption>\u003c/figure>\n\u003cp>After enduring one too many maddeningly slow boarding experiences, \u003ca href=\"https://www.unlv.edu/news/article/new-faces-jason-steffen\" target=\"_blank\" rel=\"noopener\">Jason Steffen \u003c/a>a professor of physics and astronomy at the University of Nevada Las Vegas, began digging into the unexpectedly complicated mechanics of efficiently ushering passengers onto planes.\u003c/p>\n\u003cp>[ad fullwidth]\u003c/p>\n\u003cp>In 2008, Steffen created a computer simulation to evaluate existing boarding methods and ultimately design what he claims is the most efficient option for getting restless passengers into their seats. The results were published several years ago in the Journal of Air Transport Management (\u003ca href=\"http://home.fnal.gov/~jsteffen/airplanes.html\" target=\"_blank\" rel=\"noopener\">summarized here\u003c/a>).\u003c/p>\n\u003cp>In his research, Steffen identified the two most common factors responsible for slowing the boarding process to a painful crawl:\u003c/p>\n\u003cp>1. Passengers typically have to wait in the aisle for those ahead of them to stow luggage.\u003c/p>\n\u003cp>2. Those already seated in aisle or middle seats have to get up and move back into the aisle to let passengers behind them take the seats closer to the window.\u003c/p>\n\u003cp>In fact, the most routine boarding process -- from back to front -- is actually the slowest of them all, Steffen's argues, It's even less efficient than boarding a plane in a completely random order.\u003c/p>\n\u003cp>Steffen claims that his proposed method, which minimizes the former issue and eliminates the latter, could significantly reduce boarding times, thus cutting down on overall door-to-door flight lengths, and ultimately saving airlines hundreds of millions of dollars a year.\u003c/p>\n\u003cp>The news site \u003ca href=\"http://www.vox.com/2014/4/25/5647696/the-way-we-board-airplanes-makes-absolutely-no-sense\" target=\"_blank\" rel=\"noopener\">Vox \u003c/a>recently explored this question and created the above video analyzing various standard boarding methods. The videos below show individual simulations of these different boarding processes, listed from worst (slowest) to best (fastest).\u003c/p>\n\u003cp>Think you have a better idea? Let us know in the comment section below.\u003c/p>\n\u003cp>Here's to safe, relatively painless and highly efficient travels!\u003c/p>\n\u003ch4>5. The dreaded back-to-front method\u003c/h4>\n\u003cp>https://youtu.be/CsRfFhrNtho\u003c/p>\n\u003ch4>4. The random method\u003c/h4>\n\u003cp>https://youtu.be/QJMuXZrV3gY\u003c/p>\n\u003ch4>3. The outside-in method\u003c/h4>\n\u003cp>https://youtu.be/cHFWuP37Ha4\u003c/p>\n\u003ch4>2. The best current option: Southwest's self-selection method\u003c/h4>\n\u003cp>No video simulation for this one, but the basic gist is that Southwest doesn't assign seats. Instead, passengers get on the plane in the order they check in and can sit in which ever seats are available. This method has proven to be the most efficient one currently used because passengers have more freedom to sit where they want and spend less time waiting in the aisle.\u003c/p>\n\u003ch4>1. And finally, the winner (in theory, at least): The Steffen method\u003c/h4>\n\u003cp>Steffen's method is closest to the the outside-in method, with one major difference: rather than having all window seat passengers board first, it creates a choreographed boarding sequence that eliminates any waiting in the aisle by having passengers board in a staggered format. Take a look:\u003c/p>\n\u003cp>\u003c/p>\n\u003cp>https://youtu.be/cHFWuP37Ha4\u003c/p>\n\n",
"disqusIdentifier": "15427 http://blogs.kqed.org/lowdown/?p=15427",
"disqusUrl": "https://ww2.kqed.org/lowdown/2017/12/28/whats-the-fastest-way-to-board-a-plane-hint-probably-not-how-youre-used-to-doing-it/",
"stats": {
"hasVideo": false,
"hasChartOrMap": false,
"hasAudio": false,
"hasPolis": false,
"wordCount": 551,
"hasGoogleForm": false,
"hasGallery": false,
"hasHearkenModule": false,
"iframeSrcs": [],
"paragraphCount": 18
},
"modified": 1515026888,
"excerpt": "Figuring out the best boarding method is more complicated than you might think. ",
"headData": {
"twImgId": "",
"twTitle": "",
"ogTitle": "",
"ogImgId": "",
"twDescription": "",
"description": "Figuring out the best boarding method is more complicated than you might think. ",
"title": "Looking for the Fastest Way to Board a Plane? Go Ask An Astrophysicist | KQED",
"ogDescription": "",
"schema": {
"@context": "https://schema.org",
"@type": "Article",
"headline": "Looking for the Fastest Way to Board a Plane? Go Ask An Astrophysicist",
"datePublished": "2017-12-28T08:20:16-08:00",
"dateModified": "2018-01-03T16:48:08-08:00",
"image": "https://cdn.kqed.org/wp-content/uploads/2020/02/KQED-OG-Image@1x.png"
}
},
"guestAuthors": [],
"slug": "whats-the-fastest-way-to-board-a-plane-hint-probably-not-how-youre-used-to-doing-it",
"status": "publish",
"customPermalink": "2015/01/05/whats-the-fastest-way-to-board-a-plane-hint-probably-not-how-youre-used-to-doing-it/",
"videoEmbed": "https://youtu.be/cMgarcFkXz4",
"path": "/lowdown/15427/whats-the-fastest-way-to-board-a-plane-hint-probably-not-how-youre-used-to-doing-it",
"audioTrackLength": null,
"parsedContent": [
{
"type": "contentString",
"content": "\u003cdiv class=\"post-body\">\u003cp>\u003cp>If you're braving the \"friendly,\" crowded skies this holiday season, brace yourself for the inevitably glacial pace of the boarding process.\u003c/p>\n\u003cp>The boarding methods of most commercial airlines are not quite the gold standard of efficiency.\u003c/p>\n\u003cp>So, what's the fastest way to get in your seat? I mean, come on, we're not exactly talking rocket science here.\u003c/p>\n\u003cp>As it turns out, it's actually a fairly complicated puzzle to decipher: a intricate enough problem to tantalize the likes of an astrophysicist.\u003c/p>\n\u003cfigure id=\"attachment_15443\" class=\"wp-caption alignnone\" style=\"max-width: 889px\">\u003ca href=\"http://ww2.kqed.org/lowdown/wp-content/uploads/sites/26/2015/01/vox_boarding.png\">\u003cimg class=\"wp-image-15443 size-full\" src=\"http://ww2.kqed.org/lowdown/wp-content/uploads/sites/26/2015/01/vox_boarding.png\" alt=\"Courtesy of Vox\" width=\"889\" height=\"579\" srcset=\"https://ww2.kqed.org/app/uploads/sites/26/2015/01/vox_boarding.png 889w, https://ww2.kqed.org/app/uploads/sites/26/2015/01/vox_boarding-400x261.png 400w, https://ww2.kqed.org/app/uploads/sites/26/2015/01/vox_boarding-800x521.png 800w, https://ww2.kqed.org/app/uploads/sites/26/2015/01/vox_boarding-768x500.png 768w, https://ww2.kqed.org/app/uploads/sites/26/2015/01/vox_boarding-320x208.png 320w\" sizes=\"(max-width: 889px) 100vw, 889px\">\u003c/a>\u003cfigcaption class=\"wp-caption-text\">Courtesy of Vox.com\u003c/figcaption>\u003c/figure>\n\u003cp>After enduring one too many maddeningly slow boarding experiences, \u003ca href=\"https://www.unlv.edu/news/article/new-faces-jason-steffen\" target=\"_blank\" rel=\"noopener\">Jason Steffen \u003c/a>a professor of physics and astronomy at the University of Nevada Las Vegas, began digging into the unexpectedly complicated mechanics of efficiently ushering passengers onto planes.\u003c/p>\n\u003cp>\u003c/p>\u003c/div>",
"attributes": {
"named": {},
"numeric": []
}
},
{
"type": "component",
"content": "",
"name": "ad",
"attributes": {
"named": {
"label": "fullwidth"
},
"numeric": [
"fullwidth"
]
}
},
{
"type": "contentString",
"content": "\u003cdiv class=\"post-body\">\u003cp>\u003c/p>\n\u003cp>In 2008, Steffen created a computer simulation to evaluate existing boarding methods and ultimately design what he claims is the most efficient option for getting restless passengers into their seats. The results were published several years ago in the Journal of Air Transport Management (\u003ca href=\"http://home.fnal.gov/~jsteffen/airplanes.html\" target=\"_blank\" rel=\"noopener\">summarized here\u003c/a>).\u003c/p>\n\u003cp>In his research, Steffen identified the two most common factors responsible for slowing the boarding process to a painful crawl:\u003c/p>\n\u003cp>1. Passengers typically have to wait in the aisle for those ahead of them to stow luggage.\u003c/p>\n\u003cp>2. Those already seated in aisle or middle seats have to get up and move back into the aisle to let passengers behind them take the seats closer to the window.\u003c/p>\n\u003cp>In fact, the most routine boarding process -- from back to front -- is actually the slowest of them all, Steffen's argues, It's even less efficient than boarding a plane in a completely random order.\u003c/p>\n\u003cp>Steffen claims that his proposed method, which minimizes the former issue and eliminates the latter, could significantly reduce boarding times, thus cutting down on overall door-to-door flight lengths, and ultimately saving airlines hundreds of millions of dollars a year.\u003c/p>\n\u003cp>The news site \u003ca href=\"http://www.vox.com/2014/4/25/5647696/the-way-we-board-airplanes-makes-absolutely-no-sense\" target=\"_blank\" rel=\"noopener\">Vox \u003c/a>recently explored this question and created the above video analyzing various standard boarding methods. The videos below show individual simulations of these different boarding processes, listed from worst (slowest) to best (fastest).\u003c/p>\n\u003cp>Think you have a better idea? Let us know in the comment section below.\u003c/p>\n\u003cp>Here's to safe, relatively painless and highly efficient travels!\u003c/p>\n\u003ch4>5. The dreaded back-to-front method\u003c/h4>\u003c/p>\u003cp>\u003cspan class='utils-parseShortcode-shortcodes-__youtubeShortcode__embedYoutube'>\n \u003cspan class='utils-parseShortcode-shortcodes-__youtubeShortcode__embedYoutubeInside'>\n \u003ciframe\n loading='lazy'\n class='utils-parseShortcode-shortcodes-__youtubeShortcode__youtubePlayer'\n type='text/html'\n src='//www.youtube.com/embed/CsRfFhrNtho'\n title='//www.youtube.com/embed/CsRfFhrNtho'\n allowfullscreen='true'\n style='border:0;'>\u003c/iframe>\n \u003c/span>\n \u003c/span>\u003c/p>\u003cp>\u003ch4>4. The random method\u003c/h4>\u003c/p>\u003cp>\u003cspan class='utils-parseShortcode-shortcodes-__youtubeShortcode__embedYoutube'>\n \u003cspan class='utils-parseShortcode-shortcodes-__youtubeShortcode__embedYoutubeInside'>\n \u003ciframe\n loading='lazy'\n class='utils-parseShortcode-shortcodes-__youtubeShortcode__youtubePlayer'\n type='text/html'\n src='//www.youtube.com/embed/QJMuXZrV3gY'\n title='//www.youtube.com/embed/QJMuXZrV3gY'\n allowfullscreen='true'\n style='border:0;'>\u003c/iframe>\n \u003c/span>\n \u003c/span>\u003c/p>\u003cp>\u003ch4>3. The outside-in method\u003c/h4>\u003c/p>\u003cp>\u003cspan class='utils-parseShortcode-shortcodes-__youtubeShortcode__embedYoutube'>\n \u003cspan class='utils-parseShortcode-shortcodes-__youtubeShortcode__embedYoutubeInside'>\n \u003ciframe\n loading='lazy'\n class='utils-parseShortcode-shortcodes-__youtubeShortcode__youtubePlayer'\n type='text/html'\n src='//www.youtube.com/embed/cHFWuP37Ha4'\n title='//www.youtube.com/embed/cHFWuP37Ha4'\n allowfullscreen='true'\n style='border:0;'>\u003c/iframe>\n \u003c/span>\n \u003c/span>\u003c/p>\u003cp>\u003ch4>2. The best current option: Southwest's self-selection method\u003c/h4>\n\u003cp>No video simulation for this one, but the basic gist is that Southwest doesn't assign seats. Instead, passengers get on the plane in the order they check in and can sit in which ever seats are available. This method has proven to be the most efficient one currently used because passengers have more freedom to sit where they want and spend less time waiting in the aisle.\u003c/p>\n\u003ch4>1. And finally, the winner (in theory, at least): The Steffen method\u003c/h4>\n\u003cp>Steffen's method is closest to the the outside-in method, with one major difference: rather than having all window seat passengers board first, it creates a choreographed boarding sequence that eliminates any waiting in the aisle by having passengers board in a staggered format. Take a look:\u003c/p>\n\u003cp>\u003c/p>\u003c/p>\u003cp>\u003cspan class='utils-parseShortcode-shortcodes-__youtubeShortcode__embedYoutube'>\n \u003cspan class='utils-parseShortcode-shortcodes-__youtubeShortcode__embedYoutubeInside'>\n \u003ciframe\n loading='lazy'\n class='utils-parseShortcode-shortcodes-__youtubeShortcode__youtubePlayer'\n type='text/html'\n src='//www.youtube.com/embed/cHFWuP37Ha4'\n title='//www.youtube.com/embed/cHFWuP37Ha4'\n allowfullscreen='true'\n style='border:0;'>\u003c/iframe>\n \u003c/span>\n \u003c/span>\u003c/p>\u003cp>\n\u003c/div>\u003c/p>",
"attributes": {
"named": {},
"numeric": []
}
}
],
"link": "/lowdown/15427/whats-the-fastest-way-to-board-a-plane-hint-probably-not-how-youre-used-to-doing-it",
"authors": [
"1263"
],
"categories": [
"lowdown_245",
"lowdown_256",
"lowdown_457",
"lowdown_2408"
],
"tags": [
"lowdown_2337",
"lowdown_562",
"lowdown_563"
],
"featImg": "lowdown_15446",
"label": "lowdown"
},
"lowdown_13974": {
"type": "posts",
"id": "lowdown_13974",
"meta": {
"index": "posts_1716263798",
"site": "lowdown",
"id": "13974",
"score": null,
"sort": [
1500501653000
]
},
"parent": 0,
"labelTerm": {
"site": "lowdown"
},
"blocks": [],
"publishDate": 1500501653,
"format": "aside",
"disqusTitle": "Burned Out: Why Western Wildfires Have Gotten Bigger, Meaner and Harder to Control",
"title": "Burned Out: Why Western Wildfires Have Gotten Bigger, Meaner and Harder to Control",
"headTitle": "The Lowdown | KQED News",
"content": "\u003cp>Thousands of people Wednesday were forced to flee a rapidly spreading wildfire approaching the California town of Mariposa near Yosemite National Park.\u003c/p>\n\u003cp>Just a day after Gov. Jerry Brown \u003ca href=\"https://www.gov.ca.gov/news.php?id=19881\" target=\"_blank\" rel=\"noopener noreferrer\">declared\u003c/a> a state of emergency for Mariposa County, the \u003ca href=\"http://www.fire.ca.gov/current_incidents/incidentdetails/Index/1672\" target=\"_blank\">Detwiler Fire\u003c/a> had nearly doubled in size, covering roughly 46,000 acres and threatening scores of homes and other structures. [Update: By Thursday morning, the fire had spread to 70,000 acres and was only 10 percent contained, according to Cal Fire.] \u003c/p>\n\u003cp>The blaze is among nearly \u003ca href=\"https://www.arcgis.com/home/webmap/viewer.html?webmap=df8bcc10430f48878b01c96e907a1fc3\" target=\"_blank\" rel=\"noopener noreferrer\">40 large active fires\u003c/a> burning across 12 western states as of Wednesday, according to the \u003ca href=\"https://www.nifc.gov/\" target=\"_blank\">National Interagency Fire Center\u003c/a>. More than 4 million acres have burned since the start of 2017, the site reports, compared to 2.7 million acres in the same period last year.\u003c/p>\n\u003cp>So why do wildfires seem to be getting more ferocious each year? Warmer conditions, drought and other impacts of climate change are major contributors, but there's more to the story. Comic journalist Andy Warner explains the fiery history of how we got here.\u003c/p>\n\u003cp>\u003ca href=\"https://ww2.kqed.org/lowdown/wp-content/uploads/sites/26/2017/07/Wildfires_full.png\">\u003cimg src=\"https://ww2.kqed.org/lowdown/wp-content/uploads/sites/26/2017/07/Wildfires_full.png\" alt=\"\" width=\"620\" height=\"3726\" class=\"alignnone size-full wp-image-30698\" srcset=\"https://ww2.kqed.org/app/uploads/sites/26/2017/07/Wildfires_full.png 620w, https://ww2.kqed.org/app/uploads/sites/26/2017/07/Wildfires_full-160x962.png 160w, https://ww2.kqed.org/app/uploads/sites/26/2017/07/Wildfires_full-240x1442.png 240w, https://ww2.kqed.org/app/uploads/sites/26/2017/07/Wildfires_full-375x2254.png 375w, https://ww2.kqed.org/app/uploads/sites/26/2017/07/Wildfires_full-520x3125.png 520w\" sizes=\"(max-width: 620px) 100vw, 620px\">\u003c/a>\u003c/p>\n\u003ch4>Source links\u003c/h4>\n\u003cp>\u003ca href=\"http://www.esajournals.org/doi/abs/10.1890/ES11-00345.1\">http://www.esajournals.org/doi/abs/10.1890/ES11-00345.1\u003c/a>\u003c/p>\n\u003cp>[ad fullwidth]\u003c/p>\n\u003cp>\u003ca href=\"http://onlinelibrary.wiley.com/doi/10.1002/2014GL059576/abstract\">http://onlinelibrary.wiley.com/doi/10.1002/2014GL059576/abstract\u003c/a>\u003c/p>\n\u003cp>\u003c/p>\n\u003cp>\u003ca href=\"http://www.sciencedaily.com/releases/2006/07/060710084004.htm\">http://www.sciencedaily.com/releases/2006/07/060710084004.htm\u003c/a>\u003c/p>\n\n",
"disqusIdentifier": "13974 http://blogs.kqed.org/lowdown/?p=13974",
"disqusUrl": "https://ww2.kqed.org/lowdown/2017/07/19/burned-out-why-wildfires-in-the-west-have-gotten-so-much-worse-comic/",
"stats": {
"hasVideo": false,
"hasChartOrMap": false,
"hasAudio": false,
"hasPolis": false,
"wordCount": 216,
"hasGoogleForm": false,
"hasGallery": false,
"hasHearkenModule": false,
"iframeSrcs": [],
"paragraphCount": 7
},
"modified": 1524505043,
"excerpt": "An illustrated history of wildfire management in the West.",
"headData": {
"twImgId": "",
"twTitle": "",
"ogTitle": "",
"ogImgId": "",
"twDescription": "",
"description": "An illustrated history of wildfire management in the West.",
"title": "Burned Out: Why Western Wildfires Have Gotten Bigger, Meaner and Harder to Control | KQED",
"ogDescription": "",
"schema": {
"@context": "https://schema.org",
"@type": "Article",
"headline": "Burned Out: Why Western Wildfires Have Gotten Bigger, Meaner and Harder to Control",
"datePublished": "2017-07-19T15:00:53-07:00",
"dateModified": "2018-04-23T10:37:23-07:00",
"image": "https://cdn.kqed.org/wp-content/uploads/2020/02/KQED-OG-Image@1x.png"
}
},
"guestAuthors": [],
"slug": "burned-out-why-wildfires-in-the-west-have-gotten-so-much-worse-comic",
"status": "publish",
"path": "/lowdown/13974/burned-out-why-wildfires-in-the-west-have-gotten-so-much-worse-comic",
"audioTrackLength": null,
"parsedContent": [
{
"type": "contentString",
"content": "\u003cdiv class=\"post-body\">\u003cp>\u003cp>Thousands of people Wednesday were forced to flee a rapidly spreading wildfire approaching the California town of Mariposa near Yosemite National Park.\u003c/p>\n\u003cp>Just a day after Gov. Jerry Brown \u003ca href=\"https://www.gov.ca.gov/news.php?id=19881\" target=\"_blank\" rel=\"noopener noreferrer\">declared\u003c/a> a state of emergency for Mariposa County, the \u003ca href=\"http://www.fire.ca.gov/current_incidents/incidentdetails/Index/1672\" target=\"_blank\">Detwiler Fire\u003c/a> had nearly doubled in size, covering roughly 46,000 acres and threatening scores of homes and other structures. [Update: By Thursday morning, the fire had spread to 70,000 acres and was only 10 percent contained, according to Cal Fire.] \u003c/p>\n\u003cp>The blaze is among nearly \u003ca href=\"https://www.arcgis.com/home/webmap/viewer.html?webmap=df8bcc10430f48878b01c96e907a1fc3\" target=\"_blank\" rel=\"noopener noreferrer\">40 large active fires\u003c/a> burning across 12 western states as of Wednesday, according to the \u003ca href=\"https://www.nifc.gov/\" target=\"_blank\">National Interagency Fire Center\u003c/a>. More than 4 million acres have burned since the start of 2017, the site reports, compared to 2.7 million acres in the same period last year.\u003c/p>\n\u003cp>So why do wildfires seem to be getting more ferocious each year? Warmer conditions, drought and other impacts of climate change are major contributors, but there's more to the story. Comic journalist Andy Warner explains the fiery history of how we got here.\u003c/p>\n\u003cp>\u003ca href=\"https://ww2.kqed.org/lowdown/wp-content/uploads/sites/26/2017/07/Wildfires_full.png\">\u003cimg src=\"https://ww2.kqed.org/lowdown/wp-content/uploads/sites/26/2017/07/Wildfires_full.png\" alt=\"\" width=\"620\" height=\"3726\" class=\"alignnone size-full wp-image-30698\" srcset=\"https://ww2.kqed.org/app/uploads/sites/26/2017/07/Wildfires_full.png 620w, https://ww2.kqed.org/app/uploads/sites/26/2017/07/Wildfires_full-160x962.png 160w, https://ww2.kqed.org/app/uploads/sites/26/2017/07/Wildfires_full-240x1442.png 240w, https://ww2.kqed.org/app/uploads/sites/26/2017/07/Wildfires_full-375x2254.png 375w, https://ww2.kqed.org/app/uploads/sites/26/2017/07/Wildfires_full-520x3125.png 520w\" sizes=\"(max-width: 620px) 100vw, 620px\">\u003c/a>\u003c/p>\n\u003ch4>Source links\u003c/h4>\n\u003cp>\u003ca href=\"http://www.esajournals.org/doi/abs/10.1890/ES11-00345.1\">http://www.esajournals.org/doi/abs/10.1890/ES11-00345.1\u003c/a>\u003c/p>\n\u003cp>\u003c/p>\u003c/div>",
"attributes": {
"named": {},
"numeric": []
}
},
{
"type": "component",
"content": "",
"name": "ad",
"attributes": {
"named": {
"label": "fullwidth"
},
"numeric": [
"fullwidth"
]
}
},
{
"type": "contentString",
"content": "\u003cdiv class=\"post-body\">\u003cp>\u003c/p>\n\u003cp>\u003ca href=\"http://onlinelibrary.wiley.com/doi/10.1002/2014GL059576/abstract\">http://onlinelibrary.wiley.com/doi/10.1002/2014GL059576/abstract\u003c/a>\u003c/p>\n\u003cp>\u003c/p>\n\u003cp>\u003ca href=\"http://www.sciencedaily.com/releases/2006/07/060710084004.htm\">http://www.sciencedaily.com/releases/2006/07/060710084004.htm\u003c/a>\u003c/p>\n\n\u003c/div>\u003c/p>",
"attributes": {
"named": {},
"numeric": []
}
}
],
"link": "/lowdown/13974/burned-out-why-wildfires-in-the-west-have-gotten-so-much-worse-comic",
"authors": [
"7506"
],
"categories": [
"lowdown_256",
"lowdown_588",
"lowdown_514",
"lowdown_530"
],
"tags": [
"lowdown_2612",
"lowdown_464",
"lowdown_2337",
"lowdown_520"
],
"featImg": "lowdown_13989",
"label": "lowdown"
},
"lowdown_26431": {
"type": "posts",
"id": "lowdown_26431",
"meta": {
"index": "posts_1716263798",
"site": "lowdown",
"id": "26431",
"score": null,
"sort": [
1491369169000
]
},
"parent": 0,
"labelTerm": {
"site": "lowdown"
},
"blocks": [],
"publishDate": 1491369169,
"format": "standard",
"disqusTitle": "How Many Americans Live in Poverty, and What Does That Actually Mean? (with Lesson Plan)",
"title": "How Many Americans Live in Poverty, and What Does That Actually Mean? (with Lesson Plan)",
"headTitle": "The Lowdown | KQED News",
"content": "\u003cp>\u003c!--more-->\u003c/p>\n\u003cdiv>\n\u003caside class=\"alignright\">\n\u003cdiv>\u003cspan style=\"font-size: x-la<p data-wpview-marker=;\">\u003cspan style=\"color: #993300;\">Teach with the Lowdown\u003c/span>\u003c/span>\u003c/div>\n\u003cp>\u003cimg class=\"alignnone wp-image-22868\" src=\"http://ww2.kqed.org/lowdown/wp-content/uploads/sites/26/2016/07/hands-e1469568663680-400x143.jpg\" width=\"340\" height=\"122\" srcset=\"https://ww2.kqed.org/app/uploads/sites/26/2016/07/hands-e1469568663680-400x143.jpg 400w, https://ww2.kqed.org/app/uploads/sites/26/2016/07/hands-e1469568663680-800x286.jpg 800w, https://ww2.kqed.org/app/uploads/sites/26/2016/07/hands-e1469568663680-768x274.jpg 768w, https://ww2.kqed.org/app/uploads/sites/26/2016/07/hands-e1469568663680.jpg 957w\" sizes=\"(max-width: 340px) 100vw, 340px\">Suggestions for nonfiction analysis, writing/discussion prompts and multimedia projects. Browse our lesson plan collection \u003ca href=\"https://ww2.kqed.org/lowdown/category/lesson-plans-and-guides/\" target=\"_blank\">here\u003c/a>.\u003c/p>\n\u003cul>\n\u003cli>\u003ca href=\"https://ww2.kqed.org/lowdown/wp-content/uploads/sites/26/2017/04/Poverty-in-America-lesson-plan-1.pdf\" target=\"_blank\">Lesson Plan: Poverty in the U.S. (PDF)\u003c/a>\u003c/li>\n\u003cli>\u003cb>Next Tuesday (4/11/17): War rhetoric\u003c/b>\u003c/li>\n\u003c/ul>\n\u003c/aside>\n\u003c/div>\n\u003cp>More than 43 million Americans -- roughly 13.5 percent of the entire population -- were living in poverty in 2015, according to the \u003ca href=\"https://www.census.gov/topics/income-poverty/poverty.html\" target=\"_blank\">U.S. Census Bureau\u003c/a>. That's actually a noticeable decline from recent years, when the rate hovered at around 15 percent, but it still amounts to a shockingly large number of people in the richest nation on earth who live in dire circumstances.\u003c/p>\n\u003cp>Comic journalist \u003ca href=\"http://andysaurus.com\" target=\"_blank\">Andy Warner \u003c/a>explains how \"poverty\" is officially defined and what factors have caused those rates to change so widely over time.\u003c/p>\n\u003cp>\u003ca href=\"https://ww2.kqed.org/lowdown/wp-content/uploads/sites/26/2017/04/Poverty_Trend_2017Revision-1-1.png\">\u003cimg src=\"https://ww2.kqed.org/lowdown/wp-content/uploads/sites/26/2017/04/Poverty_Trend_2017Revision-1-1.png\" alt=\"\" width=\"620\" height=\"3902\" class=\"alignnone size-full wp-image-30700\" srcset=\"https://ww2.kqed.org/app/uploads/sites/26/2017/04/Poverty_Trend_2017Revision-1-1.png 620w, https://ww2.kqed.org/app/uploads/sites/26/2017/04/Poverty_Trend_2017Revision-1-1-160x1007.png 160w, https://ww2.kqed.org/app/uploads/sites/26/2017/04/Poverty_Trend_2017Revision-1-1-240x1510.png 240w, https://ww2.kqed.org/app/uploads/sites/26/2017/04/Poverty_Trend_2017Revision-1-1-375x2360.png 375w, https://ww2.kqed.org/app/uploads/sites/26/2017/04/Poverty_Trend_2017Revision-1-1-520x3273.png 520w\" sizes=\"(max-width: 620px) 100vw, 620px\">\u003c/a>\u003cbr>\nAnd to learn more about how the federal government determines poverty rates, \u003ca href=\"https://ww2.kqed.org/lowdown/poverty_line/\" target=\"_blank\">see part two\u003c/a>.\u003c/p>\n\u003cp>[ad fullwidth]\u003c/p>\u003cp>\u003c/p>\n",
"disqusIdentifier": "26431 https://ww2.kqed.org/lowdown/?p=26431",
"disqusUrl": "https://ww2.kqed.org/lowdown/2017/04/04/how-many-americans-live-in-poverty-and-what-does-that-actually-mean-with-lesson-plan/",
"stats": {
"hasVideo": false,
"hasChartOrMap": false,
"hasAudio": false,
"hasPolis": false,
"wordCount": 141,
"hasGoogleForm": false,
"hasGallery": false,
"hasHearkenModule": false,
"iframeSrcs": [],
"paragraphCount": 7
},
"modified": 1524505251,
"excerpt": null,
"headData": {
"twImgId": "",
"twTitle": "",
"ogTitle": "",
"ogImgId": "",
"twDescription": "",
"description": "",
"title": "How Many Americans Live in Poverty, and What Does That Actually Mean? (with Lesson Plan) | KQED",
"ogDescription": "",
"schema": {
"@context": "https://schema.org",
"@type": "Article",
"headline": "How Many Americans Live in Poverty, and What Does That Actually Mean? (with Lesson Plan)",
"datePublished": "2017-04-04T22:12:49-07:00",
"dateModified": "2018-04-23T10:40:51-07:00",
"image": "https://cdn.kqed.org/wp-content/uploads/2020/02/KQED-OG-Image@1x.png"
}
},
"guestAuthors": [],
"slug": "how-many-americans-live-in-poverty-and-what-does-that-actually-mean-with-lesson-plan",
"status": "publish",
"path": "/lowdown/26431/how-many-americans-live-in-poverty-and-what-does-that-actually-mean-with-lesson-plan",
"audioTrackLength": null,
"parsedContent": [
{
"type": "contentString",
"content": "\u003cdiv class=\"post-body\">\u003cp>\u003cp>\u003c!--more-->\u003c/p>\n\u003cdiv>\n\u003caside class=\"alignright\">\n\u003cdiv>\u003cspan style=\"font-size: x-la<p data-wpview-marker=;\">\u003cspan style=\"color: #993300;\">Teach with the Lowdown\u003c/span>\u003c/span>\u003c/div>\n\u003cp>\u003cimg class=\"alignnone wp-image-22868\" src=\"http://ww2.kqed.org/lowdown/wp-content/uploads/sites/26/2016/07/hands-e1469568663680-400x143.jpg\" width=\"340\" height=\"122\" srcset=\"https://ww2.kqed.org/app/uploads/sites/26/2016/07/hands-e1469568663680-400x143.jpg 400w, https://ww2.kqed.org/app/uploads/sites/26/2016/07/hands-e1469568663680-800x286.jpg 800w, https://ww2.kqed.org/app/uploads/sites/26/2016/07/hands-e1469568663680-768x274.jpg 768w, https://ww2.kqed.org/app/uploads/sites/26/2016/07/hands-e1469568663680.jpg 957w\" sizes=\"(max-width: 340px) 100vw, 340px\">Suggestions for nonfiction analysis, writing/discussion prompts and multimedia projects. Browse our lesson plan collection \u003ca href=\"https://ww2.kqed.org/lowdown/category/lesson-plans-and-guides/\" target=\"_blank\">here\u003c/a>.\u003c/p>\n\u003cul>\n\u003cli>\u003ca href=\"https://ww2.kqed.org/lowdown/wp-content/uploads/sites/26/2017/04/Poverty-in-America-lesson-plan-1.pdf\" target=\"_blank\">Lesson Plan: Poverty in the U.S. (PDF)\u003c/a>\u003c/li>\n\u003cli>\u003cb>Next Tuesday (4/11/17): War rhetoric\u003c/b>\u003c/li>\n\u003c/ul>\n\u003c/aside>\n\u003c/div>\n\u003cp>More than 43 million Americans -- roughly 13.5 percent of the entire population -- were living in poverty in 2015, according to the \u003ca href=\"https://www.census.gov/topics/income-poverty/poverty.html\" target=\"_blank\">U.S. Census Bureau\u003c/a>. That's actually a noticeable decline from recent years, when the rate hovered at around 15 percent, but it still amounts to a shockingly large number of people in the richest nation on earth who live in dire circumstances.\u003c/p>\n\u003cp>Comic journalist \u003ca href=\"http://andysaurus.com\" target=\"_blank\">Andy Warner \u003c/a>explains how \"poverty\" is officially defined and what factors have caused those rates to change so widely over time.\u003c/p>\n\u003cp>\u003ca href=\"https://ww2.kqed.org/lowdown/wp-content/uploads/sites/26/2017/04/Poverty_Trend_2017Revision-1-1.png\">\u003cimg src=\"https://ww2.kqed.org/lowdown/wp-content/uploads/sites/26/2017/04/Poverty_Trend_2017Revision-1-1.png\" alt=\"\" width=\"620\" height=\"3902\" class=\"alignnone size-full wp-image-30700\" srcset=\"https://ww2.kqed.org/app/uploads/sites/26/2017/04/Poverty_Trend_2017Revision-1-1.png 620w, https://ww2.kqed.org/app/uploads/sites/26/2017/04/Poverty_Trend_2017Revision-1-1-160x1007.png 160w, https://ww2.kqed.org/app/uploads/sites/26/2017/04/Poverty_Trend_2017Revision-1-1-240x1510.png 240w, https://ww2.kqed.org/app/uploads/sites/26/2017/04/Poverty_Trend_2017Revision-1-1-375x2360.png 375w, https://ww2.kqed.org/app/uploads/sites/26/2017/04/Poverty_Trend_2017Revision-1-1-520x3273.png 520w\" sizes=\"(max-width: 620px) 100vw, 620px\">\u003c/a>\u003cbr>\nAnd to learn more about how the federal government determines poverty rates, \u003ca href=\"https://ww2.kqed.org/lowdown/poverty_line/\" target=\"_blank\">see part two\u003c/a>.\u003c/p>\n\u003cp>\u003c/p>\u003c/div>",
"attributes": {
"named": {},
"numeric": []
}
},
{
"type": "component",
"content": "",
"name": "ad",
"attributes": {
"named": {
"label": "fullwidth"
},
"numeric": [
"fullwidth"
]
}
},
{
"type": "contentString",
"content": "\u003cdiv class=\"post-body\">\u003cp>\u003c/p>\u003cp>\u003c/p>\n\u003c/div>\u003c/p>",
"attributes": {
"named": {},
"numeric": []
}
}
],
"link": "/lowdown/26431/how-many-americans-live-in-poverty-and-what-does-that-actually-mean-with-lesson-plan",
"authors": [
"7506"
],
"categories": [
"lowdown_256",
"lowdown_588",
"lowdown_2399",
"lowdown_457"
],
"tags": [
"lowdown_2337",
"lowdown_414"
],
"featImg": "lowdown_26444",
"label": "lowdown"
},
"lowdown_12443": {
"type": "posts",
"id": "lowdown_12443",
"meta": {
"index": "posts_1716263798",
"site": "lowdown",
"id": "12443",
"score": null,
"sort": [
1491332427000
]
},
"parent": 0,
"labelTerm": {
"site": "lowdown"
},
"blocks": [],
"publishDate": 1491332427,
"format": "aside",
"disqusTitle": "MAP: It's Equal Pay Day! How Big Is the Gender Wage Gap Where You Live?",
"title": "MAP: It's Equal Pay Day! How Big Is the Gender Wage Gap Where You Live?",
"headTitle": "The Lowdown | KQED News",
"content": "\u003cp>https://youtu.be/YtPt2BNWin0\u003c/p>\n\u003cp>Today -- April 4 -- is \"Equal Pay Day.\" It marks the number of days into 2017 (plus all of 2016) that an average American woman would need to work in order to make the same amount that an average man made in 2016.\u003c/p>\n\u003cp>Although the the gender wage gap has narrowed significantly in the last 50 years, it remains stubbornly high. Nationwide, women are still paid, on average, about 80 cents for every dollar a man makes, according to the National Women's Law Center's \u003ca href=\"https://nwlc.org/issue/equal-pay-and-the-wage-gap/\">analysis \u003c/a>of \u003ca href=\"https://www.census.gov/programs-surveys/acs/data.html\" target=\"_blank\" rel=\"noopener\">American Community Survey wage data\u003c/a>. That gap varies widely by region, and it grows significantly wider for women of color.\u003c/p>\n\u003cp>Women make up about half the U.S. workforce. They're the main breadwinners in roughly 40 percent of households and have eclipsed men in the number of college and graduate degrees earned, according to \u003ca href=\"http://www.nwlc.org/\" target=\"_blank\" rel=\"noopener\">NWLC\u003c/a>.\u003c/p>\n\u003cp>Yet, on average, women earn less than men in almost every occupation for which there is sufficient wage data. The median wage for full-time male workers in 2014 was $50,383, as compared to $39,621 for women, based on NWLC's analysis.\u003c/p>\n\u003ch4>By state\u003c/h4>\n\u003cp>Click on each state in the map below to see what a woman, on average, made for every dollar made by a man in 2014 (the ratio of female to male median earnings for full-time, year-round workers), and the difference that makes annual and over the course of a 40-year career. The map uses 2014 data from the American Community Survey, as collected and analyzed by the National Women's Law Center, an advocacy group (\u003ca href=\"https://nwlc.org/wp-content/uploads/2015/09/Wage-Gap-State-By-State.pdf\" target=\"_blank\" rel=\"noopener\">download the data here\u003c/a>).\u003c/p>\n\u003cp>[ad fullwidth]\u003c/p>\n\u003cp>Figures are based on women's and men's 2014 median earnings for full-time, year-round work over a 40-year career, and are not adjusted for inflation.\u003c/p>\n\u003cdiv style=\"width: 100%\">\n\u003c!-- iframe plugin v.4.3 wordpress.org/plugins/iframe/ -->\u003cbr>\n\u003ciframe src=\"https://mgreen.cartodb.com/viz/9a69916c-002a-11e6-82e6-0e5db1731f59/embed_map\" width=\"100%\" height=\"800\" frameborder=\"0\" allowfullscreen=\"allowfullscreen\" scrolling=\"yes\" class=\"iframe-class\">\u003c/iframe>\n\u003c/div>\n\u003cp>Leading the pack was Washington D.C., where female full-time workers made, on average, 89.5 cents for every dollar male workers made. In California, which ranked eighth, women made 84.1 cents for every dollar made by men. Louisiana took up the rear: women there made a mere 65.3 cents for every dollar made by men.\u003c/p>\n\u003cp>When the \u003ca href=\"http://www.eeoc.gov/laws/statutes/epa.cfm\" target=\"_blank\" rel=\"noopener\">Equal Pay Act\u003c/a> was passed in 1963, full-time working women made, on average, about 59 cents for every dollar made by men. By 1973, the gap had actually grown wider: women made 57 cents for every dollar men made. Since then, however, the gap has gradually narrowed, although it's remained fairly stagnant since 2000.\u003c/p>\n\u003cp>\u003ca href=\"http://ww2.kqed.org/lowdown/wp-content/uploads/sites/26/2015/04/Wage_Gap.jpg\" target=\"_blank\" rel=\"noopener\">\u003cimg class=\"alignnone wp-image-17041 size-full\" src=\"https://ww2.kqed.org/lowdown/wp-content/uploads/sites/26/2015/04/Wage_Gap.jpg\" alt=\"\" width=\"600\" height=\"371\" srcset=\"https://ww2.kqed.org/app/uploads/sites/26/2015/04/Wage_Gap.jpg 600w, https://ww2.kqed.org/app/uploads/sites/26/2015/04/Wage_Gap-400x247.jpg 400w, https://ww2.kqed.org/app/uploads/sites/26/2015/04/Wage_Gap-320x198.jpg 320w\" sizes=\"(max-width: 600px) 100vw, 600px\">\u003c/a>\u003c/p>\n\u003ch4>Why does the wage gap persist?\u003c/h4>\n\u003cp>Reasons vary widely. Some academic studies argue that the disparity is due mainly to non-discriminatory factors related to division of labor in the home -- including childcare -- that often falls more heavily on women. Because of family-related circumstances, like giving birth, women overall are also more likely than men to have interrupted careers and work part-time, which can result in less-senior positions and lower wages. Additionally, women are still more likely than men to be employed in lower-paying service and support professions.\u003c/p>\n\u003cp>Some studies, however, point to evidence that the gender wage gap persists even after variables like family leave are taken into account, concluding that systemic discrimination remains a primary factor. This is especially notable for women of color, whose average pay is significantly less than white male counterparts. For every dollar that the average white man made in 2014, the average African-American woman made only 60.5 cents, and the average Latina made only 54.6 cents, according \u003ca href=\"http://nwlc.org/resources/wage-gap-state-state/\" target=\"_blank\" rel=\"noopener\">NWLC\u003c/a>.\u003c/p>\n\u003ch4>By profession\u003c/h4>\n\u003cp>\u003c/p>\n\u003cp>Even within the same professions, women today are still paid significantly less, on average, than men. But the pay gap varies dramatically by job, according to NPR's \u003ca href=\"http://www.npr.org/blogs/money/2013/02/05/171196714/the-jobs-with-the-biggest-and-smallest-pay-gaps-between-men-and-women\" target=\"_blank\" rel=\"noopener\">Planet Money\u003c/a> team, which analyzed at \u003ca href=\"http://www.bls.gov/bls/blswage.htm\" target=\"_blank\" rel=\"noopener\">Bureau of Labor Statistics\u003c/a> data from 2012. The chart below, by Lam Thuy Vo, shows jobs where the wage gap is smallest and largest (based on comparisons of full-time workers). Part of the gap in pay, Vo notes, results from professional decisions some women voluntarily make. She writes: \"Among physicians, for example, women are more likely than men to choose lower-paid specialties (though this does not explain all of the pay gap among doctors).\" It's also interesting to note, writes Vo, that the jobs where the gap is biggest are the one's that pay more.\u003c/p>\n\u003cfigure id=\"attachment_7453\" class=\"wp-caption alignnone\" style=\"max-width: 616px\">\u003ca href=\"http://ww2.kqed.org/lowdown/wp-content/uploads/sites/26/2013/04/jobs-by-gender-616.gif\">\u003cimg class=\"size-full wp-image-7453 \" src=\"http://ww2.kqed.org/lowdown/wp-content/uploads/sites/26/2013/04/jobs-by-gender-616.gif\" alt=\"Percentages are based on the median weekly earnings of full-time wage and salary workers. Not all jobs have enough workers for BLS to calculate a meaningful ratio.Source: Bureau of Labor StatisticsCredit: Lam Thuy Vo / NPR\" width=\"616\" height=\"680\">\u003c/a>\u003cfigcaption class=\"wp-caption-text\">Percentages are based on the median weekly earnings of full-time wage and salary workers. Not all jobs have enough workers for BLS to calculate a meaningful ratio.\u003cbr>Source: Bureau of Labor Statistics\u003cbr>Credit: Lam Thuy Vo / NPR\u003c/figcaption>\u003c/figure>\n\n",
"disqusIdentifier": "12443 http://blogs.kqed.org/lowdown/?p=12443",
"disqusUrl": "https://ww2.kqed.org/lowdown/2017/04/04/how-big-is-the-wage-gap-between-women-and-men/",
"stats": {
"hasVideo": false,
"hasChartOrMap": true,
"hasAudio": false,
"hasPolis": false,
"wordCount": 774,
"hasGoogleForm": false,
"hasGallery": false,
"hasHearkenModule": false,
"iframeSrcs": [
"https://mgreen.cartodb.com/viz/9a69916c-002a-11e6-82e6-0e5db1731f59/embed_map"
],
"paragraphCount": 14
},
"modified": 1554231129,
"excerpt": null,
"headData": {
"twImgId": "",
"twTitle": "",
"ogTitle": "",
"ogImgId": "",
"twDescription": "",
"description": "https://youtu.be/YtPt2BNWin0 Today -- April 4 -- is "Equal Pay Day." It marks the number of days into 2017 (plus all of 2016) that an average American woman would need to work in order to make the same amount that an average man made in 2016. Although the the gender wage gap has narrowed significantly in",
"title": "MAP: It's Equal Pay Day! How Big Is the Gender Wage Gap Where You Live? | KQED",
"ogDescription": "",
"schema": {
"@context": "https://schema.org",
"@type": "Article",
"headline": "MAP: It's Equal Pay Day! How Big Is the Gender Wage Gap Where You Live?",
"datePublished": "2017-04-04T12:00:27-07:00",
"dateModified": "2019-04-02T11:52:09-07:00",
"image": "https://cdn.kqed.org/wp-content/uploads/2020/02/KQED-OG-Image@1x.png"
}
},
"guestAuthors": [],
"slug": "how-big-is-the-wage-gap-between-women-and-men",
"status": "publish",
"customPermalink": "2014/04/gender-wage-gap/",
"path": "/lowdown/12443/how-big-is-the-wage-gap-between-women-and-men",
"audioTrackLength": null,
"parsedContent": [
{
"type": "contentString",
"content": "\u003cdiv class=\"post-body\">\u003cp>\u003c/p>\u003cp>\u003cspan class='utils-parseShortcode-shortcodes-__youtubeShortcode__embedYoutube'>\n \u003cspan class='utils-parseShortcode-shortcodes-__youtubeShortcode__embedYoutubeInside'>\n \u003ciframe\n loading='lazy'\n class='utils-parseShortcode-shortcodes-__youtubeShortcode__youtubePlayer'\n type='text/html'\n src='//www.youtube.com/embed/YtPt2BNWin0'\n title='//www.youtube.com/embed/YtPt2BNWin0'\n allowfullscreen='true'\n style='border:0;'>\u003c/iframe>\n \u003c/span>\n \u003c/span>\u003c/p>\u003cp>\u003cp>Today -- April 4 -- is \"Equal Pay Day.\" It marks the number of days into 2017 (plus all of 2016) that an average American woman would need to work in order to make the same amount that an average man made in 2016.\u003c/p>\n\u003cp>Although the the gender wage gap has narrowed significantly in the last 50 years, it remains stubbornly high. Nationwide, women are still paid, on average, about 80 cents for every dollar a man makes, according to the National Women's Law Center's \u003ca href=\"https://nwlc.org/issue/equal-pay-and-the-wage-gap/\">analysis \u003c/a>of \u003ca href=\"https://www.census.gov/programs-surveys/acs/data.html\" target=\"_blank\" rel=\"noopener\">American Community Survey wage data\u003c/a>. That gap varies widely by region, and it grows significantly wider for women of color.\u003c/p>\n\u003cp>Women make up about half the U.S. workforce. They're the main breadwinners in roughly 40 percent of households and have eclipsed men in the number of college and graduate degrees earned, according to \u003ca href=\"http://www.nwlc.org/\" target=\"_blank\" rel=\"noopener\">NWLC\u003c/a>.\u003c/p>\n\u003cp>Yet, on average, women earn less than men in almost every occupation for which there is sufficient wage data. The median wage for full-time male workers in 2014 was $50,383, as compared to $39,621 for women, based on NWLC's analysis.\u003c/p>\n\u003ch4>By state\u003c/h4>\n\u003cp>Click on each state in the map below to see what a woman, on average, made for every dollar made by a man in 2014 (the ratio of female to male median earnings for full-time, year-round workers), and the difference that makes annual and over the course of a 40-year career. The map uses 2014 data from the American Community Survey, as collected and analyzed by the National Women's Law Center, an advocacy group (\u003ca href=\"https://nwlc.org/wp-content/uploads/2015/09/Wage-Gap-State-By-State.pdf\" target=\"_blank\" rel=\"noopener\">download the data here\u003c/a>).\u003c/p>\n\u003cp>\u003c/p>\u003c/div>",
"attributes": {
"named": {},
"numeric": []
}
},
{
"type": "component",
"content": "",
"name": "ad",
"attributes": {
"named": {
"label": "fullwidth"
},
"numeric": [
"fullwidth"
]
}
},
{
"type": "contentString",
"content": "\u003cdiv class=\"post-body\">\u003cp>\u003c/p>\n\u003cp>Figures are based on women's and men's 2014 median earnings for full-time, year-round work over a 40-year career, and are not adjusted for inflation.\u003c/p>\n\u003cdiv style=\"width: 100%\">\n\u003c!-- iframe plugin v.4.3 wordpress.org/plugins/iframe/ -->\u003cbr>\n\u003ciframe src=\"https://mgreen.cartodb.com/viz/9a69916c-002a-11e6-82e6-0e5db1731f59/embed_map\" width=\"100%\" height=\"800\" frameborder=\"0\" allowfullscreen=\"allowfullscreen\" scrolling=\"yes\" class=\"iframe-class\">\u003c/iframe>\n\u003c/div>\n\u003cp>Leading the pack was Washington D.C., where female full-time workers made, on average, 89.5 cents for every dollar male workers made. In California, which ranked eighth, women made 84.1 cents for every dollar made by men. Louisiana took up the rear: women there made a mere 65.3 cents for every dollar made by men.\u003c/p>\n\u003cp>When the \u003ca href=\"http://www.eeoc.gov/laws/statutes/epa.cfm\" target=\"_blank\" rel=\"noopener\">Equal Pay Act\u003c/a> was passed in 1963, full-time working women made, on average, about 59 cents for every dollar made by men. By 1973, the gap had actually grown wider: women made 57 cents for every dollar men made. Since then, however, the gap has gradually narrowed, although it's remained fairly stagnant since 2000.\u003c/p>\n\u003cp>\u003ca href=\"http://ww2.kqed.org/lowdown/wp-content/uploads/sites/26/2015/04/Wage_Gap.jpg\" target=\"_blank\" rel=\"noopener\">\u003cimg class=\"alignnone wp-image-17041 size-full\" src=\"https://ww2.kqed.org/lowdown/wp-content/uploads/sites/26/2015/04/Wage_Gap.jpg\" alt=\"\" width=\"600\" height=\"371\" srcset=\"https://ww2.kqed.org/app/uploads/sites/26/2015/04/Wage_Gap.jpg 600w, https://ww2.kqed.org/app/uploads/sites/26/2015/04/Wage_Gap-400x247.jpg 400w, https://ww2.kqed.org/app/uploads/sites/26/2015/04/Wage_Gap-320x198.jpg 320w\" sizes=\"(max-width: 600px) 100vw, 600px\">\u003c/a>\u003c/p>\n\u003ch4>Why does the wage gap persist?\u003c/h4>\n\u003cp>Reasons vary widely. Some academic studies argue that the disparity is due mainly to non-discriminatory factors related to division of labor in the home -- including childcare -- that often falls more heavily on women. Because of family-related circumstances, like giving birth, women overall are also more likely than men to have interrupted careers and work part-time, which can result in less-senior positions and lower wages. Additionally, women are still more likely than men to be employed in lower-paying service and support professions.\u003c/p>\n\u003cp>Some studies, however, point to evidence that the gender wage gap persists even after variables like family leave are taken into account, concluding that systemic discrimination remains a primary factor. This is especially notable for women of color, whose average pay is significantly less than white male counterparts. For every dollar that the average white man made in 2014, the average African-American woman made only 60.5 cents, and the average Latina made only 54.6 cents, according \u003ca href=\"http://nwlc.org/resources/wage-gap-state-state/\" target=\"_blank\" rel=\"noopener\">NWLC\u003c/a>.\u003c/p>\n\u003ch4>By profession\u003c/h4>\n\u003cp>\u003c/p>\n\u003cp>Even within the same professions, women today are still paid significantly less, on average, than men. But the pay gap varies dramatically by job, according to NPR's \u003ca href=\"http://www.npr.org/blogs/money/2013/02/05/171196714/the-jobs-with-the-biggest-and-smallest-pay-gaps-between-men-and-women\" target=\"_blank\" rel=\"noopener\">Planet Money\u003c/a> team, which analyzed at \u003ca href=\"http://www.bls.gov/bls/blswage.htm\" target=\"_blank\" rel=\"noopener\">Bureau of Labor Statistics\u003c/a> data from 2012. The chart below, by Lam Thuy Vo, shows jobs where the wage gap is smallest and largest (based on comparisons of full-time workers). Part of the gap in pay, Vo notes, results from professional decisions some women voluntarily make. She writes: \"Among physicians, for example, women are more likely than men to choose lower-paid specialties (though this does not explain all of the pay gap among doctors).\" It's also interesting to note, writes Vo, that the jobs where the gap is biggest are the one's that pay more.\u003c/p>\n\u003cfigure id=\"attachment_7453\" class=\"wp-caption alignnone\" style=\"max-width: 616px\">\u003ca href=\"http://ww2.kqed.org/lowdown/wp-content/uploads/sites/26/2013/04/jobs-by-gender-616.gif\">\u003cimg class=\"size-full wp-image-7453 \" src=\"http://ww2.kqed.org/lowdown/wp-content/uploads/sites/26/2013/04/jobs-by-gender-616.gif\" alt=\"Percentages are based on the median weekly earnings of full-time wage and salary workers. Not all jobs have enough workers for BLS to calculate a meaningful ratio.Source: Bureau of Labor StatisticsCredit: Lam Thuy Vo / NPR\" width=\"616\" height=\"680\">\u003c/a>\u003cfigcaption class=\"wp-caption-text\">Percentages are based on the median weekly earnings of full-time wage and salary workers. Not all jobs have enough workers for BLS to calculate a meaningful ratio.\u003cbr>Source: Bureau of Labor Statistics\u003cbr>Credit: Lam Thuy Vo / NPR\u003c/figcaption>\u003c/figure>\n\n\u003c/div>\u003c/p>",
"attributes": {
"named": {},
"numeric": []
}
}
],
"link": "/lowdown/12443/how-big-is-the-wage-gap-between-women-and-men",
"authors": [
"1263"
],
"categories": [
"lowdown_245",
"lowdown_391",
"lowdown_256",
"lowdown_451",
"lowdown_242",
"lowdown_435",
"lowdown_457"
],
"tags": [
"lowdown_2524",
"lowdown_2337",
"lowdown_2522"
],
"featImg": "lowdown_21845",
"label": "lowdown"
},
"lowdown_23920": {
"type": "posts",
"id": "lowdown_23920",
"meta": {
"index": "posts_1716263798",
"site": "lowdown",
"id": "23920",
"score": null,
"sort": [
1485558035000
]
},
"parent": 0,
"labelTerm": {
"site": "lowdown"
},
"blocks": [],
"publishDate": 1485558035,
"format": "standard",
"disqusTitle": "INTERACTIVE: The Rising Cost of California's Public Universities",
"title": "INTERACTIVE: The Rising Cost of California's Public Universities",
"headTitle": "The Lowdown | KQED News",
"content": "\u003cp>\u003c!--more-->\u003c/p>\n\u003cp>\u003cstrong>UPDATED Jan. 27\u003c/strong>: \u003cem>The University of California on Thursday approved a nearly 3 percent tuition hike for all 10 campuses, the first increase since 2011.\u003c/em>\u003c/p>\n\u003cp>\u003cem>The UC Board of Regents \u003ca href=\"https://ww2.kqed.org/news/2017/01/26/uc-regents-approve-first-tuition-increase-since-2011/\" target=\"_blank\">voted to raise annual tuition\u003c/a> for the 2017-2018 school year by $282, and slap on about $50 in additional fees. It says the move is needed to pay for more faculty and course offerings to accommodate record high enrollment numbers and a drop in state funding. \u003c/em>\u003c/p>\n\u003cp>\u003cem>That means the cost of tuition and fees and will go up from its current rate of roughly $13,500 to about $13,890 next year. \u003c/em>\u003c/p>\n\u003cp>Consider this:\u003c/p>\n\u003cp>[ad fullwidth]\u003c/p>\n\u003cp>A recent college graduate working full time will now make, on average, about $17,500 more per year than someone with only a high school diploma, a difference of roughly $700,000 over a 40-year career.\u003c/p>\n\u003cp>That's according to a 2014 \u003ca href=\"http://www.pewsocialtrends.org/2014/02/11/the-rising-cost-of-not-going-to-college/\" target=\"_blank\">Pew Research Center analysis\u003c/a>. For young people today, it found, the pay gap between those with and without a college degree is much larger than it's ever been before.\u003c/p>\n\u003cp>\u003ca href=\"https://ww2.kqed.org/lowdown/2014/01/14/is-college-really-worth-it/\" target=\"_blank\">RELATED: Is College Worth the Cost? [a cartoon explainer]\u003c/a>\u003c/p>\n\u003cp>In other words, the cost of NOT going to college has skyrocketed in recent decades. As the once plentiful supply of American manufacturing jobs continues to shrink, a college degree has become increasingly necessary for scoring any kind of reasonably well-paid job.\u003c/p>\n\u003cp>But here's the rub: tuition rates at most public and private universities have also spiked in recent years, thwarting potential students from pursuing degrees, and leaving a rapidly growing number of recent graduates shouldering \u003ca href=\"http://www.slate.com/articles/life/inside_higher_ed/2016/08/no_the_student_loan_crisis_isn_t_overblown.html\" target=\"_blank\">huge amounts of debt\u003c/a>\u003ca> as they prepare to enter the workforce.\u003c/a>\u003c/p>\n\u003cp>Today, total U.S. student loan debt tops \u003ca href=\"http://www.federalreserve.gov/releases/g19/HIST/cc_hist_memo_levels.html\" target=\"_blank\">$1.3 trillion\u003c/a>, far outpacing total U.S. credit card debt, and more than four times what it was a decade ago. Roughly seven in 10 seniors (69 percent) graduating from public and nonprofit private colleges in 2014 had student loan debt, with an average of $28,950 per borrower, according to the nonpartisan \u003ca href=\"http://ticas.org/posd/map-state-data-2015#\" target=\"_blank\">Institute for College Access and Success\u003c/a>.\u003c/p>\n\u003cp>This conundrum is particularly evident in California, which has some of the highest living costs in the nation and an economy in which \u003ca href=\"http://www.fppic.org/main/publication_quick.asp?i=1112\" target=\"_blank\">high-skilled, educated workers\u003c/a> are increasingly in demand.\u003c/p>\n\u003cp>As recently as three decades ago, California’s public university system -- both University of California and California State University campuses -- was a national model of extremely low-cost, high-quality education. In 1980, yearly tuition for California residents at UCs was about $2,680 (in 2016 dollars), and roughly $500 at CSUs.\u003c/p>\n\u003cp>That all changed amid California's severe recession and budget crisis in the early 1990s, when the state began to drastically tighten its higher education budget.\u003c/p>\n\u003cp>Tuition and fees more than doubled from the late 1980s to the early 1990s. Although costs then stabilized through the early 2000s, they then resumed their \"dramatic and relentless upward climb,\" according to the \u003ca href=\"http://calbudgetcenter.org/resources/state-spending-per-student-at-csu-and-uc-remains-near-the-lowest-point-in-more-than-30-years/\" target=\"_blank\">California Budget and Policy Center\u003c/a>.\u003c/p>\n\u003cp>Today, UC tuition is about $12,300 annually, an increase of more than 350 percent since 1980, with graduating seniors who took out loans carrying an average debt of about $20,000 (about $16,000 for \u003ca href=\"http://www.calstate.edu/value/systemwide/\" target=\"_blank\">CSU graduates\u003c/a>). That's still less than the national average, but much higher than it's ever been for graduates of California's public universities.\u003c/p>\n\u003cp>\u003cscript id=\"infogram_0_869ab4f2-e925-4241-9604-2e51bb3479d0\" title=\"UC/CSU tuition\" src=\"//e.infogr.am/js/embed.js?sdV\" type=\"text/javascript\">\u003c/script>\u003c/p>\n\u003cp>What's really changed is who pays for public higher education in California, explains Hans Johnson, a senior fellow at the Public Policy Institute of California. While the bill used to be primarily footed by the state (through taxpayers), now students and families are paying over half the cost.\u003c/p>\n\u003cp>Interestingly, the burden of rising costs has fallen hardest on higher-income students. For lower-income students, the impact of higher tuition has actually been softened by “relatively generous” aid programs such as the federal Pell Grants, Cal Grants and the \u003ca href=\"http://admission.universityofcalifornia.edu/paying-for-uc/glossary/blue-and-gold/\" target=\"_blank\">Blue and Gold Opportunity Plan\u003c/a> (for UC students with family incomes under $80,000).\u003c/p>\n\u003cp>“What often gets lost is that a substantial share of students qualify for financial aid,” Johnson says, noting that California -- compared with public universities elsewhere -- still does a good job in enrolling eligible low-income students. “Essentially what we’ve gone from is low-cost low-tuition, low-fee program, to one that is medium to high cost but also high aid.”\u003c/p>\n\u003cp>Nevertheless, he adds, this leaves a large group of middle-income students who may not qualify for aid programs but still don't have sufficient resources to pay for college, and end up graduating with a large amount of debt.\u003c/p>\n\u003cp>Additionally, tuition and fees are only a part of the total funding picture. As the map at right shows, the rapidly rising cost of room and board on many campuses is also a major factor in college affordability. This means that even many students with generous aid packages are still incurring large amounts of debt to pay food and housing costs.\u003c/p>\n\u003cp>\u003c/p>\n\u003cp>\u003ciframe src=\"https://mgreen.carto.com/viz/6fb35648-3608-11e5-9f22-0e0c41326911/embed_map\" width=\"100%\" height=\"800\" frameborder=\"0\" allowfullscreen=\"allowfullscreen\">\u003c/iframe>\n\n\u003c/p>\n",
"disqusIdentifier": "23920 http://ww2.kqed.org/lowdown/?p=23920",
"disqusUrl": "https://ww2.kqed.org/lowdown/2017/01/27/interactive-the-rising-cost-of-californias-public-universities/",
"stats": {
"hasVideo": false,
"hasChartOrMap": true,
"hasAudio": false,
"hasPolis": false,
"wordCount": 835,
"hasGoogleForm": false,
"hasGallery": false,
"hasHearkenModule": false,
"iframeSrcs": [
"https://mgreen.carto.com/viz/6fb35648-3608-11e5-9f22-0e0c41326911/embed_map"
],
"paragraphCount": 25
},
"modified": 1485558573,
"excerpt": null,
"headData": {
"twImgId": "",
"twTitle": "",
"ogTitle": "",
"ogImgId": "",
"twDescription": "",
"description": "",
"title": "INTERACTIVE: The Rising Cost of California's Public Universities | KQED",
"ogDescription": "",
"schema": {
"@context": "https://schema.org",
"@type": "Article",
"headline": "INTERACTIVE: The Rising Cost of California's Public Universities",
"datePublished": "2017-01-27T15:00:35-08:00",
"dateModified": "2017-01-27T15:09:33-08:00",
"image": "https://cdn.kqed.org/wp-content/uploads/2020/02/KQED-OG-Image@1x.png"
}
},
"guestAuthors": [],
"slug": "interactive-the-rising-cost-of-californias-public-universities",
"status": "publish",
"customPermalink": "2016/09/29/interactive-the-rising-cost-of-californias-public-universities/",
"path": "/lowdown/23920/interactive-the-rising-cost-of-californias-public-universities",
"audioTrackLength": null,
"parsedContent": [
{
"type": "contentString",
"content": "\u003cdiv class=\"post-body\">\u003cp>\u003cp>\u003c!--more-->\u003c/p>\n\u003cp>\u003cstrong>UPDATED Jan. 27\u003c/strong>: \u003cem>The University of California on Thursday approved a nearly 3 percent tuition hike for all 10 campuses, the first increase since 2011.\u003c/em>\u003c/p>\n\u003cp>\u003cem>The UC Board of Regents \u003ca href=\"https://ww2.kqed.org/news/2017/01/26/uc-regents-approve-first-tuition-increase-since-2011/\" target=\"_blank\">voted to raise annual tuition\u003c/a> for the 2017-2018 school year by $282, and slap on about $50 in additional fees. It says the move is needed to pay for more faculty and course offerings to accommodate record high enrollment numbers and a drop in state funding. \u003c/em>\u003c/p>\n\u003cp>\u003cem>That means the cost of tuition and fees and will go up from its current rate of roughly $13,500 to about $13,890 next year. \u003c/em>\u003c/p>\n\u003cp>Consider this:\u003c/p>\n\u003cp>\u003c/p>\u003c/div>",
"attributes": {
"named": {},
"numeric": []
}
},
{
"type": "component",
"content": "",
"name": "ad",
"attributes": {
"named": {
"label": "fullwidth"
},
"numeric": [
"fullwidth"
]
}
},
{
"type": "contentString",
"content": "\u003cdiv class=\"post-body\">\u003cp>\u003c/p>\n\u003cp>A recent college graduate working full time will now make, on average, about $17,500 more per year than someone with only a high school diploma, a difference of roughly $700,000 over a 40-year career.\u003c/p>\n\u003cp>That's according to a 2014 \u003ca href=\"http://www.pewsocialtrends.org/2014/02/11/the-rising-cost-of-not-going-to-college/\" target=\"_blank\">Pew Research Center analysis\u003c/a>. For young people today, it found, the pay gap between those with and without a college degree is much larger than it's ever been before.\u003c/p>\n\u003cp>\u003ca href=\"https://ww2.kqed.org/lowdown/2014/01/14/is-college-really-worth-it/\" target=\"_blank\">RELATED: Is College Worth the Cost? [a cartoon explainer]\u003c/a>\u003c/p>\n\u003cp>In other words, the cost of NOT going to college has skyrocketed in recent decades. As the once plentiful supply of American manufacturing jobs continues to shrink, a college degree has become increasingly necessary for scoring any kind of reasonably well-paid job.\u003c/p>\n\u003cp>But here's the rub: tuition rates at most public and private universities have also spiked in recent years, thwarting potential students from pursuing degrees, and leaving a rapidly growing number of recent graduates shouldering \u003ca href=\"http://www.slate.com/articles/life/inside_higher_ed/2016/08/no_the_student_loan_crisis_isn_t_overblown.html\" target=\"_blank\">huge amounts of debt\u003c/a>\u003ca> as they prepare to enter the workforce.\u003c/a>\u003c/p>\n\u003cp>Today, total U.S. student loan debt tops \u003ca href=\"http://www.federalreserve.gov/releases/g19/HIST/cc_hist_memo_levels.html\" target=\"_blank\">$1.3 trillion\u003c/a>, far outpacing total U.S. credit card debt, and more than four times what it was a decade ago. Roughly seven in 10 seniors (69 percent) graduating from public and nonprofit private colleges in 2014 had student loan debt, with an average of $28,950 per borrower, according to the nonpartisan \u003ca href=\"http://ticas.org/posd/map-state-data-2015#\" target=\"_blank\">Institute for College Access and Success\u003c/a>.\u003c/p>\n\u003cp>This conundrum is particularly evident in California, which has some of the highest living costs in the nation and an economy in which \u003ca href=\"http://www.fppic.org/main/publication_quick.asp?i=1112\" target=\"_blank\">high-skilled, educated workers\u003c/a> are increasingly in demand.\u003c/p>\n\u003cp>As recently as three decades ago, California’s public university system -- both University of California and California State University campuses -- was a national model of extremely low-cost, high-quality education. In 1980, yearly tuition for California residents at UCs was about $2,680 (in 2016 dollars), and roughly $500 at CSUs.\u003c/p>\n\u003cp>That all changed amid California's severe recession and budget crisis in the early 1990s, when the state began to drastically tighten its higher education budget.\u003c/p>\n\u003cp>Tuition and fees more than doubled from the late 1980s to the early 1990s. Although costs then stabilized through the early 2000s, they then resumed their \"dramatic and relentless upward climb,\" according to the \u003ca href=\"http://calbudgetcenter.org/resources/state-spending-per-student-at-csu-and-uc-remains-near-the-lowest-point-in-more-than-30-years/\" target=\"_blank\">California Budget and Policy Center\u003c/a>.\u003c/p>\n\u003cp>Today, UC tuition is about $12,300 annually, an increase of more than 350 percent since 1980, with graduating seniors who took out loans carrying an average debt of about $20,000 (about $16,000 for \u003ca href=\"http://www.calstate.edu/value/systemwide/\" target=\"_blank\">CSU graduates\u003c/a>). That's still less than the national average, but much higher than it's ever been for graduates of California's public universities.\u003c/p>\n\u003cp>\u003cscript id=\"infogram_0_869ab4f2-e925-4241-9604-2e51bb3479d0\" title=\"UC/CSU tuition\" src=\"//e.infogr.am/js/embed.js?sdV\" type=\"text/javascript\">\u003c/script>\u003c/p>\n\u003cp>What's really changed is who pays for public higher education in California, explains Hans Johnson, a senior fellow at the Public Policy Institute of California. While the bill used to be primarily footed by the state (through taxpayers), now students and families are paying over half the cost.\u003c/p>\n\u003cp>Interestingly, the burden of rising costs has fallen hardest on higher-income students. For lower-income students, the impact of higher tuition has actually been softened by “relatively generous” aid programs such as the federal Pell Grants, Cal Grants and the \u003ca href=\"http://admission.universityofcalifornia.edu/paying-for-uc/glossary/blue-and-gold/\" target=\"_blank\">Blue and Gold Opportunity Plan\u003c/a> (for UC students with family incomes under $80,000).\u003c/p>\n\u003cp>“What often gets lost is that a substantial share of students qualify for financial aid,” Johnson says, noting that California -- compared with public universities elsewhere -- still does a good job in enrolling eligible low-income students. “Essentially what we’ve gone from is low-cost low-tuition, low-fee program, to one that is medium to high cost but also high aid.”\u003c/p>\n\u003cp>Nevertheless, he adds, this leaves a large group of middle-income students who may not qualify for aid programs but still don't have sufficient resources to pay for college, and end up graduating with a large amount of debt.\u003c/p>\n\u003cp>Additionally, tuition and fees are only a part of the total funding picture. As the map at right shows, the rapidly rising cost of room and board on many campuses is also a major factor in college affordability. This means that even many students with generous aid packages are still incurring large amounts of debt to pay food and housing costs.\u003c/p>\n\u003cp>\u003c/p>\n\u003cp>\u003ciframe src=\"https://mgreen.carto.com/viz/6fb35648-3608-11e5-9f22-0e0c41326911/embed_map\" width=\"100%\" height=\"800\" frameborder=\"0\" allowfullscreen=\"allowfullscreen\">\u003c/iframe>\n\n\u003c/p>\n\u003c/div>\u003c/p>",
"attributes": {
"named": {},
"numeric": []
}
}
],
"link": "/lowdown/23920/interactive-the-rising-cost-of-californias-public-universities",
"authors": [
"1263"
],
"categories": [
"lowdown_256",
"lowdown_2363",
"lowdown_2375",
"lowdown_242"
],
"tags": [
"lowdown_158",
"lowdown_2559",
"lowdown_2337",
"lowdown_2561",
"lowdown_2532",
"lowdown_2560"
],
"featImg": "lowdown_3072",
"label": "lowdown"
},
"lowdown_9030": {
"type": "posts",
"id": "lowdown_9030",
"meta": {
"index": "posts_1716263798",
"site": "lowdown",
"id": "9030",
"score": null,
"sort": [
1484100005000
]
},
"parent": 0,
"labelTerm": {
"site": "lowdown"
},
"blocks": [],
"publishDate": 1484100005,
"format": "aside",
"disqusTitle": "Unfinished Business: Would Martin Luther King Be Satisfied with the Pace of Progress?",
"title": "Unfinished Business: Would Martin Luther King Be Satisfied with the Pace of Progress?",
"headTitle": "The Lowdown | KQED News",
"content": "\u003cblockquote>\u003cp>“What good is having the right to sit at a lunch counter if you can’t afford to buy a hamburger?”\u003c/p>\n\u003cp>— Martin Luther King, Jr.\u003c/p>\u003c/blockquote>\n\u003cdiv>\n\u003caside class=\"alignright\">\n\u003cdiv>\u003cspan style=\"font-size: x-large\">\u003cspan style=\"color: #993300\">Teach with the Lowdown\u003c/span>\u003c/span>\u003c/div>\n\u003cp>\u003cimg class=\"alignnone wp-image-22868\" src=\"http://ww2.kqed.org/lowdown/wp-content/uploads/sites/26/2016/07/hands-e1469568663680-400x143.jpg\" width=\"340\" height=\"122\" srcset=\"https://ww2.kqed.org/app/uploads/sites/26/2016/07/hands-e1469568663680-400x143.jpg 400w, https://ww2.kqed.org/app/uploads/sites/26/2016/07/hands-e1469568663680-800x286.jpg 800w, https://ww2.kqed.org/app/uploads/sites/26/2016/07/hands-e1469568663680-768x274.jpg 768w, https://ww2.kqed.org/app/uploads/sites/26/2016/07/hands-e1469568663680.jpg 957w\" sizes=\"(max-width: 340px) 100vw, 340px\">Suggestions for nonfiction analysis, writing/discussion prompts and multimedia projects. Browse our lesson plan collection \u003ca href=\"https://ww2.kqed.org/lowdown/category/lesson-plans-and-guides/\" target=\"_blank\" rel=\"noopener noreferrer\">here\u003c/a>.\u003c/p>\n\u003cul>\n\u003cli>\u003ca href=\"http://ww2.kqed.org/lowdown/wp-content/uploads/sites/26/2015/01/MLK-Jr-plan.pdf\" target=\"_blank\" rel=\"noopener noreferrer\">Lesson Plan: Unfinished Business (PDF)\u003c/a>\u003c/li>\n\u003c/ul>\n\u003c/aside>\n\u003c/div>\n\u003cp> \u003c/p>\n\u003cp>In late August 1963, on the 100th anniversary of the \u003ca href=\"http://www.archives.gov/exhibits/featured_documents/emancipation_proclamation/\" target=\"_blank\" rel=\"noopener noreferrer\">Emancipation Proclamation\u003c/a>, a quarter million demonstrators converged on the National Mall in the nation's capital to partake in what would become one of the largest human rights demonstrations in United States history.\u003c/p>\n\u003cp>The March on Washington for Jobs and Freedom drew a majority African American presence. Demonstrators arrived by the busload -- many from Southern states where Jim Crow segregation policies were still alive and well -- to demand an improvement in civil and economic rights. They marched peacefully towards the Lincoln Memorial, where they listened to the impassioned speeches of some of most outspoken civil rights leaders of the day. Most famously, Martin Luther King, Jr. delivered his seminal \u003ca href=\"http://www.americanrhetoric.com/speeches/mlkihaveadream.htm\" target=\"_blank\" rel=\"noopener noreferrer\">\"I Have a Dream\"\u003c/a> address.\u003c/p>\n\u003cp>King and other leaders of the march articulated a clear, carefully crafted set of demands, underscoring, as King stated, \"the fierce urgency of now.\"\u003c!--more-->\u003c/p>\n\u003cp>\u003ca href=\"http://ww2.kqed.org/lowdown/wp-content/uploads/sites/26/2013/08/MarchDemands.jpg\">\u003cimg class=\"alignright wp-image-9119 size-medium\" src=\"http://ww2.kqed.org/lowdown/wp-content/uploads/sites/26/2013/08/MarchDemands-300x365.jpg\" alt=\"\" width=\"246\" height=\"300\">\u003c/a>The mandates included the passage of new binding pieces of civil rights legislation that, among other things, guaranteed voting rights, increased political representation in Congress, eliminated school segregation and imposed heavy financial and legal penalties against agencies that violated the Equal Protection Clause.\u003c/p>\n\u003cp>But equally important, although often overshadowed, was the demand for greater economic equality. The movement's leaders called for a federal jobs program and a nearly two-fold increase in the national minimum wage, to $2 an hour (equivalent to about $13 today). Leaders also urged federal enforcement to curtail employment discrimination, as well as policies and programs that would increase access to decent housing and adequate public accommodations.\u003c/p>\n\u003cp>In \u003ca href=\"https://templatelab.com/dream-speech/\">his speech \u003c/a>that day, King emphasized the urgency of these goals :\u003c/p>\n\u003cblockquote>\u003cp>\"But one hundred years later, the Negro still is not free. One hundred years later, the life of the Negro is still sadly crippled by the manacles of segregation and the chains of discrimination. One hundred years later, the Negro lives on a lonely island of poverty in the midst of a vast ocean of material prosperity. One hundred years later, the Negro is still languished in the corners of American society and finds himself an exile in his own land. And so we've come here today to dramatize a shameful condition.\"\u003c/p>\u003c/blockquote>\n\u003cp>[contextly_sidebar id=\"Rk9WMEPBGJL28DFQLESewAYrTDb6BtTp\"]\u003c/p>\n\u003cp>The ongoing actions of the Civil Rights Movement were indisputably successful in prompting tremendous progress: less than a year later, congress passed the sweeping \u003ca href=\"http://www.ourdocuments.gov/doc.php?flash=true&doc=97\" target=\"_blank\" rel=\"noopener noreferrer\">Civil Rights Act of 1964\u003c/a>, and by 1965, the \u003ca href=\"http://www.justice.gov/crt/about/vot/intro/intro_b.php\" target=\"_blank\" rel=\"noopener noreferrer\">Voting Rights Act\u003c/a> was signed into law as well (although it was largely dismantled by the Supreme Court in 2013). Today, 50 years hence, the results of these victories, and the subsequent gains in equality are evident, marked not least by the election of America's first black president, a milestone nearly unimaginable in King's day.\u003c/p>\n\u003cp>Today, high school graduation rates among blacks have nearly quadrupled. Black voter participation has grown markedly, as has life expectancy.\u003c/p>\n\u003cp>On August 28, 2013, thousands gathered on the National Mall to commemorate the 1963 march and the tremendous impact it had. Some of the featured speakers, though, noted that many of the 1963 demands have still not been met, particularly along economic lines. Standing in the footsteps of King at the Lincoln Memorial, \u003ca href=\"http://www.washingtonpost.com/politics/transcript-president-obamas-speech-on-the-50th-anniversary-of-the-march-on-washington/2013/08/28/0138e01e-0ffb-11e3-8cdd-bcdc09410972_story.html\" target=\"_blank\" rel=\"noopener noreferrer\">President Obama underscored this sentiment\u003c/a>:\u003c/p>\n\u003cblockquote>\u003cp>\"In some ways, though, the securing of civil rights, voting rights, the eradication of legalized discrimination -- the very significance of these victories may have obscured a second goal of the march, for the men and women who gathered 50 years ago were not there in search of some abstract idea. They were there seeking jobs as well as justice not just the absence of oppression but the presence of economic opportunity. For what does it profit a man, Dr. King would ask, to sit at an integrated lunch counter if he can't afford the meal?\"\u003c/p>\u003c/blockquote>\n\u003cp>\u003ca href=\"http://ww2.kqed.org/lowdown/wp-content/uploads/sites/26/2015/01/unfinished-march-infographic-final.png\">\u003cimg class=\"alignright size-thumbnail wp-image-25036\" src=\"http://ww2.kqed.org/lowdown/wp-content/uploads/sites/26/2015/01/unfinished-march-infographic-final-160x929.png\" alt=\"unfinished-march-infographic-final\" width=\"160\" height=\"929\" srcset=\"https://ww2.kqed.org/app/uploads/sites/26/2015/01/unfinished-march-infographic-final-160x929.png 160w, https://ww2.kqed.org/app/uploads/sites/26/2015/01/unfinished-march-infographic-final-240x1394.png 240w, https://ww2.kqed.org/app/uploads/sites/26/2015/01/unfinished-march-infographic-final-375x2178.png 375w, https://ww2.kqed.org/app/uploads/sites/26/2015/01/unfinished-march-infographic-final-520x3020.png 520w, https://ww2.kqed.org/app/uploads/sites/26/2015/01/unfinished-march-infographic-final.png 648w\" sizes=\"(max-width: 160px) 100vw, 160px\">\u003c/a>Even as an increasing number of African Americans today have successfully risen the class ladder, attaining prominent positions in politics, business, and academia, huge economic gaps remain between the black and white population in America. The majority of black children today grow up in areas of concentrated poverty and attend segregated, often severely under-resourced schools. The unemployment rate among African-Americans is double that of whites, and more than a third of black adults with jobs work for poverty level wages, according to the liberal-leaning \u003ca href=\"http://www.unfinishedmarch.com/\" target=\"_blank\" rel=\"noopener noreferrer\">Economic Policy Institute\u003c/a>. (The infographic, at right -- produced by EPI -- illustrates some of the March's \"unfinished business\").\u003c/p>\n\u003cp>Meanwhile, the black poverty rate is more than double that of whites, while average annual household income is almost $30,000 less, according to \u003ca href=\"http://www.pewsocialtrends.org/2013/08/22/race-demographics/\" target=\"_blank\" rel=\"noopener noreferrer\">Pew Research\u003c/a>. Today, African-Americans are also disproportionately represented in the nation's prison population: the rate of imprisonment among adult black males is more than six times that of white males, according to the \u003ca href=\"http://www.bjs.gov/index.cfm?ty=pbse&sid=40\" target=\"_blank\" rel=\"noopener noreferrer\">U.S. Bureau of Justice Statistics\u003c/a>. Blacks are also victims of homicide at \u003ca href=\"http://projects.wsj.com/murderdata/?mg=inert-wsj#view=all\" target=\"_blank\" rel=\"noopener noreferrer\">significantly higher rates\u003c/a> than any other race.\u003c/p>\n\u003cp>The series of interactive charts below illustrates where certain primarily economic gaps between America's white and black population have narrowed, widened, or remained pretty much the same. This is obviously not a comprehensive list.\u003c/p>\n\u003cp>Most of the data was collected by \u003ca href=\"http://www.pewsocialtrends.org/2016/06/27/1-demographic-trends-and-economic-well-being/\" target=\"_blank\" rel=\"noopener noreferrer\">Pew Research\u003c/a>, which offers a more detailed analysis of some of these figures, including relative rates for Hispanics and Asians, where data are available.\u003c/p>\n\u003cp>\u003cem>Note: In 2015, there were about 46.3 million black people living in the United States, comprising more than 13 percent of the population, according to the\u003ca href=\"http://quickfacts.census.gov/qfd/states/00000.html\" target=\"_blank\" rel=\"noopener noreferrer\"> U.S. Census\u003c/a>. In contrast, there were roughly 195.5 million non-Hispanic whites in 2015, or roughly 61 percent of the population. Unless otherwise noted, the figures below include rates for total white and black populations (not just non-Hispanic).\u003c/em>\u003c/p>\n\u003cp> \u003c/p>\n\u003ch3>\u003cstrong>Where gaps have narrowed\u003c/strong>\u003c/h3>\n\u003cp>\u003c!-- iframe plugin v.4.3 wordpress.org/plugins/iframe/ -->\u003cbr>\n\u003ciframe src=\"https://cf.datawrapper.de/wuRoV/1/\" width=\"620\" height=\"620\" frameborder=\"0\" scrolling=\"yes\" class=\"iframe-class\">\u003c/iframe>\u003c/p>\n\u003cp>\u003c!-- iframe plugin v.4.3 wordpress.org/plugins/iframe/ -->\u003cbr>\n\u003ciframe src=\"//datawrapper.dwcdn.net/XZ4FB/24/\" frameborder=\"0\" allowtransparency=\"true\" allowfullscreen=\"allowfullscreen\" webkitallowfullscreen=\"webkitallowfullscreen\" mozallowfullscreen=\"mozallowfullscreen\" oallowfullscreen=\"oallowfullscreen\" msallowfullscreen=\"msallowfullscreen\" width=\"620\" height=\"620\" scrolling=\"yes\" class=\"iframe-class\">\u003c/iframe>\u003c/p>\n\u003cp>\u003c!-- iframe plugin v.4.3 wordpress.org/plugins/iframe/ -->\u003cbr>\n\u003ciframe src=\"//datawrapper.dwcdn.net/dXgY6/4/\" frameborder=\"0\" allowtransparency=\"true\" allowfullscreen=\"allowfullscreen\" webkitallowfullscreen=\"webkitallowfullscreen\" mozallowfullscreen=\"mozallowfullscreen\" oallowfullscreen=\"oallowfullscreen\" msallowfullscreen=\"msallowfullscreen\" width=\"620\" height=\"620\" scrolling=\"yes\" class=\"iframe-class\">\u003c/iframe>\u003c/p>\n\u003cp>\u003c!-- iframe plugin v.4.3 wordpress.org/plugins/iframe/ -->\u003cbr>\n\u003ciframe src=\"//datawrapper.dwcdn.net/q1sM1/5/\" width=\"620\" height=\"620\" frameborder=\"0\" allowfullscreen=\"allowfullscreen\" scrolling=\"yes\" class=\"iframe-class\">\u003c/iframe>\u003c/p>\n\u003ch3>Where gaps have widened or stayed the same\u003c/h3>\n\u003cp>\u003cspan style=\"font-family: Helvetica Neue,Arial;font-size: x-large\">Income and wealth\u003c/span>\u003c/p>\n\u003cp>One of the biggest indications of continued, and in some instances widening, economic inequality between blacks and whites is changing median net worth, with net worth defined as assets (what you own) minus debt (what you owe). In 1984, the median net worth of black households was less than 1/10th (9%) that of white households, according to \u003ca href=\"http://www.pewresearch.org/fact-tank/2014/12/12/racial-wealth-gaps-great-recession/\" target=\"_blank\" rel=\"noopener noreferrer\">Pew Research\u003c/a>. But since then, the gap has widened even further (as it has between white and Hispanic households). By 2013, the net worth of white households had risen to 13 times that of black households.\u003c/p>\n\u003cp>\u003ca href=\"http://ww2.kqed.org/lowdown/wp-content/uploads/sites/26/2017/01/household-income.png\">\u003cimg class=\"alignnone wp-image-25018 size-full\" src=\"https://ww2.kqed.org/app/uploads/sites/26/2017/01/household-income.png\" alt=\"household-income\" width=\"421\" height=\"560\" srcset=\"https://ww2.kqed.org/app/uploads/sites/26/2017/01/household-income.png 421w, https://ww2.kqed.org/app/uploads/sites/26/2017/01/household-income-160x213.png 160w, https://ww2.kqed.org/app/uploads/sites/26/2017/01/household-income-240x319.png 240w, https://ww2.kqed.org/app/uploads/sites/26/2017/01/household-income-375x499.png 375w\" sizes=\"(max-width: 421px) 100vw, 421px\">\u003c/a>\u003ca href=\"http://ww2.kqed.org/lowdown/wp-content/uploads/sites/26/2017/01/wealth.png\">\u003cimg class=\"alignnone wp-image-25021 size-full\" src=\"https://ww2.kqed.org/app/uploads/sites/26/2017/01/wealth.png\" alt=\"wealth\" width=\"310\" height=\"496\" srcset=\"https://ww2.kqed.org/app/uploads/sites/26/2017/01/wealth.png 310w, https://ww2.kqed.org/app/uploads/sites/26/2017/01/wealth-160x256.png 160w, https://ww2.kqed.org/app/uploads/sites/26/2017/01/wealth-240x384.png 240w\" sizes=\"(max-width: 310px) 100vw, 310px\">\u003c/a>\u003c/p>\n\u003cp>\u003c!-- iframe plugin v.4.3 wordpress.org/plugins/iframe/ -->\u003cbr>\n\u003ciframe src=\"//datawrapper.dwcdn.net/pns7D/6/\" width=\"620\" height=\"620\" frameborder=\"0\" allowfullscreen=\"allowfullscreen\" scrolling=\"yes\" class=\"iframe-class\">\u003c/iframe>\u003c/p>\n\u003cp>\u003c!-- iframe plugin v.4.3 wordpress.org/plugins/iframe/ -->\u003cbr>\n\u003ciframe src=\"//datawrapper.dwcdn.net/O8OeO/5/\" width=\"620\" height=\"620\" frameborder=\"0\" allowfullscreen=\"allowfullscreen\" scrolling=\"yes\" class=\"iframe-class\">\u003c/iframe>\u003c/p>\n\u003cp>\u003c!-- iframe plugin v.4.3 wordpress.org/plugins/iframe/ -->\u003cbr>\n\u003ciframe src=\"//datawrapper.dwcdn.net/urP8E/4/\" width=\"620\" height=\"620\" frameborder=\"0\" allowfullscreen=\"allowfullscreen\" scrolling=\"yes\" class=\"iframe-class\">\u003c/iframe>\u003c/p>\n\u003cp>[ad fullwidth]\u003c/p>\n\u003cp>[ad floatright]\u003c/p>\n",
"disqusIdentifier": "9030 http://blogs.kqed.org/lowdown/?p=9030",
"disqusUrl": "https://ww2.kqed.org/lowdown/2017/01/10/50-years-later-many-of-the-march-on-washingtons-goals-remain-elusive/",
"stats": {
"hasVideo": false,
"hasChartOrMap": true,
"hasAudio": false,
"hasPolis": false,
"wordCount": 1129,
"hasGoogleForm": false,
"hasGallery": false,
"hasHearkenModule": false,
"iframeSrcs": [
"https://cf.datawrapper.de/wuRoV/1/",
"//datawrapper.dwcdn.net/XZ4FB/24/",
"//datawrapper.dwcdn.net/dXgY6/4/",
"//datawrapper.dwcdn.net/q1sM1/5/",
"//datawrapper.dwcdn.net/pns7D/6/",
"//datawrapper.dwcdn.net/O8OeO/5/",
"//datawrapper.dwcdn.net/urP8E/4/"
],
"paragraphCount": 32
},
"modified": 1641593213,
"excerpt": "The Civil Rights Movement had clear goals for economic equality, many of which remain unmet. ",
"headData": {
"twImgId": "",
"twTitle": "",
"ogTitle": "",
"ogImgId": "",
"twDescription": "",
"description": "The Civil Rights Movement had clear goals for economic equality, many of which remain unmet. ",
"title": "Unfinished Business: Would Martin Luther King Be Satisfied with the Pace of Progress? - The Lowdown",
"ogDescription": "",
"schema": {
"@context": "https://schema.org",
"@type": "Article",
"headline": "Unfinished Business: Would Martin Luther King Be Satisfied with the Pace of Progress?",
"datePublished": "2017-01-10T18:00:05-08:00",
"dateModified": "2022-01-07T14:06:53-08:00",
"image": "https://cdn.kqed.org/wp-content/uploads/2020/02/KQED-OG-Image@1x.png"
}
},
"guestAuthors": [],
"slug": "50-years-later-many-of-the-march-on-washingtons-goals-remain-elusive",
"status": "publish",
"excludeFromSiteSearch": "Include",
"path": "/lowdown/9030/50-years-later-many-of-the-march-on-washingtons-goals-remain-elusive",
"audioTrackLength": null,
"parsedContent": [
{
"type": "contentString",
"content": "\u003cdiv class=\"post-body\">\u003cp>\u003cblockquote>\u003cp>“What good is having the right to sit at a lunch counter if you can’t afford to buy a hamburger?”\u003c/p>\n\u003cp>— Martin Luther King, Jr.\u003c/p>\u003c/blockquote>\n\u003cdiv>\n\u003caside class=\"alignright\">\n\u003cdiv>\u003cspan style=\"font-size: x-large\">\u003cspan style=\"color: #993300\">Teach with the Lowdown\u003c/span>\u003c/span>\u003c/div>\n\u003cp>\u003cimg class=\"alignnone wp-image-22868\" src=\"http://ww2.kqed.org/lowdown/wp-content/uploads/sites/26/2016/07/hands-e1469568663680-400x143.jpg\" width=\"340\" height=\"122\" srcset=\"https://ww2.kqed.org/app/uploads/sites/26/2016/07/hands-e1469568663680-400x143.jpg 400w, https://ww2.kqed.org/app/uploads/sites/26/2016/07/hands-e1469568663680-800x286.jpg 800w, https://ww2.kqed.org/app/uploads/sites/26/2016/07/hands-e1469568663680-768x274.jpg 768w, https://ww2.kqed.org/app/uploads/sites/26/2016/07/hands-e1469568663680.jpg 957w\" sizes=\"(max-width: 340px) 100vw, 340px\">Suggestions for nonfiction analysis, writing/discussion prompts and multimedia projects. Browse our lesson plan collection \u003ca href=\"https://ww2.kqed.org/lowdown/category/lesson-plans-and-guides/\" target=\"_blank\" rel=\"noopener noreferrer\">here\u003c/a>.\u003c/p>\n\u003cul>\n\u003cli>\u003ca href=\"http://ww2.kqed.org/lowdown/wp-content/uploads/sites/26/2015/01/MLK-Jr-plan.pdf\" target=\"_blank\" rel=\"noopener noreferrer\">Lesson Plan: Unfinished Business (PDF)\u003c/a>\u003c/li>\n\u003c/ul>\n\u003c/aside>\n\u003c/div>\n\u003cp> \u003c/p>\n\u003cp>In late August 1963, on the 100th anniversary of the \u003ca href=\"http://www.archives.gov/exhibits/featured_documents/emancipation_proclamation/\" target=\"_blank\" rel=\"noopener noreferrer\">Emancipation Proclamation\u003c/a>, a quarter million demonstrators converged on the National Mall in the nation's capital to partake in what would become one of the largest human rights demonstrations in United States history.\u003c/p>\n\u003cp>The March on Washington for Jobs and Freedom drew a majority African American presence. Demonstrators arrived by the busload -- many from Southern states where Jim Crow segregation policies were still alive and well -- to demand an improvement in civil and economic rights. They marched peacefully towards the Lincoln Memorial, where they listened to the impassioned speeches of some of most outspoken civil rights leaders of the day. Most famously, Martin Luther King, Jr. delivered his seminal \u003ca href=\"http://www.americanrhetoric.com/speeches/mlkihaveadream.htm\" target=\"_blank\" rel=\"noopener noreferrer\">\"I Have a Dream\"\u003c/a> address.\u003c/p>\n\u003cp>King and other leaders of the march articulated a clear, carefully crafted set of demands, underscoring, as King stated, \"the fierce urgency of now.\"\u003c!--more-->\u003c/p>\n\u003cp>\u003ca href=\"http://ww2.kqed.org/lowdown/wp-content/uploads/sites/26/2013/08/MarchDemands.jpg\">\u003cimg class=\"alignright wp-image-9119 size-medium\" src=\"http://ww2.kqed.org/lowdown/wp-content/uploads/sites/26/2013/08/MarchDemands-300x365.jpg\" alt=\"\" width=\"246\" height=\"300\">\u003c/a>The mandates included the passage of new binding pieces of civil rights legislation that, among other things, guaranteed voting rights, increased political representation in Congress, eliminated school segregation and imposed heavy financial and legal penalties against agencies that violated the Equal Protection Clause.\u003c/p>\n\u003cp>But equally important, although often overshadowed, was the demand for greater economic equality. The movement's leaders called for a federal jobs program and a nearly two-fold increase in the national minimum wage, to $2 an hour (equivalent to about $13 today). Leaders also urged federal enforcement to curtail employment discrimination, as well as policies and programs that would increase access to decent housing and adequate public accommodations.\u003c/p>\n\u003cp>In \u003ca href=\"https://templatelab.com/dream-speech/\">his speech \u003c/a>that day, King emphasized the urgency of these goals :\u003c/p>\n\u003cblockquote>\u003cp>\"But one hundred years later, the Negro still is not free. One hundred years later, the life of the Negro is still sadly crippled by the manacles of segregation and the chains of discrimination. One hundred years later, the Negro lives on a lonely island of poverty in the midst of a vast ocean of material prosperity. One hundred years later, the Negro is still languished in the corners of American society and finds himself an exile in his own land. And so we've come here today to dramatize a shameful condition.\"\u003c/p>\u003c/blockquote>\n\u003cp>\u003c/p>\u003cp>\u003c/p>\u003cp>\u003c/p>\n\u003cp>The ongoing actions of the Civil Rights Movement were indisputably successful in prompting tremendous progress: less than a year later, congress passed the sweeping \u003ca href=\"http://www.ourdocuments.gov/doc.php?flash=true&doc=97\" target=\"_blank\" rel=\"noopener noreferrer\">Civil Rights Act of 1964\u003c/a>, and by 1965, the \u003ca href=\"http://www.justice.gov/crt/about/vot/intro/intro_b.php\" target=\"_blank\" rel=\"noopener noreferrer\">Voting Rights Act\u003c/a> was signed into law as well (although it was largely dismantled by the Supreme Court in 2013). Today, 50 years hence, the results of these victories, and the subsequent gains in equality are evident, marked not least by the election of America's first black president, a milestone nearly unimaginable in King's day.\u003c/p>\n\u003cp>Today, high school graduation rates among blacks have nearly quadrupled. Black voter participation has grown markedly, as has life expectancy.\u003c/p>\n\u003cp>On August 28, 2013, thousands gathered on the National Mall to commemorate the 1963 march and the tremendous impact it had. Some of the featured speakers, though, noted that many of the 1963 demands have still not been met, particularly along economic lines. Standing in the footsteps of King at the Lincoln Memorial, \u003ca href=\"http://www.washingtonpost.com/politics/transcript-president-obamas-speech-on-the-50th-anniversary-of-the-march-on-washington/2013/08/28/0138e01e-0ffb-11e3-8cdd-bcdc09410972_story.html\" target=\"_blank\" rel=\"noopener noreferrer\">President Obama underscored this sentiment\u003c/a>:\u003c/p>\n\u003cblockquote>\u003cp>\"In some ways, though, the securing of civil rights, voting rights, the eradication of legalized discrimination -- the very significance of these victories may have obscured a second goal of the march, for the men and women who gathered 50 years ago were not there in search of some abstract idea. They were there seeking jobs as well as justice not just the absence of oppression but the presence of economic opportunity. For what does it profit a man, Dr. King would ask, to sit at an integrated lunch counter if he can't afford the meal?\"\u003c/p>\u003c/blockquote>\n\u003cp>\u003ca href=\"http://ww2.kqed.org/lowdown/wp-content/uploads/sites/26/2015/01/unfinished-march-infographic-final.png\">\u003cimg class=\"alignright size-thumbnail wp-image-25036\" src=\"http://ww2.kqed.org/lowdown/wp-content/uploads/sites/26/2015/01/unfinished-march-infographic-final-160x929.png\" alt=\"unfinished-march-infographic-final\" width=\"160\" height=\"929\" srcset=\"https://ww2.kqed.org/app/uploads/sites/26/2015/01/unfinished-march-infographic-final-160x929.png 160w, https://ww2.kqed.org/app/uploads/sites/26/2015/01/unfinished-march-infographic-final-240x1394.png 240w, https://ww2.kqed.org/app/uploads/sites/26/2015/01/unfinished-march-infographic-final-375x2178.png 375w, https://ww2.kqed.org/app/uploads/sites/26/2015/01/unfinished-march-infographic-final-520x3020.png 520w, https://ww2.kqed.org/app/uploads/sites/26/2015/01/unfinished-march-infographic-final.png 648w\" sizes=\"(max-width: 160px) 100vw, 160px\">\u003c/a>Even as an increasing number of African Americans today have successfully risen the class ladder, attaining prominent positions in politics, business, and academia, huge economic gaps remain between the black and white population in America. The majority of black children today grow up in areas of concentrated poverty and attend segregated, often severely under-resourced schools. The unemployment rate among African-Americans is double that of whites, and more than a third of black adults with jobs work for poverty level wages, according to the liberal-leaning \u003ca href=\"http://www.unfinishedmarch.com/\" target=\"_blank\" rel=\"noopener noreferrer\">Economic Policy Institute\u003c/a>. (The infographic, at right -- produced by EPI -- illustrates some of the March's \"unfinished business\").\u003c/p>\n\u003cp>Meanwhile, the black poverty rate is more than double that of whites, while average annual household income is almost $30,000 less, according to \u003ca href=\"http://www.pewsocialtrends.org/2013/08/22/race-demographics/\" target=\"_blank\" rel=\"noopener noreferrer\">Pew Research\u003c/a>. Today, African-Americans are also disproportionately represented in the nation's prison population: the rate of imprisonment among adult black males is more than six times that of white males, according to the \u003ca href=\"http://www.bjs.gov/index.cfm?ty=pbse&sid=40\" target=\"_blank\" rel=\"noopener noreferrer\">U.S. Bureau of Justice Statistics\u003c/a>. Blacks are also victims of homicide at \u003ca href=\"http://projects.wsj.com/murderdata/?mg=inert-wsj#view=all\" target=\"_blank\" rel=\"noopener noreferrer\">significantly higher rates\u003c/a> than any other race.\u003c/p>\n\u003cp>The series of interactive charts below illustrates where certain primarily economic gaps between America's white and black population have narrowed, widened, or remained pretty much the same. This is obviously not a comprehensive list.\u003c/p>\n\u003cp>Most of the data was collected by \u003ca href=\"http://www.pewsocialtrends.org/2016/06/27/1-demographic-trends-and-economic-well-being/\" target=\"_blank\" rel=\"noopener noreferrer\">Pew Research\u003c/a>, which offers a more detailed analysis of some of these figures, including relative rates for Hispanics and Asians, where data are available.\u003c/p>\n\u003cp>\u003cem>Note: In 2015, there were about 46.3 million black people living in the United States, comprising more than 13 percent of the population, according to the\u003ca href=\"http://quickfacts.census.gov/qfd/states/00000.html\" target=\"_blank\" rel=\"noopener noreferrer\"> U.S. Census\u003c/a>. In contrast, there were roughly 195.5 million non-Hispanic whites in 2015, or roughly 61 percent of the population. Unless otherwise noted, the figures below include rates for total white and black populations (not just non-Hispanic).\u003c/em>\u003c/p>\n\u003cp> \u003c/p>\n\u003ch3>\u003cstrong>Where gaps have narrowed\u003c/strong>\u003c/h3>\n\u003cp>\u003c!-- iframe plugin v.4.3 wordpress.org/plugins/iframe/ -->\u003cbr>\n\u003ciframe src=\"https://cf.datawrapper.de/wuRoV/1/\" width=\"620\" height=\"620\" frameborder=\"0\" scrolling=\"yes\" class=\"iframe-class\">\u003c/iframe>\u003c/p>\n\u003cp>\u003c!-- iframe plugin v.4.3 wordpress.org/plugins/iframe/ -->\u003cbr>\n\u003ciframe src=\"//datawrapper.dwcdn.net/XZ4FB/24/\" frameborder=\"0\" allowtransparency=\"true\" allowfullscreen=\"allowfullscreen\" webkitallowfullscreen=\"webkitallowfullscreen\" mozallowfullscreen=\"mozallowfullscreen\" oallowfullscreen=\"oallowfullscreen\" msallowfullscreen=\"msallowfullscreen\" width=\"620\" height=\"620\" scrolling=\"yes\" class=\"iframe-class\">\u003c/iframe>\u003c/p>\n\u003cp>\u003c!-- iframe plugin v.4.3 wordpress.org/plugins/iframe/ -->\u003cbr>\n\u003ciframe src=\"//datawrapper.dwcdn.net/dXgY6/4/\" frameborder=\"0\" allowtransparency=\"true\" allowfullscreen=\"allowfullscreen\" webkitallowfullscreen=\"webkitallowfullscreen\" mozallowfullscreen=\"mozallowfullscreen\" oallowfullscreen=\"oallowfullscreen\" msallowfullscreen=\"msallowfullscreen\" width=\"620\" height=\"620\" scrolling=\"yes\" class=\"iframe-class\">\u003c/iframe>\u003c/p>\n\u003cp>\u003c!-- iframe plugin v.4.3 wordpress.org/plugins/iframe/ -->\u003cbr>\n\u003ciframe src=\"//datawrapper.dwcdn.net/q1sM1/5/\" width=\"620\" height=\"620\" frameborder=\"0\" allowfullscreen=\"allowfullscreen\" scrolling=\"yes\" class=\"iframe-class\">\u003c/iframe>\u003c/p>\n\u003ch3>Where gaps have widened or stayed the same\u003c/h3>\n\u003cp>\u003cspan style=\"font-family: Helvetica Neue,Arial;font-size: x-large\">Income and wealth\u003c/span>\u003c/p>\n\u003cp>One of the biggest indications of continued, and in some instances widening, economic inequality between blacks and whites is changing median net worth, with net worth defined as assets (what you own) minus debt (what you owe). In 1984, the median net worth of black households was less than 1/10th (9%) that of white households, according to \u003ca href=\"http://www.pewresearch.org/fact-tank/2014/12/12/racial-wealth-gaps-great-recession/\" target=\"_blank\" rel=\"noopener noreferrer\">Pew Research\u003c/a>. But since then, the gap has widened even further (as it has between white and Hispanic households). By 2013, the net worth of white households had risen to 13 times that of black households.\u003c/p>\n\u003cp>\u003ca href=\"http://ww2.kqed.org/lowdown/wp-content/uploads/sites/26/2017/01/household-income.png\">\u003cimg class=\"alignnone wp-image-25018 size-full\" src=\"https://ww2.kqed.org/app/uploads/sites/26/2017/01/household-income.png\" alt=\"household-income\" width=\"421\" height=\"560\" srcset=\"https://ww2.kqed.org/app/uploads/sites/26/2017/01/household-income.png 421w, https://ww2.kqed.org/app/uploads/sites/26/2017/01/household-income-160x213.png 160w, https://ww2.kqed.org/app/uploads/sites/26/2017/01/household-income-240x319.png 240w, https://ww2.kqed.org/app/uploads/sites/26/2017/01/household-income-375x499.png 375w\" sizes=\"(max-width: 421px) 100vw, 421px\">\u003c/a>\u003ca href=\"http://ww2.kqed.org/lowdown/wp-content/uploads/sites/26/2017/01/wealth.png\">\u003cimg class=\"alignnone wp-image-25021 size-full\" src=\"https://ww2.kqed.org/app/uploads/sites/26/2017/01/wealth.png\" alt=\"wealth\" width=\"310\" height=\"496\" srcset=\"https://ww2.kqed.org/app/uploads/sites/26/2017/01/wealth.png 310w, https://ww2.kqed.org/app/uploads/sites/26/2017/01/wealth-160x256.png 160w, https://ww2.kqed.org/app/uploads/sites/26/2017/01/wealth-240x384.png 240w\" sizes=\"(max-width: 310px) 100vw, 310px\">\u003c/a>\u003c/p>\n\u003cp>\u003c!-- iframe plugin v.4.3 wordpress.org/plugins/iframe/ -->\u003cbr>\n\u003ciframe src=\"//datawrapper.dwcdn.net/pns7D/6/\" width=\"620\" height=\"620\" frameborder=\"0\" allowfullscreen=\"allowfullscreen\" scrolling=\"yes\" class=\"iframe-class\">\u003c/iframe>\u003c/p>\n\u003cp>\u003c!-- iframe plugin v.4.3 wordpress.org/plugins/iframe/ -->\u003cbr>\n\u003ciframe src=\"//datawrapper.dwcdn.net/O8OeO/5/\" width=\"620\" height=\"620\" frameborder=\"0\" allowfullscreen=\"allowfullscreen\" scrolling=\"yes\" class=\"iframe-class\">\u003c/iframe>\u003c/p>\n\u003cp>\u003c!-- iframe plugin v.4.3 wordpress.org/plugins/iframe/ -->\u003cbr>\n\u003ciframe src=\"//datawrapper.dwcdn.net/urP8E/4/\" width=\"620\" height=\"620\" frameborder=\"0\" allowfullscreen=\"allowfullscreen\" scrolling=\"yes\" class=\"iframe-class\">\u003c/iframe>\u003c/p>\n\u003cp>\u003c/p>\u003c/div>",
"attributes": {
"named": {},
"numeric": []
}
},
{
"type": "component",
"content": "",
"name": "ad",
"attributes": {
"named": {
"label": "fullwidth"
},
"numeric": [
"fullwidth"
]
}
},
{
"type": "contentString",
"content": "\u003cdiv class=\"post-body\">\u003cp>\u003c/p>\n\u003cp>\u003c/p>\u003c/div>",
"attributes": {
"named": {},
"numeric": []
}
},
{
"type": "component",
"content": "",
"name": "ad",
"attributes": {
"named": {
"label": "floatright"
},
"numeric": [
"floatright"
]
}
},
{
"type": "contentString",
"content": "\u003cdiv class=\"post-body\">\u003cp>\u003c/p>\n\u003c/div>\u003c/p>",
"attributes": {
"named": {},
"numeric": []
}
}
],
"link": "/lowdown/9030/50-years-later-many-of-the-march-on-washingtons-goals-remain-elusive",
"authors": [
"1263"
],
"categories": [
"lowdown_391",
"lowdown_256",
"lowdown_2390",
"lowdown_2399"
],
"tags": [
"lowdown_50",
"lowdown_402",
"lowdown_2337",
"lowdown_401",
"lowdown_53"
],
"featImg": "lowdown_9232",
"label": "lowdown"
},
"lowdown_7912": {
"type": "posts",
"id": "lowdown_7912",
"meta": {
"index": "posts_1716263798",
"site": "lowdown",
"id": "7912",
"score": null,
"sort": [
1482292825000
]
},
"parent": 0,
"labelTerm": {
"site": "lowdown"
},
"blocks": [],
"publishDate": 1482292825,
"format": "aside",
"disqusTitle": "The High Cost of Cheap Fashion (with Lesson Plan)",
"title": "The High Cost of Cheap Fashion (with Lesson Plan)",
"headTitle": "The Lowdown | KQED News",
"content": "\u003cp>\u003c!--more-->\u003c/p>\n\u003cp>https://youtu.be/RKXdLIr4GtE\u003c/p>\n\u003cdiv>\n\u003caside class=\"alignright\">\n\u003cdiv>\u003cspan style=\"font-size: x-large\">\u003cspan style=\"color: #993300\">Teach with the Lowdown\u003c/span>\u003c/span>\u003c/div>\n\u003cp>\u003cimg class=\"alignnone wp-image-22868\" src=\"http://ww2.kqed.org/lowdown/wp-content/uploads/sites/26/2016/07/hands-e1469568663680-400x143.jpg\" width=\"340\" height=\"122\" srcset=\"https://ww2.kqed.org/app/uploads/sites/26/2016/07/hands-e1469568663680-400x143.jpg 400w, https://ww2.kqed.org/app/uploads/sites/26/2016/07/hands-e1469568663680-800x286.jpg 800w, https://ww2.kqed.org/app/uploads/sites/26/2016/07/hands-e1469568663680-768x274.jpg 768w, https://ww2.kqed.org/app/uploads/sites/26/2016/07/hands-e1469568663680.jpg 957w\" sizes=\"(max-width: 340px) 100vw, 340px\">Suggestions for nonfiction analysis, writing/discussion prompts and multimedia projects. Browse our lesson plan collection \u003ca href=\"https://ww2.kqed.org/lowdown/category/lesson-plans-and-guides/\" target=\"_blank\">here\u003c/a>.\u003c/p>\n\u003cul>\n\u003cli>\u003ca href=\"http://ww2.kqed.org/lowdown/wp-content/uploads/sites/26/2015/05/The-Global-Textile-Economy_Ko.pdf\" target=\"_blank\">Lesson Plan: The Global Apparel Industry (PDF)\u003c/a>\u003c/li>\n\u003c/ul>\n\u003c/aside>\n\u003c/div>\n\u003cp>\u003cem>Note: This is an updated version of a post originally published in 2013.\u003c/em>\u003c/p>\n\u003cp>Everyone likes a good deal, especially during the cutthroat holiday shopping season.\u003c/p>\n\u003cp>And that's why you've likely flocked to clothing stores like H&M and Old Navy, where the selection is expansive and astoundingly inexpensive.\u003c/p>\n\u003cp>[ad fullwidth]\u003c/p>\n\u003cp>T-shirts for five bucks; jeans and dresses for under 20. It’s almost as though you can’t afford not to buy it.\u003c/p>\n\u003cp>Americans, on average, now \u003ca href=\"https://www.bls.gov/spotlight/2012/fashion/\" target=\"_blank\">spend \u003c/a>a significantly smaller portion of their incomes on clothing, yet have more expansive wardrobes than ever before.\u003c/p>\n\u003cp>Buying a whole new wardrobe is almost cheaper than the cost of washing your old one (a bit of an exaggeration, but not all that far off).\u003c/p>\n\u003cp>But those deals don't come without a catch. \u003c!--more-->\u003c/p>\n\u003ch4>\u003cstrong>Out of sight, out of mind\u003c/strong>\u003c/h4>\n\u003cp>One consequence of cheap clothing received international attention in 2013, when an eight-story garment factory in Bangladesh collapsed, killing more than 1,100 workers who were manufacturing clothing for American and European retailers.\u003c/p>\n\u003cp>Bangladeshi garment workers, the majority of them women, receive among the world’s lowest wages. At the time of the disaster, the minimum wage was roughly $38 per month. In November 2013, amid local labor unrest and international pressure, \u003ca href=\"https://www.bloomberg.com/news/articles/2013-11-13/bangladesh-garment-factories-to-stay-shut-amid-worker-protests\" target=\"_blank\">it was increased\u003c/a> to $68 per month.\u003c/p>\n\u003cfigure id=\"attachment_7916\" class=\"wp-caption alignright\" style=\"max-width: 800px\">\u003ca href=\"http://ww2.kqed.org/lowdown/wp-content/uploads/sites/26/2013/05/Dhaka_Savar_Building_Collapse.jpg\">\u003cimg class=\"wp-image-7916 size-medium\" src=\"http://ww2.kqed.org/lowdown/wp-content/uploads/sites/26/2013/05/Dhaka_Savar_Building_Collapse-800x534.jpg\" alt=\"The collapsed Rana Plaza in Bangladesh, where more than 1,100 garment workers were killed in 2013. (Wikipedia)\" width=\"800\" height=\"534\" srcset=\"https://ww2.kqed.org/app/uploads/sites/26/2013/05/Dhaka_Savar_Building_Collapse.jpg 800w, https://ww2.kqed.org/app/uploads/sites/26/2013/05/Dhaka_Savar_Building_Collapse-400x267.jpg 400w, https://ww2.kqed.org/app/uploads/sites/26/2013/05/Dhaka_Savar_Building_Collapse-768x513.jpg 768w, https://ww2.kqed.org/app/uploads/sites/26/2013/05/Dhaka_Savar_Building_Collapse-320x214.jpg 320w\" sizes=\"(max-width: 800px) 100vw, 800px\">\u003c/a>\u003cfigcaption class=\"wp-caption-text\">The collapsed Rana Plaza in Bangladesh, where more than 1,100 garment workers died in 2013. (Wikipedia)\u003c/figcaption>\u003c/figure>\n\u003cp>Rana Plaza, the building near Dhaka that collapsed, was owned by a local politician who illegally built three additional floors onto the structure and installed heavy textile machinery. Even after large cracks were found in the walls the day before the disaster, factory supervisors – under pressure to fill orders - ignored warnings to vacate the building, and ordered workers to continue production.\u003c/p>\n\u003cp>This was the deadliest industrial disaster in Bangladesh’s history, but certainly not the only one in recent memory. Just the year before, \u003ca href=\"http://www.nytimes.com/2012/12/18/world/asia/bangladesh-factory-fire-caused-by-gross-negligence.html\">112 garment workers were killed\u003c/a> in a factory fire near Dhaka, when supervisors ignored fire alarms and prevented workers from leaving their sewing machines.\u003c/p>\n\u003ch4>\u003cstrong> Why Bangladesh?\u003c/strong>\u003c/h4>\n\u003cp>Labor and production costs are dirt cheap. Making clothes in Bangladesh costs less than just about anywhere else in the world.\u003c/p>\n\u003cp>Take a quick look at the tags on your clothing. There's a good chance at least some of them were made in Bangladesh. Since the 1990s, Bangladesh’s ready-made garment industry has exploded, and now generates close to $20 billion a year in exports. It's now one of the \u003ca href=\"http://www.worldbank.org/en/news/press-release/2015/10/21/international-regional-trade-is-key-to-faster-growth-for-bangladesh-says-new-world-bank-report\" target=\"_blank\">largest apparel exporters in the world\u003c/a>, second only to China (which still far outpaces any other nation in exports, but has lost a good deal of contracts to Bangladesh, where production costs are even cheaper). Bangladesh is currently the \u003ca href=\"http://fivethirtyeight.com/datalab/where-the-u-s-gets-its-clothing-one-year-after-the-bangladesh-factory-collapse/\" target=\"_blank\">third-largest apparel importer\u003c/a> to the United States, after China and Vietnam.\u003c/p>\n\u003cp>Meanwhile, employment in the U.S. apparel manufacturing industry has declined by more than 80 percent in the last two decades, from about 900,000 to 150,000 jobs, according to the \u003ca href=\"https://www.bls.gov/spotlight/2012/fashion/\" target=\"_blank\">Bureau of Labor Statistics\u003c/a>. As recently as 1980, 70 percent of clothes sold in the United States were made domestically. Today, that's down to about 2 percent.\u003c/p>\n\u003cp>[\u003ca href=\"http://ww2.kqed.org/lowdown/2013/05/24/madeinamerica/\" target=\"_blank\">RELATED: Why America Stopped Making Its Own Clothes\u003c/a>]\u003c/p>\n\u003ch4>\u003cstrong>Fast Fashion\u003c/strong>\u003c/h4>\n\u003cp>Most large clothing brands used to have seasonal fashion lines that would remain on the shelves for at least few months. But go into an H&M store today and then go back again a week or two later, and you’ll likely find a completely changed inventory. This is the concept behind fast fashion, pioneered over the last 15 years by European brands like H&M and Zana, and to a lesser extent, The Gap, Benetton, Urban Outfitters and Forever 21. The idea is to capture the latest design trends and whisk them from the catwalk to the store, producing trendy but generally low-quality garments in the fastest, most cost-effective way possible.\u003c/p>\n\u003cp>In an interview with \u003ca href=\"http://www.npr.org/2013/03/11/174013774/in-trendy-world-of-fast-fashion-styles-arent-made-to-last\">NPR\u003c/a>, Elizabeth Cline, author of \u003cem>\u003ca href=\"http://www.overdressedthebook.com/\">Overdressed: The Shockingly High Price of Fast Fashion\u003c/a>\u003c/em>, explained that stores like H&M produce hundreds of millions of garments per year. \"They put a small markup on the clothes and earn their profit out of selling an ocean of clothing,\" she says. H&M has about 2,800 stores in 48 markets and it's growing fast, especially in China and the United States.\u003c/p>\n\u003cp>[soundcloud url=\"https://api.soundcloud.com/tracks/170511842\" params=\"color=ff5500&auto_play=false&hide_related=false&show_comments=true&show_user=true&show_reposts=false\" width=\"100%\" height=\"166\" iframe=\"true\" /]\u003c/p>\n\u003cp>But with companies making billions and consumers getting great deals, the cost has to be absorbed somewhere. And that’s where cheap factories in developing countries like Bangladesh come into the fray, often to the detriment of workers and the \u003ca href=\"http://www.esquire.com/style/news/a50655/fast-fashion-environment/\" target=\"_blank\"> environment\u003c/a>.\u003c/p>\n\u003ch4>\u003cstrong>So who’s to blame?\u003c/strong>\u003c/h4>\n\u003cp>There’s no simple answer. It’s easy to blame the big clothing companies, many of whom reap enormous profits, fully aware of the decrepit conditions where their products are made. After the huge factory fire last November, a number of major clothing brands and retailers rejected a union-sponsored proposal to improve safety throughout Bangladesh's garment industry, the \u003ca href=\"http://www.cnbc.com/id/100679902\">Associated Press reported\u003c/a>. Instead, companies expanded a patchwork system of private audits and training, which labor groups allege do little and lack any real enforcement mechanism.\u003c/p>\n\u003cp>The textile factories are almost all locally owned and managed, allowing Western retailers to maintain a distance from them and turn a blind eye to factory-floor conditions. And blame, of course, can also be directed at the factory owners and Bangladeshi government officials who knowingly exploit and endanger the workforce.\u003c/p>\n\u003cp>[\u003ca href=\"http://ww2.kqed.org/lowdown/2015/03/18/making-your-t-shirt-a-journey-around-the-world/\" target=\"_blank\">RELATED: Where Was Your T-Shirt Made?\u003c/a>]\u003c/p>\n\u003cp>In the wake of the Rana Plaza disaster, a growing number of major designers, including H&M, Zana and Benetton, signed on to a legally binding agreement to pay for major safety improvements. And since then,\u003ca href=\"http://in%20the%20Bangladeshi%20factories%20where%20their%20clothing%20is%20made,\" target=\"_blank\"> fire and safety assessments\u003c/a> have been conducted in several thousand Bangladeshi factories where their clothing is made.\u003c/p>\n\u003cp>But only a \u003ca href=\"http://bangladeshaccord.org/signatories/\" target=\"_blank\">small group of American companies\u003c/a> signed on.\u003c/p>\n\u003cp>The Gap, Wal-Mart, Sears and Target are among the major American clothing retailers that balked at joining the accord, despite relying heavily on Bangladeshi suppliers. Some companies counter that they have their own safety improvement measures in place, while others, like Disney, have announced that they will leave Bangladesh altogether.\u003c/p>\n\u003cp>Western companies are often quick to argue that although wages and working conditions in Bangladesh are far from ideal, they’re a lot better than they would be if the garment industry wasn’t there at all. Western demand has created jobs and training for millions of people, particularly women, offering a greater degree of independence and economic security. Since the arrival of textile manufacturing in the late 1970s, Bangladesh’s \u003ca href=\"http://data.worldbank.org/country/bangladesh\">poverty rate\u003c/a> has fallen from about 70 percent to less than 40 percent. And even though \u003ca href=\"http://www.bbc.co.uk/news/world-south-asia-12650940\">about half the country\u003c/a> still lives on less than a dollar a day, income has risen markedly for large swaths of the population. Health and education have improved incrementally as well.\u003c/p>\n\u003ch4>\u003cstrong>What role do you play?\u003c/strong>\u003c/h4>\n\u003cp>And then there’s us. Consumers in Western nations now buy more clothes than ever before, according to Cline, particularly cheap clothes that aren’t made to last. Factory conditions would likely improve if consumers were to demand it, especially if we were willing to pay more for our clothes and absorb some of the costs .\u003c/p>\n\u003cp>But that's easier said than done. It’s one thing to be horrified by Bangladesh’s recent tragedy and to hope conditions improve. It’s quite another thing, though, to choose to pay more for clothes that were ethically manufactured. With the exception of the worst tragedies that grab our attention, most of the inequities in this system are out of sight, out of mind. Which makes it all too easy to pretend they don’t exist.\u003c/p>\n\u003cp>Which begs the question: How much more would you be willing to pay to know your clothes were being produced in an ethical manner?\u003c/p>\n\u003cp>\u003ca href=\"http://www.npr.org/blogs/money/2013/05/14/184019151/episode-458-bangladeshs-t-shirt-economy\" target=\"_blank\">NPR's Planet Money\u003c/a> show is documenting how T-shirts around the world are made.\u003c/p>\n\u003ch4>\u003cstrong>Resources to further explore this issue\u003cbr>\n\u003c/strong>\u003c/h4>\n\u003cp>\u003cem>Lesson plan suggestions for using this issue in the classroom\u003c/em>\u003c/p>\n\u003cul>\n\u003cli>\u003ca href=\"http://learning.blogs.nytimes.com/2013/05/14/corporate-irresponsibility-fashions-hidden-cost-in-bangladeshs-garment-industry/\">NY Times Learning Network\u003c/a>\u003c/li>\n\u003cli>\u003ca href=\"http://www.pbs.org/newshour/extra/daily_videos/garment-industry-under-scrutiny-after-factory-collapse-in-bangladesh/\">PBS NewsHour Extra\u003c/a>\u003c/li>\n\u003c/ul>\n\u003cp>\u003cstrong>\u003cem>International labor rights advocacy groups\u003c/em>\u003c/strong>\u003c/p>\n\u003cul>\n\u003cli>\u003ca title=\"International Labor Rights Fund\" href=\"http://www.laborrights.org/sites/default/files/publications-and-resources/DeadlySecrets.pdf\">International Labor Rights Fund\u003c/a>\u003c/li>\n\u003cli>\u003ca title=\"Fair Labor Association\" href=\"http://www.fairlabor.org/\">Fair Labor Association\u003c/a>\u003c/li>\n\u003cli>\u003ca href=\"http://www.industriall-union.org/\">IndustriAll Global Union\u003c/a>\u003c/li>\n\u003cli>\u003ca title=\"International Labour Organization\" href=\"http://www.ilo.org/global/lang--en/index.htm\">International Labour Organization (a United Nations organization)\u003c/a>\u003c/li>\n\u003c/ul>\n\u003cp>\u003cem>Sites that help track product origins in the global supply chain\u003c/em>\u003c/p>\n\u003cul>\n\u003cli>\u003ca href=\"https://sourcemap.com/\">SourceMap\u003c/a>\u003c/li>\n\u003cli>\u003ca href=\"http://www.importgenius.com/\">ImportGenius \u003c/a>\u003c/li>\n\u003cli>\u003ca href=\"http://www.piers.com/\">Piers\u003c/a>\u003c/li>\n\u003c/ul>\n\u003cp>[ad floatright]\u003c/p>\n\u003cp>\u003cem>Corporate responsibility statements from some major clothing retailers\u003c/em>\u003c/p>\n\u003cul>\n\u003cli>\u003ca href=\"http://about.hm.com/AboutSection/en/About/Sustainability/Commitments/Be-Ethical.html\">H&M\u003c/a>\u003c/li>\n\u003cli>\u003ca href=\"http://www.gapinc.com/content/csr/html/OurResponsibility.html\">Gap\u003c/a>\u003c/li>\n\u003cli>\u003ca href=\"http://corporate.walmart.com/microsites/global-responsibility-report-2013/\">Wal-Mart\u003c/a>\u003c/li>\n\u003cli>\u003ca href=\"https://corporate.target.com/corporate-responsibility\">Target\u003c/a>\u003c/li>\n\u003c/ul>\n\n",
"disqusIdentifier": "7912 http://blogs.kqed.org/lowdown/?p=7912",
"disqusUrl": "https://ww2.kqed.org/lowdown/2016/12/20/who-made-your-t-shirt-the-hidden-cost-of-cheap-fashion/",
"stats": {
"hasVideo": false,
"hasChartOrMap": false,
"hasAudio": false,
"hasPolis": false,
"wordCount": 1503,
"hasGoogleForm": false,
"hasGallery": false,
"hasHearkenModule": false,
"iframeSrcs": [],
"paragraphCount": 38
},
"modified": 1482468692,
"excerpt": null,
"headData": {
"twImgId": "",
"twTitle": "",
"ogTitle": "",
"ogImgId": "",
"twDescription": "",
"description": "",
"title": "The High Cost of Cheap Fashion (with Lesson Plan) | KQED",
"ogDescription": "",
"schema": {
"@context": "https://schema.org",
"@type": "Article",
"headline": "The High Cost of Cheap Fashion (with Lesson Plan)",
"datePublished": "2016-12-20T20:00:25-08:00",
"dateModified": "2016-12-22T20:51:32-08:00",
"image": "https://cdn.kqed.org/wp-content/uploads/2020/02/KQED-OG-Image@1x.png"
}
},
"guestAuthors": [],
"slug": "who-made-your-t-shirt-the-hidden-cost-of-cheap-fashion",
"status": "publish",
"path": "/lowdown/7912/who-made-your-t-shirt-the-hidden-cost-of-cheap-fashion",
"audioTrackLength": null,
"parsedContent": [
{
"type": "contentString",
"content": "\u003cdiv class=\"post-body\">\u003cp>\u003cp>\u003c!--more-->\u003c/p>\u003c/p>\u003cp>\u003cspan class='utils-parseShortcode-shortcodes-__youtubeShortcode__embedYoutube'>\n \u003cspan class='utils-parseShortcode-shortcodes-__youtubeShortcode__embedYoutubeInside'>\n \u003ciframe\n loading='lazy'\n class='utils-parseShortcode-shortcodes-__youtubeShortcode__youtubePlayer'\n type='text/html'\n src='//www.youtube.com/embed/RKXdLIr4GtE'\n title='//www.youtube.com/embed/RKXdLIr4GtE'\n allowfullscreen='true'\n style='border:0;'>\u003c/iframe>\n \u003c/span>\n \u003c/span>\u003c/p>\u003cp>\u003cdiv>\n\u003caside class=\"alignright\">\n\u003cdiv>\u003cspan style=\"font-size: x-large\">\u003cspan style=\"color: #993300\">Teach with the Lowdown\u003c/span>\u003c/span>\u003c/div>\n\u003cp>\u003cimg class=\"alignnone wp-image-22868\" src=\"http://ww2.kqed.org/lowdown/wp-content/uploads/sites/26/2016/07/hands-e1469568663680-400x143.jpg\" width=\"340\" height=\"122\" srcset=\"https://ww2.kqed.org/app/uploads/sites/26/2016/07/hands-e1469568663680-400x143.jpg 400w, https://ww2.kqed.org/app/uploads/sites/26/2016/07/hands-e1469568663680-800x286.jpg 800w, https://ww2.kqed.org/app/uploads/sites/26/2016/07/hands-e1469568663680-768x274.jpg 768w, https://ww2.kqed.org/app/uploads/sites/26/2016/07/hands-e1469568663680.jpg 957w\" sizes=\"(max-width: 340px) 100vw, 340px\">Suggestions for nonfiction analysis, writing/discussion prompts and multimedia projects. Browse our lesson plan collection \u003ca href=\"https://ww2.kqed.org/lowdown/category/lesson-plans-and-guides/\" target=\"_blank\">here\u003c/a>.\u003c/p>\n\u003cul>\n\u003cli>\u003ca href=\"http://ww2.kqed.org/lowdown/wp-content/uploads/sites/26/2015/05/The-Global-Textile-Economy_Ko.pdf\" target=\"_blank\">Lesson Plan: The Global Apparel Industry (PDF)\u003c/a>\u003c/li>\n\u003c/ul>\n\u003c/aside>\n\u003c/div>\n\u003cp>\u003cem>Note: This is an updated version of a post originally published in 2013.\u003c/em>\u003c/p>\n\u003cp>Everyone likes a good deal, especially during the cutthroat holiday shopping season.\u003c/p>\n\u003cp>And that's why you've likely flocked to clothing stores like H&M and Old Navy, where the selection is expansive and astoundingly inexpensive.\u003c/p>\n\u003cp>\u003c/p>\u003c/div>",
"attributes": {
"named": {},
"numeric": []
}
},
{
"type": "component",
"content": "",
"name": "ad",
"attributes": {
"named": {
"label": "fullwidth"
},
"numeric": [
"fullwidth"
]
}
},
{
"type": "contentString",
"content": "\u003cdiv class=\"post-body\">\u003cp>\u003c/p>\n\u003cp>T-shirts for five bucks; jeans and dresses for under 20. It’s almost as though you can’t afford not to buy it.\u003c/p>\n\u003cp>Americans, on average, now \u003ca href=\"https://www.bls.gov/spotlight/2012/fashion/\" target=\"_blank\">spend \u003c/a>a significantly smaller portion of their incomes on clothing, yet have more expansive wardrobes than ever before.\u003c/p>\n\u003cp>Buying a whole new wardrobe is almost cheaper than the cost of washing your old one (a bit of an exaggeration, but not all that far off).\u003c/p>\n\u003cp>But those deals don't come without a catch. \u003c!--more-->\u003c/p>\n\u003ch4>\u003cstrong>Out of sight, out of mind\u003c/strong>\u003c/h4>\n\u003cp>One consequence of cheap clothing received international attention in 2013, when an eight-story garment factory in Bangladesh collapsed, killing more than 1,100 workers who were manufacturing clothing for American and European retailers.\u003c/p>\n\u003cp>Bangladeshi garment workers, the majority of them women, receive among the world’s lowest wages. At the time of the disaster, the minimum wage was roughly $38 per month. In November 2013, amid local labor unrest and international pressure, \u003ca href=\"https://www.bloomberg.com/news/articles/2013-11-13/bangladesh-garment-factories-to-stay-shut-amid-worker-protests\" target=\"_blank\">it was increased\u003c/a> to $68 per month.\u003c/p>\n\u003cfigure id=\"attachment_7916\" class=\"wp-caption alignright\" style=\"max-width: 800px\">\u003ca href=\"http://ww2.kqed.org/lowdown/wp-content/uploads/sites/26/2013/05/Dhaka_Savar_Building_Collapse.jpg\">\u003cimg class=\"wp-image-7916 size-medium\" src=\"http://ww2.kqed.org/lowdown/wp-content/uploads/sites/26/2013/05/Dhaka_Savar_Building_Collapse-800x534.jpg\" alt=\"The collapsed Rana Plaza in Bangladesh, where more than 1,100 garment workers were killed in 2013. (Wikipedia)\" width=\"800\" height=\"534\" srcset=\"https://ww2.kqed.org/app/uploads/sites/26/2013/05/Dhaka_Savar_Building_Collapse.jpg 800w, https://ww2.kqed.org/app/uploads/sites/26/2013/05/Dhaka_Savar_Building_Collapse-400x267.jpg 400w, https://ww2.kqed.org/app/uploads/sites/26/2013/05/Dhaka_Savar_Building_Collapse-768x513.jpg 768w, https://ww2.kqed.org/app/uploads/sites/26/2013/05/Dhaka_Savar_Building_Collapse-320x214.jpg 320w\" sizes=\"(max-width: 800px) 100vw, 800px\">\u003c/a>\u003cfigcaption class=\"wp-caption-text\">The collapsed Rana Plaza in Bangladesh, where more than 1,100 garment workers died in 2013. (Wikipedia)\u003c/figcaption>\u003c/figure>\n\u003cp>Rana Plaza, the building near Dhaka that collapsed, was owned by a local politician who illegally built three additional floors onto the structure and installed heavy textile machinery. Even after large cracks were found in the walls the day before the disaster, factory supervisors – under pressure to fill orders - ignored warnings to vacate the building, and ordered workers to continue production.\u003c/p>\n\u003cp>This was the deadliest industrial disaster in Bangladesh’s history, but certainly not the only one in recent memory. Just the year before, \u003ca href=\"http://www.nytimes.com/2012/12/18/world/asia/bangladesh-factory-fire-caused-by-gross-negligence.html\">112 garment workers were killed\u003c/a> in a factory fire near Dhaka, when supervisors ignored fire alarms and prevented workers from leaving their sewing machines.\u003c/p>\n\u003ch4>\u003cstrong> Why Bangladesh?\u003c/strong>\u003c/h4>\n\u003cp>Labor and production costs are dirt cheap. Making clothes in Bangladesh costs less than just about anywhere else in the world.\u003c/p>\n\u003cp>Take a quick look at the tags on your clothing. There's a good chance at least some of them were made in Bangladesh. Since the 1990s, Bangladesh’s ready-made garment industry has exploded, and now generates close to $20 billion a year in exports. It's now one of the \u003ca href=\"http://www.worldbank.org/en/news/press-release/2015/10/21/international-regional-trade-is-key-to-faster-growth-for-bangladesh-says-new-world-bank-report\" target=\"_blank\">largest apparel exporters in the world\u003c/a>, second only to China (which still far outpaces any other nation in exports, but has lost a good deal of contracts to Bangladesh, where production costs are even cheaper). Bangladesh is currently the \u003ca href=\"http://fivethirtyeight.com/datalab/where-the-u-s-gets-its-clothing-one-year-after-the-bangladesh-factory-collapse/\" target=\"_blank\">third-largest apparel importer\u003c/a> to the United States, after China and Vietnam.\u003c/p>\n\u003cp>Meanwhile, employment in the U.S. apparel manufacturing industry has declined by more than 80 percent in the last two decades, from about 900,000 to 150,000 jobs, according to the \u003ca href=\"https://www.bls.gov/spotlight/2012/fashion/\" target=\"_blank\">Bureau of Labor Statistics\u003c/a>. As recently as 1980, 70 percent of clothes sold in the United States were made domestically. Today, that's down to about 2 percent.\u003c/p>\n\u003cp>[\u003ca href=\"http://ww2.kqed.org/lowdown/2013/05/24/madeinamerica/\" target=\"_blank\">RELATED: Why America Stopped Making Its Own Clothes\u003c/a>]\u003c/p>\n\u003ch4>\u003cstrong>Fast Fashion\u003c/strong>\u003c/h4>\n\u003cp>Most large clothing brands used to have seasonal fashion lines that would remain on the shelves for at least few months. But go into an H&M store today and then go back again a week or two later, and you’ll likely find a completely changed inventory. This is the concept behind fast fashion, pioneered over the last 15 years by European brands like H&M and Zana, and to a lesser extent, The Gap, Benetton, Urban Outfitters and Forever 21. The idea is to capture the latest design trends and whisk them from the catwalk to the store, producing trendy but generally low-quality garments in the fastest, most cost-effective way possible.\u003c/p>\n\u003cp>In an interview with \u003ca href=\"http://www.npr.org/2013/03/11/174013774/in-trendy-world-of-fast-fashion-styles-arent-made-to-last\">NPR\u003c/a>, Elizabeth Cline, author of \u003cem>\u003ca href=\"http://www.overdressedthebook.com/\">Overdressed: The Shockingly High Price of Fast Fashion\u003c/a>\u003c/em>, explained that stores like H&M produce hundreds of millions of garments per year. \"They put a small markup on the clothes and earn their profit out of selling an ocean of clothing,\" she says. H&M has about 2,800 stores in 48 markets and it's growing fast, especially in China and the United States.\u003c/p>\n\u003cp>\u003c/p>\u003cp>\u003cdiv class='utils-parseShortcode-shortcodes-__shortcodes__shortcodeWrapper'>\n \u003ciframe width='100%' height='166'\n scrolling='no' frameborder='no'\n src='https://w.soundcloud.com/player/?url=https://api.soundcloud.com/tracks/170511842&visual=true&color=ff5500&auto_play=false&hide_related=false&show_comments=true&show_user=true&show_reposts=false'\n title='https://api.soundcloud.com/tracks/170511842'>\n \u003c/iframe>\n \u003c/div>\u003c/p>\u003cp>\u003c/p>\n\u003cp>But with companies making billions and consumers getting great deals, the cost has to be absorbed somewhere. And that’s where cheap factories in developing countries like Bangladesh come into the fray, often to the detriment of workers and the \u003ca href=\"http://www.esquire.com/style/news/a50655/fast-fashion-environment/\" target=\"_blank\"> environment\u003c/a>.\u003c/p>\n\u003ch4>\u003cstrong>So who’s to blame?\u003c/strong>\u003c/h4>\n\u003cp>There’s no simple answer. It’s easy to blame the big clothing companies, many of whom reap enormous profits, fully aware of the decrepit conditions where their products are made. After the huge factory fire last November, a number of major clothing brands and retailers rejected a union-sponsored proposal to improve safety throughout Bangladesh's garment industry, the \u003ca href=\"http://www.cnbc.com/id/100679902\">Associated Press reported\u003c/a>. Instead, companies expanded a patchwork system of private audits and training, which labor groups allege do little and lack any real enforcement mechanism.\u003c/p>\n\u003cp>The textile factories are almost all locally owned and managed, allowing Western retailers to maintain a distance from them and turn a blind eye to factory-floor conditions. And blame, of course, can also be directed at the factory owners and Bangladeshi government officials who knowingly exploit and endanger the workforce.\u003c/p>\n\u003cp>[\u003ca href=\"http://ww2.kqed.org/lowdown/2015/03/18/making-your-t-shirt-a-journey-around-the-world/\" target=\"_blank\">RELATED: Where Was Your T-Shirt Made?\u003c/a>]\u003c/p>\n\u003cp>In the wake of the Rana Plaza disaster, a growing number of major designers, including H&M, Zana and Benetton, signed on to a legally binding agreement to pay for major safety improvements. And since then,\u003ca href=\"http://in%20the%20Bangladeshi%20factories%20where%20their%20clothing%20is%20made,\" target=\"_blank\"> fire and safety assessments\u003c/a> have been conducted in several thousand Bangladeshi factories where their clothing is made.\u003c/p>\n\u003cp>But only a \u003ca href=\"http://bangladeshaccord.org/signatories/\" target=\"_blank\">small group of American companies\u003c/a> signed on.\u003c/p>\n\u003cp>The Gap, Wal-Mart, Sears and Target are among the major American clothing retailers that balked at joining the accord, despite relying heavily on Bangladeshi suppliers. Some companies counter that they have their own safety improvement measures in place, while others, like Disney, have announced that they will leave Bangladesh altogether.\u003c/p>\n\u003cp>Western companies are often quick to argue that although wages and working conditions in Bangladesh are far from ideal, they’re a lot better than they would be if the garment industry wasn’t there at all. Western demand has created jobs and training for millions of people, particularly women, offering a greater degree of independence and economic security. Since the arrival of textile manufacturing in the late 1970s, Bangladesh’s \u003ca href=\"http://data.worldbank.org/country/bangladesh\">poverty rate\u003c/a> has fallen from about 70 percent to less than 40 percent. And even though \u003ca href=\"http://www.bbc.co.uk/news/world-south-asia-12650940\">about half the country\u003c/a> still lives on less than a dollar a day, income has risen markedly for large swaths of the population. Health and education have improved incrementally as well.\u003c/p>\n\u003ch4>\u003cstrong>What role do you play?\u003c/strong>\u003c/h4>\n\u003cp>And then there’s us. Consumers in Western nations now buy more clothes than ever before, according to Cline, particularly cheap clothes that aren’t made to last. Factory conditions would likely improve if consumers were to demand it, especially if we were willing to pay more for our clothes and absorb some of the costs .\u003c/p>\n\u003cp>But that's easier said than done. It’s one thing to be horrified by Bangladesh’s recent tragedy and to hope conditions improve. It’s quite another thing, though, to choose to pay more for clothes that were ethically manufactured. With the exception of the worst tragedies that grab our attention, most of the inequities in this system are out of sight, out of mind. Which makes it all too easy to pretend they don’t exist.\u003c/p>\n\u003cp>Which begs the question: How much more would you be willing to pay to know your clothes were being produced in an ethical manner?\u003c/p>\n\u003cp>\u003ca href=\"http://www.npr.org/blogs/money/2013/05/14/184019151/episode-458-bangladeshs-t-shirt-economy\" target=\"_blank\">NPR's Planet Money\u003c/a> show is documenting how T-shirts around the world are made.\u003c/p>\n\u003ch4>\u003cstrong>Resources to further explore this issue\u003cbr>\n\u003c/strong>\u003c/h4>\n\u003cp>\u003cem>Lesson plan suggestions for using this issue in the classroom\u003c/em>\u003c/p>\n\u003cul>\n\u003cli>\u003ca href=\"http://learning.blogs.nytimes.com/2013/05/14/corporate-irresponsibility-fashions-hidden-cost-in-bangladeshs-garment-industry/\">NY Times Learning Network\u003c/a>\u003c/li>\n\u003cli>\u003ca href=\"http://www.pbs.org/newshour/extra/daily_videos/garment-industry-under-scrutiny-after-factory-collapse-in-bangladesh/\">PBS NewsHour Extra\u003c/a>\u003c/li>\n\u003c/ul>\n\u003cp>\u003cstrong>\u003cem>International labor rights advocacy groups\u003c/em>\u003c/strong>\u003c/p>\n\u003cul>\n\u003cli>\u003ca title=\"International Labor Rights Fund\" href=\"http://www.laborrights.org/sites/default/files/publications-and-resources/DeadlySecrets.pdf\">International Labor Rights Fund\u003c/a>\u003c/li>\n\u003cli>\u003ca title=\"Fair Labor Association\" href=\"http://www.fairlabor.org/\">Fair Labor Association\u003c/a>\u003c/li>\n\u003cli>\u003ca href=\"http://www.industriall-union.org/\">IndustriAll Global Union\u003c/a>\u003c/li>\n\u003cli>\u003ca title=\"International Labour Organization\" href=\"http://www.ilo.org/global/lang--en/index.htm\">International Labour Organization (a United Nations organization)\u003c/a>\u003c/li>\n\u003c/ul>\n\u003cp>\u003cem>Sites that help track product origins in the global supply chain\u003c/em>\u003c/p>\n\u003cul>\n\u003cli>\u003ca href=\"https://sourcemap.com/\">SourceMap\u003c/a>\u003c/li>\n\u003cli>\u003ca href=\"http://www.importgenius.com/\">ImportGenius \u003c/a>\u003c/li>\n\u003cli>\u003ca href=\"http://www.piers.com/\">Piers\u003c/a>\u003c/li>\n\u003c/ul>\n\u003cp>\u003c/p>\u003c/div>",
"attributes": {
"named": {},
"numeric": []
}
},
{
"type": "component",
"content": "",
"name": "ad",
"attributes": {
"named": {
"label": "floatright"
},
"numeric": [
"floatright"
]
}
},
{
"type": "contentString",
"content": "\u003cdiv class=\"post-body\">\u003cp>\u003c/p>\n\u003cp>\u003cem>Corporate responsibility statements from some major clothing retailers\u003c/em>\u003c/p>\n\u003cul>\n\u003cli>\u003ca href=\"http://about.hm.com/AboutSection/en/About/Sustainability/Commitments/Be-Ethical.html\">H&M\u003c/a>\u003c/li>\n\u003cli>\u003ca href=\"http://www.gapinc.com/content/csr/html/OurResponsibility.html\">Gap\u003c/a>\u003c/li>\n\u003cli>\u003ca href=\"http://corporate.walmart.com/microsites/global-responsibility-report-2013/\">Wal-Mart\u003c/a>\u003c/li>\n\u003cli>\u003ca href=\"https://corporate.target.com/corporate-responsibility\">Target\u003c/a>\u003c/li>\n\u003c/ul>\n\n\u003c/div>\u003c/p>",
"attributes": {
"named": {},
"numeric": []
}
}
],
"link": "/lowdown/7912/who-made-your-t-shirt-the-hidden-cost-of-cheap-fashion",
"authors": [
"1263"
],
"categories": [
"lowdown_245",
"lowdown_256",
"lowdown_491",
"lowdown_2402",
"lowdown_2399"
],
"tags": [
"lowdown_357",
"lowdown_359",
"lowdown_358",
"lowdown_2337",
"lowdown_360"
],
"featImg": "lowdown_8009",
"label": "lowdown"
},
"lowdown_16663": {
"type": "posts",
"id": "lowdown_16663",
"meta": {
"index": "posts_1716263798",
"site": "lowdown",
"id": "16663",
"score": null,
"sort": [
1480636803000
]
},
"parent": 0,
"labelTerm": {
"site": "lowdown"
},
"blocks": [],
"publishDate": 1480636803,
"format": "aside",
"disqusTitle": "Who Are California's Undocumented Immigrants? A Cartoon Explainer",
"title": "Who Are California's Undocumented Immigrants? A Cartoon Explainer",
"headTitle": "The Lowdown | KQED News",
"content": "\u003cp>Illegal! Unauthorized! Alien!\u003c/p>\n\u003cp>A lot of loaded terms are used to refer to the diverse group of more than 11 million immigrants who live in the United States without legal status. Although often relegated to the shadows of American society, this large population of undocumented residents were reluctantly thrust into the national spotlight during the long, bitter 2016 presidential campaign season. During his candidacy, Donald Trump consistently used fiery rhetoric, accusing undocumented immigrants of bringing crime and other problems into the country while taking valuable jobs from American citizens. He promised that as president, he'd order mass round-ups and mass deportations. \u003c/p>\n\u003cp>Since winning the election, Trump has somewhat narrowed the scope of some of his threats, now vowing to deport \"the more than 2 to 3 million criminal illegal immigrants.” But he continues to stand by many of his anti-immigrant original pledges, including punishing so-called \"\u003ca href=\"https://ww2.kqed.org/lowdown/2015/07/10/explainer-what-are-sanctuary-cities/\" target=\"_blank\">sanctuary cities\u003c/a>\" for not complying with federal immigration officials and rescinding President Obama's \u003ca href=\"https://www.uscis.gov/humanitarian/consideration-deferred-action-childhood-arrivals-daca\" target=\"_blank\">executive action\u003c/a> that protects hundreds of thousands of undocumented young people from deportation.\u003c/p>\n\u003cp>Not surprisingly, Trump's victory has provoked a heightened level of fear and uncertainty in undocumented communities across the country. In response, more than a dozen major cities, including San Francisco, Oakland, Los Angeles, Chicago and New York quickly reaffirmed their commitment to protecting documented residents and not cooperating with federal enforcement efforts (unless a serious crime is committed), even in the face of the president-elect's threats to withhold federal funding.\u003c/p>\n\u003cp>Nearly a quarter of the nation's undocumented population lives in California, which issued a similar pledge to its residents. The morning after the election, leaders of the state Assembly and Senate released a \u003ca href=\"http://sd24.senate.ca.gov/news/2016-11-09-joint-statement-california-legislative-leaders-result-presidential-election\" target=\"_blank\">statement\u003c/a> promising to maintain California as \"a refuge of justice and opportunity for people of all walks, talks, ages and aspirations ... California will defend its people and our progress.\"\u003c/p>\n\u003cp>[ad fullwidth]\u003c/p>\n\u003cp>So who are California's undocumented residents? Where do they come from? And what impact do they have on this state's massive economy?\u003c/p>\n\u003cp>Comic illustrator Andy Warner explains. \u003c/p>\n\u003cp>\u003ca href=\"https://ww2.kqed.org/lowdown/wp-content/uploads/sites/26/2016/12/Undocumented_color_full.jpg\">\u003cimg src=\"https://ww2.kqed.org/lowdown/wp-content/uploads/sites/26/2016/12/Undocumented_color_full.jpg\" alt=\"\" width=\"620\" height=\"2929\" class=\"alignnone size-full wp-image-30709\" srcset=\"https://ww2.kqed.org/app/uploads/sites/26/2016/12/Undocumented_color_full.jpg 620w, https://ww2.kqed.org/app/uploads/sites/26/2016/12/Undocumented_color_full-160x756.jpg 160w, https://ww2.kqed.org/app/uploads/sites/26/2016/12/Undocumented_color_full-254x1200.jpg 254w, https://ww2.kqed.org/app/uploads/sites/26/2016/12/Undocumented_color_full-240x1134.jpg 240w, https://ww2.kqed.org/app/uploads/sites/26/2016/12/Undocumented_color_full-375x1772.jpg 375w, https://ww2.kqed.org/app/uploads/sites/26/2016/12/Undocumented_color_full-520x2457.jpg 520w\" sizes=\"(max-width: 620px) 100vw, 620px\">\u003c/a>\u003c/p>\n\u003cp>\u003c/p>\n\u003cp>\u003cstrong>Sources\u003c/strong>\u003c/p>\n\u003cul>\n\u003cli>\u003ca href=\"http://census.gov\" target=\"_blank\">U.S. Census \u003c/a>\u003c/li>\n\u003cli>\u003ca href=\"http://dornsife.usc.edu/assets/sites/731/docs/whats_at_stake_for_the_state.pdf\"> Center for the Study of Immigrant Integration (USC)\u003c/a>\u003c/li>\n\u003cli>\u003ca href=\"http://www.ppic.org/main/publication_show.asp?i=818\" target=\"_blank\">Public Policy Institute of California\u003c/a>\u003c/li>\n\u003cli>\u003ca href=\"http://www.immigrationpolicy.org/sites/default/files/docs/new_americans_in_california_2015.pdf\" target=\"_blank\">American Immigration Council\u003c/a>\u003c/li>\n\u003cli>\u003ca href=\"http://www.pewhispanic.org/2009/04/14/a-portrait-of-unauthorized-immigrants-in-the-united-states/\" target=\"_blank\">Pew Research Center\u003c/a>\u003c/li>\n\u003cli>\u003ca href=\"http://www.migrationpolicy.org/data/unauthorized-immigrant-population/state/CA\" target=\"_blank\">Migration Policy Institute\u003c/a>\u003c/li>\n\u003c/ul>\n\n",
"disqusIdentifier": "16663 http://blogs.kqed.org/lowdown/?p=16663",
"disqusUrl": "https://ww2.kqed.org/lowdown/2016/12/01/living-in-the-shadows-of-the-golden-state-who-are-californias-undocumented-immigrants/",
"stats": {
"hasVideo": false,
"hasChartOrMap": false,
"hasAudio": false,
"hasPolis": false,
"wordCount": 373,
"hasGoogleForm": false,
"hasGallery": false,
"hasHearkenModule": false,
"iframeSrcs": [],
"paragraphCount": 11
},
"modified": 1524506302,
"excerpt": null,
"headData": {
"twImgId": "",
"twTitle": "",
"ogTitle": "",
"ogImgId": "",
"twDescription": "",
"description": "Illegal! Unauthorized! Alien! A lot of loaded terms are used to refer to the diverse group of more than 11 million immigrants who live in the United States without legal status. Although often relegated to the shadows of American society, this large population of undocumented residents were reluctantly thrust into the national spotlight during the long,",
"title": "Who Are California's Undocumented Immigrants? A Cartoon Explainer | KQED",
"ogDescription": "",
"schema": {
"@context": "https://schema.org",
"@type": "Article",
"headline": "Who Are California's Undocumented Immigrants? A Cartoon Explainer",
"datePublished": "2016-12-01T16:00:03-08:00",
"dateModified": "2018-04-23T10:58:22-07:00",
"image": "https://cdn.kqed.org/wp-content/uploads/2020/02/KQED-OG-Image@1x.png"
}
},
"guestAuthors": [],
"slug": "living-in-the-shadows-of-the-golden-state-who-are-californias-undocumented-immigrants",
"status": "publish",
"path": "/lowdown/16663/living-in-the-shadows-of-the-golden-state-who-are-californias-undocumented-immigrants",
"audioTrackLength": null,
"parsedContent": [
{
"type": "contentString",
"content": "\u003cdiv class=\"post-body\">\u003cp>\u003cp>Illegal! Unauthorized! Alien!\u003c/p>\n\u003cp>A lot of loaded terms are used to refer to the diverse group of more than 11 million immigrants who live in the United States without legal status. Although often relegated to the shadows of American society, this large population of undocumented residents were reluctantly thrust into the national spotlight during the long, bitter 2016 presidential campaign season. During his candidacy, Donald Trump consistently used fiery rhetoric, accusing undocumented immigrants of bringing crime and other problems into the country while taking valuable jobs from American citizens. He promised that as president, he'd order mass round-ups and mass deportations. \u003c/p>\n\u003cp>Since winning the election, Trump has somewhat narrowed the scope of some of his threats, now vowing to deport \"the more than 2 to 3 million criminal illegal immigrants.” But he continues to stand by many of his anti-immigrant original pledges, including punishing so-called \"\u003ca href=\"https://ww2.kqed.org/lowdown/2015/07/10/explainer-what-are-sanctuary-cities/\" target=\"_blank\">sanctuary cities\u003c/a>\" for not complying with federal immigration officials and rescinding President Obama's \u003ca href=\"https://www.uscis.gov/humanitarian/consideration-deferred-action-childhood-arrivals-daca\" target=\"_blank\">executive action\u003c/a> that protects hundreds of thousands of undocumented young people from deportation.\u003c/p>\n\u003cp>Not surprisingly, Trump's victory has provoked a heightened level of fear and uncertainty in undocumented communities across the country. In response, more than a dozen major cities, including San Francisco, Oakland, Los Angeles, Chicago and New York quickly reaffirmed their commitment to protecting documented residents and not cooperating with federal enforcement efforts (unless a serious crime is committed), even in the face of the president-elect's threats to withhold federal funding.\u003c/p>\n\u003cp>Nearly a quarter of the nation's undocumented population lives in California, which issued a similar pledge to its residents. The morning after the election, leaders of the state Assembly and Senate released a \u003ca href=\"http://sd24.senate.ca.gov/news/2016-11-09-joint-statement-california-legislative-leaders-result-presidential-election\" target=\"_blank\">statement\u003c/a> promising to maintain California as \"a refuge of justice and opportunity for people of all walks, talks, ages and aspirations ... California will defend its people and our progress.\"\u003c/p>\n\u003cp>\u003c/p>\u003c/div>",
"attributes": {
"named": {},
"numeric": []
}
},
{
"type": "component",
"content": "",
"name": "ad",
"attributes": {
"named": {
"label": "fullwidth"
},
"numeric": [
"fullwidth"
]
}
},
{
"type": "contentString",
"content": "\u003cdiv class=\"post-body\">\u003cp>\u003c/p>\n\u003cp>So who are California's undocumented residents? Where do they come from? And what impact do they have on this state's massive economy?\u003c/p>\n\u003cp>Comic illustrator Andy Warner explains. \u003c/p>\n\u003cp>\u003ca href=\"https://ww2.kqed.org/lowdown/wp-content/uploads/sites/26/2016/12/Undocumented_color_full.jpg\">\u003cimg src=\"https://ww2.kqed.org/lowdown/wp-content/uploads/sites/26/2016/12/Undocumented_color_full.jpg\" alt=\"\" width=\"620\" height=\"2929\" class=\"alignnone size-full wp-image-30709\" srcset=\"https://ww2.kqed.org/app/uploads/sites/26/2016/12/Undocumented_color_full.jpg 620w, https://ww2.kqed.org/app/uploads/sites/26/2016/12/Undocumented_color_full-160x756.jpg 160w, https://ww2.kqed.org/app/uploads/sites/26/2016/12/Undocumented_color_full-254x1200.jpg 254w, https://ww2.kqed.org/app/uploads/sites/26/2016/12/Undocumented_color_full-240x1134.jpg 240w, https://ww2.kqed.org/app/uploads/sites/26/2016/12/Undocumented_color_full-375x1772.jpg 375w, https://ww2.kqed.org/app/uploads/sites/26/2016/12/Undocumented_color_full-520x2457.jpg 520w\" sizes=\"(max-width: 620px) 100vw, 620px\">\u003c/a>\u003c/p>\n\u003cp>\u003c/p>\n\u003cp>\u003cstrong>Sources\u003c/strong>\u003c/p>\n\u003cul>\n\u003cli>\u003ca href=\"http://census.gov\" target=\"_blank\">U.S. Census \u003c/a>\u003c/li>\n\u003cli>\u003ca href=\"http://dornsife.usc.edu/assets/sites/731/docs/whats_at_stake_for_the_state.pdf\"> Center for the Study of Immigrant Integration (USC)\u003c/a>\u003c/li>\n\u003cli>\u003ca href=\"http://www.ppic.org/main/publication_show.asp?i=818\" target=\"_blank\">Public Policy Institute of California\u003c/a>\u003c/li>\n\u003cli>\u003ca href=\"http://www.immigrationpolicy.org/sites/default/files/docs/new_americans_in_california_2015.pdf\" target=\"_blank\">American Immigration Council\u003c/a>\u003c/li>\n\u003cli>\u003ca href=\"http://www.pewhispanic.org/2009/04/14/a-portrait-of-unauthorized-immigrants-in-the-united-states/\" target=\"_blank\">Pew Research Center\u003c/a>\u003c/li>\n\u003cli>\u003ca href=\"http://www.migrationpolicy.org/data/unauthorized-immigrant-population/state/CA\" target=\"_blank\">Migration Policy Institute\u003c/a>\u003c/li>\n\u003c/ul>\n\n\u003c/div>\u003c/p>",
"attributes": {
"named": {},
"numeric": []
}
}
],
"link": "/lowdown/16663/living-in-the-shadows-of-the-golden-state-who-are-californias-undocumented-immigrants",
"authors": [
"7506"
],
"categories": [
"lowdown_391",
"lowdown_256",
"lowdown_588",
"lowdown_2362",
"lowdown_457"
],
"tags": [
"lowdown_2337",
"lowdown_135",
"lowdown_136"
],
"featImg": "lowdown_16665",
"label": "lowdown"
},
"lowdown_14882": {
"type": "posts",
"id": "lowdown_14882",
"meta": {
"index": "posts_1716263798",
"site": "lowdown",
"id": "14882",
"score": null,
"sort": [
1476126045000
]
},
"guestAuthors": [],
"slug": "majority-rules-how-propositions-make-it-on-the-ballot-in-california-infographic",
"title": "Majority Rules: California's Proposition Process Explained",
"publishDate": 1476126045,
"format": "aside",
"headTitle": "Majority Rules: California’s Proposition Process Explained | KQED",
"labelTerm": {
"site": "lowdown"
},
"content": "\u003cp>Love ’em or hate ’em, ballot propositions are deeply ingrained in California’s political system.\u003c/p>\n\u003cp>In nearly every statewide election, voters wade through a stew of local and statewide measures.\u003c/p>\n\u003cp>The state’s proposition process was adopted over a century ago to empower citizens through a form of direct democracy. Since then, voters have weighed in on more than 1,000 ballot measures, some super complicated, some controversial, and some just plain odd (like \u003ca href=\"https://ballotpedia.org/California_Proposition_6,_Prohibition_on_Slaughter_of_Horses_for_Human_Consumption_(1998)\">Proposition 6\u003c/a> in 1998, prohibiting the slaughter of horses and sale of horse meat for human consumption, which voters approved.\u003c/p>\n\u003cp>So how do propositions actually make it onto the ballot? What are the different types? And what’s the difference between and initiative and referendum? Comic journalist Andy Warner gets down to the nuts and bolts. And check out our accompanying \u003ca href=\"http://ww2.kqed.org/lowdown/wp-content/uploads/sites/26/2016/10/CA-Propositions-Lesson-Plan-1.pdf\" target=\"_blank\" rel=\"noopener noreferrer\">lesson plan\u003c/a>.\u003c/p>\n\u003cp>\u003ca href=\"https://ww2.kqed.org/lowdown/wp-content/uploads/sites/26/2016/10/Ballot_Initiatives_2016_revision.png\">\u003cimg loading=\"lazy\" decoding=\"async\" class=\"alignnone size-full wp-image-30713\" src=\"https://ww2.kqed.org/lowdown/wp-content/uploads/sites/26/2016/10/Ballot_Initiatives_2016_revision.png\" alt=\"\" width=\"620\" height=\"2846\" srcset=\"https://cdn.kqed.org/wp-content/uploads/sites/26/2016/10/Ballot_Initiatives_2016_revision.png 620w, https://cdn.kqed.org/wp-content/uploads/sites/26/2016/10/Ballot_Initiatives_2016_revision-160x734.png 160w, https://cdn.kqed.org/wp-content/uploads/sites/26/2016/10/Ballot_Initiatives_2016_revision-240x1102.png 240w, https://cdn.kqed.org/wp-content/uploads/sites/26/2016/10/Ballot_Initiatives_2016_revision-375x1721.png 375w, https://cdn.kqed.org/wp-content/uploads/sites/26/2016/10/Ballot_Initiatives_2016_revision-520x2387.png 520w\" sizes=\"(max-width: 620px) 100vw, 620px\">\u003c/a>\u003c/p>\n\u003ch4>Sources\u003c/h4>\n\u003cul>\n\u003cli>\u003ca style=\"font-size: medium;\" href=\"http://www.sos.ca.gov/elections/ballot-measures/how-qualify-initiative/\" target=\"_blank\" rel=\"noopener noreferrer\">California Secretary of State – How to Qualify an Initiative \u003c/a>\u003c/li>\n\u003cli>\u003ca style=\"font-size: medium;\" href=\"http://www.sos.ca.gov/elections/ballot-measures/how-qualify-initiative/initiative-guide/\" target=\"_blank\" rel=\"noopener noreferrer\">California Secretary of State – Statewide Initiative Guide\u003c/a>\u003c/li>\n\u003cli>\u003ca style=\"font-size: medium;\" href=\"http://www.iandrinstitute.org/\" target=\"_blank\" rel=\"noopener noreferrer\">Initiative and Referendum Institute\u003c/a>\u003c/li>\n\u003c/ul>\n\u003cp>[ad fullwidth]\u003c/p>\u003cp>\u003c/p>\n",
"blocks": [],
"excerpt": null,
"status": "publish",
"parent": 0,
"modified": 1728492345,
"stats": {
"hasAudio": false,
"hasVideo": false,
"hasChartOrMap": false,
"iframeSrcs": [],
"hasGoogleForm": false,
"hasGallery": false,
"hasHearkenModule": false,
"hasPolis": false,
"paragraphCount": 7,
"wordCount": 169
},
"headData": {
"title": "Majority Rules: California's Proposition Process Explained | KQED",
"description": "Love 'em or hate 'em, ballot propositions are deeply ingrained in California's political system. In nearly every statewide election, voters wade through a stew of local and statewide measures. The state's proposition process was adopted over a century ago to empower citizens through a form of direct democracy. Since then, voters have weighed in on more than 1,000 ballot measures, some super complicated, some controversial, and some just plain odd (like Proposition 6 in 1998, prohibiting the slaughter of horses and sale of horse meat for human consumption, which voters approved. So how do propositions actually make it onto the ballot?",
"ogTitle": "",
"ogDescription": "",
"ogImgId": "",
"twTitle": "",
"twDescription": "",
"twImgId": "",
"schema": {
"@context": "https://schema.org",
"@type": "Article",
"headline": "Majority Rules: California's Proposition Process Explained",
"datePublished": "2016-10-10T12:00:45-07:00",
"dateModified": "2024-10-09T09:45:45-07:00",
"image": "https://cdn.kqed.org/wp-content/uploads/2020/02/KQED-OG-Image@1x.png"
}
},
"sticky": false,
"excludeFromSiteSearch": "Include",
"articleAge": "0",
"path": "/lowdown/14882/majority-rules-how-propositions-make-it-on-the-ballot-in-california-infographic",
"audioTrackLength": null,
"parsedContent": [
{
"type": "contentString",
"content": "\u003cdiv class=\"post-body\">\u003cp>\u003cp>Love ’em or hate ’em, ballot propositions are deeply ingrained in California’s political system.\u003c/p>\n\u003cp>In nearly every statewide election, voters wade through a stew of local and statewide measures.\u003c/p>\n\u003cp>The state’s proposition process was adopted over a century ago to empower citizens through a form of direct democracy. Since then, voters have weighed in on more than 1,000 ballot measures, some super complicated, some controversial, and some just plain odd (like \u003ca href=\"https://ballotpedia.org/California_Proposition_6,_Prohibition_on_Slaughter_of_Horses_for_Human_Consumption_(1998)\">Proposition 6\u003c/a> in 1998, prohibiting the slaughter of horses and sale of horse meat for human consumption, which voters approved.\u003c/p>\n\u003cp>So how do propositions actually make it onto the ballot? What are the different types? And what’s the difference between and initiative and referendum? Comic journalist Andy Warner gets down to the nuts and bolts. And check out our accompanying \u003ca href=\"http://ww2.kqed.org/lowdown/wp-content/uploads/sites/26/2016/10/CA-Propositions-Lesson-Plan-1.pdf\" target=\"_blank\" rel=\"noopener noreferrer\">lesson plan\u003c/a>.\u003c/p>\n\u003cp>\u003ca href=\"https://ww2.kqed.org/lowdown/wp-content/uploads/sites/26/2016/10/Ballot_Initiatives_2016_revision.png\">\u003cimg loading=\"lazy\" decoding=\"async\" class=\"alignnone size-full wp-image-30713\" src=\"https://ww2.kqed.org/lowdown/wp-content/uploads/sites/26/2016/10/Ballot_Initiatives_2016_revision.png\" alt=\"\" width=\"620\" height=\"2846\" srcset=\"https://cdn.kqed.org/wp-content/uploads/sites/26/2016/10/Ballot_Initiatives_2016_revision.png 620w, https://cdn.kqed.org/wp-content/uploads/sites/26/2016/10/Ballot_Initiatives_2016_revision-160x734.png 160w, https://cdn.kqed.org/wp-content/uploads/sites/26/2016/10/Ballot_Initiatives_2016_revision-240x1102.png 240w, https://cdn.kqed.org/wp-content/uploads/sites/26/2016/10/Ballot_Initiatives_2016_revision-375x1721.png 375w, https://cdn.kqed.org/wp-content/uploads/sites/26/2016/10/Ballot_Initiatives_2016_revision-520x2387.png 520w\" sizes=\"(max-width: 620px) 100vw, 620px\">\u003c/a>\u003c/p>\n\u003ch4>Sources\u003c/h4>\n\u003cul>\n\u003cli>\u003ca style=\"font-size: medium;\" href=\"http://www.sos.ca.gov/elections/ballot-measures/how-qualify-initiative/\" target=\"_blank\" rel=\"noopener noreferrer\">California Secretary of State – How to Qualify an Initiative \u003c/a>\u003c/li>\n\u003cli>\u003ca style=\"font-size: medium;\" href=\"http://www.sos.ca.gov/elections/ballot-measures/how-qualify-initiative/initiative-guide/\" target=\"_blank\" rel=\"noopener noreferrer\">California Secretary of State – Statewide Initiative Guide\u003c/a>\u003c/li>\n\u003cli>\u003ca style=\"font-size: medium;\" href=\"http://www.iandrinstitute.org/\" target=\"_blank\" rel=\"noopener noreferrer\">Initiative and Referendum Institute\u003c/a>\u003c/li>\n\u003c/ul>\n\u003cp>\u003c/p>\u003c/div>",
"attributes": {
"named": {},
"numeric": []
}
},
{
"type": "component",
"content": "",
"name": "ad",
"attributes": {
"named": {
"label": "fullwidth"
},
"numeric": [
"fullwidth"
]
}
},
{
"type": "contentString",
"content": "\u003cdiv class=\"post-body\">\u003cp>\u003c/p>\u003cp>\u003c/p>\n\u003c/div>\u003c/p>",
"attributes": {
"named": {},
"numeric": []
}
}
],
"link": "/lowdown/14882/majority-rules-how-propositions-make-it-on-the-ballot-in-california-infographic",
"authors": [
"7506"
],
"categories": [
"lowdown_256",
"lowdown_588",
"lowdown_457",
"lowdown_2361"
],
"tags": [
"lowdown_545",
"lowdown_124",
"lowdown_2337",
"lowdown_179"
],
"featImg": "lowdown_24202",
"label": "lowdown"
}
},
"programsReducer": {
"all-things-considered": {
"id": "all-things-considered",
"title": "All Things Considered",
"info": "Every weekday, \u003cem>All Things Considered\u003c/em> hosts Robert Siegel, Audie Cornish, Ari Shapiro, and Kelly McEvers present the program's trademark mix of news, interviews, commentaries, reviews, and offbeat features. Michel Martin hosts on the weekends.",
"airtime": "MON-FRI 1pm-2pm, 4:30pm-6:30pm\u003cbr />SAT-SUN 5pm-6pm",
"imageSrc": "https://cdn.kqed.org/wp-content/uploads/2024/04/All-Things-Considered-Podcast-Tile-360x360-1.jpg",
"officialWebsiteLink": "https://www.npr.org/programs/all-things-considered/",
"meta": {
"site": "news",
"source": "npr"
},
"link": "/radio/program/all-things-considered"
},
"american-suburb-podcast": {
"id": "american-suburb-podcast",
"title": "American Suburb: The Podcast",
"tagline": "The flip side of gentrification, told through one town",
"info": "Gentrification is changing cities across America, forcing people from neighborhoods they have long called home. Call them the displaced. Now those priced out of the Bay Area are looking for a better life in an unlikely place. American Suburb follows this migration to one California town along the Delta, 45 miles from San Francisco. But is this once sleepy suburb ready for them?",
"imageSrc": "https://cdn.kqed.org/wp-content/uploads/2024/04/American-Suburb-Podcast-Tile-703x703-1.jpg",
"officialWebsiteLink": "/news/series/american-suburb-podcast",
"meta": {
"site": "news",
"source": "kqed",
"order": 19
},
"link": "/news/series/american-suburb-podcast/",
"subscribe": {
"npr": "https://rpb3r.app.goo.gl/RBrW",
"apple": "https://itunes.apple.com/WebObjects/MZStore.woa/wa/viewPodcast?mt=2&id=1287748328",
"tuneIn": "https://tunein.com/radio/American-Suburb-p1086805/",
"rss": "https://ww2.kqed.org/news/series/american-suburb-podcast/feed/podcast",
"google": "https://podcasts.google.com/feed/aHR0cHM6Ly9mZWVkcy5tZWdhcGhvbmUuZm0vS1FJTkMzMDExODgxNjA5"
}
},
"baycurious": {
"id": "baycurious",
"title": "Bay Curious",
"tagline": "Exploring the Bay Area, one question at a time",
"info": "KQED’s new podcast, Bay Curious, gets to the bottom of the mysteries — both profound and peculiar — that give the Bay Area its unique identity. And we’ll do it with your help! You ask the questions. You decide what Bay Curious investigates. And you join us on the journey to find the answers.",
"imageSrc": "https://cdn.kqed.org/wp-content/uploads/2024/04/Bay-Curious-Podcast-Tile-703x703-1.jpg",
"imageAlt": "\"KQED Bay Curious",
"officialWebsiteLink": "/news/series/baycurious",
"meta": {
"site": "news",
"source": "kqed",
"order": 3
},
"link": "/podcasts/baycurious",
"subscribe": {
"apple": "https://podcasts.apple.com/us/podcast/bay-curious/id1172473406",
"npr": "https://www.npr.org/podcasts/500557090/bay-curious",
"rss": "https://ww2.kqed.org/news/category/bay-curious-podcast/feed/podcast",
"google": "https://podcasts.google.com/feed/aHR0cHM6Ly93dzIua3FlZC5vcmcvbmV3cy9jYXRlZ29yeS9iYXktY3VyaW91cy1wb2RjYXN0L2ZlZWQvcG9kY2FzdA",
"stitcher": "https://www.stitcher.com/podcast/kqed/bay-curious",
"spotify": "https://open.spotify.com/show/6O76IdmhixfijmhTZLIJ8k"
}
},
"bbc-world-service": {
"id": "bbc-world-service",
"title": "BBC World Service",
"info": "The day's top stories from BBC News compiled twice daily in the week, once at weekends.",
"airtime": "MON-FRI 9pm-10pm, TUE-FRI 1am-2am",
"imageSrc": "https://cdn.kqed.org/wp-content/uploads/2024/04/BBC-World-Service-Podcast-Tile-360x360-1.jpg",
"officialWebsiteLink": "https://www.bbc.co.uk/sounds/play/live:bbc_world_service",
"meta": {
"site": "news",
"source": "BBC World Service"
},
"link": "/radio/program/bbc-world-service",
"subscribe": {
"apple": "https://itunes.apple.com/us/podcast/global-news-podcast/id135067274?mt=2",
"tuneIn": "https://tunein.com/radio/BBC-World-Service-p455581/",
"rss": "https://podcasts.files.bbci.co.uk/p02nq0gn.rss"
}
},
"californiareport": {
"id": "californiareport",
"title": "The California Report",
"tagline": "California, day by day",
"info": "KQED’s statewide radio news program providing daily coverage of issues, trends and public policy decisions.",
"imageSrc": "https://cdn.kqed.org/wp-content/uploads/2024/04/The-California-Report-Podcast-Tile-703x703-1.jpg",
"imageAlt": "KQED The California Report",
"officialWebsiteLink": "/californiareport",
"meta": {
"site": "news",
"source": "kqed",
"order": 8
},
"link": "/californiareport",
"subscribe": {
"apple": "https://podcasts.apple.com/us/podcast/kqeds-the-california-report/id79681292",
"google": "https://podcasts.google.com/feed/aHR0cHM6Ly9mZWVkcy5tZWdhcGhvbmUuZm0vS1FJTkM1MDAyODE4NTgz",
"npr": "https://www.npr.org/podcasts/432285393/the-california-report",
"stitcher": "https://www.stitcher.com/podcast/kqedfm-kqeds-the-california-report-podcast-8838",
"rss": "https://ww2.kqed.org/news/tag/tcram/feed/podcast"
}
},
"californiareportmagazine": {
"id": "californiareportmagazine",
"title": "The California Report Magazine",
"tagline": "Your state, your stories",
"info": "Every week, The California Report Magazine takes you on a road trip for the ears: to visit the places and meet the people who make California unique. The in-depth storytelling podcast from the California Report.",
"airtime": "FRI 4:30pm-5pm, 6:30pm-7pm, 11pm-11:30pm",
"imageSrc": "https://cdn.kqed.org/wp-content/uploads/2024/04/The-California-Report-Magazine-Podcast-Tile-703x703-1.jpg",
"imageAlt": "KQED The California Report Magazine",
"officialWebsiteLink": "/californiareportmagazine",
"meta": {
"site": "news",
"source": "kqed",
"order": 10
},
"link": "/californiareportmagazine",
"subscribe": {
"apple": "https://podcasts.apple.com/us/podcast/the-california-report-magazine/id1314750545",
"google": "https://podcasts.google.com/feed/aHR0cHM6Ly9mZWVkcy5tZWdhcGhvbmUuZm0vS1FJTkM3NjkwNjk1OTAz",
"npr": "https://www.npr.org/podcasts/564733126/the-california-report-magazine",
"stitcher": "https://www.stitcher.com/podcast/kqed/the-california-report-magazine",
"rss": "https://ww2.kqed.org/news/tag/tcrmag/feed/podcast"
}
},
"city-arts": {
"id": "city-arts",
"title": "City Arts & Lectures",
"info": "A one-hour radio program to hear celebrated writers, artists and thinkers address contemporary ideas and values, often discussing the creative process. Please note: tapes or transcripts are not available",
"imageSrc": "https://ww2.kqed.org/radio/wp-content/uploads/sites/50/2018/05/cityartsandlecture-300x300.jpg",
"officialWebsiteLink": "https://www.cityarts.net/",
"airtime": "SUN 1pm-2pm, TUE 10pm, WED 1am",
"meta": {
"site": "news",
"source": "City Arts & Lectures"
},
"link": "https://www.cityarts.net",
"subscribe": {
"tuneIn": "https://tunein.com/radio/City-Arts-and-Lectures-p692/",
"rss": "https://www.cityarts.net/feed/"
}
},
"closealltabs": {
"id": "closealltabs",
"title": "Close All Tabs",
"tagline": "Your irreverent guide to the trends redefining our world",
"info": "Close All Tabs breaks down how digital culture shapes our world through thoughtful insights and irreverent humor.",
"imageSrc": "https://cdn.kqed.org/wp-content/uploads/2025/02/CAT_2_Tile-scaled.jpg",
"imageAlt": "\"KQED Close All Tabs",
"officialWebsiteLink": "/podcasts/closealltabs",
"meta": {
"site": "news",
"source": "kqed",
"order": 1
},
"link": "/podcasts/closealltabs",
"subscribe": {
"apple": "https://podcasts.apple.com/us/podcast/close-all-tabs/id214663465",
"rss": "https://feeds.megaphone.fm/KQINC6993880386",
"amazon": "https://music.amazon.com/podcasts/92d9d4ac-67a3-4eed-b10a-fb45d45b1ef2/close-all-tabs",
"spotify": "https://open.spotify.com/show/6LAJFHnGK1pYXYzv6SIol6?si=deb0cae19813417c"
}
},
"code-switch-life-kit": {
"id": "code-switch-life-kit",
"title": "Code Switch / Life Kit",
"info": "\u003cem>Code Switch\u003c/em>, which listeners will hear in the first part of the hour, has fearless and much-needed conversations about race. Hosted by journalists of color, the show tackles the subject of race head-on, exploring how it impacts every part of society — from politics and pop culture to history, sports and more.\u003cbr />\u003cbr />\u003cem>Life Kit\u003c/em>, which will be in the second part of the hour, guides you through spaces and feelings no one prepares you for — from finances to mental health, from workplace microaggressions to imposter syndrome, from relationships to parenting. The show features experts with real world experience and shares their knowledge. Because everyone needs a little help being human.\u003cbr />\u003cbr />\u003ca href=\"https://www.npr.org/podcasts/510312/codeswitch\">\u003cem>Code Switch\u003c/em> offical site and podcast\u003c/a>\u003cbr />\u003ca href=\"https://www.npr.org/lifekit\">\u003cem>Life Kit\u003c/em> offical site and podcast\u003c/a>\u003cbr />",
"airtime": "SUN 9pm-10pm",
"imageSrc": "https://cdn.kqed.org/wp-content/uploads/2024/04/Code-Switch-Life-Kit-Podcast-Tile-360x360-1.jpg",
"meta": {
"site": "radio",
"source": "npr"
},
"link": "/radio/program/code-switch-life-kit",
"subscribe": {
"apple": "https://podcasts.apple.com/podcast/1112190608?mt=2&at=11l79Y&ct=nprdirectory",
"google": "https://podcasts.google.com/feed/aHR0cHM6Ly93d3cubnByLm9yZy9yc3MvcG9kY2FzdC5waHA_aWQ9NTEwMzEy",
"spotify": "https://open.spotify.com/show/3bExJ9JQpkwNhoHvaIIuyV",
"rss": "https://feeds.npr.org/510312/podcast.xml"
}
},
"commonwealth-club": {
"id": "commonwealth-club",
"title": "Commonwealth Club of California Podcast",
"info": "The Commonwealth Club of California is the nation's oldest and largest public affairs forum. As a non-partisan forum, The Club brings to the public airwaves diverse viewpoints on important topics. The Club's weekly radio broadcast - the oldest in the U.S., dating back to 1924 - is carried across the nation on public radio stations and is now podcasting. Our website archive features audio of our recent programs, as well as selected speeches from our long and distinguished history. This podcast feed is usually updated twice a week and is always un-edited.",
"airtime": "THU 10pm, FRI 1am",
"imageSrc": "https://cdn.kqed.org/wp-content/uploads/2024/04/Commonwealth-Club-Podcast-Tile-360x360-1.jpg",
"officialWebsiteLink": "https://www.commonwealthclub.org/podcasts",
"meta": {
"site": "news",
"source": "Commonwealth Club of California"
},
"link": "/radio/program/commonwealth-club",
"subscribe": {
"apple": "https://itunes.apple.com/us/podcast/commonwealth-club-of-california-podcast/id976334034?mt=2",
"google": "https://podcasts.google.com/feed/aHR0cDovL3d3dy5jb21tb253ZWFsdGhjbHViLm9yZy9hdWRpby9wb2RjYXN0L3dlZWtseS54bWw",
"tuneIn": "https://tunein.com/radio/Commonwealth-Club-of-California-p1060/"
}
},
"forum": {
"id": "forum",
"title": "Forum",
"tagline": "The conversation starts here",
"info": "KQED’s live call-in program discussing local, state, national and international issues, as well as in-depth interviews.",
"airtime": "MON-FRI 9am-11am, 10pm-11pm",
"imageSrc": "https://cdn.kqed.org/wp-content/uploads/2024/04/Forum-Podcast-Tile-703x703-1.jpg",
"imageAlt": "KQED Forum with Mina Kim and Alexis Madrigal",
"officialWebsiteLink": "/forum",
"meta": {
"site": "news",
"source": "kqed",
"order": 9
},
"link": "/forum",
"subscribe": {
"apple": "https://podcasts.apple.com/us/podcast/kqeds-forum/id73329719",
"google": "https://podcasts.google.com/feed/aHR0cHM6Ly9mZWVkcy5tZWdhcGhvbmUuZm0vS1FJTkM5NTU3MzgxNjMz",
"npr": "https://www.npr.org/podcasts/432307980/forum",
"stitcher": "https://www.stitcher.com/podcast/kqedfm-kqeds-forum-podcast",
"rss": "https://feeds.megaphone.fm/KQINC9557381633"
}
},
"freakonomics-radio": {
"id": "freakonomics-radio",
"title": "Freakonomics Radio",
"info": "Freakonomics Radio is a one-hour award-winning podcast and public-radio project hosted by Stephen Dubner, with co-author Steve Levitt as a regular guest. It is produced in partnership with WNYC.",
"imageSrc": "https://ww2.kqed.org/news/wp-content/uploads/sites/10/2018/05/freakonomicsRadio.png",
"officialWebsiteLink": "http://freakonomics.com/",
"airtime": "SUN 1am-2am, SAT 3pm-4pm",
"meta": {
"site": "radio",
"source": "WNYC"
},
"link": "/radio/program/freakonomics-radio",
"subscribe": {
"npr": "https://rpb3r.app.goo.gl/4s8b",
"apple": "https://itunes.apple.com/us/podcast/freakonomics-radio/id354668519",
"tuneIn": "https://tunein.com/podcasts/WNYC-Podcasts/Freakonomics-Radio-p272293/",
"rss": "https://feeds.feedburner.com/freakonomicsradio"
}
},
"fresh-air": {
"id": "fresh-air",
"title": "Fresh Air",
"info": "Hosted by Terry Gross, \u003cem>Fresh Air from WHYY\u003c/em> is the Peabody Award-winning weekday magazine of contemporary arts and issues. One of public radio's most popular programs, Fresh Air features intimate conversations with today's biggest luminaries.",
"airtime": "MON-FRI 7pm-8pm",
"imageSrc": "https://cdn.kqed.org/wp-content/uploads/2024/04/Fresh-Air-Podcast-Tile-360x360-1.jpg",
"officialWebsiteLink": "https://www.npr.org/programs/fresh-air/",
"meta": {
"site": "radio",
"source": "npr"
},
"link": "/radio/program/fresh-air",
"subscribe": {
"npr": "https://rpb3r.app.goo.gl/4s8b",
"apple": "https://itunes.apple.com/WebObjects/MZStore.woa/wa/viewPodcast?s=143441&mt=2&id=214089682&at=11l79Y&ct=nprdirectory",
"tuneIn": "https://tunein.com/radio/Fresh-Air-p17/",
"rss": "https://feeds.npr.org/381444908/podcast.xml"
}
},
"here-and-now": {
"id": "here-and-now",
"title": "Here & Now",
"info": "A live production of NPR and WBUR Boston, in collaboration with stations across the country, Here & Now reflects the fluid world of news as it's happening in the middle of the day, with timely, in-depth news, interviews and conversation. Hosted by Robin Young, Jeremy Hobson and Tonya Mosley.",
"airtime": "MON-THU 11am-12pm",
"imageSrc": "https://cdn.kqed.org/wp-content/uploads/2024/04/Here-And-Now-Podcast-Tile-360x360-1.jpg",
"officialWebsiteLink": "http://www.wbur.org/hereandnow",
"meta": {
"site": "news",
"source": "npr"
},
"link": "/radio/program/here-and-now",
"subsdcribe": {
"apple": "https://itunes.apple.com/WebObjects/MZStore.woa/wa/viewPodcast?mt=2&id=426698661",
"tuneIn": "https://tunein.com/radio/Here--Now-p211/",
"rss": "https://feeds.npr.org/510051/podcast.xml"
}
},
"hidden-brain": {
"id": "hidden-brain",
"title": "Hidden Brain",
"info": "Shankar Vedantam uses science and storytelling to reveal the unconscious patterns that drive human behavior, shape our choices and direct our relationships.",
"imageSrc": "https://ww2.kqed.org/radio/wp-content/uploads/sites/50/2018/05/hiddenbrain.jpg",
"officialWebsiteLink": "https://www.npr.org/series/423302056/hidden-brain",
"airtime": "SUN 7pm-8pm",
"meta": {
"site": "news",
"source": "NPR"
},
"link": "/radio/program/hidden-brain",
"subscribe": {
"apple": "https://itunes.apple.com/us/podcast/hidden-brain/id1028908750?mt=2",
"tuneIn": "https://tunein.com/podcasts/Science-Podcasts/Hidden-Brain-p787503/",
"rss": "https://feeds.npr.org/510308/podcast.xml"
}
},
"how-i-built-this": {
"id": "how-i-built-this",
"title": "How I Built This with Guy Raz",
"info": "Guy Raz dives into the stories behind some of the world's best known companies. How I Built This weaves a narrative journey about innovators, entrepreneurs and idealists—and the movements they built.",
"imageSrc": "https://ww2.kqed.org/news/wp-content/uploads/sites/10/2018/05/howIBuiltThis.png",
"officialWebsiteLink": "https://www.npr.org/podcasts/510313/how-i-built-this",
"airtime": "SUN 7:30pm-8pm",
"meta": {
"site": "news",
"source": "npr"
},
"link": "/radio/program/how-i-built-this",
"subscribe": {
"npr": "https://rpb3r.app.goo.gl/3zxy",
"apple": "https://itunes.apple.com/us/podcast/how-i-built-this-with-guy-raz/id1150510297?mt=2",
"tuneIn": "https://tunein.com/podcasts/Arts--Culture-Podcasts/How-I-Built-This-p910896/",
"rss": "https://feeds.npr.org/510313/podcast.xml"
}
},
"hyphenacion": {
"id": "hyphenacion",
"title": "Hyphenación",
"tagline": "Where conversation and cultura meet",
"info": "What kind of no sabo word is Hyphenación? For us, it’s about living within a hyphenation. Like being a third-gen Mexican-American from the Texas border now living that Bay Area Chicano life. Like Xorje! Each week we bring together a couple of hyphenated Latinos to talk all about personal life choices: family, careers, relationships, belonging … everything is on the table. ",
"imageSrc": "https://cdn.kqed.org/wp-content/uploads/2025/03/Hyphenacion_FinalAssets_PodcastTile.png",
"imageAlt": "KQED Hyphenación",
"officialWebsiteLink": "/podcasts/hyphenacion",
"meta": {
"site": "news",
"source": "kqed",
"order": 15
},
"link": "/podcasts/hyphenacion",
"subscribe": {
"apple": "https://podcasts.apple.com/us/podcast/hyphenaci%C3%B3n/id1191591838",
"spotify": "https://open.spotify.com/show/2p3Fifq96nw9BPcmFdIq0o?si=39209f7b25774f38",
"youtube": "https://www.youtube.com/c/kqedarts",
"amazon": "https://music.amazon.com/podcasts/6c3dd23c-93fb-4aab-97ba-1725fa6315f1/hyphenaci%C3%B3n",
"rss": "https://feeds.megaphone.fm/KQINC2275451163"
}
},
"jerrybrown": {
"id": "jerrybrown",
"title": "The Political Mind of Jerry Brown",
"tagline": "Lessons from a lifetime in politics",
"info": "The Political Mind of Jerry Brown brings listeners the wisdom of the former Governor, Mayor, and presidential candidate. Scott Shafer interviewed Brown for more than 40 hours, covering the former governor's life and half-century in the political game – and Brown has some lessons he'd like to share. ",
"imageSrc": "https://cdn.kqed.org/wp-content/uploads/2024/04/The-Political-Mind-of-Jerry-Brown-Podcast-Tile-703x703-1.jpg",
"imageAlt": "KQED The Political Mind of Jerry Brown",
"officialWebsiteLink": "/podcasts/jerrybrown",
"meta": {
"site": "news",
"source": "kqed",
"order": 18
},
"link": "/podcasts/jerrybrown",
"subscribe": {
"npr": "https://www.npr.org/podcasts/790253322/the-political-mind-of-jerry-brown",
"apple": "https://itunes.apple.com/us/podcast/id1492194549",
"rss": "https://ww2.kqed.org/news/series/jerrybrown/feed/podcast/",
"tuneIn": "http://tun.in/pjGcK",
"stitcher": "https://www.stitcher.com/podcast/kqed/the-political-mind-of-jerry-brown",
"spotify": "https://open.spotify.com/show/54C1dmuyFyKMFttY6X2j6r?si=K8SgRCoISNK6ZbjpXrX5-w",
"google": "https://podcasts.google.com/feed/aHR0cHM6Ly93dzIua3FlZC5vcmcvbmV3cy9zZXJpZXMvamVycnlicm93bi9mZWVkL3BvZGNhc3Qv"
}
},
"latino-usa": {
"id": "latino-usa",
"title": "Latino USA",
"airtime": "MON 1am-2am, SUN 6pm-7pm",
"info": "Latino USA, the radio journal of news and culture, is the only national, English-language radio program produced from a Latino perspective.",
"imageSrc": "https://ww2.kqed.org/radio/wp-content/uploads/sites/50/2018/04/latinoUsa.jpg",
"officialWebsiteLink": "http://latinousa.org/",
"meta": {
"site": "news",
"source": "npr"
},
"link": "/radio/program/latino-usa",
"subscribe": {
"npr": "https://rpb3r.app.goo.gl/xtTd",
"apple": "https://itunes.apple.com/WebObjects/MZStore.woa/wa/viewPodcast?s=143441&mt=2&id=79681317&at=11l79Y&ct=nprdirectory",
"tuneIn": "https://tunein.com/radio/Latino-USA-p621/",
"rss": "https://feeds.npr.org/510016/podcast.xml"
}
},
"marketplace": {
"id": "marketplace",
"title": "Marketplace",
"info": "Our flagship program, helmed by Kai Ryssdal, examines what the day in money delivered, through stories, conversations, newsworthy numbers and more. Updated Monday through Friday at about 3:30 p.m. PT.",
"airtime": "MON-FRI 4pm-4:30pm, MON-WED 6:30pm-7pm",
"imageSrc": "https://cdn.kqed.org/wp-content/uploads/2024/04/Marketplace-Podcast-Tile-360x360-1.jpg",
"officialWebsiteLink": "https://www.marketplace.org/",
"meta": {
"site": "news",
"source": "American Public Media"
},
"link": "/radio/program/marketplace",
"subscribe": {
"apple": "https://itunes.apple.com/WebObjects/MZStore.woa/wa/viewPodcast?s=143441&mt=2&id=201853034&at=11l79Y&ct=nprdirectory",
"tuneIn": "https://tunein.com/radio/APM-Marketplace-p88/",
"rss": "https://feeds.publicradio.org/public_feeds/marketplace-pm/rss/rss"
}
},
"masters-of-scale": {
"id": "masters-of-scale",
"title": "Masters of Scale",
"info": "Masters of Scale is an original podcast in which LinkedIn co-founder and Greylock Partner Reid Hoffman sets out to describe and prove theories that explain how great entrepreneurs take their companies from zero to a gazillion in ingenious fashion.",
"airtime": "Every other Wednesday June 12 through October 16 at 8pm (repeats Thursdays at 2am)",
"imageSrc": "https://cdn.kqed.org/wp-content/uploads/2024/04/Masters-of-Scale-Podcast-Tile-360x360-1.jpg",
"officialWebsiteLink": "https://mastersofscale.com/",
"meta": {
"site": "radio",
"source": "WaitWhat"
},
"link": "/radio/program/masters-of-scale",
"subscribe": {
"apple": "http://mastersofscale.app.link/",
"rss": "https://rss.art19.com/masters-of-scale"
}
},
"mindshift": {
"id": "mindshift",
"title": "MindShift",
"tagline": "A podcast about the future of learning and how we raise our kids",
"info": "The MindShift podcast explores the innovations in education that are shaping how kids learn. Hosts Ki Sung and Katrina Schwartz introduce listeners to educators, researchers, parents and students who are developing effective ways to improve how kids learn. We cover topics like how fed-up administrators are developing surprising tactics to deal with classroom disruptions; how listening to podcasts are helping kids develop reading skills; the consequences of overparenting; and why interdisciplinary learning can engage students on all ends of the traditional achievement spectrum. This podcast is part of the MindShift education site, a division of KQED News. KQED is an NPR/PBS member station based in San Francisco. You can also visit the MindShift website for episodes and supplemental blog posts or tweet us \u003ca href=\"https://twitter.com/MindShiftKQED\">@MindShiftKQED\u003c/a> or visit us at \u003ca href=\"/mindshift\">MindShift.KQED.org\u003c/a>",
"imageSrc": "https://cdn.kqed.org/wp-content/uploads/2024/04/Mindshift-Podcast-Tile-703x703-1.jpg",
"imageAlt": "KQED MindShift: How We Will Learn",
"officialWebsiteLink": "/mindshift/",
"meta": {
"site": "news",
"source": "kqed",
"order": 12
},
"link": "/podcasts/mindshift",
"subscribe": {
"apple": "https://podcasts.apple.com/us/podcast/mindshift-podcast/id1078765985",
"google": "https://podcasts.google.com/feed/aHR0cHM6Ly9mZWVkcy5tZWdhcGhvbmUuZm0vS1FJTkM1NzY0NjAwNDI5",
"npr": "https://www.npr.org/podcasts/464615685/mind-shift-podcast",
"stitcher": "https://www.stitcher.com/podcast/kqed/stories-teachers-share",
"spotify": "https://open.spotify.com/show/0MxSpNYZKNprFLCl7eEtyx"
}
},
"morning-edition": {
"id": "morning-edition",
"title": "Morning Edition",
"info": "\u003cem>Morning Edition\u003c/em> takes listeners around the country and the world with multi-faceted stories and commentaries every weekday. Hosts Steve Inskeep, David Greene and Rachel Martin bring you the latest breaking news and features to prepare you for the day.",
"airtime": "MON-FRI 3am-9am",
"imageSrc": "https://cdn.kqed.org/wp-content/uploads/2024/04/Morning-Edition-Podcast-Tile-360x360-1.jpg",
"officialWebsiteLink": "https://www.npr.org/programs/morning-edition/",
"meta": {
"site": "news",
"source": "npr"
},
"link": "/radio/program/morning-edition"
},
"onourwatch": {
"id": "onourwatch",
"title": "On Our Watch",
"tagline": "Deeply-reported investigative journalism",
"info": "For decades, the process for how police police themselves has been inconsistent – if not opaque. In some states, like California, these proceedings were completely hidden. After a new police transparency law unsealed scores of internal affairs files, our reporters set out to examine these cases and the shadow world of police discipline. On Our Watch brings listeners into the rooms where officers are questioned and witnesses are interrogated to find out who this system is really protecting. Is it the officers, or the public they've sworn to serve?",
"imageSrc": "https://cdn.kqed.org/wp-content/uploads/2024/04/On-Our-Watch-Podcast-Tile-703x703-1.jpg",
"imageAlt": "On Our Watch from NPR and KQED",
"officialWebsiteLink": "/podcasts/onourwatch",
"meta": {
"site": "news",
"source": "kqed",
"order": 11
},
"link": "/podcasts/onourwatch",
"subscribe": {
"apple": "https://podcasts.apple.com/podcast/id1567098962",
"google": "https://podcasts.google.com/feed/aHR0cHM6Ly9mZWVkcy5ucHIub3JnLzUxMDM2MC9wb2RjYXN0LnhtbD9zYz1nb29nbGVwb2RjYXN0cw",
"npr": "https://rpb3r.app.goo.gl/onourwatch",
"spotify": "https://open.spotify.com/show/0OLWoyizopu6tY1XiuX70x",
"tuneIn": "https://tunein.com/radio/On-Our-Watch-p1436229/",
"stitcher": "https://www.stitcher.com/show/on-our-watch",
"rss": "https://feeds.npr.org/510360/podcast.xml"
}
},
"on-the-media": {
"id": "on-the-media",
"title": "On The Media",
"info": "Our weekly podcast explores how the media 'sausage' is made, casts an incisive eye on fluctuations in the marketplace of ideas, and examines threats to the freedom of information and expression in America and abroad. For one hour a week, the show tries to lift the veil from the process of \"making media,\" especially news media, because it's through that lens that we see the world and the world sees us",
"airtime": "SUN 2pm-3pm, MON 12am-1am",
"imageSrc": "https://ww2.kqed.org/radio/wp-content/uploads/sites/50/2018/04/onTheMedia.png",
"officialWebsiteLink": "https://www.wnycstudios.org/shows/otm",
"meta": {
"site": "news",
"source": "wnyc"
},
"link": "/radio/program/on-the-media",
"subscribe": {
"apple": "https://itunes.apple.com/us/podcast/on-the-media/id73330715?mt=2",
"tuneIn": "https://tunein.com/radio/On-the-Media-p69/",
"rss": "http://feeds.wnyc.org/onthemedia"
}
},
"pbs-newshour": {
"id": "pbs-newshour",
"title": "PBS NewsHour",
"info": "Analysis, background reports and updates from the PBS NewsHour putting today's news in context.",
"airtime": "MON-FRI 3pm-4pm",
"imageSrc": "https://cdn.kqed.org/wp-content/uploads/2024/04/PBS-News-Hour-Podcast-Tile-360x360-1.jpg",
"officialWebsiteLink": "https://www.pbs.org/newshour/",
"meta": {
"site": "news",
"source": "pbs"
},
"link": "/radio/program/pbs-newshour",
"subscribe": {
"apple": "https://itunes.apple.com/us/podcast/pbs-newshour-full-show/id394432287?mt=2",
"tuneIn": "https://tunein.com/radio/PBS-NewsHour---Full-Show-p425698/",
"rss": "https://www.pbs.org/newshour/feeds/rss/podcasts/show"
}
},
"perspectives": {
"id": "perspectives",
"title": "Perspectives",
"tagline": "KQED's series of daily listener commentaries since 1991",
"info": "KQED's series of daily listener commentaries since 1991.",
"imageSrc": "https://cdn.kqed.org/wp-content/uploads/2025/01/Perspectives_Tile_Final.jpg",
"officialWebsiteLink": "/perspectives/",
"meta": {
"site": "radio",
"source": "kqed",
"order": 14
},
"link": "/perspectives",
"subscribe": {
"apple": "https://podcasts.apple.com/us/podcast/id73801135",
"npr": "https://www.npr.org/podcasts/432309616/perspectives",
"rss": "https://ww2.kqed.org/perspectives/category/perspectives/feed/",
"google": "https://podcasts.google.com/feed/aHR0cHM6Ly93dzIua3FlZC5vcmcvcGVyc3BlY3RpdmVzL2NhdGVnb3J5L3BlcnNwZWN0aXZlcy9mZWVkLw"
}
},
"planet-money": {
"id": "planet-money",
"title": "Planet Money",
"info": "The economy explained. Imagine you could call up a friend and say, Meet me at the bar and tell me what's going on with the economy. Now imagine that's actually a fun evening.",
"airtime": "SUN 3pm-4pm",
"imageSrc": "https://ww2.kqed.org/radio/wp-content/uploads/sites/50/2018/04/planetmoney.jpg",
"officialWebsiteLink": "https://www.npr.org/sections/money/",
"meta": {
"site": "news",
"source": "npr"
},
"link": "/radio/program/planet-money",
"subscribe": {
"npr": "https://rpb3r.app.goo.gl/M4f5",
"apple": "https://itunes.apple.com/us/podcast/planet-money/id290783428?mt=2",
"tuneIn": "https://tunein.com/podcasts/Business--Economics-Podcasts/Planet-Money-p164680/",
"rss": "https://feeds.npr.org/510289/podcast.xml"
}
},
"politicalbreakdown": {
"id": "politicalbreakdown",
"title": "Political Breakdown",
"tagline": "Politics from a personal perspective",
"info": "Political Breakdown is a new series that explores the political intersection of California and the nation. Each week hosts Scott Shafer and Marisa Lagos are joined with a new special guest to unpack politics -- with personality — and offer an insider’s glimpse at how politics happens.",
"airtime": "THU 6:30pm-7pm",
"imageSrc": "https://cdn.kqed.org/wp-content/uploads/2024/04/Political-Breakdown-2024-Podcast-Tile-703x703-1.jpg",
"imageAlt": "KQED Political Breakdown",
"officialWebsiteLink": "/podcasts/politicalbreakdown",
"meta": {
"site": "radio",
"source": "kqed",
"order": 5
},
"link": "/podcasts/politicalbreakdown",
"subscribe": {
"apple": "https://podcasts.apple.com/us/podcast/political-breakdown/id1327641087",
"google": "https://podcasts.google.com/feed/aHR0cHM6Ly9mZWVkcy5tZWdhcGhvbmUuZm0vS1FJTkM5Nzk2MzI2MTEx",
"npr": "https://www.npr.org/podcasts/572155894/political-breakdown",
"stitcher": "https://www.stitcher.com/podcast/kqed/political-breakdown",
"spotify": "https://open.spotify.com/show/07RVyIjIdk2WDuVehvBMoN",
"rss": "https://ww2.kqed.org/news/tag/political-breakdown/feed/podcast"
}
},
"possible": {
"id": "possible",
"title": "Possible",
"info": "Possible is hosted by entrepreneur Reid Hoffman and writer Aria Finger. Together in Possible, Hoffman and Finger lead enlightening discussions about building a brighter collective future. The show features interviews with visionary guests like Trevor Noah, Sam Altman and Janette Sadik-Khan. Possible paints an optimistic portrait of the world we can create through science, policy, business, art and our shared humanity. It asks: What if everything goes right for once? How can we get there? Each episode also includes a short fiction story generated by advanced AI GPT-4, serving as a thought-provoking springboard to speculate how humanity could leverage technology for good.",
"airtime": "SUN 2pm",
"imageSrc": "https://cdn.kqed.org/wp-content/uploads/2024/04/Possible-Podcast-Tile-360x360-1.jpg",
"officialWebsiteLink": "https://www.possible.fm/",
"meta": {
"site": "news",
"source": "Possible"
},
"link": "/radio/program/possible",
"subscribe": {
"apple": "https://podcasts.apple.com/us/podcast/possible/id1677184070",
"spotify": "https://open.spotify.com/show/730YpdUSNlMyPQwNnyjp4k"
}
},
"pri-the-world": {
"id": "pri-the-world",
"title": "PRI's The World: Latest Edition",
"info": "Each weekday, host Marco Werman and his team of producers bring you the world's most interesting stories in an hour of radio that reminds us just how small our planet really is.",
"airtime": "MON-FRI 2pm-3pm",
"imageSrc": "https://cdn.kqed.org/wp-content/uploads/2024/04/The-World-Podcast-Tile-360x360-1.jpg",
"officialWebsiteLink": "https://www.pri.org/programs/the-world",
"meta": {
"site": "news",
"source": "PRI"
},
"link": "/radio/program/pri-the-world",
"subscribe": {
"apple": "https://itunes.apple.com/us/podcast/pris-the-world-latest-edition/id278196007?mt=2",
"tuneIn": "https://tunein.com/podcasts/News--Politics-Podcasts/PRIs-The-World-p24/",
"rss": "http://feeds.feedburner.com/pri/theworld"
}
},
"radiolab": {
"id": "radiolab",
"title": "Radiolab",
"info": "A two-time Peabody Award-winner, Radiolab is an investigation told through sounds and stories, and centered around one big idea. In the Radiolab world, information sounds like music and science and culture collide. Hosted by Jad Abumrad and Robert Krulwich, the show is designed for listeners who demand skepticism, but appreciate wonder. WNYC Studios is the producer of other leading podcasts including Freakonomics Radio, Death, Sex & Money, On the Media and many more.",
"airtime": "SUN 12am-1am, SAT 2pm-3pm",
"imageSrc": "https://ww2.kqed.org/radio/wp-content/uploads/sites/50/2018/04/radiolab1400.png",
"officialWebsiteLink": "https://www.wnycstudios.org/shows/radiolab/",
"meta": {
"site": "science",
"source": "WNYC"
},
"link": "/radio/program/radiolab",
"subscribe": {
"apple": "https://itunes.apple.com/us/podcast/radiolab/id152249110?mt=2",
"tuneIn": "https://tunein.com/radio/RadioLab-p68032/",
"rss": "https://feeds.wnyc.org/radiolab"
}
},
"reveal": {
"id": "reveal",
"title": "Reveal",
"info": "Created by The Center for Investigative Reporting and PRX, Reveal is public radios first one-hour weekly radio show and podcast dedicated to investigative reporting. Credible, fact based and without a partisan agenda, Reveal combines the power and artistry of driveway moment storytelling with data-rich reporting on critically important issues. The result is stories that inform and inspire, arming our listeners with information to right injustices, hold the powerful accountable and improve lives.Reveal is hosted by Al Letson and showcases the award-winning work of CIR and newsrooms large and small across the nation. In a radio and podcast market crowded with choices, Reveal focuses on important and often surprising stories that illuminate the world for our listeners.",
"airtime": "SAT 4pm-5pm",
"imageSrc": "https://ww2.kqed.org/radio/wp-content/uploads/sites/50/2018/04/reveal300px.png",
"officialWebsiteLink": "https://www.revealnews.org/episodes/",
"meta": {
"site": "news",
"source": "npr"
},
"link": "/radio/program/reveal",
"subscribe": {
"apple": "https://itunes.apple.com/us/podcast/reveal/id886009669",
"tuneIn": "https://tunein.com/radio/Reveal-p679597/",
"rss": "http://feeds.revealradio.org/revealpodcast"
}
},
"rightnowish": {
"id": "rightnowish",
"title": "Rightnowish",
"tagline": "Art is where you find it",
"info": "Rightnowish digs into life in the Bay Area right now… ish. Journalist Pendarvis Harshaw takes us to galleries painted on the sides of liquor stores in West Oakland. We'll dance in warehouses in the Bayview, make smoothies with kids in South Berkeley, and listen to classical music in a 1984 Cutlass Supreme in Richmond. Every week, Pen talks to movers and shakers about how the Bay Area shapes what they create, and how they shape the place we call home.",
"imageSrc": "https://cdn.kqed.org/wp-content/uploads/2024/04/Rightnowish-Podcast-Tile-500x500-1.jpg",
"imageAlt": "KQED Rightnowish with Pendarvis Harshaw",
"officialWebsiteLink": "/podcasts/rightnowish",
"meta": {
"site": "arts",
"source": "kqed",
"order": 16
},
"link": "/podcasts/rightnowish",
"subscribe": {
"npr": "https://www.npr.org/podcasts/721590300/rightnowish",
"rss": "https://ww2.kqed.org/arts/programs/rightnowish/feed/podcast",
"apple": "https://podcasts.apple.com/us/podcast/rightnowish/id1482187648",
"stitcher": "https://www.stitcher.com/podcast/kqed/rightnowish",
"google": "https://podcasts.google.com/feed/aHR0cHM6Ly9mZWVkcy5tZWdhcGhvbmUuZm0vS1FJTkMxMjU5MTY3NDc4",
"spotify": "https://open.spotify.com/show/7kEJuafTzTVan7B78ttz1I"
}
},
"science-friday": {
"id": "science-friday",
"title": "Science Friday",
"info": "Science Friday is a weekly science talk show, broadcast live over public radio stations nationwide. Each week, the show focuses on science topics that are in the news and tries to bring an educated, balanced discussion to bear on the scientific issues at hand. Panels of expert guests join host Ira Flatow, a veteran science journalist, to discuss science and to take questions from listeners during the call-in portion of the program.",
"airtime": "FRI 11am-1pm",
"imageSrc": "https://cdn.kqed.org/wp-content/uploads/2024/04/Science-Friday-Podcast-Tile-360x360-1.jpg",
"officialWebsiteLink": "https://www.wnycstudios.org/shows/science-friday",
"meta": {
"site": "news",
"source": "npr"
},
"link": "/radio/program/science-friday",
"subscribe": {
"apple": "https://itunes.apple.com/WebObjects/MZStore.woa/wa/viewPodcast?s=143441&mt=2&id=73329284&at=11l79Y&ct=nprdirectory",
"tuneIn": "https://tunein.com/radio/Science-Friday-p394/",
"rss": "http://feeds.wnyc.org/science-friday"
}
},
"snap-judgment": {
"id": "snap-judgment",
"title": "Snap Judgment",
"tagline": "Real stories with killer beats",
"info": "The Snap Judgment radio show and podcast mixes real stories with killer beats to produce cinematic, dramatic radio. Snap's musical brand of storytelling dares listeners to see the world through the eyes of another. This is storytelling... with a BEAT!! Snap first aired on public radio stations nationwide in July 2010. Today, Snap Judgment airs on over 450 public radio stations and is brought to the airwaves by KQED & PRX.",
"airtime": "SAT 1pm-2pm, 9pm-10pm",
"imageSrc": "https://cdn.kqed.org/wp-content/uploads/2024/05/Snap-Judgment-Podcast-Tile-703x703-1.jpg",
"officialWebsiteLink": "https://snapjudgment.org",
"meta": {
"site": "arts",
"source": "kqed",
"order": 4
},
"link": "https://snapjudgment.org",
"subscribe": {
"apple": "https://podcasts.apple.com/us/podcast/snap-judgment/id283657561",
"npr": "https://www.npr.org/podcasts/449018144/snap-judgment",
"stitcher": "https://www.pandora.com/podcast/snap-judgment/PC:241?source=stitcher-sunset",
"spotify": "https://open.spotify.com/show/3Cct7ZWmxHNAtLgBTqjC5v",
"rss": "https://snap.feed.snapjudgment.org/"
}
},
"soldout": {
"id": "soldout",
"title": "SOLD OUT: Rethinking Housing in America",
"tagline": "A new future for housing",
"info": "Sold Out: Rethinking Housing in America",
"imageSrc": "https://cdn.kqed.org/wp-content/uploads/2024/04/Sold-Out-Podcast-Tile-703x703-1.jpg",
"imageAlt": "KQED Sold Out: Rethinking Housing in America",
"officialWebsiteLink": "/podcasts/soldout",
"meta": {
"site": "news",
"source": "kqed",
"order": 13
},
"link": "/podcasts/soldout",
"subscribe": {
"npr": "https://www.npr.org/podcasts/911586047/s-o-l-d-o-u-t-a-new-future-for-housing",
"apple": "https://podcasts.apple.com/us/podcast/introducing-sold-out-rethinking-housing-in-america/id1531354937",
"rss": "https://feeds.megaphone.fm/soldout",
"spotify": "https://open.spotify.com/show/38dTBSk2ISFoPiyYNoKn1X",
"stitcher": "https://www.stitcher.com/podcast/kqed/sold-out-rethinking-housing-in-america",
"tunein": "https://tunein.com/radio/SOLD-OUT-Rethinking-Housing-in-America-p1365871/",
"google": "https://podcasts.google.com/feed/aHR0cHM6Ly9mZWVkcy5tZWdhcGhvbmUuZm0vc29sZG91dA"
}
},
"spooked": {
"id": "spooked",
"title": "Spooked",
"tagline": "True-life supernatural stories",
"info": "",
"imageSrc": "https://cdn.kqed.org/wp-content/uploads/2024/10/Spooked-Podcast-Tile-703x703-1.jpg",
"imageAlt": "",
"officialWebsiteLink": "https://spookedpodcast.org/",
"meta": {
"site": "news",
"source": "kqed",
"order": 7
},
"link": "https://spookedpodcast.org/",
"subscribe": {
"apple": "https://podcasts.apple.com/us/podcast/spooked/id1279361017",
"npr": "https://www.npr.org/podcasts/549547848/snap-judgment-presents-spooked",
"spotify": "https://open.spotify.com/show/76571Rfl3m7PLJQZKQIGCT",
"rss": "https://feeds.simplecast.com/TBotaapn"
}
},
"tech-nation": {
"id": "tech-nation",
"title": "Tech Nation Radio Podcast",
"info": "Tech Nation is a weekly public radio program, hosted by Dr. Moira Gunn. Founded in 1993, it has grown from a simple interview show to a multi-faceted production, featuring conversations with noted technology and science leaders, and a weekly science and technology-related commentary.",
"airtime": "FRI 10pm",
"imageSrc": "https://cdn.kqed.org/wp-content/uploads/2024/04/Tech-Nation-Radio-Podcast-Tile-360x360-1.jpg",
"officialWebsiteLink": "http://technation.podomatic.com/",
"meta": {
"site": "science",
"source": "Tech Nation Media"
},
"link": "/radio/program/tech-nation",
"subscribe": {
"rss": "https://technation.podomatic.com/rss2.xml"
}
},
"ted-radio-hour": {
"id": "ted-radio-hour",
"title": "TED Radio Hour",
"info": "The TED Radio Hour is a journey through fascinating ideas, astonishing inventions, fresh approaches to old problems, and new ways to think and create.",
"airtime": "SUN 3pm-4pm, SAT 10pm-11pm",
"imageSrc": "https://ww2.kqed.org/radio/wp-content/uploads/sites/50/2018/04/tedRadioHour.jpg",
"officialWebsiteLink": "https://www.npr.org/programs/ted-radio-hour/?showDate=2018-06-22",
"meta": {
"site": "news",
"source": "npr"
},
"link": "/radio/program/ted-radio-hour",
"subscribe": {
"npr": "https://rpb3r.app.goo.gl/8vsS",
"apple": "https://itunes.apple.com/WebObjects/MZStore.woa/wa/viewPodcast?s=143441&mt=2&id=523121474&at=11l79Y&ct=nprdirectory",
"tuneIn": "https://tunein.com/radio/TED-Radio-Hour-p418021/",
"rss": "https://feeds.npr.org/510298/podcast.xml"
}
},
"thebay": {
"id": "thebay",
"title": "The Bay",
"tagline": "Local news to keep you rooted",
"info": "Host Devin Katayama walks you through the biggest story of the day with reporters and newsmakers.",
"imageSrc": "https://cdn.kqed.org/wp-content/uploads/2024/04/The-Bay-Podcast-Tile-703x703-1.jpg",
"imageAlt": "KQED The Bay",
"officialWebsiteLink": "/podcasts/thebay",
"meta": {
"site": "radio",
"source": "kqed",
"order": 2
},
"link": "/podcasts/thebay",
"subscribe": {
"apple": "https://podcasts.apple.com/us/podcast/the-bay/id1350043452",
"google": "https://podcasts.google.com/feed/aHR0cHM6Ly9mZWVkcy5tZWdhcGhvbmUuZm0vS1FJTkM4MjU5Nzg2MzI3",
"npr": "https://www.npr.org/podcasts/586725995/the-bay",
"stitcher": "https://www.stitcher.com/podcast/kqed/the-bay",
"spotify": "https://open.spotify.com/show/4BIKBKIujizLHlIlBNaAqQ",
"rss": "https://feeds.megaphone.fm/KQINC8259786327"
}
},
"thelatest": {
"id": "thelatest",
"title": "The Latest",
"tagline": "Trusted local news in real time",
"info": "",
"imageSrc": "https://cdn.kqed.org/wp-content/uploads/2025/05/The-Latest-2025-Podcast-Tile-703x703-1.jpg",
"imageAlt": "KQED The Latest",
"officialWebsiteLink": "/thelatest",
"meta": {
"site": "news",
"source": "kqed",
"order": 6
},
"link": "/thelatest",
"subscribe": {
"apple": "https://podcasts.apple.com/us/podcast/the-latest-from-kqed/id1197721799",
"npr": "https://www.npr.org/podcasts/1257949365/the-latest-from-k-q-e-d",
"spotify": "https://open.spotify.com/show/5KIIXMgM9GTi5AepwOYvIZ?si=bd3053fec7244dba",
"rss": "https://feeds.megaphone.fm/KQINC9137121918"
}
},
"theleap": {
"id": "theleap",
"title": "The Leap",
"tagline": "What if you closed your eyes, and jumped?",
"info": "Stories about people making dramatic, risky changes, told by award-winning public radio reporter Judy Campbell.",
"imageSrc": "https://cdn.kqed.org/wp-content/uploads/2024/04/The-Leap-Podcast-Tile-703x703-1.jpg",
"imageAlt": "KQED The Leap",
"officialWebsiteLink": "/podcasts/theleap",
"meta": {
"site": "news",
"source": "kqed",
"order": 17
},
"link": "/podcasts/theleap",
"subscribe": {
"apple": "https://podcasts.apple.com/us/podcast/the-leap/id1046668171",
"google": "https://podcasts.google.com/feed/aHR0cHM6Ly9mZWVkcy5tZWdhcGhvbmUuZm0vS1FJTkM0NTcwODQ2MjY2",
"npr": "https://www.npr.org/podcasts/447248267/the-leap",
"stitcher": "https://www.stitcher.com/podcast/kqed/the-leap",
"spotify": "https://open.spotify.com/show/3sSlVHHzU0ytLwuGs1SD1U",
"rss": "https://ww2.kqed.org/news/programs/the-leap/feed/podcast"
}
},
"the-moth-radio-hour": {
"id": "the-moth-radio-hour",
"title": "The Moth Radio Hour",
"info": "Since its launch in 1997, The Moth has presented thousands of true stories, told live and without notes, to standing-room-only crowds worldwide. Moth storytellers stand alone, under a spotlight, with only a microphone and a roomful of strangers. The storyteller and the audience embark on a high-wire act of shared experience which is both terrifying and exhilarating. Since 2008, The Moth podcast has featured many of our favorite stories told live on Moth stages around the country. For information on all of our programs and live events, visit themoth.org.",
"airtime": "SAT 8pm-9pm and SUN 11am-12pm",
"imageSrc": "https://ww2.kqed.org/radio/wp-content/uploads/sites/50/2018/04/theMoth.jpg",
"officialWebsiteLink": "https://themoth.org/",
"meta": {
"site": "arts",
"source": "prx"
},
"link": "/radio/program/the-moth-radio-hour",
"subscribe": {
"apple": "https://itunes.apple.com/us/podcast/the-moth-podcast/id275699983?mt=2",
"tuneIn": "https://tunein.com/radio/The-Moth-p273888/",
"rss": "http://feeds.themoth.org/themothpodcast"
}
},
"the-new-yorker-radio-hour": {
"id": "the-new-yorker-radio-hour",
"title": "The New Yorker Radio Hour",
"info": "The New Yorker Radio Hour is a weekly program presented by the magazine's editor, David Remnick, and produced by WNYC Studios and The New Yorker. Each episode features a diverse mix of interviews, profiles, storytelling, and an occasional burst of humor inspired by the magazine, and shaped by its writers, artists, and editors. This isn't a radio version of a magazine, but something all its own, reflecting the rich possibilities of audio storytelling and conversation. Theme music for the show was composed and performed by Merrill Garbus of tUnE-YArDs.",
"airtime": "SAT 10am-11am",
"imageSrc": "https://cdn.kqed.org/wp-content/uploads/2024/04/The-New-Yorker-Podcast-Tile-360x360-1.jpg",
"officialWebsiteLink": "https://www.wnycstudios.org/shows/tnyradiohour",
"meta": {
"site": "arts",
"source": "WNYC"
},
"link": "/radio/program/the-new-yorker-radio-hour",
"subscribe": {
"apple": "https://itunes.apple.com/us/podcast/id1050430296",
"tuneIn": "https://tunein.com/podcasts/WNYC-Podcasts/New-Yorker-Radio-Hour-p803804/",
"rss": "https://feeds.feedburner.com/newyorkerradiohour"
}
},
"the-sam-sanders-show": {
"id": "the-sam-sanders-show",
"title": "The Sam Sanders Show",
"info": "One of public radio's most dynamic voices, Sam Sanders helped launch The NPR Politics Podcast and hosted NPR's hit show It's Been A Minute. Now, the award-winning host returns with something brand new, The Sam Sanders Show. Every week, Sam Sanders and friends dig into the culture that shapes our lives: what's driving the biggest trends, how artists really think, and even the memes you can't stop scrolling past. Sam is beloved for his way of unpacking the world and bringing you up close to fresh currents and engaging conversations. The Sam Sanders Show is smart, funny and always a good time.",
"airtime": "FRI 12-1pm AND SAT 11am-12pm",
"imageSrc": "https://cdn.kqed.org/wp-content/uploads/2025/11/The-Sam-Sanders-Show-Podcast-Tile-400x400-1.jpg",
"officialWebsiteLink": "https://www.kcrw.com/shows/the-sam-sanders-show/latest",
"meta": {
"site": "arts",
"source": "KCRW"
},
"link": "https://www.kcrw.com/shows/the-sam-sanders-show/latest",
"subscribe": {
"rss": "https://feed.cdnstream1.com/zjb/feed/download/ac/28/59/ac28594c-e1d0-4231-8728-61865cdc80e8.xml"
}
},
"the-splendid-table": {
"id": "the-splendid-table",
"title": "The Splendid Table",
"info": "\u003cem>The Splendid Table\u003c/em> hosts our nation's conversations about cooking, sustainability and food culture.",
"imageSrc": "https://cdn.kqed.org/wp-content/uploads/2024/04/The-Splendid-Table-Podcast-Tile-360x360-1.jpg",
"officialWebsiteLink": "https://www.splendidtable.org/",
"airtime": "SUN 10-11 pm",
"meta": {
"site": "radio",
"source": "npr"
},
"link": "/radio/program/the-splendid-table"
},
"this-american-life": {
"id": "this-american-life",
"title": "This American Life",
"info": "This American Life is a weekly public radio show, heard by 2.2 million people on more than 500 stations. Another 2.5 million people download the weekly podcast. It is hosted by Ira Glass, produced in collaboration with Chicago Public Media, delivered to stations by PRX The Public Radio Exchange, and has won all of the major broadcasting awards.",
"airtime": "SAT 12pm-1pm, 7pm-8pm",
"imageSrc": "https://ww2.kqed.org/radio/wp-content/uploads/sites/50/2018/04/thisAmericanLife.png",
"officialWebsiteLink": "https://www.thisamericanlife.org/",
"meta": {
"site": "news",
"source": "wbez"
},
"link": "/radio/program/this-american-life",
"subscribe": {
"apple": "https://itunes.apple.com/WebObjects/MZStore.woa/wa/viewPodcast?s=143441&mt=2&id=201671138&at=11l79Y&ct=nprdirectory",
"rss": "https://www.thisamericanlife.org/podcast/rss.xml"
}
},
"tinydeskradio": {
"id": "tinydeskradio",
"title": "Tiny Desk Radio",
"info": "We're bringing the best of Tiny Desk to the airwaves, only on public radio.",
"airtime": "SUN 8pm and SAT 9pm",
"imageSrc": "https://cdn.kqed.org/wp-content/uploads/2025/04/300x300-For-Member-Station-Logo-Tiny-Desk-Radio-@2x.png",
"officialWebsiteLink": "https://www.npr.org/series/g-s1-52030/tiny-desk-radio",
"meta": {
"site": "news",
"source": "npr"
},
"link": "/radio/program/tinydeskradio",
"subscribe": {
"rss": "https://feeds.npr.org/g-s1-52030/rss.xml"
}
},
"wait-wait-dont-tell-me": {
"id": "wait-wait-dont-tell-me",
"title": "Wait Wait... Don't Tell Me!",
"info": "Peter Sagal and Bill Kurtis host the weekly NPR News quiz show alongside some of the best and brightest news and entertainment personalities.",
"airtime": "SUN 10am-11am, SAT 11am-12pm, SAT 6pm-7pm",
"imageSrc": "https://cdn.kqed.org/wp-content/uploads/2024/04/Wait-Wait-Podcast-Tile-300x300-1.jpg",
"officialWebsiteLink": "https://www.npr.org/programs/wait-wait-dont-tell-me/",
"meta": {
"site": "news",
"source": "npr"
},
"link": "/radio/program/wait-wait-dont-tell-me",
"subscribe": {
"npr": "https://rpb3r.app.goo.gl/Xogv",
"apple": "https://itunes.apple.com/WebObjects/MZStore.woa/wa/viewPodcast?s=143441&mt=2&id=121493804&at=11l79Y&ct=nprdirectory",
"tuneIn": "https://tunein.com/radio/Wait-Wait-Dont-Tell-Me-p46/",
"rss": "https://feeds.npr.org/344098539/podcast.xml"
}
},
"weekend-edition-saturday": {
"id": "weekend-edition-saturday",
"title": "Weekend Edition Saturday",
"info": "Weekend Edition Saturday wraps up the week's news and offers a mix of analysis and features on a wide range of topics, including arts, sports, entertainment, and human interest stories. The two-hour program is hosted by NPR's Peabody Award-winning Scott Simon.",
"airtime": "SAT 5am-10am",
"imageSrc": "https://cdn.kqed.org/wp-content/uploads/2024/04/Weekend-Edition-Podcast-Tile-360x360-1.jpg",
"officialWebsiteLink": "https://www.npr.org/programs/weekend-edition-saturday/",
"meta": {
"site": "news",
"source": "npr"
},
"link": "/radio/program/weekend-edition-saturday"
},
"weekend-edition-sunday": {
"id": "weekend-edition-sunday",
"title": "Weekend Edition Sunday",
"info": "Weekend Edition Sunday features interviews with newsmakers, artists, scientists, politicians, musicians, writers, theologians and historians. The program has covered news events from Nelson Mandela's 1990 release from a South African prison to the capture of Saddam Hussein.",
"airtime": "SUN 5am-10am",
"imageSrc": "https://cdn.kqed.org/wp-content/uploads/2024/04/Weekend-Edition-Podcast-Tile-360x360-1.jpg",
"officialWebsiteLink": "https://www.npr.org/programs/weekend-edition-sunday/",
"meta": {
"site": "news",
"source": "npr"
},
"link": "/radio/program/weekend-edition-sunday"
}
},
"racesReducer": {},
"racesGenElectionReducer": {},
"radioSchedulesReducer": {},
"listsReducer": {
"posts/lowdown?category=charts": {
"isFetching": false,
"latestQuery": {
"from": 0,
"postsToRender": 9
},
"tag": null,
"vitalsOnly": true,
"totalRequested": 9,
"isLoading": false,
"isLoadingMore": true,
"total": {
"value": 77,
"relation": "eq"
},
"items": [
"lowdown_15427",
"lowdown_13974",
"lowdown_26431",
"lowdown_12443",
"lowdown_23920",
"lowdown_9030",
"lowdown_7912",
"lowdown_16663",
"lowdown_14882"
]
}
},
"recallGuideReducer": {
"intros": {},
"policy": {},
"candidates": {}
},
"savedArticleReducer": {
"articles": [],
"status": {}
},
"pfsSessionReducer": {},
"subscriptionsReducer": {},
"termsReducer": {
"about": {
"name": "About",
"type": "terms",
"id": "about",
"slug": "about",
"link": "/about",
"taxonomy": "site"
},
"arts": {
"name": "Arts & Culture",
"grouping": [
"arts",
"pop",
"trulyca"
],
"description": "KQED Arts provides daily in-depth coverage of the Bay Area's music, art, film, performing arts, literature and arts news, as well as cultural commentary and criticism.",
"type": "terms",
"id": "arts",
"slug": "arts",
"link": "/arts",
"taxonomy": "site"
},
"artschool": {
"name": "Art School",
"parent": "arts",
"type": "terms",
"id": "artschool",
"slug": "artschool",
"link": "/artschool",
"taxonomy": "site"
},
"bayareabites": {
"name": "KQED food",
"grouping": [
"food",
"bayareabites",
"checkplease"
],
"parent": "food",
"type": "terms",
"id": "bayareabites",
"slug": "bayareabites",
"link": "/food",
"taxonomy": "site"
},
"bayareahiphop": {
"name": "Bay Area Hiphop",
"type": "terms",
"id": "bayareahiphop",
"slug": "bayareahiphop",
"link": "/bayareahiphop",
"taxonomy": "site"
},
"campaign21": {
"name": "Campaign 21",
"type": "terms",
"id": "campaign21",
"slug": "campaign21",
"link": "/campaign21",
"taxonomy": "site"
},
"checkplease": {
"name": "KQED food",
"grouping": [
"food",
"bayareabites",
"checkplease"
],
"parent": "food",
"type": "terms",
"id": "checkplease",
"slug": "checkplease",
"link": "/food",
"taxonomy": "site"
},
"education": {
"name": "Education",
"grouping": [
"education"
],
"type": "terms",
"id": "education",
"slug": "education",
"link": "/education",
"taxonomy": "site"
},
"elections": {
"name": "Elections",
"type": "terms",
"id": "elections",
"slug": "elections",
"link": "/elections",
"taxonomy": "site"
},
"events": {
"name": "Events",
"type": "terms",
"id": "events",
"slug": "events",
"link": "/events",
"taxonomy": "site"
},
"event": {
"name": "Event",
"alias": "events",
"type": "terms",
"id": "event",
"slug": "event",
"link": "/event",
"taxonomy": "site"
},
"filmschoolshorts": {
"name": "Film School Shorts",
"type": "terms",
"id": "filmschoolshorts",
"slug": "filmschoolshorts",
"link": "/filmschoolshorts",
"taxonomy": "site"
},
"food": {
"name": "KQED food",
"grouping": [
"food",
"bayareabites",
"checkplease"
],
"type": "terms",
"id": "food",
"slug": "food",
"link": "/food",
"taxonomy": "site"
},
"forum": {
"name": "Forum",
"relatedContentQuery": "posts/forum?",
"parent": "news",
"type": "terms",
"id": "forum",
"slug": "forum",
"link": "/forum",
"taxonomy": "site"
},
"futureofyou": {
"name": "Future of You",
"grouping": [
"science",
"futureofyou"
],
"parent": "science",
"type": "terms",
"id": "futureofyou",
"slug": "futureofyou",
"link": "/futureofyou",
"taxonomy": "site"
},
"jpepinheart": {
"name": "KQED food",
"relatedContentQuery": "posts/food,bayareabites,checkplease",
"parent": "food",
"type": "terms",
"id": "jpepinheart",
"slug": "jpepinheart",
"link": "/food",
"taxonomy": "site"
},
"liveblog": {
"name": "Live Blog",
"type": "terms",
"id": "liveblog",
"slug": "liveblog",
"link": "/liveblog",
"taxonomy": "site"
},
"livetv": {
"name": "Live TV",
"parent": "tv",
"type": "terms",
"id": "livetv",
"slug": "livetv",
"link": "/livetv",
"taxonomy": "site"
},
"lowdown": {
"name": "The Lowdown",
"relatedContentQuery": "posts/lowdown?",
"parent": "news",
"type": "terms",
"id": "lowdown",
"slug": "lowdown",
"link": "/lowdown",
"taxonomy": "site"
},
"mindshift": {
"name": "Mindshift",
"parent": "news",
"description": "MindShift explores the future of education by highlighting the innovative – and sometimes counterintuitive – ways educators and parents are helping all children succeed.",
"type": "terms",
"id": "mindshift",
"slug": "mindshift",
"link": "/mindshift",
"taxonomy": "site"
},
"news": {
"name": "News",
"grouping": [
"news",
"forum"
],
"type": "terms",
"id": "news",
"slug": "news",
"link": "/news",
"taxonomy": "site"
},
"perspectives": {
"name": "Perspectives",
"parent": "radio",
"type": "terms",
"id": "perspectives",
"slug": "perspectives",
"link": "/perspectives",
"taxonomy": "site"
},
"podcasts": {
"name": "Podcasts",
"type": "terms",
"id": "podcasts",
"slug": "podcasts",
"link": "/podcasts",
"taxonomy": "site"
},
"pop": {
"name": "Pop",
"parent": "arts",
"type": "terms",
"id": "pop",
"slug": "pop",
"link": "/pop",
"taxonomy": "site"
},
"pressroom": {
"name": "Pressroom",
"type": "terms",
"id": "pressroom",
"slug": "pressroom",
"link": "/pressroom",
"taxonomy": "site"
},
"quest": {
"name": "Quest",
"parent": "science",
"type": "terms",
"id": "quest",
"slug": "quest",
"link": "/quest",
"taxonomy": "site"
},
"radio": {
"name": "Radio",
"grouping": [
"forum",
"perspectives"
],
"description": "Listen to KQED Public Radio – home of Forum and The California Report – on 88.5 FM in San Francisco, 89.3 FM in Sacramento, 88.3 FM in Santa Rosa and 88.1 FM in Martinez.",
"type": "terms",
"id": "radio",
"slug": "radio",
"link": "/radio",
"taxonomy": "site"
},
"root": {
"name": "KQED",
"image": "https://ww2.kqed.org/app/uploads/2020/02/KQED-OG-Image@1x.png",
"imageWidth": 1200,
"imageHeight": 630,
"headData": {
"title": "KQED | News, Radio, Podcasts, TV | Public Media for Northern California",
"description": "KQED provides public radio, television, and independent reporting on issues that matter to the Bay Area. We’re the NPR and PBS member station for Northern California."
},
"type": "terms",
"id": "root",
"slug": "root",
"link": "/root",
"taxonomy": "site"
},
"science": {
"name": "Science",
"grouping": [
"science",
"futureofyou"
],
"description": "KQED Science brings you award-winning science and environment coverage from the Bay Area and beyond.",
"type": "terms",
"id": "science",
"slug": "science",
"link": "/science",
"taxonomy": "site"
},
"stateofhealth": {
"name": "State of Health",
"parent": "science",
"type": "terms",
"id": "stateofhealth",
"slug": "stateofhealth",
"link": "/stateofhealth",
"taxonomy": "site"
},
"support": {
"name": "Support",
"type": "terms",
"id": "support",
"slug": "support",
"link": "/support",
"taxonomy": "site"
},
"thedolist": {
"name": "The Do List",
"parent": "arts",
"type": "terms",
"id": "thedolist",
"slug": "thedolist",
"link": "/thedolist",
"taxonomy": "site"
},
"trulyca": {
"name": "Truly CA",
"grouping": [
"arts",
"pop",
"trulyca"
],
"parent": "arts",
"type": "terms",
"id": "trulyca",
"slug": "trulyca",
"link": "/trulyca",
"taxonomy": "site"
},
"tv": {
"name": "TV",
"type": "terms",
"id": "tv",
"slug": "tv",
"link": "/tv",
"taxonomy": "site"
},
"voterguide": {
"name": "Voter Guide",
"parent": "elections",
"alias": "elections",
"type": "terms",
"id": "voterguide",
"slug": "voterguide",
"link": "/voterguide",
"taxonomy": "site"
},
"guiaelectoral": {
"name": "Guia Electoral",
"parent": "elections",
"alias": "elections",
"type": "terms",
"id": "guiaelectoral",
"slug": "guiaelectoral",
"link": "/guiaelectoral",
"taxonomy": "site"
},
"lowdown_256": {
"type": "terms",
"id": "lowdown_256",
"meta": {
"index": "terms_1716263798",
"site": "lowdown",
"id": "256",
"found": true
},
"relationships": {},
"featImg": null,
"name": "Charts & Infographics",
"description": "Charts and infographics illustrating key statistics",
"taxonomy": "category",
"headData": {
"twImgId": null,
"twTitle": null,
"ogTitle": null,
"ogImgId": null,
"twDescription": null,
"description": "Charts and infographics illustrating key statistics",
"title": "Charts & Infographics Archives | KQED Arts",
"ogDescription": null,
"imageData": {
"ogImageSize": {
"file": "https://cdn.kqed.org/wp-content/uploads/2020/02/KQED-OG-Image@1x.png",
"width": 1200,
"height": 630
},
"twImageSize": {
"file": "https://cdn.kqed.org/wp-content/uploads/2020/02/KQED-OG-Image@1x.png"
},
"twitterCard": "summary_large_image"
}
},
"ttid": 258,
"slug": "charts",
"isLoading": false,
"link": "/lowdown/category/charts"
},
"lowdown_245": {
"type": "terms",
"id": "lowdown_245",
"meta": {
"index": "terms_1716263798",
"site": "lowdown",
"id": "245",
"found": true
},
"relationships": {},
"featImg": null,
"name": "All Videos",
"description": "A collection of embedded short news clips, animations, commentary and originally-produced videos ",
"taxonomy": "category",
"headData": {
"twImgId": null,
"twTitle": null,
"ogTitle": null,
"ogImgId": null,
"twDescription": null,
"description": "A collection of embedded short news clips, animations, commentary and originally-produced videos",
"title": "All Videos Archives | KQED Arts",
"ogDescription": null
},
"ttid": 247,
"slug": "video",
"isLoading": false,
"link": "/lowdown/category/video"
},
"lowdown_457": {
"type": "terms",
"id": "lowdown_457",
"meta": {
"index": "terms_1716263798",
"site": "lowdown",
"id": "457",
"found": true
},
"relationships": {},
"featImg": null,
"name": "Multimedia",
"description": "A collection of original and featured multimedia resources ",
"taxonomy": "category",
"headData": {
"twImgId": null,
"twTitle": null,
"ogTitle": null,
"ogImgId": null,
"twDescription": null,
"description": "A collection of original and featured multimedia resources",
"title": "Multimedia Archives | KQED Arts",
"ogDescription": null
},
"ttid": 462,
"slug": "multimedia",
"isLoading": false,
"link": "/lowdown/category/multimedia"
},
"lowdown_2408": {
"type": "terms",
"id": "lowdown_2408",
"meta": {
"index": "terms_1716263798",
"site": "lowdown",
"id": "2408",
"found": true
},
"relationships": {},
"featImg": null,
"name": "Transportation & Traffic",
"description": "How we get around.",
"taxonomy": "category",
"headData": {
"twImgId": null,
"twTitle": null,
"ogTitle": null,
"ogImgId": null,
"twDescription": null,
"description": "How we get around.",
"title": "Transportation & Traffic Archives | KQED Arts",
"ogDescription": null
},
"ttid": 2418,
"slug": "traffic",
"isLoading": false,
"link": "/lowdown/category/traffic"
},
"lowdown_2337": {
"type": "terms",
"id": "lowdown_2337",
"meta": {
"index": "terms_1716263798",
"site": "lowdown",
"id": "2337",
"found": true
},
"relationships": {},
"featImg": null,
"name": "featured",
"description": null,
"taxonomy": "tag",
"headData": {
"twImgId": null,
"twTitle": null,
"ogTitle": null,
"ogImgId": null,
"twDescription": null,
"description": null,
"title": "featured Archives | KQED Arts",
"ogDescription": null
},
"ttid": 2349,
"slug": "featured",
"isLoading": false,
"link": "/lowdown/tag/featured"
},
"lowdown_562": {
"type": "terms",
"id": "lowdown_562",
"meta": {
"index": "terms_1716263798",
"site": "lowdown",
"id": "562",
"found": true
},
"relationships": {},
"featImg": null,
"name": "plane boarding",
"description": null,
"taxonomy": "tag",
"headData": {
"twImgId": null,
"twTitle": null,
"ogTitle": null,
"ogImgId": null,
"twDescription": null,
"description": null,
"title": "plane boarding Archives | KQED Arts",
"ogDescription": null
},
"ttid": 567,
"slug": "plane-boarding",
"isLoading": false,
"link": "/lowdown/tag/plane-boarding"
},
"lowdown_563": {
"type": "terms",
"id": "lowdown_563",
"meta": {
"index": "terms_1716263798",
"site": "lowdown",
"id": "563",
"found": true
},
"relationships": {},
"featImg": null,
"name": "travel",
"description": null,
"taxonomy": "tag",
"headData": {
"twImgId": null,
"twTitle": null,
"ogTitle": null,
"ogImgId": null,
"twDescription": null,
"description": null,
"title": "travel Archives | KQED Arts",
"ogDescription": null
},
"ttid": 568,
"slug": "travel",
"isLoading": false,
"link": "/lowdown/tag/travel"
},
"lowdown_588": {
"type": "terms",
"id": "lowdown_588",
"meta": {
"index": "terms_1716263798",
"site": "lowdown",
"id": "588",
"found": true
},
"relationships": {},
"featImg": null,
"name": "Comics",
"description": "A collection of comic journalism pieces by illustrator Andy Warner. ",
"taxonomy": "category",
"headData": {
"twImgId": null,
"twTitle": null,
"ogTitle": null,
"ogImgId": null,
"twDescription": null,
"description": "A collection of comic journalism pieces by illustrator Andy Warner.",
"title": "Comics Archives | KQED Arts",
"ogDescription": null
},
"ttid": 593,
"slug": "comic-journalism",
"isLoading": false,
"link": "/lowdown/category/comic-journalism"
},
"lowdown_514": {
"type": "terms",
"id": "lowdown_514",
"meta": {
"index": "terms_1716263798",
"site": "lowdown",
"id": "514",
"found": true
},
"relationships": {},
"featImg": null,
"name": "Water and Drought",
"description": "These are dry times for the Golden State. Explore California's historic drought in this multimedia series.",
"taxonomy": "category",
"headData": {
"twImgId": null,
"twTitle": null,
"ogTitle": null,
"ogImgId": null,
"twDescription": null,
"description": "These are dry times for the Golden State. Explore California's historic drought in this multimedia series.",
"title": "Water and Drought Archives | KQED Arts",
"ogDescription": null
},
"ttid": 519,
"slug": "california-drought-green-space-2",
"isLoading": false,
"link": "/lowdown/category/california-drought-green-space-2"
},
"lowdown_530": {
"type": "terms",
"id": "lowdown_530",
"meta": {
"index": "terms_1716263798",
"site": "lowdown",
"id": "530",
"found": true
},
"relationships": {},
"featImg": null,
"name": "Wildfires and Earthquakes",
"description": null,
"taxonomy": "category",
"headData": {
"twImgId": null,
"twTitle": null,
"ogTitle": null,
"ogImgId": null,
"twDescription": null,
"description": null,
"title": "Wildfires and Earthquakes Archives | KQED Arts",
"ogDescription": null
},
"ttid": 535,
"slug": "wildfires-3",
"isLoading": false,
"link": "/lowdown/category/wildfires-3"
},
"lowdown_2612": {
"type": "terms",
"id": "lowdown_2612",
"meta": {
"index": "terms_1716263798",
"site": "lowdown",
"id": "2612",
"found": true
},
"relationships": {},
"featImg": null,
"name": "Detwiler Fire",
"description": null,
"taxonomy": "tag",
"headData": {
"twImgId": null,
"twTitle": null,
"ogTitle": null,
"ogImgId": null,
"twDescription": null,
"description": null,
"title": "Detwiler Fire Archives | KQED Arts",
"ogDescription": null
},
"ttid": 2622,
"slug": "detwiler-fire",
"isLoading": false,
"link": "/lowdown/tag/detwiler-fire"
},
"lowdown_464": {
"type": "terms",
"id": "lowdown_464",
"meta": {
"index": "terms_1716263798",
"site": "lowdown",
"id": "464",
"found": true
},
"relationships": {},
"featImg": null,
"name": "drought",
"description": null,
"taxonomy": "tag",
"headData": {
"twImgId": null,
"twTitle": null,
"ogTitle": null,
"ogImgId": null,
"twDescription": null,
"description": null,
"title": "drought Archives | KQED Arts",
"ogDescription": null
},
"ttid": 469,
"slug": "drought",
"isLoading": false,
"link": "/lowdown/tag/drought"
},
"lowdown_520": {
"type": "terms",
"id": "lowdown_520",
"meta": {
"index": "terms_1716263798",
"site": "lowdown",
"id": "520",
"found": true
},
"relationships": {},
"featImg": null,
"name": "wildfire",
"description": null,
"taxonomy": "tag",
"headData": {
"twImgId": null,
"twTitle": null,
"ogTitle": null,
"ogImgId": null,
"twDescription": null,
"description": null,
"title": "wildfire Archives | KQED Arts",
"ogDescription": null
},
"ttid": 525,
"slug": "wildfire",
"isLoading": false,
"link": "/lowdown/tag/wildfire"
},
"lowdown_2399": {
"type": "terms",
"id": "lowdown_2399",
"meta": {
"index": "terms_1716263798",
"site": "lowdown",
"id": "2399",
"found": true
},
"relationships": {},
"featImg": null,
"name": "Lesson Plans and Educator Guides",
"description": null,
"taxonomy": "category",
"headData": {
"twImgId": null,
"twTitle": null,
"ogTitle": null,
"ogImgId": null,
"twDescription": null,
"description": null,
"title": "Lesson Plans and Educator Guides Archives | KQED Arts",
"ogDescription": null
},
"ttid": 2409,
"slug": "lesson-plans-and-guides",
"isLoading": false,
"link": "/lowdown/category/lesson-plans-and-guides"
},
"lowdown_414": {
"type": "terms",
"id": "lowdown_414",
"meta": {
"index": "terms_1716263798",
"site": "lowdown",
"id": "414",
"found": true
},
"relationships": {},
"featImg": null,
"name": "poverty",
"description": null,
"taxonomy": "tag",
"headData": {
"twImgId": null,
"twTitle": null,
"ogTitle": null,
"ogImgId": null,
"twDescription": null,
"description": null,
"title": "poverty Archives | KQED Arts",
"ogDescription": null
},
"ttid": 417,
"slug": "poverty",
"isLoading": false,
"link": "/lowdown/tag/poverty"
},
"lowdown_391": {
"type": "terms",
"id": "lowdown_391",
"meta": {
"index": "terms_1716263798",
"site": "lowdown",
"id": "391",
"found": true
},
"relationships": {},
"featImg": null,
"name": "By the Numbers",
"description": "Interactive charts and videos explaining the math of news",
"taxonomy": "category",
"headData": {
"twImgId": null,
"twTitle": null,
"ogTitle": null,
"ogImgId": null,
"twDescription": null,
"description": "Interactive charts and videos explaining the math of news",
"title": "By the Numbers Archives | KQED Arts",
"ogDescription": null
},
"ttid": 394,
"slug": "math-assets",
"isLoading": false,
"link": "/lowdown/category/math-assets"
},
"lowdown_451": {
"type": "terms",
"id": "lowdown_451",
"meta": {
"index": "terms_1716263798",
"site": "lowdown",
"id": "451",
"found": true
},
"relationships": {},
"featImg": null,
"name": "Income Inequality",
"description": "Opportunity, inequality and the struggle to make a buck",
"taxonomy": "category",
"headData": {
"twImgId": null,
"twTitle": null,
"ogTitle": null,
"ogImgId": null,
"twDescription": null,
"description": "Opportunity, inequality and the struggle to make a buck",
"title": "Income Inequality Archives | KQED Arts",
"ogDescription": null
},
"ttid": 454,
"slug": "wealth-and-poverty",
"isLoading": false,
"link": "/lowdown/category/wealth-and-poverty"
},
"lowdown_242": {
"type": "terms",
"id": "lowdown_242",
"meta": {
"index": "terms_1716263798",
"site": "lowdown",
"id": "242",
"found": true
},
"relationships": {},
"featImg": null,
"name": "Interactive Maps",
"description": "Interactive maps ",
"taxonomy": "category",
"headData": {
"twImgId": null,
"twTitle": null,
"ogTitle": null,
"ogImgId": null,
"twDescription": null,
"description": "Interactive maps",
"title": "Interactive Maps Archives | KQED Arts",
"ogDescription": null
},
"ttid": 244,
"slug": "maps",
"isLoading": false,
"link": "/lowdown/category/maps"
},
"lowdown_435": {
"type": "terms",
"id": "lowdown_435",
"meta": {
"index": "terms_1716263798",
"site": "lowdown",
"id": "435",
"found": true
},
"relationships": {},
"featImg": null,
"name": "Labor & Minimum Wage",
"description": null,
"taxonomy": "category",
"headData": {
"twImgId": null,
"twTitle": null,
"ogTitle": null,
"ogImgId": null,
"twDescription": null,
"description": null,
"title": "Labor & Minimum Wage Archives | KQED Arts",
"ogDescription": null
},
"ttid": 438,
"slug": "minumum-wage",
"isLoading": false,
"link": "/lowdown/category/minumum-wage"
},
"lowdown_2524": {
"type": "terms",
"id": "lowdown_2524",
"meta": {
"index": "terms_1716263798",
"site": "lowdown",
"id": "2524",
"found": true
},
"relationships": {},
"featImg": null,
"name": "equal pay day",
"description": null,
"taxonomy": "tag",
"headData": {
"twImgId": null,
"twTitle": null,
"ogTitle": null,
"ogImgId": null,
"twDescription": null,
"description": null,
"title": "equal pay day Archives | KQED Arts",
"ogDescription": null
},
"ttid": 2534,
"slug": "equal-pay-day",
"isLoading": false,
"link": "/lowdown/tag/equal-pay-day"
},
"lowdown_2522": {
"type": "terms",
"id": "lowdown_2522",
"meta": {
"index": "terms_1716263798",
"site": "lowdown",
"id": "2522",
"found": true
},
"relationships": {},
"featImg": null,
"name": "wage gap",
"description": null,
"taxonomy": "tag",
"headData": {
"twImgId": null,
"twTitle": null,
"ogTitle": null,
"ogImgId": null,
"twDescription": null,
"description": null,
"title": "wage gap Archives | KQED Arts",
"ogDescription": null
},
"ttid": 2532,
"slug": "wage-gap",
"isLoading": false,
"link": "/lowdown/tag/wage-gap"
},
"lowdown_2363": {
"type": "terms",
"id": "lowdown_2363",
"meta": {
"index": "terms_1716263798",
"site": "lowdown",
"id": "2363",
"found": true
},
"relationships": {},
"featImg": null,
"name": "Golden State of Mind",
"description": null,
"taxonomy": "category",
"headData": {
"twImgId": null,
"twTitle": null,
"ogTitle": null,
"ogImgId": null,
"twDescription": null,
"description": null,
"title": "Golden State of Mind Archives | KQED Arts",
"ogDescription": null
},
"ttid": 2374,
"slug": "california-dreamin",
"isLoading": false,
"link": "/lowdown/category/california-dreamin"
},
"lowdown_2375": {
"type": "terms",
"id": "lowdown_2375",
"meta": {
"index": "terms_1716263798",
"site": "lowdown",
"id": "2375",
"found": true
},
"relationships": {},
"featImg": null,
"name": "Higher Ed",
"description": null,
"taxonomy": "category",
"headData": {
"twImgId": null,
"twTitle": null,
"ogTitle": null,
"ogImgId": null,
"twDescription": null,
"description": null,
"title": "Higher Ed Archives | KQED Arts",
"ogDescription": null
},
"ttid": 2386,
"slug": "college",
"isLoading": false,
"link": "/lowdown/category/college"
},
"lowdown_158": {
"type": "terms",
"id": "lowdown_158",
"meta": {
"index": "terms_1716263798",
"site": "lowdown",
"id": "158",
"found": true
},
"relationships": {},
"featImg": null,
"name": "California State University; University of California; tuition",
"description": null,
"taxonomy": "tag",
"headData": {
"twImgId": null,
"twTitle": null,
"ogTitle": null,
"ogImgId": null,
"twDescription": null,
"description": null,
"title": "California State University; University of California; tuition Archives | KQED Arts",
"ogDescription": null
},
"ttid": 159,
"slug": "california-state-university-university-of-california-tuition",
"isLoading": false,
"link": "/lowdown/tag/california-state-university-university-of-california-tuition"
},
"lowdown_2559": {
"type": "terms",
"id": "lowdown_2559",
"meta": {
"index": "terms_1716263798",
"site": "lowdown",
"id": "2559",
"found": true
},
"relationships": {},
"featImg": null,
"name": "csu",
"description": null,
"taxonomy": "tag",
"headData": {
"twImgId": null,
"twTitle": null,
"ogTitle": null,
"ogImgId": null,
"twDescription": null,
"description": null,
"title": "csu Archives | KQED Arts",
"ogDescription": null
},
"ttid": 2569,
"slug": "csu",
"isLoading": false,
"link": "/lowdown/tag/csu"
},
"lowdown_2561": {
"type": "terms",
"id": "lowdown_2561",
"meta": {
"index": "terms_1716263798",
"site": "lowdown",
"id": "2561",
"found": true
},
"relationships": {},
"featImg": null,
"name": "student debt",
"description": null,
"taxonomy": "tag",
"headData": {
"twImgId": null,
"twTitle": null,
"ogTitle": null,
"ogImgId": null,
"twDescription": null,
"description": null,
"title": "student debt Archives | KQED Arts",
"ogDescription": null
},
"ttid": 2571,
"slug": "student-debt",
"isLoading": false,
"link": "/lowdown/tag/student-debt"
},
"lowdown_2532": {
"type": "terms",
"id": "lowdown_2532",
"meta": {
"index": "terms_1716263798",
"site": "lowdown",
"id": "2532",
"found": true
},
"relationships": {},
"featImg": null,
"name": "tuition",
"description": null,
"taxonomy": "tag",
"headData": {
"twImgId": null,
"twTitle": null,
"ogTitle": null,
"ogImgId": null,
"twDescription": null,
"description": null,
"title": "tuition Archives | KQED Arts",
"ogDescription": null
},
"ttid": 2542,
"slug": "tuition",
"isLoading": false,
"link": "/lowdown/tag/tuition"
},
"lowdown_2560": {
"type": "terms",
"id": "lowdown_2560",
"meta": {
"index": "terms_1716263798",
"site": "lowdown",
"id": "2560",
"found": true
},
"relationships": {},
"featImg": null,
"name": "uc",
"description": null,
"taxonomy": "tag",
"headData": {
"twImgId": null,
"twTitle": null,
"ogTitle": null,
"ogImgId": null,
"twDescription": null,
"description": null,
"title": "uc Archives | KQED Arts",
"ogDescription": null
},
"ttid": 2570,
"slug": "uc",
"isLoading": false,
"link": "/lowdown/tag/uc"
},
"lowdown_2390": {
"type": "terms",
"id": "lowdown_2390",
"meta": {
"index": "terms_1716263798",
"site": "lowdown",
"id": "2390",
"found": true
},
"relationships": {},
"featImg": null,
"name": "Civil Rights Struggles",
"description": null,
"taxonomy": "category",
"headData": {
"twImgId": null,
"twTitle": null,
"ogTitle": null,
"ogImgId": null,
"twDescription": null,
"description": null,
"title": "Civil Rights Struggles Archives | KQED Arts",
"ogDescription": null
},
"ttid": 2400,
"slug": "civil-rights-struggles",
"isLoading": false,
"link": "/lowdown/category/civil-rights-struggles"
},
"lowdown_50": {
"type": "terms",
"id": "lowdown_50",
"meta": {
"index": "terms_1716263798",
"site": "lowdown",
"id": "50",
"found": true
},
"relationships": {},
"featImg": null,
"name": "civil rights",
"description": null,
"taxonomy": "tag",
"headData": {
"twImgId": null,
"twTitle": null,
"ogTitle": null,
"ogImgId": null,
"twDescription": null,
"description": null,
"title": "civil rights Archives | KQED Arts",
"ogDescription": null
},
"ttid": 50,
"slug": "civil-rights",
"isLoading": false,
"link": "/lowdown/tag/civil-rights"
},
"lowdown_402": {
"type": "terms",
"id": "lowdown_402",
"meta": {
"index": "terms_1716263798",
"site": "lowdown",
"id": "402",
"found": true
},
"relationships": {},
"featImg": null,
"name": "equality",
"description": null,
"taxonomy": "tag",
"headData": {
"twImgId": null,
"twTitle": null,
"ogTitle": null,
"ogImgId": null,
"twDescription": null,
"description": null,
"title": "equality Archives | KQED Arts",
"ogDescription": null
},
"ttid": 405,
"slug": "equality",
"isLoading": false,
"link": "/lowdown/tag/equality"
},
"lowdown_401": {
"type": "terms",
"id": "lowdown_401",
"meta": {
"index": "terms_1716263798",
"site": "lowdown",
"id": "401",
"found": true
},
"relationships": {},
"featImg": null,
"name": "March on Washington",
"description": null,
"taxonomy": "tag",
"headData": {
"twImgId": null,
"twTitle": null,
"ogTitle": null,
"ogImgId": null,
"twDescription": null,
"description": null,
"title": "March on Washington Archives | KQED Arts",
"ogDescription": null
},
"ttid": 404,
"slug": "march-on-washington",
"isLoading": false,
"link": "/lowdown/tag/march-on-washington"
},
"lowdown_53": {
"type": "terms",
"id": "lowdown_53",
"meta": {
"index": "terms_1716263798",
"site": "lowdown",
"id": "53",
"found": true
},
"relationships": {},
"featImg": null,
"name": "martin luther king",
"description": null,
"taxonomy": "tag",
"headData": {
"twImgId": null,
"twTitle": null,
"ogTitle": null,
"ogImgId": null,
"twDescription": null,
"description": null,
"title": "martin luther king Archives | KQED Arts",
"ogDescription": null
},
"ttid": 53,
"slug": "martin-luther-king",
"isLoading": false,
"link": "/lowdown/tag/martin-luther-king"
},
"lowdown_491": {
"type": "terms",
"id": "lowdown_491",
"meta": {
"index": "terms_1716263798",
"site": "lowdown",
"id": "491",
"found": true
},
"relationships": {},
"featImg": null,
"name": "High Cost of Cheap Fashion",
"description": "Where does your clothing come from? Learn about the high cost of cheap fashion.",
"taxonomy": "category",
"headData": {
"twImgId": null,
"twTitle": null,
"ogTitle": null,
"ogImgId": null,
"twDescription": null,
"description": "Where does your clothing come from? Learn about the high cost of cheap fashion.",
"title": "High Cost of Cheap Fashion Archives | KQED Arts",
"ogDescription": null
},
"ttid": 496,
"slug": "high-cost-of-cheap-fashion",
"isLoading": false,
"link": "/lowdown/category/high-cost-of-cheap-fashion"
},
"lowdown_2402": {
"type": "terms",
"id": "lowdown_2402",
"meta": {
"index": "terms_1716263798",
"site": "lowdown",
"id": "2402",
"found": true
},
"relationships": {},
"featImg": null,
"name": "Human Rights",
"description": null,
"taxonomy": "category",
"headData": {
"twImgId": null,
"twTitle": null,
"ogTitle": null,
"ogImgId": null,
"twDescription": null,
"description": null,
"title": "Human Rights Archives | KQED Arts",
"ogDescription": null
},
"ttid": 2412,
"slug": "human-rights",
"isLoading": false,
"link": "/lowdown/category/human-rights"
},
"lowdown_357": {
"type": "terms",
"id": "lowdown_357",
"meta": {
"index": "terms_1716263798",
"site": "lowdown",
"id": "357",
"found": true
},
"relationships": {},
"featImg": null,
"name": "Bangladesh",
"description": null,
"taxonomy": "tag",
"headData": {
"twImgId": null,
"twTitle": null,
"ogTitle": null,
"ogImgId": null,
"twDescription": null,
"description": null,
"title": "Bangladesh Archives | KQED Arts",
"ogDescription": null
},
"ttid": 360,
"slug": "bangladesh",
"isLoading": false,
"link": "/lowdown/tag/bangladesh"
},
"lowdown_359": {
"type": "terms",
"id": "lowdown_359",
"meta": {
"index": "terms_1716263798",
"site": "lowdown",
"id": "359",
"found": true
},
"relationships": {},
"featImg": null,
"name": "clothing",
"description": null,
"taxonomy": "tag",
"headData": {
"twImgId": null,
"twTitle": null,
"ogTitle": null,
"ogImgId": null,
"twDescription": null,
"description": null,
"title": "clothing Archives | KQED Arts",
"ogDescription": null
},
"ttid": 362,
"slug": "clothing",
"isLoading": false,
"link": "/lowdown/tag/clothing"
},
"lowdown_358": {
"type": "terms",
"id": "lowdown_358",
"meta": {
"index": "terms_1716263798",
"site": "lowdown",
"id": "358",
"found": true
},
"relationships": {},
"featImg": null,
"name": "fast fashion",
"description": null,
"taxonomy": "tag",
"headData": {
"twImgId": null,
"twTitle": null,
"ogTitle": null,
"ogImgId": null,
"twDescription": null,
"description": null,
"title": "fast fashion Archives | KQED Arts",
"ogDescription": null
},
"ttid": 361,
"slug": "fast-fashion",
"isLoading": false,
"link": "/lowdown/tag/fast-fashion"
},
"lowdown_360": {
"type": "terms",
"id": "lowdown_360",
"meta": {
"index": "terms_1716263798",
"site": "lowdown",
"id": "360",
"found": true
},
"relationships": {},
"featImg": null,
"name": "workers",
"description": null,
"taxonomy": "tag",
"headData": {
"twImgId": null,
"twTitle": null,
"ogTitle": null,
"ogImgId": null,
"twDescription": null,
"description": null,
"title": "workers Archives | KQED Arts",
"ogDescription": null
},
"ttid": 363,
"slug": "workers",
"isLoading": false,
"link": "/lowdown/tag/workers"
},
"lowdown_2362": {
"type": "terms",
"id": "lowdown_2362",
"meta": {
"index": "terms_1716263798",
"site": "lowdown",
"id": "2362",
"found": true
},
"relationships": {},
"featImg": null,
"name": "Immigration",
"description": "America's complicated, ever-changing relationship with its most recent residents.",
"taxonomy": "category",
"headData": {
"twImgId": null,
"twTitle": null,
"ogTitle": null,
"ogImgId": null,
"twDescription": null,
"description": "America's complicated, ever-changing relationship with its most recent residents.",
"title": "Immigration Archives | KQED Arts",
"ogDescription": null
},
"ttid": 459,
"slug": "immigration",
"isLoading": false,
"link": "/lowdown/category/immigration"
},
"lowdown_135": {
"type": "terms",
"id": "lowdown_135",
"meta": {
"index": "terms_1716263798",
"site": "lowdown",
"id": "135",
"found": true
},
"relationships": {},
"featImg": null,
"name": "Illegal immigration",
"description": null,
"taxonomy": "tag",
"headData": {
"twImgId": null,
"twTitle": null,
"ogTitle": null,
"ogImgId": null,
"twDescription": null,
"description": null,
"title": "Illegal immigration Archives | KQED Arts",
"ogDescription": null
},
"ttid": 136,
"slug": "illegal-immigration",
"isLoading": false,
"link": "/lowdown/tag/illegal-immigration"
},
"lowdown_136": {
"type": "terms",
"id": "lowdown_136",
"meta": {
"index": "terms_1716263798",
"site": "lowdown",
"id": "136",
"found": true
},
"relationships": {},
"featImg": null,
"name": "Undocumented Immigrants",
"description": null,
"taxonomy": "tag",
"headData": {
"twImgId": null,
"twTitle": null,
"ogTitle": null,
"ogImgId": null,
"twDescription": null,
"description": null,
"title": "Undocumented Immigrants Archives | KQED Arts",
"ogDescription": null
},
"ttid": 137,
"slug": "undocumented-immigrants",
"isLoading": false,
"link": "/lowdown/tag/undocumented-immigrants"
},
"lowdown_2361": {
"type": "terms",
"id": "lowdown_2361",
"meta": {
"index": "terms_1716263798",
"site": "lowdown",
"id": "2361",
"found": true
},
"relationships": {},
"featImg": null,
"name": "State Politics and Elections",
"description": null,
"taxonomy": "category",
"headData": {
"twImgId": null,
"twTitle": null,
"ogTitle": null,
"ogImgId": null,
"twDescription": null,
"description": null,
"title": "State Politics and Elections Archives | KQED Arts",
"ogDescription": null
},
"ttid": 2373,
"slug": "california-elections",
"isLoading": false,
"link": "/lowdown/category/california-elections"
},
"lowdown_545": {
"type": "terms",
"id": "lowdown_545",
"meta": {
"index": "terms_1716263798",
"site": "lowdown",
"id": "545",
"found": true
},
"relationships": {},
"featImg": null,
"name": "ballot measures",
"description": null,
"taxonomy": "tag",
"headData": {
"twImgId": null,
"twTitle": null,
"ogTitle": null,
"ogImgId": null,
"twDescription": null,
"description": null,
"title": "ballot measures Archives | KQED Arts",
"ogDescription": null
},
"ttid": 550,
"slug": "ballot-measures",
"isLoading": false,
"link": "/lowdown/tag/ballot-measures"
},
"lowdown_124": {
"type": "terms",
"id": "lowdown_124",
"meta": {
"index": "terms_1716263798",
"site": "lowdown",
"id": "124",
"found": true
},
"relationships": {},
"featImg": null,
"name": "elections",
"description": null,
"taxonomy": "tag",
"headData": {
"twImgId": null,
"twTitle": null,
"ogTitle": null,
"ogImgId": null,
"twDescription": null,
"description": null,
"title": "elections Archives | KQED Arts",
"ogDescription": null
},
"ttid": 125,
"slug": "elections",
"isLoading": false,
"link": "/lowdown/tag/elections"
},
"lowdown_179": {
"type": "terms",
"id": "lowdown_179",
"meta": {
"index": "terms_1716263798",
"site": "lowdown",
"id": "179",
"found": true
},
"relationships": {},
"featImg": null,
"name": "propositions",
"description": null,
"taxonomy": "tag",
"headData": {
"twImgId": null,
"twTitle": null,
"ogTitle": null,
"ogImgId": null,
"twDescription": null,
"description": null,
"title": "propositions Archives | KQED Arts",
"ogDescription": null
},
"ttid": 181,
"slug": "propositions",
"isLoading": false,
"link": "/lowdown/tag/propositions"
}
},
"userAgentReducer": {
"userAgent": "Mozilla/5.0 AppleWebKit/537.36 (KHTML, like Gecko; compatible; ClaudeBot/1.0; +claudebot@anthropic.com)",
"isBot": true
},
"userPermissionsReducer": {
"wpLoggedIn": false
},
"localStorageReducer": {},
"browserHistoryReducer": [],
"eventsReducer": {},
"fssReducer": {},
"tvDailyScheduleReducer": {},
"tvWeeklyScheduleReducer": {},
"tvPrimetimeScheduleReducer": {},
"tvMonthlyScheduleReducer": {},
"userAccountReducer": {
"user": {
"email": null,
"emailStatus": "EMAIL_UNVALIDATED",
"loggedStatus": "LOGGED_OUT",
"loggingChecked": false,
"articles": [],
"firstName": null,
"lastName": null,
"phoneNumber": null,
"fetchingMembership": false,
"membershipError": false,
"memberships": [
{
"id": null,
"startDate": null,
"firstName": null,
"lastName": null,
"familyNumber": null,
"memberNumber": null,
"memberSince": null,
"expirationDate": null,
"pfsEligible": false,
"isSustaining": false,
"membershipLevel": "Prospect",
"membershipStatus": "Non Member",
"lastGiftDate": null,
"renewalDate": null,
"lastDonationAmount": null
}
]
},
"authModal": {
"isOpen": false,
"view": "LANDING_VIEW"
},
"error": null
},
"youthMediaReducer": {},
"checkPleaseReducer": {
"filterData": {},
"restaurantData": []
},
"location": {
"pathname": "/lowdown/category/charts",
"previousPathname": "/"
}
}