upper waypoint

Who Do We Lock Up? Four Key Characteristics of California's Prison Population

Save ArticleSave Article
Failed to save article

Please try again

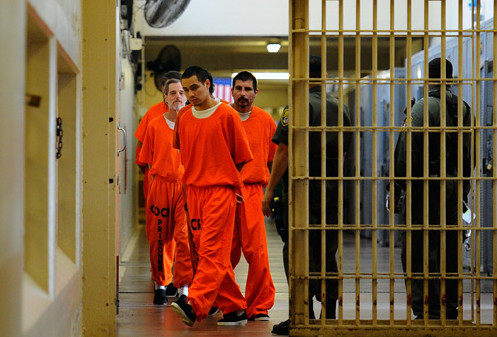
Chino State Prison inmates. (Kevork Djansezian/Getty Images)

Who's actually behind bars in California? Four key characteristics of California's prison population:

Geography

The majority of inmates come from the southern part of the state. A whopping 50,000 – or 34 percent of all prisoners – come from Los Angeles County alone. But the highest incarceration rates are concentrated in poorer counties in the Central Valley and the Inland Empire. Leading the charge is Kings County in the San Joaquin Valley, where nearly 1 percent of the entire population is in state prison.

Click on the map below for info on the number of prisoners who come from each county in California, what percent of the prison population each county contributes, and what percent of each county's total population is in prison.
Sponsored

Source: CDCR 2011 data

Race

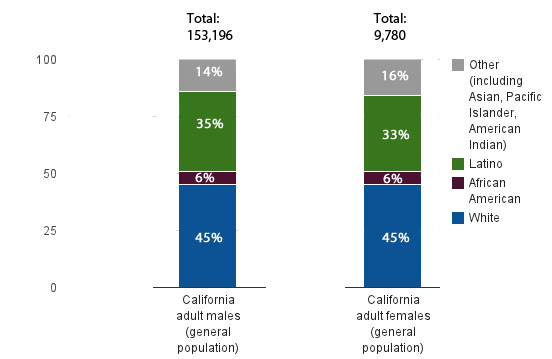
The majority of prisoners are non-white. The largest group is Hispanic. But African Americans – who make up less than 7 percent of the general population and almost 30 percent of the prison population - are dramatically more likely to be imprisoned than any other group.

prison stats

Source: Public Policy Institute of California (using 2010 CDCR and 2010 Census data)

Age

The prison population is aging. Currently nearly 20 percent of inmates are age 50 and up, about quadruple the rate from 20 years ago. Meanwhile, the percent of prisoners under age 25 has steadily dropped.

Source: CDCR 2010 data

Gender

California’s prison population is overwhelmingly male. Men make up nearly 95 percent of all inmates. 30 of the system’s 33 facilities are for men.

Source: CDCR 2010 data

lower waypoint
next waypoint