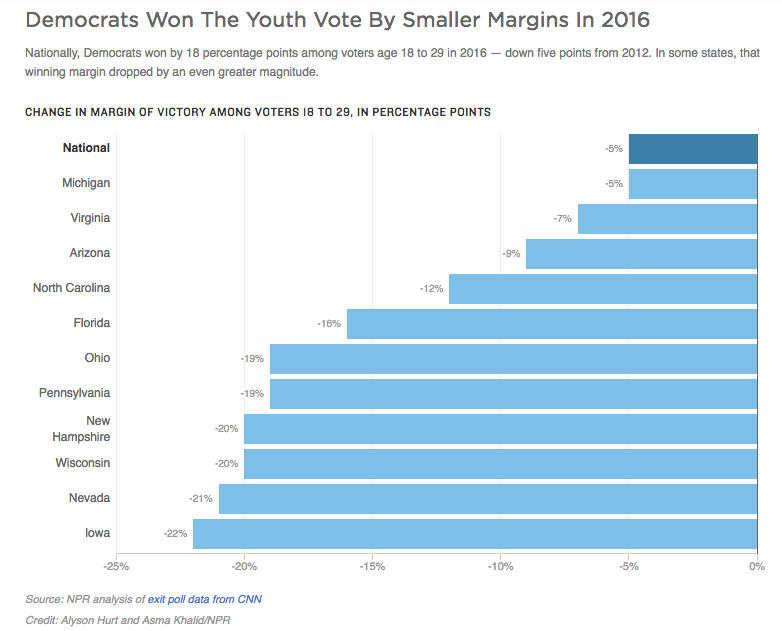
It's clear that Clinton did not maintain the same level of enthusiasm among young people that Obama did in 2008 and 2012. That gap in millennial support this year is evident in the increase in support for third-party candidates (from 3 percent nationally in 2012 to 8 percent this year) and potentially lower voter turnout, particularly in swing states. Although millennials nationwide still favored Democrats by 18 points, that margin of support was 5 percentage points lower than in 2012, and more than 20 points lower in some of the swing states that Obama won and Clinton lost.
CIRCLE's analysis of the national exit poll data also suggests that levels of racial and ethnic diversity among the youth electorate were consistent with the previous two presidential elections: overall, millennial voters are more diverse than the rest of the electorate.
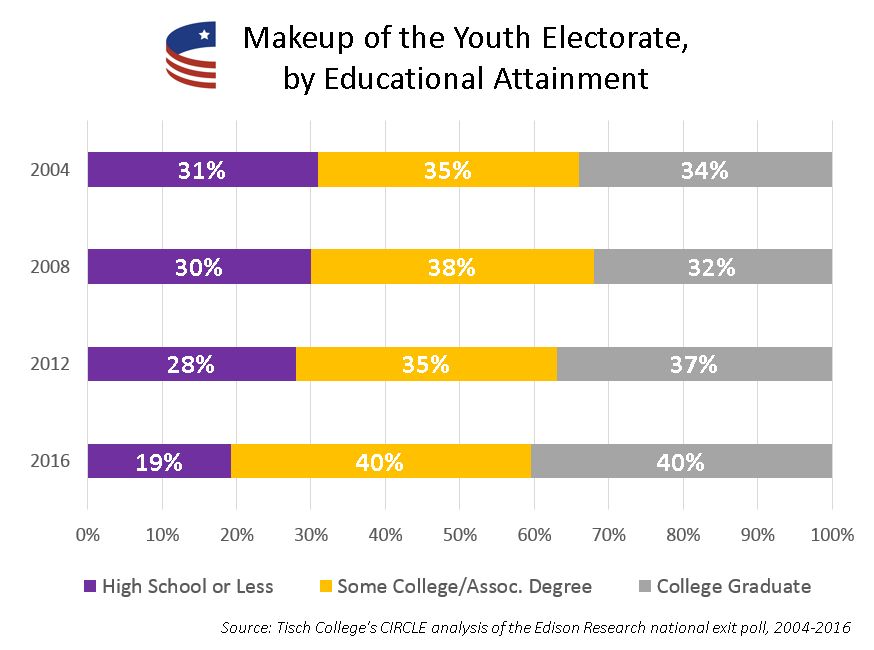
This year, however, there appears to have been a higher percentage of youth with at least some college education. Additionally, in contrast to recent elections, young white men made up a larger proportion of the white youth electorate than young white women.
A brief note on exit polls:
Exit polls are surveys given to a sample of voters across the country after they leave their polling places. A sample of people who vote early and absentee/by mail (who now make up about 35-40 percent of the electorate) are surveyed by phone, and included in the general poll results.
The official national exit poll is conducted by Edison Research, a nonpartisan polling firm that has conducted exit polls for the National Election Pool (a consortium of ABC, CBS, NBC, CNN, Fox and The Associated Press) since 2003. In addition to surveying about 16,000 early/absentee voters by phone, the firm said it interviewed roughly 85,000 voters on Election Day at nearly 1,000 polling places in 28 states. And like any poll, there is some margin of error (in other words, take it with a grain of salt). Click here to learn more about the process.
CIRCLE also included the following disclaimer about its analysis of exit polling data:
"No national official count of voters by age is immediately available after an election. Therefore, any statistic on youth voter turnout is an estimate based on survey data. Like any survey, the National Exit Poll uses methods that may introduce sampling bias. In past years, our estimates of youth turnout from the National Exit Poll (shown above) have produced a trend that very closely tracks the turnout trend in the Census Current Population Survey (CPS), which is the other major source for estimating youth turnout once it is released in the Spring. These estimates diverged slightly in 2012, although both showed a decrease."
