upper waypoint

Two Faults Could Make One Big Earthquake

Save ArticleSave Article
Failed to save article

Please try again

Where the Hayward and Calaveras faults join
A new study has traced the connection between the Hayward and Calaveras faults at the surface (dashed line) and deep underground (dotted line). (Alden/Google Earth)

Ask Bay Area seismologists their most worrisome earthquake scenario, and many will say it’s not a repeat of the great San Francisco quake of 1906. They don’t think that’s likely. Instead, it’s a possibility considered unthinkable not long ago. That would be a rupture that tears the full length of the Hayward fault, between Pinole and Fremont, then jumps past the end to the next fault.

The next fault to the north is the Rodgers Creek fault, running from San Pablo Bay into Sonoma County. Scientists have made scenarios for big quakes on the combined Hayward-Rodgers Creek. The damage from shaking, fires and landslides would exceed $200 billion.

The next fault to the south is the Calaveras fault, running from east of San Jose past Hollister. But that combination hasn’t been modeled. Until a few years ago nobody thought this deadly combo was likely.

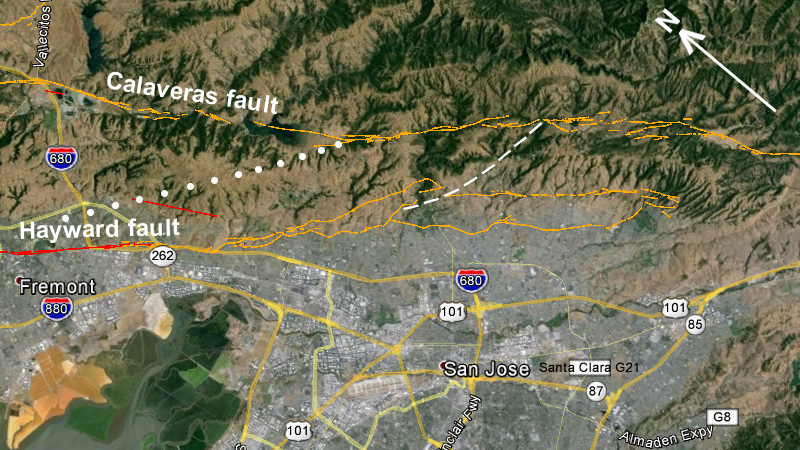
Where the two faults merge, geologists have mapped a complex snarl of ground fractures. The faults don’t appear to line up together well, which means they would prevent any rupture from pushing through. But our maps have been too imprecise to be certain.

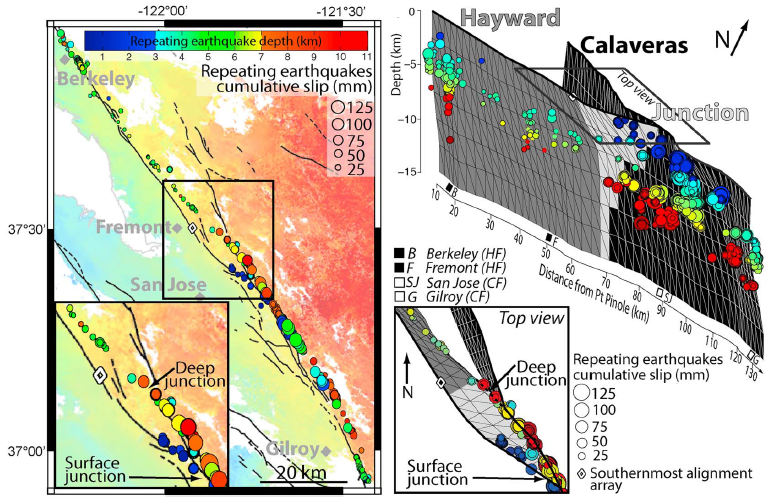
Now UC Berkeley seismologist Estelle Chaussard has assembled the clearest picture yet of the Hayward-Calaveras merge. Her model, just published in the journal Geophysical Research Letters, simplifies the intersection while showing that deep underground, the two faults line up dangerously straight together. But the same model helps us to simulate and plan for the hazard of a combined fault rupture.

Deep underground where earthquakes actually take place, the two faults join in a smooth line. But when geologists map the fault traces in this area – if they can even see them in the underbrush and landslide scars – the maps look as untidy as the edges of a torn-up newspaper. Moreover, they can’t tell which of the various fault traces is currently active.

Sponsored

Both the Hayward and Calaveras faults are known for exhibiting creep – slow, quiet motion measured in millimeters per year – but no creep measurements have been done in this rugged and remote area. (See another scientist’s earlier effort to deal with this uncertainty.)

Chaussard built the new model using two advanced techniques that sidestep the limits of what geologists on the ground can see. With these she could use the faults’ day-to-day activity, instead of their cryptic cracks on the ground, to draw their portrait.

First, she found a way to measure and map creep using InSAR (interferometric synthetic aperture radar), a satellite-based technique that’s been surveying the ground with centimeter accuracy since the early 1990s.

Selecting high-quality images from 1992 to 2011, she detected the exact zones where the ground has been creeping on both the Hayward and Calaveras faults. These curving traces mark, for the first time, the direct surface connection between the two faults. She also compared slip estimates across the merge area to show that the motions on the two faults are in balance.

Second, Chaussard selected a set of repeating small earthquakes to map the exact underground contours of the fault. She employed double-difference earthquake location, first used in 2000 on the Hayward fault, to sharpen the picture painted by these pinpricks of seismic activity.

She found that shallow quakes (less than 3 kilometers deep) lined up with the curving surface connection, the last bit of the Hayward fault. Deeper ones lined up instead with a straight plane that joins the Hayward and Calaveras faults in a single mega-fault.

New model of the Hayward-Calaveras fault junction
This figure from Chaussard’s paper shows on the left-hand map where repeating earthquakes (circles) and surface creep (lines) trace the southernmost Hayward fault both at the surface and at depth. On the right, her new model of the fault juncture (small square) fills in the key part of the full-size model used to simulate large earthquakes. (Chaussard/GRL)

The deep part of this combined fault is storing energy for very large earthquakes. With her new, clean images of both surface and deep activity, Chaussard built a geometric model of this crucial piece of California.

What does that mean? The U.S. Geological Survey says that an end-to-end rupture of the Hayward fault would cause an earthquake of magnitude 7.5. Adding the Calaveras to that would raise the magnitude to roughly the same size as the 1906 earthquake on the San Andreas fault. Damages from such a quake might reach $300 billion.

Until now, scientists have not been able to run realistic earthquake simulations for a Hayward-Calaveras megafault. Chaussard’s new model of their juncture will help in modeling this threatening possibility. “We hope our paper will trigger the necessary interest so that other groups start working on it,” Chaussard says.

lower waypoint
next waypoint
Homeowners Insurance Market Stretched Even Thinner as 2 More Companies Leave CaliforniaSame-Sex Couples Face Higher Climate Change Risks, New UCLA Study ShowsWatch Ferns Get FreakyAs California Seeks to Legalize Psychedelics for Therapy, Oregon Provides Key LessonsHoping for a 2024 'Super Bloom'? Where to See Wildflowers in the Bay AreaWhere to See Cherry Blossoms in the Bay Area This SpringEverything You Never Wanted to Know About Snail SexInsurance In California Is Changing. Here's How It May Affect YouThese Face Mites Really Grow on YouCalifornia’s Commercial Salmon Season Is Closed Again This Year