Color processed photo of the great red spot taken by the JunoCam. (Carlos Galeano/Cosmonautika)
NASA’s Juno spacecraft got its first up-close-and-personal view with Jupiter’s Great Red Spot, and the space agency has released photos from the flyby, offering a rare glimpse of the planet’s giant storm.
The images add to the wonder of this 10,000-mile-wide storm, at which star gazers have marveled for more than a century. Monday’s flyby marked only the seventh time that Juno has made a close sweep—known as a perijove pass—of Jupiter since the spacecraft began orbiting the solar system’s biggest planet last summer. This perijove pass brought the spacecraft about 5,600 miles above the Great Red Spot’s churning clouds.
During these close-ups, the spacecraft’s color camera—called JunoCam—snaps pictures, while its seven scientific instruments gather as much insight as possible about the gas giant’s magnetic fields and atmospheric composition.
Most of the new photos were processed into gorgeous art-like images by members of the public (NASA encourages citizen scientists to play with the raw photos from JunoCam) but Glenn Orton—a senior research scientist at JPL-Cal Tech—told NewsHour the images also reveal many tantalizing details about the what’s happening in this giant storm. Here’s what he sees in three of the photos. (Editor’s note: These descriptions were edited for brevity and clarity).
Calm in the Center
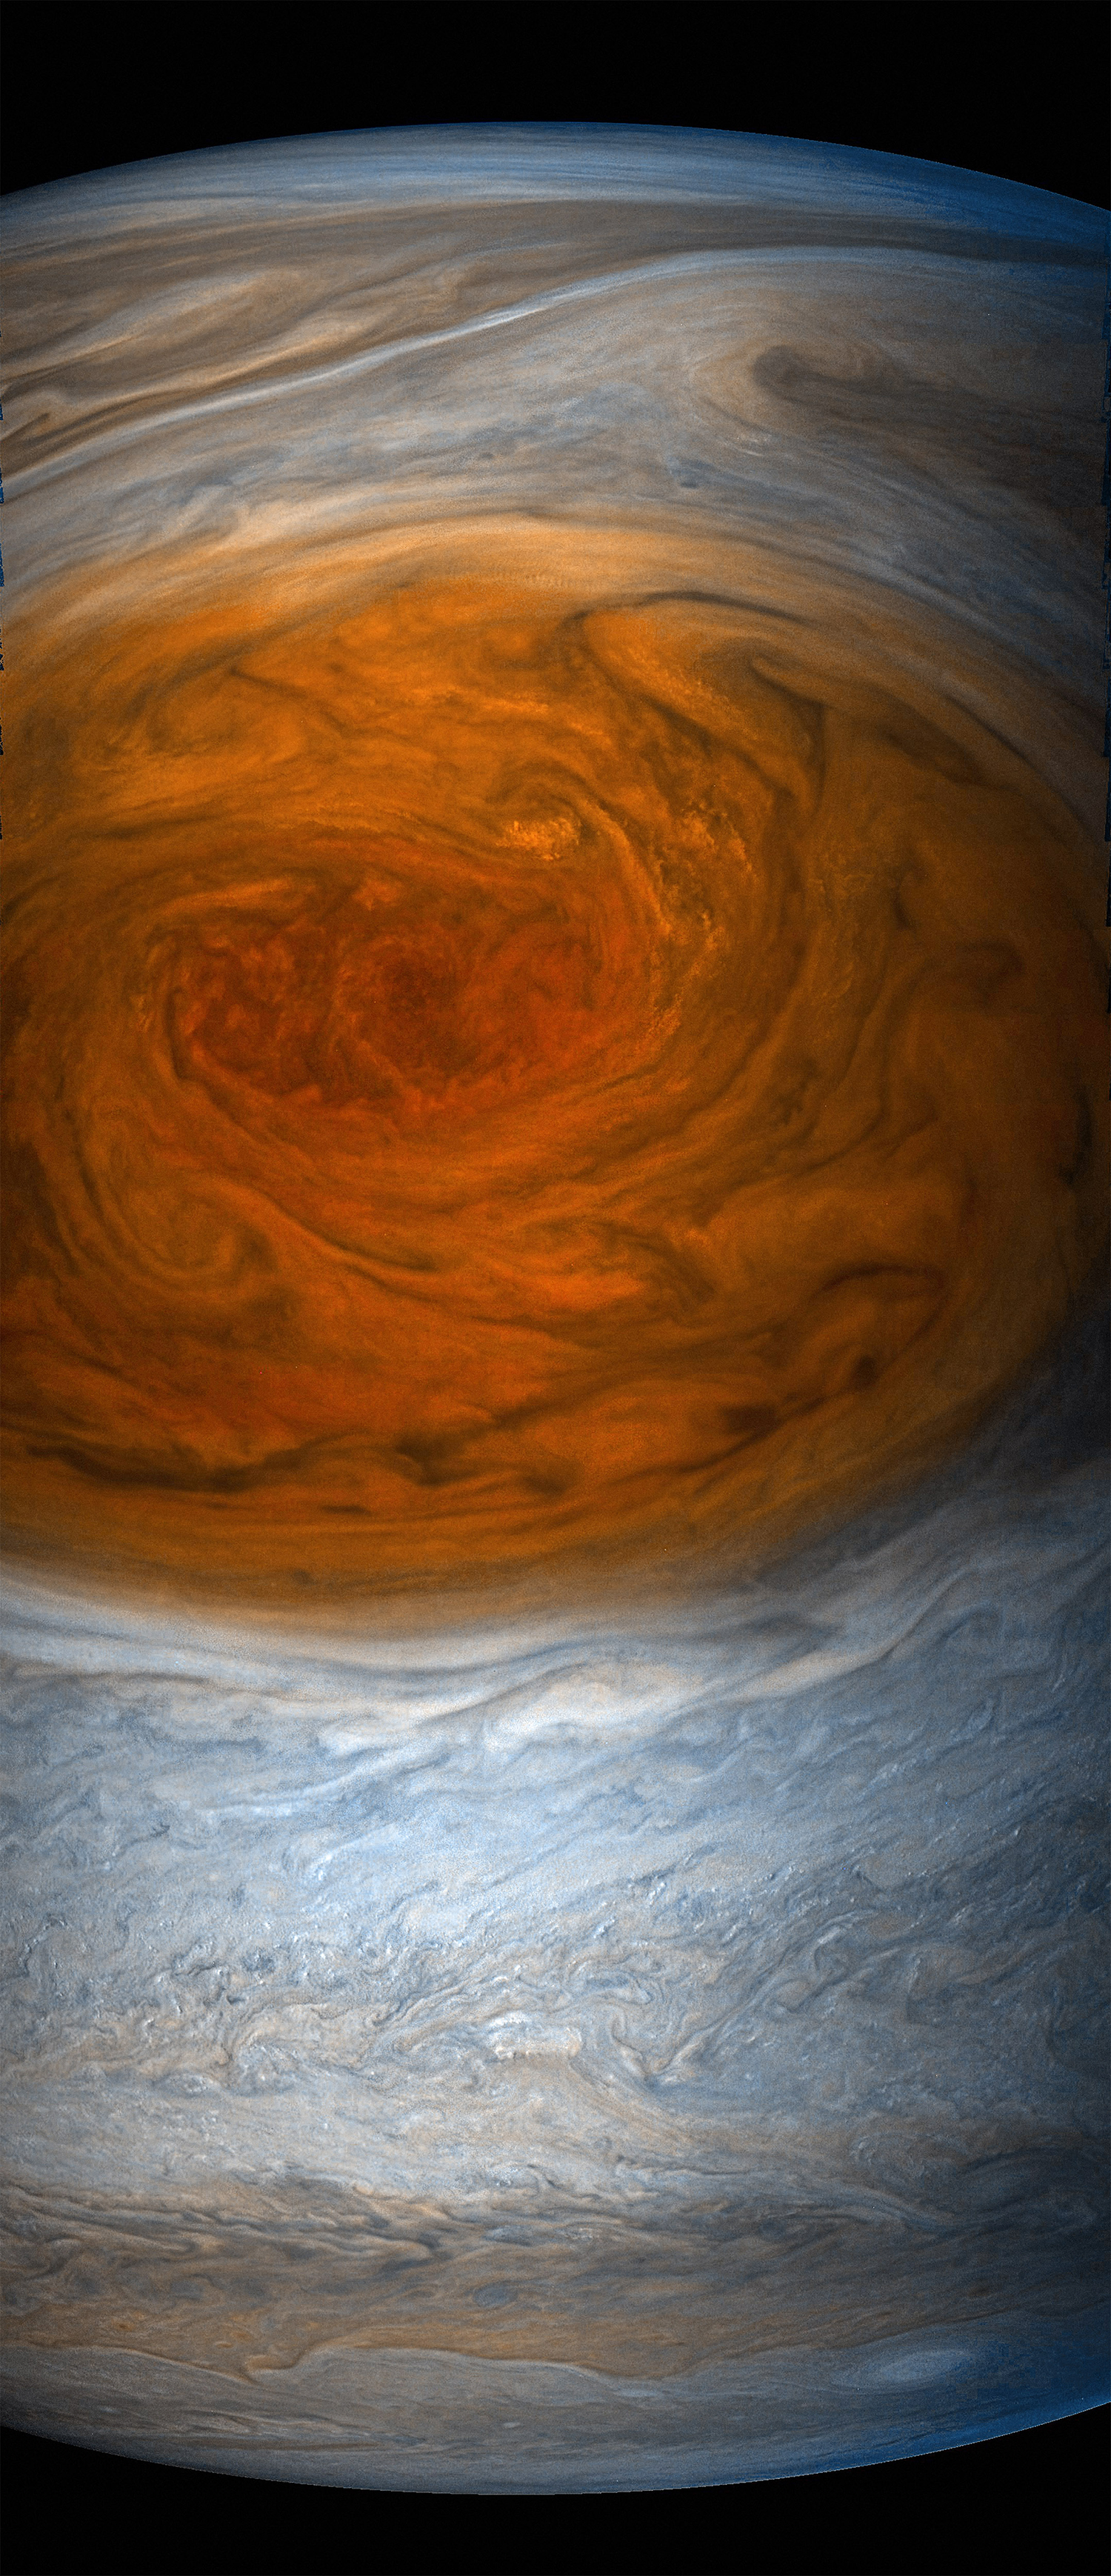
The colors in this photo are enhanced, so they look richer. But in truth, Jupiter is more pastel.
Great Red Spot. (NASA/SwRI/MSSS/Gerald Eichstädt/Seán Doran)
There’s a deep red here—the core of the red spot. We don’t have all the details yet from Juno, but based on Earth-based observations, we suspect those are much higher clouds. Whatever chemistry is taking place in these clouds makes things turn red, due to UV radiation. We think it’s happening there because the clouds are higher in the atmosphere.
Surrounding the core, there’s a lot of mottled structures. There are swirls, typically associated with a counterclockwise motion. We know from past observations the wind currents at the center of the Great Red Spot are quite still. Everything around it increases in angular velocity, until you reach a maximum velocity at the edge of the Great Red Spot.
If you download the image and blow it up, in the upper right—the 1 o’clock position—there’s a whole bunch of brighter regions and a couple of streaks. Those look like white puffy clouds. I can’t call them thunderstorms, because thunder implies lightning, which we haven’t seen in the red spot, but they’re likely local upwellings.
Now, look closely at the 12 o’clock position, right where the red starts to fade to white. There’s a very narrow set of vertical lines: |||||||||||. Those are gravity waves. [Gravity waves happen when a fluid or gas gets disturbed, and gravity pulls it back into a flat, balanced state. Examples include surf at a beach or wavy looking clouds on Earth or Venus].
This set of gravity waves are right along a region where we expect the speed of air rotation is slowing down rapidly. Wind speeds at the center are essentially zero, they build to 290 to 335 miles per hour as you move toward the edge, and then drop to 223 miles per hour at the very edge. Each of those gravity waves is likely tens of kilometers long.
The areas in the photo that look black aren’t really black. They’re just slightly less red than everything else. The regions that look darkest are likely deeper clouds in the atmosphere.
In the white region that’s south of the red spot, at the bottom of the image, you can see similar mottles of upwellings—tiny bright clouds, where you are beginning to see hints of shadows. We call that the South White Belt region. Those are high clouds, though they are not as high as the Great Red Spot.
No one knows yet how deep the clouds in the red spot are, but we’re hopefully getting an answer soon.
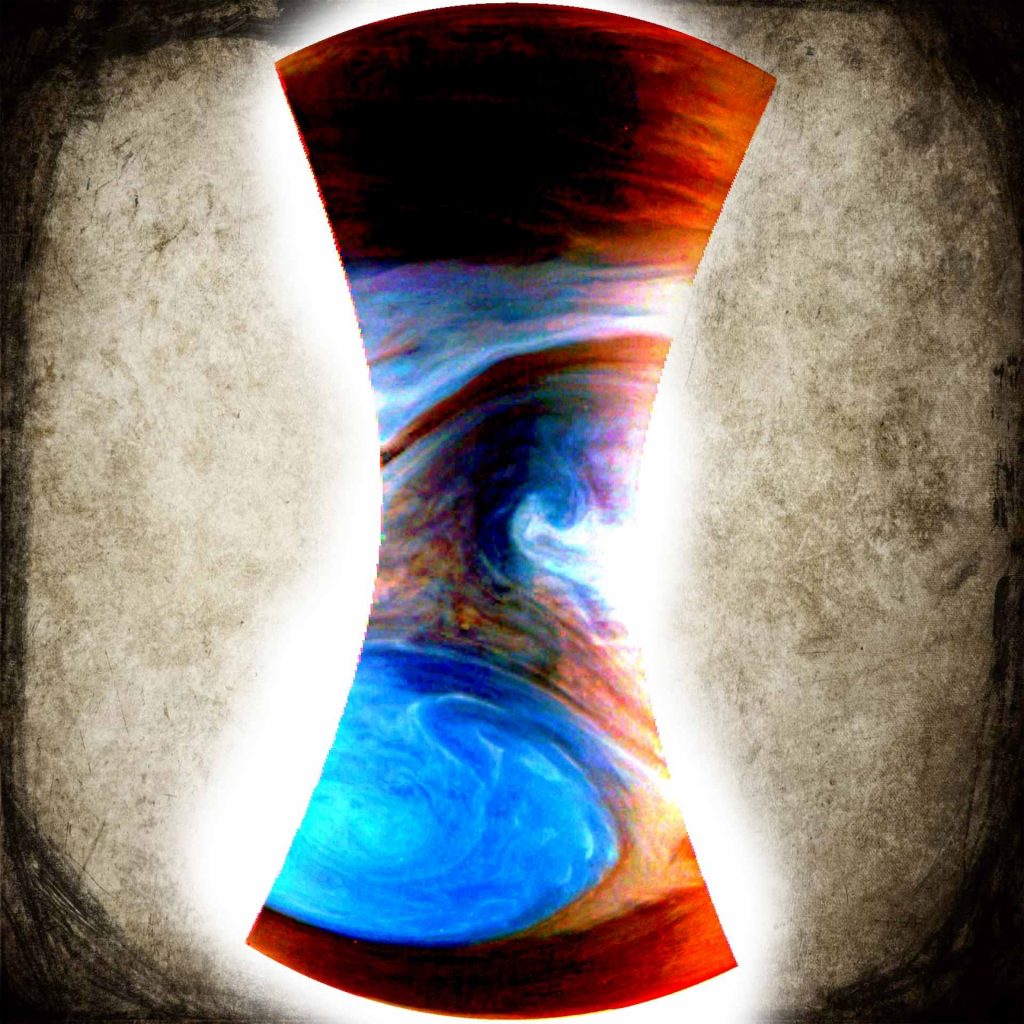
The Stovepipe
This photo is inverted, so the Great Red Spot is toward the bottom of the strip. The red levels are also adjusted, so the spot appears blue. The blue-white curls is a flow of gases exiting the Great Red Spot. (NASA/SwRI/MSSS/O.Sli)
The processing is doing some artsy work in this one. But it’s interesting because what looks like a stovepipe feature — the curly cue going toward the upper right — is actually the flow of gas going out of the red spot.
Juno’s microwave radiometer should be able to look deep into the atmosphere, where we expect to see an enhancement in ammonia levels over the Great Red Spot. We’re hoping to answer the question of how deep the ammonia is, which could be an indication of how deep the general wind circulation of Jupiter goes.
There are competing theories about the winds of Jupiter. Some say all the action happens toward the outside of the planet, the outer few kilometers or so. Others argue the winds actually go really deep, and create columns from one latitude in the north to the same latitude in the south, like big cylinders.
Microwave radiometer measurements from the previous flybys have had mixed answers to that question so far. At the equator and just north of the equator, the turbulence goes immensely deep. There’s this huge plume, with a very concentrated ammonia level, coming from very deep in the atmosphere. But at higher latitudes toward the north and south poles, this turbulence doesn’t go as deep. What we see at the Great Red Spot will tell us what camp the mid-latitudes fall into and that’s really interesting.
The Anti-Cyclone
An anti-cyclone called NN-LRS-1 (upper left) swirls in the northern reaches of Jupiter. (NASA/JPL-Caltech/MSSS/SwRI/Kevin M. Gill)
This photo isn’t taken from the Great Red Spot. It’s much higher in latitude in the north. But in the upper left, you can see a small anti-cyclone that has been changing colors recently. It’s typically white, but it’s been turning pink, then red and then back again. We’re trying to track this color change with readings in other wavelengths to determine how high things are in the atmosphere and whether these shifts are due to elevation.
To the right, there’s another cyclone or anti-cyclone. Here, there are darker circles, with relatively light stuff on the outside. We don’t know what that is. On the far right, you can see really turbulent and chaotic stuff. It’s an upwelling that’s been going on for sometime in the north. These types of turbulence happen from time to time, and we’re not quite sure why.
lower waypointnext waypoint
Player sponsored by
window.__IS_SSR__=true
window.__INITIAL_STATE__={
"attachmentsReducer": {
"audio_0": {
"type": "attachments",
"id": "audio_0",
"imgSizes": {
"kqedFullSize": {
"file": "https://ww2.kqed.org/news/wp-content/themes/KQED-unified/img/audio_bgs/background0.jpg"
}
}
},
"audio_1": {
"type": "attachments",
"id": "audio_1",
"imgSizes": {
"kqedFullSize": {
"file": "https://ww2.kqed.org/news/wp-content/themes/KQED-unified/img/audio_bgs/background1.jpg"
}
}
},
"audio_2": {
"type": "attachments",
"id": "audio_2",
"imgSizes": {
"kqedFullSize": {
"file": "https://ww2.kqed.org/news/wp-content/themes/KQED-unified/img/audio_bgs/background2.jpg"
}
}
},
"audio_3": {
"type": "attachments",
"id": "audio_3",
"imgSizes": {
"kqedFullSize": {
"file": "https://ww2.kqed.org/news/wp-content/themes/KQED-unified/img/audio_bgs/background3.jpg"
}
}
},
"audio_4": {
"type": "attachments",
"id": "audio_4",
"imgSizes": {
"kqedFullSize": {
"file": "https://ww2.kqed.org/news/wp-content/themes/KQED-unified/img/audio_bgs/background4.jpg"
}
}
},
"placeholder": {
"type": "attachments",
"id": "placeholder",
"imgSizes": {
"thumbnail": {
"file": "https://cdn.kqed.org/wp-content/uploads/2024/12/KQED-Default-Image-816638274-2000x1333-1-160x107.jpg",
"width": 160,
"height": 107,
"mimeType": "image/jpeg"
},
"medium": {
"file": "https://cdn.kqed.org/wp-content/uploads/2024/12/KQED-Default-Image-816638274-2000x1333-1-800x533.jpg",
"width": 800,
"height": 533,
"mimeType": "image/jpeg"
},
"medium_large": {
"file": "https://cdn.kqed.org/wp-content/uploads/2024/12/KQED-Default-Image-816638274-2000x1333-1-768x512.jpg",
"width": 768,
"height": 512,
"mimeType": "image/jpeg"
},
"large": {
"file": "https://cdn.kqed.org/wp-content/uploads/2024/12/KQED-Default-Image-816638274-2000x1333-1-1020x680.jpg",
"width": 1020,
"height": 680,
"mimeType": "image/jpeg"
},
"1536x1536": {
"file": "https://cdn.kqed.org/wp-content/uploads/2024/12/KQED-Default-Image-816638274-2000x1333-1-1536x1024.jpg",
"width": 1536,
"height": 1024,
"mimeType": "image/jpeg"
},
"fd-lrg": {
"file": "https://cdn.kqed.org/wp-content/uploads/2024/12/KQED-Default-Image-816638274-2000x1333-1-1536x1024.jpg",
"width": 1536,
"height": 1024,
"mimeType": "image/jpeg"
},
"fd-med": {
"file": "https://cdn.kqed.org/wp-content/uploads/2024/12/KQED-Default-Image-816638274-2000x1333-1-1020x680.jpg",
"width": 1020,
"height": 680,
"mimeType": "image/jpeg"
},
"fd-sm": {
"file": "https://cdn.kqed.org/wp-content/uploads/2024/12/KQED-Default-Image-816638274-2000x1333-1-800x533.jpg",
"width": 800,
"height": 533,
"mimeType": "image/jpeg"
},
"post-thumbnail": {
"file": "https://cdn.kqed.org/wp-content/uploads/2024/12/KQED-Default-Image-816638274-2000x1333-1-672x372.jpg",
"width": 672,
"height": 372,
"mimeType": "image/jpeg"
},
"twentyfourteen-full-width": {
"file": "https://cdn.kqed.org/wp-content/uploads/2024/12/KQED-Default-Image-816638274-2000x1333-1-1038x576.jpg",
"width": 1038,
"height": 576,
"mimeType": "image/jpeg"
},
"xxsmall": {
"file": "https://cdn.kqed.org/wp-content/uploads/2024/12/KQED-Default-Image-816638274-2000x1333-1-160x107.jpg",
"width": 160,
"height": 107,
"mimeType": "image/jpeg"
},
"xsmall": {
"file": "https://cdn.kqed.org/wp-content/uploads/2024/12/KQED-Default-Image-816638274-2000x1333-1-672x372.jpg",
"width": 672,
"height": 372,
"mimeType": "image/jpeg"
},
"small": {
"file": "https://cdn.kqed.org/wp-content/uploads/2024/12/KQED-Default-Image-816638274-2000x1333-1-672x372.jpg",
"width": 672,
"height": 372,
"mimeType": "image/jpeg"
},
"xlarge": {
"file": "https://cdn.kqed.org/wp-content/uploads/2024/12/KQED-Default-Image-816638274-2000x1333-1-1020x680.jpg",
"width": 1020,
"height": 680,
"mimeType": "image/jpeg"
},
"full-width": {
"file": "https://cdn.kqed.org/wp-content/uploads/2024/12/KQED-Default-Image-816638274-2000x1333-1-1920x1280.jpg",
"width": 1920,
"height": 1280,
"mimeType": "image/jpeg"
},
"guest-author-32": {
"file": "https://cdn.kqed.org/wp-content/uploads/2025/01/KQED-Default-Image-816638274-1333x1333-1-160x160.jpg",
"width": 32,
"height": 32,
"mimeType": "image/jpeg"
},
"guest-author-50": {
"file": "https://cdn.kqed.org/wp-content/uploads/2025/01/KQED-Default-Image-816638274-1333x1333-1-160x160.jpg",
"width": 50,
"height": 50,
"mimeType": "image/jpeg"
},
"guest-author-64": {
"file": "https://cdn.kqed.org/wp-content/uploads/2025/01/KQED-Default-Image-816638274-1333x1333-1-160x160.jpg",
"width": 64,
"height": 64,
"mimeType": "image/jpeg"
},
"guest-author-96": {
"file": "https://cdn.kqed.org/wp-content/uploads/2025/01/KQED-Default-Image-816638274-1333x1333-1-160x160.jpg",
"width": 96,
"height": 96,
"mimeType": "image/jpeg"
},
"guest-author-128": {
"file": "https://cdn.kqed.org/wp-content/uploads/2025/01/KQED-Default-Image-816638274-1333x1333-1-160x160.jpg",
"width": 128,
"height": 128,
"mimeType": "image/jpeg"
},
"detail": {
"file": "https://cdn.kqed.org/wp-content/uploads/2025/01/KQED-Default-Image-816638274-1333x1333-1-160x160.jpg",
"width": 160,
"height": 160,
"mimeType": "image/jpeg"
},
"kqedFullSize": {
"file": "https://cdn.kqed.org/wp-content/uploads/2024/12/KQED-Default-Image-816638274-2000x1333-1.jpg",
"width": 2000,
"height": 1333
}
}
},
"science_1843617": {
"type": "attachments",
"id": "science_1843617",
"meta": {
"index": "attachments_1716263798",
"site": "science",
"id": "1843617",
"found": true
},
"parent": 1843614,
"imgSizes": {
"small": {
"file": "https://ww2.kqed.org/app/uploads/sites/35/2017/07/Juno_crop_JNCE_2017192_07C00061_V01-mapprojected1-2-1-520x319.jpg",
"width": 520,
"mimeType": "image/jpeg",
"height": 319
},
"twentyfourteen-full-width": {
"file": "https://ww2.kqed.org/app/uploads/sites/35/2017/07/Juno_crop_JNCE_2017192_07C00061_V01-mapprojected1-2-1-1000x576.jpg",
"width": 1000,
"mimeType": "image/jpeg",
"height": 576
},
"thumbnail": {
"file": "https://ww2.kqed.org/app/uploads/sites/35/2017/07/Juno_crop_JNCE_2017192_07C00061_V01-mapprojected1-2-1-160x98.jpg",
"width": 160,
"mimeType": "image/jpeg",
"height": 98
},
"fd-sm": {
"file": "https://ww2.kqed.org/app/uploads/sites/35/2017/07/Juno_crop_JNCE_2017192_07C00061_V01-mapprojected1-2-1-960x589.jpg",
"width": 960,
"mimeType": "image/jpeg",
"height": 589
},
"post-thumbnail": {
"file": "https://ww2.kqed.org/app/uploads/sites/35/2017/07/Juno_crop_JNCE_2017192_07C00061_V01-mapprojected1-2-1-672x372.jpg",
"width": 672,
"mimeType": "image/jpeg",
"height": 372
},
"xsmall": {
"file": "https://ww2.kqed.org/app/uploads/sites/35/2017/07/Juno_crop_JNCE_2017192_07C00061_V01-mapprojected1-2-1-375x230.jpg",
"width": 375,
"mimeType": "image/jpeg",
"height": 230
},
"kqedFullSize": {
"file": "https://ww2.kqed.org/app/uploads/sites/35/2017/07/Juno_crop_JNCE_2017192_07C00061_V01-mapprojected1-2-1.jpg",
"width": 1000,
"height": 614
},
"guest-author-50": {
"file": "https://ww2.kqed.org/app/uploads/sites/35/2017/07/Juno_crop_JNCE_2017192_07C00061_V01-mapprojected1-2-1-50x50.jpg",
"width": 50,
"mimeType": "image/jpeg",
"height": 50
},
"guest-author-96": {
"file": "https://ww2.kqed.org/app/uploads/sites/35/2017/07/Juno_crop_JNCE_2017192_07C00061_V01-mapprojected1-2-1-96x96.jpg",
"width": 96,
"mimeType": "image/jpeg",
"height": 96
},
"medium": {
"file": "https://ww2.kqed.org/app/uploads/sites/35/2017/07/Juno_crop_JNCE_2017192_07C00061_V01-mapprojected1-2-1-800x491.jpg",
"width": 800,
"mimeType": "image/jpeg",
"height": 491
},
"guest-author-64": {
"file": "https://ww2.kqed.org/app/uploads/sites/35/2017/07/Juno_crop_JNCE_2017192_07C00061_V01-mapprojected1-2-1-64x64.jpg",
"width": 64,
"mimeType": "image/jpeg",
"height": 64
},
"guest-author-32": {
"file": "https://ww2.kqed.org/app/uploads/sites/35/2017/07/Juno_crop_JNCE_2017192_07C00061_V01-mapprojected1-2-1-32x32.jpg",
"width": 32,
"mimeType": "image/jpeg",
"height": 32
},
"detail": {
"file": "https://ww2.kqed.org/app/uploads/sites/35/2017/07/Juno_crop_JNCE_2017192_07C00061_V01-mapprojected1-2-1-150x150.jpg",
"width": 150,
"mimeType": "image/jpeg",
"height": 150
},
"medium_large": {
"file": "https://ww2.kqed.org/app/uploads/sites/35/2017/07/Juno_crop_JNCE_2017192_07C00061_V01-mapprojected1-2-1-768x472.jpg",
"width": 768,
"mimeType": "image/jpeg",
"height": 472
},
"guest-author-128": {
"file": "https://ww2.kqed.org/app/uploads/sites/35/2017/07/Juno_crop_JNCE_2017192_07C00061_V01-mapprojected1-2-1-128x128.jpg",
"width": 128,
"mimeType": "image/jpeg",
"height": 128
},
"xxsmall": {
"file": "https://ww2.kqed.org/app/uploads/sites/35/2017/07/Juno_crop_JNCE_2017192_07C00061_V01-mapprojected1-2-1-240x147.jpg",
"width": 240,
"mimeType": "image/jpeg",
"height": 147
}
},
"publishDate": 1500069597,
"modified": 1500069633,
"caption": "Color processed photo of the great red spot taken by the JunoCam. ",
"description": null,
"title": "Juno_crop_JNCE_2017192_07C00061_V01-mapprojected1-2-1",
"credit": "Carlos Galeano/Cosmonautika",
"status": "inherit",
"isLoading": false,
"fetchFailed": false
}
},
"audioPlayerReducer": {
"postId": "stream_live",
"isPaused": true,
"isPlaying": false,
"pfsActive": false,
"pledgeModalIsOpen": true,
"playerDrawerIsOpen": false,
"liveAudioPlayStartedAt": 0,
"liveAudioPlayContext": ""
},
"authorsReducer": {
"byline_science_1843614": {
"type": "authors",
"id": "byline_science_1843614",
"meta": {
"override": true
},
"slug": "byline_science_1843614",
"name": "\u003ca href=\"http://www.pbs.org/newshour/author/nakpan/\">Nsikan Akpan\u003c/a>\u003c/br>PBS Newshour",
"isLoading": false
}
},
"pagesReducer": {},
"pfsSessionReducer": {},
"postsReducer": {
"stream_live": {
"type": "live",
"id": "stream_live",
"audioUrl": "https://streams.kqed.org/kqedradio",
"title": "Live Stream",
"excerpt": "Live Stream information currently unavailable.",
"link": "/radio",
"featImg": "",
"label": {
"name": "KQED Live",
"link": "/"
}
},
"stream_kqedNewscast": {
"type": "posts",
"id": "stream_kqedNewscast",
"audioUrl": "https://www.kqed.org/.stream/anon/radio/RDnews/newscast.mp3?_=1",
"title": "KQED Newscast",
"featImg": "",
"label": {
"name": "88.5 FM",
"link": "/"
}
},
"science_1843614": {
"type": "posts",
"id": "science_1843614",
"meta": {
"index": "posts_1716263798",
"site": "science",
"id": "1843614",
"found": true
},
"articlePosition": 0,
"parent": 0,
"labelTerm": {},
"blocks": [],
"publishDate": 1500070425,
"format": "standard",
"title": "Here are Juno’s First Closeup Photos of the Great Red Spot",
"headTitle": "Here are Juno’s First Closeup Photos of the Great Red Spot | KQED",
"content": "\u003cp>NASA’s Juno spacecraft got its first up-close-and-personal view with Jupiter’s Great Red Spot, and the space agency has released photos from the flyby, offering a rare glimpse of the planet’s giant storm.\u003c/p>\n\u003cp>The images add to the wonder of this \u003ca href=\"http://www.pbs.org/newshour/rundown/juno-spacecraft-to-fly-over-jupiters-great-red-spot/\">10,000-mile-wide storm\u003c/a>, at which star gazers have marveled for more than a century. Monday’s flyby marked only the seventh time that Juno has made a close sweep—known as a perijove pass—of Jupiter since the spacecraft began orbiting the solar system’s biggest planet last summer. This perijove pass brought the spacecraft about 5,600 miles above the Great Red Spot’s churning clouds.\u003c/p>\n\u003cp>During these close-ups, the spacecraft’s color camera—called JunoCam—snaps pictures, while its \u003ca href=\"https://www.nasa.gov/mission_pages/juno/spacecraft/index.html\" target=\"_blank\" rel=\"noopener noreferrer\">seven scientific instruments\u003c/a> gather as much insight as possible about the gas giant’s magnetic fields and atmospheric composition.\u003c/p>\n\u003cp>Most of the new photos were processed into gorgeous art-like images by members of the public (NASA encourages citizen scientists to play with the raw photos from JunoCam) but Glenn Orton—a senior research scientist at JPL-Cal Tech—told NewsHour the images also reveal many tantalizing details about the what’s happening in this giant storm. Here’s what he sees in three of the photos. (\u003cem>Editor’s note: These descriptions were edited for brevity and clarity\u003c/em>).\u003c/p>\n\u003cp>\u003cstrong>Calm in the Center\u003c/strong>\u003c/p>\n\u003cp>[ad fullwidth]\u003c/p>\n\u003cp>The colors in this photo are enhanced, so they look richer. But in truth, Jupiter is more pastel.\u003c/p>\n\u003cfigure id=\"attachment_1843620\" class=\"wp-caption aligncenter\" style=\"max-width: 800px\">\u003ca href=\"https://ww2.kqed.org/science/wp-content/uploads/sites/35/2017/07/Juno1.jpg\">\u003cimg loading=\"lazy\" decoding=\"async\" class=\"size-medium wp-image-1843620\" src=\"https://ww2.kqed.org/science/wp-content/uploads/sites/35/2017/07/Juno1-800x1854.jpg\" alt=\"\" width=\"800\" height=\"1854\" srcset=\"https://cdn.kqed.org/wp-content/uploads/sites/35/2017/07/Juno1-800x1854.jpg 800w, https://cdn.kqed.org/wp-content/uploads/sites/35/2017/07/Juno1-160x371.jpg 160w, https://cdn.kqed.org/wp-content/uploads/sites/35/2017/07/Juno1-768x1780.jpg 768w, https://cdn.kqed.org/wp-content/uploads/sites/35/2017/07/Juno1-1020x2364.jpg 1020w, https://cdn.kqed.org/wp-content/uploads/sites/35/2017/07/Juno1-1180x2735.jpg 1180w, https://cdn.kqed.org/wp-content/uploads/sites/35/2017/07/Juno1-960x2225.jpg 960w, https://cdn.kqed.org/wp-content/uploads/sites/35/2017/07/Juno1-240x556.jpg 240w, https://cdn.kqed.org/wp-content/uploads/sites/35/2017/07/Juno1-375x869.jpg 375w, https://cdn.kqed.org/wp-content/uploads/sites/35/2017/07/Juno1-520x1205.jpg 520w, https://cdn.kqed.org/wp-content/uploads/sites/35/2017/07/Juno1.jpg 1500w\" sizes=\"(max-width: 800px) 100vw, 800px\">\u003c/a>\u003cfigcaption class=\"wp-caption-text\">Great Red Spot. \u003ccite>(NASA/SwRI/MSSS/Gerald Eichstädt/Seán Doran)\u003c/cite>\u003c/figcaption>\u003c/figure>\n\u003cp>There’s a deep red here—the core of the red spot. We don’t have all the details yet from Juno, but based on Earth-based observations, we suspect those are much higher clouds. Whatever chemistry is taking place in these clouds makes things turn red, due to UV radiation. We think it’s happening there because the clouds are higher in the atmosphere.\u003c/p>\n\u003cp>Surrounding the core, there’s a lot of mottled structures. There are swirls, typically associated with a counterclockwise motion. We know from past observations the wind currents at the center of the Great Red Spot are quite still. Everything around it increases in angular velocity, until you reach a maximum velocity at the edge of the Great Red Spot.\u003c/p>\n\u003cp>\u003ca href=\"https://www.missionjuno.swri.edu/junocam/processing?id=1620\">If you download the image\u003c/a> and blow it up, in the upper right—the 1 o’clock position—there’s a whole bunch of brighter regions and a couple of streaks. Those look like white puffy clouds. I can’t call them thunderstorms, because thunder implies lightning, which we haven’t seen in the red spot, but they’re likely local upwellings.\u003c/p>\n\u003cp>Now, look closely at the 12 o’clock position, right where the red starts to fade to white. There’s a very narrow set of vertical lines: |||||||||||. Those are gravity waves. [Gravity waves happen when a fluid or gas gets disturbed, and gravity pulls it back into a flat, balanced state. Examples include surf at a beach or wavy looking clouds on Earth or \u003ca href=\"http://www.pbs.org/newshour/rundown/hang-10-venus-huge-wave-spotted-planets-cloudy-atmosphere/\">Venus\u003c/a>].\u003c/p>\n\u003cp>This set of gravity waves are right along a region where we expect the speed of air rotation is slowing down rapidly. Wind speeds at the center are essentially zero, they build to 290 to 335 miles per hour as you move toward the edge, and then drop to 223 miles per hour at the very edge. Each of those gravity waves is likely tens of kilometers long.\u003c/p>\n\u003cp>The areas in the photo that look black aren’t really black. They’re just slightly less red than everything else. The regions that look darkest are likely deeper clouds in the atmosphere.\u003c/p>\n\u003cp>In the white region that’s south of the red spot, at the bottom of the image, you can see similar mottles of upwellings—tiny bright clouds, where you are beginning to see hints of shadows. We call that the South White Belt region. Those are high clouds, though they are not as high as the Great Red Spot.\u003c/p>\n\u003cp>No one knows yet how deep the clouds in the red spot are, but we’re hopefully getting an answer soon.\u003c/p>\n\u003cp>\u003cstrong>The Stovepipe\u003c/strong>\u003c/p>\n\u003cfigure id=\"attachment_1843622\" class=\"wp-caption aligncenter\" style=\"max-width: 800px\">\u003ca href=\"https://ww2.kqed.org/science/wp-content/uploads/sites/35/2017/07/Stovepipe.jpg\">\u003cimg loading=\"lazy\" decoding=\"async\" class=\"size-medium wp-image-1843622\" src=\"https://ww2.kqed.org/science/wp-content/uploads/sites/35/2017/07/Stovepipe-800x800.jpg\" alt=\"\" width=\"800\" height=\"800\" srcset=\"https://cdn.kqed.org/wp-content/uploads/sites/35/2017/07/Stovepipe-800x800.jpg 800w, https://cdn.kqed.org/wp-content/uploads/sites/35/2017/07/Stovepipe-160x160.jpg 160w, https://cdn.kqed.org/wp-content/uploads/sites/35/2017/07/Stovepipe-768x768.jpg 768w, https://cdn.kqed.org/wp-content/uploads/sites/35/2017/07/Stovepipe-1020x1020.jpg 1020w, https://cdn.kqed.org/wp-content/uploads/sites/35/2017/07/Stovepipe-960x960.jpg 960w, https://cdn.kqed.org/wp-content/uploads/sites/35/2017/07/Stovepipe-240x240.jpg 240w, https://cdn.kqed.org/wp-content/uploads/sites/35/2017/07/Stovepipe-375x375.jpg 375w, https://cdn.kqed.org/wp-content/uploads/sites/35/2017/07/Stovepipe-520x520.jpg 520w, https://cdn.kqed.org/wp-content/uploads/sites/35/2017/07/Stovepipe-32x32.jpg 32w, https://cdn.kqed.org/wp-content/uploads/sites/35/2017/07/Stovepipe-50x50.jpg 50w, https://cdn.kqed.org/wp-content/uploads/sites/35/2017/07/Stovepipe-64x64.jpg 64w, https://cdn.kqed.org/wp-content/uploads/sites/35/2017/07/Stovepipe-96x96.jpg 96w, https://cdn.kqed.org/wp-content/uploads/sites/35/2017/07/Stovepipe-128x128.jpg 128w, https://cdn.kqed.org/wp-content/uploads/sites/35/2017/07/Stovepipe-150x150.jpg 150w, https://cdn.kqed.org/wp-content/uploads/sites/35/2017/07/Stovepipe.jpg 1024w\" sizes=\"(max-width: 800px) 100vw, 800px\">\u003c/a>\u003cfigcaption class=\"wp-caption-text\">This photo is inverted, so the Great Red Spot is toward the bottom of the strip. The red levels are also adjusted, so the spot appears blue. The blue-white curls is a flow of gases exiting the Great Red Spot. \u003ccite>(NASA/SwRI/MSSS/O.Sli)\u003c/cite>\u003c/figcaption>\u003c/figure>\n\u003cp>The processing is doing some artsy work in this one. But it’s interesting because what looks like a stovepipe feature — the curly cue going toward the upper right — is actually the flow of gas going out of the red spot.\u003c/p>\n\u003cp>Juno’s microwave radiometer should be able to look deep into the atmosphere, where we expect to see an enhancement in ammonia levels over the Great Red Spot. We’re hoping to answer the question of how deep the ammonia is, which could be an indication of how deep the general wind circulation of Jupiter goes.\u003c/p>\n\u003cp>There are competing theories about the winds of Jupiter. Some say all the action happens toward the outside of the planet, the outer few kilometers or so. Others argue the winds actually go really deep, and create columns from one latitude in the north to the same latitude in the south, like big cylinders.\u003c/p>\n\u003cp>Microwave radiometer measurements from the previous flybys have had mixed answers to that question so far. At the equator and just north of the equator, the turbulence goes immensely deep. There’s this huge plume, with a very concentrated ammonia level, coming from very deep in the atmosphere. But at higher latitudes toward the north and south poles, this turbulence doesn’t go as deep. What we see at the Great Red Spot will tell us what camp the mid-latitudes fall into and that’s really interesting.\u003c/p>\n\u003cp>\u003cstrong>The Anti-Cyclone\u003c/strong>\u003c/p>\n\u003cfigure id=\"attachment_1843626\" class=\"wp-caption aligncenter\" style=\"max-width: 800px\">\u003ca href=\"https://ww2.kqed.org/science/wp-content/uploads/sites/35/2017/07/anticyclone.jpg\">\u003cimg loading=\"lazy\" decoding=\"async\" class=\"size-medium wp-image-1843626\" src=\"https://ww2.kqed.org/science/wp-content/uploads/sites/35/2017/07/anticyclone-800x526.jpg\" alt=\"\" width=\"800\" height=\"526\" srcset=\"https://cdn.kqed.org/wp-content/uploads/sites/35/2017/07/anticyclone-800x526.jpg 800w, https://cdn.kqed.org/wp-content/uploads/sites/35/2017/07/anticyclone-160x105.jpg 160w, https://cdn.kqed.org/wp-content/uploads/sites/35/2017/07/anticyclone-768x505.jpg 768w, https://cdn.kqed.org/wp-content/uploads/sites/35/2017/07/anticyclone-1020x670.jpg 1020w, https://cdn.kqed.org/wp-content/uploads/sites/35/2017/07/anticyclone-960x631.jpg 960w, https://cdn.kqed.org/wp-content/uploads/sites/35/2017/07/anticyclone-240x158.jpg 240w, https://cdn.kqed.org/wp-content/uploads/sites/35/2017/07/anticyclone-375x246.jpg 375w, https://cdn.kqed.org/wp-content/uploads/sites/35/2017/07/anticyclone-520x342.jpg 520w, https://cdn.kqed.org/wp-content/uploads/sites/35/2017/07/anticyclone.jpg 1024w\" sizes=\"(max-width: 800px) 100vw, 800px\">\u003c/a>\u003cfigcaption class=\"wp-caption-text\">An anti-cyclone called NN-LRS-1 (upper left) swirls in the northern reaches of Jupiter. \u003ccite>(NASA/JPL-Caltech/MSSS/SwRI/Kevin M. Gill)\u003c/cite>\u003c/figcaption>\u003c/figure>\n\u003cp>This photo isn’t taken from the Great Red Spot. It’s much higher in latitude in the north. But in the upper left, you can see a small anti-cyclone that has been changing colors recently. It’s typically white, but it’s been turning pink, then red and then back again. We’re trying to track this color change with readings in other wavelengths to determine how high things are in the atmosphere and whether these shifts are due to elevation.\u003c/p>\n\u003cp>[ad floatright]\u003c/p>\n\u003cp>To the right, there’s another cyclone or anti-cyclone. Here, there are darker circles, with relatively light stuff on the outside. We don’t know what that is. On the far right, you can see really turbulent and chaotic stuff. It’s an upwelling that’s been going on for sometime in the north. These types of turbulence happen from time to time, and we’re not quite sure why.\u003c/p>\n\n",
"stats": {
"hasVideo": false,
"hasChartOrMap": false,
"hasAudio": false,
"hasPolis": false,
"wordCount": 1227,
"hasGoogleForm": false,
"hasGallery": false,
"hasHearkenModule": false,
"iframeSrcs": [],
"paragraphCount": 24
},
"modified": 1704928538,
"excerpt": "This week, NASA’s Juno spacecraft got its first up-close-and-personal view with Jupiter’s famous Great Red Spot.",
"headData": {
"twImgId": "",
"twTitle": "",
"ogTitle": "",
"ogImgId": "",
"twDescription": "",
"description": "This week, NASA’s Juno spacecraft got its first up-close-and-personal view with Jupiter’s famous Great Red Spot.",
"title": "Here are Juno’s First Closeup Photos of the Great Red Spot | KQED",
"ogDescription": "",
"schema": {
"@context": "https://schema.org",
"@type": "Article",
"headline": "Here are Juno’s First Closeup Photos of the Great Red Spot",
"datePublished": "2017-07-14T15:13:45-07:00",
"dateModified": "2024-01-10T15:15:38-08:00",
"image": "https://cdn.kqed.org/wp-content/uploads/2020/02/KQED-OG-Image@1x.png"
},
"authorsData": [],
"tagData": []
},
"guestAuthors": [],
"slug": "here-are-junos-first-closeup-photos-of-the-great-red-spot",
"status": "publish",
"sourceUrl": "http://www.pbs.org/newshour/",
"nprByline": "\u003ca href=\"http://www.pbs.org/newshour/author/nakpan/\">Nsikan Akpan\u003c/a>\u003c/br>PBS Newshour",
"sticky": false,
"source": "PBS Newshour",
"path": "/science/1843614/here-are-junos-first-closeup-photos-of-the-great-red-spot",
"audioTrackLength": null,
"parsedContent": [
{
"type": "contentString",
"content": "\u003cdiv class=\"post-body\">\u003cp>\u003cp>NASA’s Juno spacecraft got its first up-close-and-personal view with Jupiter’s Great Red Spot, and the space agency has released photos from the flyby, offering a rare glimpse of the planet’s giant storm.\u003c/p>\n\u003cp>The images add to the wonder of this \u003ca href=\"http://www.pbs.org/newshour/rundown/juno-spacecraft-to-fly-over-jupiters-great-red-spot/\">10,000-mile-wide storm\u003c/a>, at which star gazers have marveled for more than a century. Monday’s flyby marked only the seventh time that Juno has made a close sweep—known as a perijove pass—of Jupiter since the spacecraft began orbiting the solar system’s biggest planet last summer. This perijove pass brought the spacecraft about 5,600 miles above the Great Red Spot’s churning clouds.\u003c/p>\n\u003cp>During these close-ups, the spacecraft’s color camera—called JunoCam—snaps pictures, while its \u003ca href=\"https://www.nasa.gov/mission_pages/juno/spacecraft/index.html\" target=\"_blank\" rel=\"noopener noreferrer\">seven scientific instruments\u003c/a> gather as much insight as possible about the gas giant’s magnetic fields and atmospheric composition.\u003c/p>\n\u003cp>Most of the new photos were processed into gorgeous art-like images by members of the public (NASA encourages citizen scientists to play with the raw photos from JunoCam) but Glenn Orton—a senior research scientist at JPL-Cal Tech—told NewsHour the images also reveal many tantalizing details about the what’s happening in this giant storm. Here’s what he sees in three of the photos. (\u003cem>Editor’s note: These descriptions were edited for brevity and clarity\u003c/em>).\u003c/p>\n\u003cp>\u003cstrong>Calm in the Center\u003c/strong>\u003c/p>\n\u003cp>\u003c/p>\u003c/div>",
"attributes": {
"named": {},
"numeric": []
}
},
{
"type": "component",
"content": "",
"name": "ad",
"attributes": {
"named": {
"label": "fullwidth"
},
"numeric": [
"fullwidth"
]
}
},
{
"type": "contentString",
"content": "\u003cdiv class=\"post-body\">\u003cp>\u003c/p>\n\u003cp>The colors in this photo are enhanced, so they look richer. But in truth, Jupiter is more pastel.\u003c/p>\n\u003cfigure id=\"attachment_1843620\" class=\"wp-caption aligncenter\" style=\"max-width: 800px\">\u003ca href=\"https://ww2.kqed.org/science/wp-content/uploads/sites/35/2017/07/Juno1.jpg\">\u003cimg loading=\"lazy\" decoding=\"async\" class=\"size-medium wp-image-1843620\" src=\"https://ww2.kqed.org/science/wp-content/uploads/sites/35/2017/07/Juno1-800x1854.jpg\" alt=\"\" width=\"800\" height=\"1854\" srcset=\"https://cdn.kqed.org/wp-content/uploads/sites/35/2017/07/Juno1-800x1854.jpg 800w, https://cdn.kqed.org/wp-content/uploads/sites/35/2017/07/Juno1-160x371.jpg 160w, https://cdn.kqed.org/wp-content/uploads/sites/35/2017/07/Juno1-768x1780.jpg 768w, https://cdn.kqed.org/wp-content/uploads/sites/35/2017/07/Juno1-1020x2364.jpg 1020w, https://cdn.kqed.org/wp-content/uploads/sites/35/2017/07/Juno1-1180x2735.jpg 1180w, https://cdn.kqed.org/wp-content/uploads/sites/35/2017/07/Juno1-960x2225.jpg 960w, https://cdn.kqed.org/wp-content/uploads/sites/35/2017/07/Juno1-240x556.jpg 240w, https://cdn.kqed.org/wp-content/uploads/sites/35/2017/07/Juno1-375x869.jpg 375w, https://cdn.kqed.org/wp-content/uploads/sites/35/2017/07/Juno1-520x1205.jpg 520w, https://cdn.kqed.org/wp-content/uploads/sites/35/2017/07/Juno1.jpg 1500w\" sizes=\"(max-width: 800px) 100vw, 800px\">\u003c/a>\u003cfigcaption class=\"wp-caption-text\">Great Red Spot. \u003ccite>(NASA/SwRI/MSSS/Gerald Eichstädt/Seán Doran)\u003c/cite>\u003c/figcaption>\u003c/figure>\n\u003cp>There’s a deep red here—the core of the red spot. We don’t have all the details yet from Juno, but based on Earth-based observations, we suspect those are much higher clouds. Whatever chemistry is taking place in these clouds makes things turn red, due to UV radiation. We think it’s happening there because the clouds are higher in the atmosphere.\u003c/p>\n\u003cp>Surrounding the core, there’s a lot of mottled structures. There are swirls, typically associated with a counterclockwise motion. We know from past observations the wind currents at the center of the Great Red Spot are quite still. Everything around it increases in angular velocity, until you reach a maximum velocity at the edge of the Great Red Spot.\u003c/p>\n\u003cp>\u003ca href=\"https://www.missionjuno.swri.edu/junocam/processing?id=1620\">If you download the image\u003c/a> and blow it up, in the upper right—the 1 o’clock position—there’s a whole bunch of brighter regions and a couple of streaks. Those look like white puffy clouds. I can’t call them thunderstorms, because thunder implies lightning, which we haven’t seen in the red spot, but they’re likely local upwellings.\u003c/p>\n\u003cp>Now, look closely at the 12 o’clock position, right where the red starts to fade to white. There’s a very narrow set of vertical lines: |||||||||||. Those are gravity waves. [Gravity waves happen when a fluid or gas gets disturbed, and gravity pulls it back into a flat, balanced state. Examples include surf at a beach or wavy looking clouds on Earth or \u003ca href=\"http://www.pbs.org/newshour/rundown/hang-10-venus-huge-wave-spotted-planets-cloudy-atmosphere/\">Venus\u003c/a>].\u003c/p>\n\u003cp>This set of gravity waves are right along a region where we expect the speed of air rotation is slowing down rapidly. Wind speeds at the center are essentially zero, they build to 290 to 335 miles per hour as you move toward the edge, and then drop to 223 miles per hour at the very edge. Each of those gravity waves is likely tens of kilometers long.\u003c/p>\n\u003cp>The areas in the photo that look black aren’t really black. They’re just slightly less red than everything else. The regions that look darkest are likely deeper clouds in the atmosphere.\u003c/p>\n\u003cp>In the white region that’s south of the red spot, at the bottom of the image, you can see similar mottles of upwellings—tiny bright clouds, where you are beginning to see hints of shadows. We call that the South White Belt region. Those are high clouds, though they are not as high as the Great Red Spot.\u003c/p>\n\u003cp>No one knows yet how deep the clouds in the red spot are, but we’re hopefully getting an answer soon.\u003c/p>\n\u003cp>\u003cstrong>The Stovepipe\u003c/strong>\u003c/p>\n\u003cfigure id=\"attachment_1843622\" class=\"wp-caption aligncenter\" style=\"max-width: 800px\">\u003ca href=\"https://ww2.kqed.org/science/wp-content/uploads/sites/35/2017/07/Stovepipe.jpg\">\u003cimg loading=\"lazy\" decoding=\"async\" class=\"size-medium wp-image-1843622\" src=\"https://ww2.kqed.org/science/wp-content/uploads/sites/35/2017/07/Stovepipe-800x800.jpg\" alt=\"\" width=\"800\" height=\"800\" srcset=\"https://cdn.kqed.org/wp-content/uploads/sites/35/2017/07/Stovepipe-800x800.jpg 800w, https://cdn.kqed.org/wp-content/uploads/sites/35/2017/07/Stovepipe-160x160.jpg 160w, https://cdn.kqed.org/wp-content/uploads/sites/35/2017/07/Stovepipe-768x768.jpg 768w, https://cdn.kqed.org/wp-content/uploads/sites/35/2017/07/Stovepipe-1020x1020.jpg 1020w, https://cdn.kqed.org/wp-content/uploads/sites/35/2017/07/Stovepipe-960x960.jpg 960w, https://cdn.kqed.org/wp-content/uploads/sites/35/2017/07/Stovepipe-240x240.jpg 240w, https://cdn.kqed.org/wp-content/uploads/sites/35/2017/07/Stovepipe-375x375.jpg 375w, https://cdn.kqed.org/wp-content/uploads/sites/35/2017/07/Stovepipe-520x520.jpg 520w, https://cdn.kqed.org/wp-content/uploads/sites/35/2017/07/Stovepipe-32x32.jpg 32w, https://cdn.kqed.org/wp-content/uploads/sites/35/2017/07/Stovepipe-50x50.jpg 50w, https://cdn.kqed.org/wp-content/uploads/sites/35/2017/07/Stovepipe-64x64.jpg 64w, https://cdn.kqed.org/wp-content/uploads/sites/35/2017/07/Stovepipe-96x96.jpg 96w, https://cdn.kqed.org/wp-content/uploads/sites/35/2017/07/Stovepipe-128x128.jpg 128w, https://cdn.kqed.org/wp-content/uploads/sites/35/2017/07/Stovepipe-150x150.jpg 150w, https://cdn.kqed.org/wp-content/uploads/sites/35/2017/07/Stovepipe.jpg 1024w\" sizes=\"(max-width: 800px) 100vw, 800px\">\u003c/a>\u003cfigcaption class=\"wp-caption-text\">This photo is inverted, so the Great Red Spot is toward the bottom of the strip. The red levels are also adjusted, so the spot appears blue. The blue-white curls is a flow of gases exiting the Great Red Spot. \u003ccite>(NASA/SwRI/MSSS/O.Sli)\u003c/cite>\u003c/figcaption>\u003c/figure>\n\u003cp>The processing is doing some artsy work in this one. But it’s interesting because what looks like a stovepipe feature — the curly cue going toward the upper right — is actually the flow of gas going out of the red spot.\u003c/p>\n\u003cp>Juno’s microwave radiometer should be able to look deep into the atmosphere, where we expect to see an enhancement in ammonia levels over the Great Red Spot. We’re hoping to answer the question of how deep the ammonia is, which could be an indication of how deep the general wind circulation of Jupiter goes.\u003c/p>\n\u003cp>There are competing theories about the winds of Jupiter. Some say all the action happens toward the outside of the planet, the outer few kilometers or so. Others argue the winds actually go really deep, and create columns from one latitude in the north to the same latitude in the south, like big cylinders.\u003c/p>\n\u003cp>Microwave radiometer measurements from the previous flybys have had mixed answers to that question so far. At the equator and just north of the equator, the turbulence goes immensely deep. There’s this huge plume, with a very concentrated ammonia level, coming from very deep in the atmosphere. But at higher latitudes toward the north and south poles, this turbulence doesn’t go as deep. What we see at the Great Red Spot will tell us what camp the mid-latitudes fall into and that’s really interesting.\u003c/p>\n\u003cp>\u003cstrong>The Anti-Cyclone\u003c/strong>\u003c/p>\n\u003cfigure id=\"attachment_1843626\" class=\"wp-caption aligncenter\" style=\"max-width: 800px\">\u003ca href=\"https://ww2.kqed.org/science/wp-content/uploads/sites/35/2017/07/anticyclone.jpg\">\u003cimg loading=\"lazy\" decoding=\"async\" class=\"size-medium wp-image-1843626\" src=\"https://ww2.kqed.org/science/wp-content/uploads/sites/35/2017/07/anticyclone-800x526.jpg\" alt=\"\" width=\"800\" height=\"526\" srcset=\"https://cdn.kqed.org/wp-content/uploads/sites/35/2017/07/anticyclone-800x526.jpg 800w, https://cdn.kqed.org/wp-content/uploads/sites/35/2017/07/anticyclone-160x105.jpg 160w, https://cdn.kqed.org/wp-content/uploads/sites/35/2017/07/anticyclone-768x505.jpg 768w, https://cdn.kqed.org/wp-content/uploads/sites/35/2017/07/anticyclone-1020x670.jpg 1020w, https://cdn.kqed.org/wp-content/uploads/sites/35/2017/07/anticyclone-960x631.jpg 960w, https://cdn.kqed.org/wp-content/uploads/sites/35/2017/07/anticyclone-240x158.jpg 240w, https://cdn.kqed.org/wp-content/uploads/sites/35/2017/07/anticyclone-375x246.jpg 375w, https://cdn.kqed.org/wp-content/uploads/sites/35/2017/07/anticyclone-520x342.jpg 520w, https://cdn.kqed.org/wp-content/uploads/sites/35/2017/07/anticyclone.jpg 1024w\" sizes=\"(max-width: 800px) 100vw, 800px\">\u003c/a>\u003cfigcaption class=\"wp-caption-text\">An anti-cyclone called NN-LRS-1 (upper left) swirls in the northern reaches of Jupiter. \u003ccite>(NASA/JPL-Caltech/MSSS/SwRI/Kevin M. Gill)\u003c/cite>\u003c/figcaption>\u003c/figure>\n\u003cp>This photo isn’t taken from the Great Red Spot. It’s much higher in latitude in the north. But in the upper left, you can see a small anti-cyclone that has been changing colors recently. It’s typically white, but it’s been turning pink, then red and then back again. We’re trying to track this color change with readings in other wavelengths to determine how high things are in the atmosphere and whether these shifts are due to elevation.\u003c/p>\n\u003cp>\u003c/p>\u003c/div>",
"attributes": {
"named": {},
"numeric": []
}
},
{
"type": "component",
"content": "",
"name": "ad",
"attributes": {
"named": {
"label": "floatright"
},
"numeric": [
"floatright"
]
}
},
{
"type": "contentString",
"content": "\u003cdiv class=\"post-body\">\u003cp>\u003c/p>\n\u003cp>To the right, there’s another cyclone or anti-cyclone. Here, there are darker circles, with relatively light stuff on the outside. We don’t know what that is. On the far right, you can see really turbulent and chaotic stuff. It’s an upwelling that’s been going on for sometime in the north. These types of turbulence happen from time to time, and we’re not quite sure why.\u003c/p>\n\n\u003c/div>\u003c/p>",
"attributes": {
"named": {},
"numeric": []
}
}
],
"link": "/science/1843614/here-are-junos-first-closeup-photos-of-the-great-red-spot",
"authors": [
"byline_science_1843614"
],
"categories": [
"science_28",
"science_40"
],
"featImg": "science_1843617",
"label": "source_science_1843614",
"isLoading": false,
"hasAllInfo": true
}
},
"podcastsReducer": {
"isFetching": false,
"fetchFailed": false,
"hasFetched": false,
"podcasts": {}
},
"radioProgramsReducer": {
"isFetching": false,
"fetchFailed": false,
"hasFetched": false,
"radioPrograms": {}
},
"programsReducer": {
"all-things-considered": {
"id": "all-things-considered",
"title": "All Things Considered",
"info": "Every weekday, \u003cem>All Things Considered\u003c/em> hosts Robert Siegel, Audie Cornish, Ari Shapiro, and Kelly McEvers present the program's trademark mix of news, interviews, commentaries, reviews, and offbeat features. Michel Martin hosts on the weekends.",
"airtime": "MON-FRI 1pm-2pm, 4:30pm-6:30pm\u003cbr />SAT-SUN 5pm-6pm",
"imageSrc": "https://cdn.kqed.org/wp-content/uploads/2024/04/All-Things-Considered-Podcast-Tile-360x360-1.jpg",
"officialWebsiteLink": "https://www.npr.org/programs/all-things-considered/",
"meta": {
"site": "news",
"source": "npr"
},
"link": "/radio/program/all-things-considered"
},
"american-suburb-podcast": {
"id": "american-suburb-podcast",
"title": "American Suburb: The Podcast",
"tagline": "The flip side of gentrification, told through one town",
"info": "Gentrification is changing cities across America, forcing people from neighborhoods they have long called home. Call them the displaced. Now those priced out of the Bay Area are looking for a better life in an unlikely place. American Suburb follows this migration to one California town along the Delta, 45 miles from San Francisco. But is this once sleepy suburb ready for them?",
"imageSrc": "https://cdn.kqed.org/wp-content/uploads/2024/04/American-Suburb-Podcast-Tile-703x703-1.jpg",
"officialWebsiteLink": "/news/series/american-suburb-podcast",
"meta": {
"site": "news",
"source": "kqed",
"order": 19
},
"link": "/news/series/american-suburb-podcast/",
"subscribe": {
"npr": "https://rpb3r.app.goo.gl/RBrW",
"apple": "https://itunes.apple.com/WebObjects/MZStore.woa/wa/viewPodcast?mt=2&id=1287748328",
"tuneIn": "https://tunein.com/radio/American-Suburb-p1086805/",
"rss": "https://ww2.kqed.org/news/series/american-suburb-podcast/feed/podcast",
"google": "https://podcasts.google.com/feed/aHR0cHM6Ly9mZWVkcy5tZWdhcGhvbmUuZm0vS1FJTkMzMDExODgxNjA5"
}
},
"baycurious": {
"id": "baycurious",
"title": "Bay Curious",
"tagline": "Exploring the Bay Area, one question at a time",
"info": "KQED’s new podcast, Bay Curious, gets to the bottom of the mysteries — both profound and peculiar — that give the Bay Area its unique identity. And we’ll do it with your help! You ask the questions. You decide what Bay Curious investigates. And you join us on the journey to find the answers.",
"imageSrc": "https://cdn.kqed.org/wp-content/uploads/2024/04/Bay-Curious-Podcast-Tile-703x703-1.jpg",
"imageAlt": "KQED Bay Curious",
"officialWebsiteLink": "/news/series/baycurious",
"meta": {
"site": "news",
"source": "kqed",
"order": 3
},
"link": "/podcasts/baycurious",
"subscribe": {
"apple": "https://podcasts.apple.com/us/podcast/bay-curious/id1172473406",
"npr": "https://www.npr.org/podcasts/500557090/bay-curious",
"rss": "https://ww2.kqed.org/news/category/bay-curious-podcast/feed/podcast",
"amazon": "https://music.amazon.com/podcasts/9a90d476-aa04-455d-9a4c-0871ed6216d4/bay-curious",
"stitcher": "https://www.stitcher.com/podcast/kqed/bay-curious",
"spotify": "https://open.spotify.com/show/6O76IdmhixfijmhTZLIJ8k"
}
},
"bbc-world-service": {
"id": "bbc-world-service",
"title": "BBC World Service",
"info": "The day's top stories from BBC News compiled twice daily in the week, once at weekends.",
"airtime": "MON-FRI 9pm-10pm, TUE-FRI 1am-2am",
"imageSrc": "https://cdn.kqed.org/wp-content/uploads/2024/04/BBC-World-Service-Podcast-Tile-360x360-1.jpg",
"officialWebsiteLink": "https://www.bbc.co.uk/sounds/play/live:bbc_world_service",
"meta": {
"site": "news",
"source": "BBC World Service"
},
"link": "/radio/program/bbc-world-service",
"subscribe": {
"apple": "https://itunes.apple.com/us/podcast/global-news-podcast/id135067274?mt=2",
"tuneIn": "https://tunein.com/radio/BBC-World-Service-p455581/",
"rss": "https://podcasts.files.bbci.co.uk/p02nq0gn.rss"
}
},
"californiareport": {
"id": "californiareport",
"title": "The California Report",
"tagline": "California, day by day",
"info": "KQED’s statewide radio news program providing daily coverage of issues, trends and public policy decisions.",
"imageSrc": "https://cdn.kqed.org/wp-content/uploads/2024/04/The-California-Report-Podcast-Tile-703x703-1.jpg",
"imageAlt": "KQED The California Report",
"officialWebsiteLink": "/californiareport",
"meta": {
"site": "news",
"source": "kqed",
"order": 8
},
"link": "/californiareport",
"subscribe": {
"apple": "https://podcasts.apple.com/us/podcast/kqeds-the-california-report/id79681292",
"amazon": "https://music.amazon.com/podcasts/26099305-72af-4542-9dde-ac1807fe36d5/kqed-s-the-california-report",
"npr": "https://www.npr.org/podcasts/432285393/the-california-report",
"stitcher": "https://www.stitcher.com/podcast/kqedfm-kqeds-the-california-report-podcast-8838",
"rss": "https://ww2.kqed.org/news/tag/tcram/feed/podcast"
}
},
"californiareportmagazine": {
"id": "californiareportmagazine",
"title": "The California Report Magazine",
"tagline": "Your state, your stories",
"info": "Every week, The California Report Magazine takes you on a road trip for the ears: to visit the places and meet the people who make California unique. The in-depth storytelling podcast from the California Report.",
"airtime": "FRI 4:30pm-5pm, 6:30pm-7pm, 11pm-11:30pm",
"imageSrc": "https://cdn.kqed.org/wp-content/uploads/2024/04/The-California-Report-Magazine-Podcast-Tile-703x703-1.jpg",
"imageAlt": "KQED The California Report Magazine",
"officialWebsiteLink": "/californiareportmagazine",
"meta": {
"site": "news",
"source": "kqed",
"order": 10
},
"link": "/californiareportmagazine",
"subscribe": {
"apple": "https://podcasts.apple.com/us/podcast/the-california-report-magazine/id1314750545",
"google": "https://podcasts.google.com/feed/aHR0cHM6Ly9mZWVkcy5tZWdhcGhvbmUuZm0vS1FJTkM3NjkwNjk1OTAz",
"npr": "https://www.npr.org/podcasts/564733126/the-california-report-magazine",
"stitcher": "https://www.stitcher.com/podcast/kqed/the-california-report-magazine",
"rss": "https://ww2.kqed.org/news/tag/tcrmag/feed/podcast"
}
},
"city-arts": {
"id": "city-arts",
"title": "City Arts & Lectures",
"info": "A one-hour radio program to hear celebrated writers, artists and thinkers address contemporary ideas and values, often discussing the creative process. Please note: tapes or transcripts are not available",
"imageSrc": "https://ww2.kqed.org/radio/wp-content/uploads/sites/50/2018/05/cityartsandlecture-300x300.jpg",
"officialWebsiteLink": "https://www.cityarts.net/",
"airtime": "SUN 1pm-2pm, TUE 10pm, WED 1am",
"meta": {
"site": "news",
"source": "City Arts & Lectures"
},
"link": "https://www.cityarts.net",
"subscribe": {
"tuneIn": "https://tunein.com/radio/City-Arts-and-Lectures-p692/",
"rss": "https://www.cityarts.net/feed/"
}
},
"closealltabs": {
"id": "closealltabs",
"title": "Close All Tabs",
"tagline": "Your irreverent guide to the trends redefining our world",
"info": "Close All Tabs breaks down how digital culture shapes our world through thoughtful insights and irreverent humor.",
"imageSrc": "https://cdn.kqed.org/wp-content/uploads/2025/02/CAT_2_Tile-scaled.jpg",
"imageAlt": "KQED Close All Tabs",
"officialWebsiteLink": "/podcasts/closealltabs",
"meta": {
"site": "news",
"source": "kqed",
"order": 1
},
"link": "/podcasts/closealltabs",
"subscribe": {
"apple": "https://podcasts.apple.com/us/podcast/close-all-tabs/id214663465",
"rss": "https://feeds.megaphone.fm/KQINC6993880386",
"amazon": "https://music.amazon.com/podcasts/92d9d4ac-67a3-4eed-b10a-fb45d45b1ef2/close-all-tabs",
"spotify": "https://open.spotify.com/show/6LAJFHnGK1pYXYzv6SIol6?si=deb0cae19813417c"
}
},
"code-switch-life-kit": {
"id": "code-switch-life-kit",
"title": "Code Switch / Life Kit",
"info": "\u003cem>Code Switch\u003c/em>, which listeners will hear in the first part of the hour, has fearless and much-needed conversations about race. Hosted by journalists of color, the show tackles the subject of race head-on, exploring how it impacts every part of society — from politics and pop culture to history, sports and more.\u003cbr />\u003cbr />\u003cem>Life Kit\u003c/em>, which will be in the second part of the hour, guides you through spaces and feelings no one prepares you for — from finances to mental health, from workplace microaggressions to imposter syndrome, from relationships to parenting. The show features experts with real world experience and shares their knowledge. Because everyone needs a little help being human.\u003cbr />\u003cbr />\u003ca href=\"https://www.npr.org/podcasts/510312/codeswitch\">\u003cem>Code Switch\u003c/em> offical site and podcast\u003c/a>\u003cbr />\u003ca href=\"https://www.npr.org/lifekit\">\u003cem>Life Kit\u003c/em> offical site and podcast\u003c/a>\u003cbr />",
"airtime": "SUN 9pm-10pm",
"imageSrc": "https://cdn.kqed.org/wp-content/uploads/2024/04/Code-Switch-Life-Kit-Podcast-Tile-360x360-1.jpg",
"meta": {
"site": "radio",
"source": "npr"
},
"link": "/radio/program/code-switch-life-kit",
"subscribe": {
"apple": "https://podcasts.apple.com/podcast/1112190608?mt=2&at=11l79Y&ct=nprdirectory",
"google": "https://podcasts.google.com/feed/aHR0cHM6Ly93d3cubnByLm9yZy9yc3MvcG9kY2FzdC5waHA_aWQ9NTEwMzEy",
"spotify": "https://open.spotify.com/show/3bExJ9JQpkwNhoHvaIIuyV",
"rss": "https://feeds.npr.org/510312/podcast.xml"
}
},
"commonwealth-club": {
"id": "commonwealth-club",
"title": "Commonwealth Club of California Podcast",
"info": "The Commonwealth Club of California is the nation's oldest and largest public affairs forum. As a non-partisan forum, The Club brings to the public airwaves diverse viewpoints on important topics. The Club's weekly radio broadcast - the oldest in the U.S., dating back to 1924 - is carried across the nation on public radio stations and is now podcasting. Our website archive features audio of our recent programs, as well as selected speeches from our long and distinguished history. This podcast feed is usually updated twice a week and is always un-edited.",
"airtime": "THU 10pm, FRI 1am",
"imageSrc": "https://cdn.kqed.org/wp-content/uploads/2024/04/Commonwealth-Club-Podcast-Tile-360x360-1.jpg",
"officialWebsiteLink": "https://www.commonwealthclub.org/podcasts",
"meta": {
"site": "news",
"source": "Commonwealth Club of California"
},
"link": "/radio/program/commonwealth-club",
"subscribe": {
"apple": "https://itunes.apple.com/us/podcast/commonwealth-club-of-california-podcast/id976334034?mt=2",
"google": "https://podcasts.google.com/feed/aHR0cDovL3d3dy5jb21tb253ZWFsdGhjbHViLm9yZy9hdWRpby9wb2RjYXN0L3dlZWtseS54bWw",
"tuneIn": "https://tunein.com/radio/Commonwealth-Club-of-California-p1060/"
}
},
"forum": {
"id": "forum",
"title": "Forum",
"tagline": "The conversation starts here",
"info": "KQED’s live call-in program discussing local, state, national and international issues, as well as in-depth interviews.",
"airtime": "MON-FRI 9am-11am, 10pm-11pm",
"imageSrc": "https://cdn.kqed.org/wp-content/uploads/2024/04/Forum-Podcast-Tile-703x703-1.jpg",
"imageAlt": "KQED Forum with Mina Kim and Alexis Madrigal",
"officialWebsiteLink": "/forum",
"meta": {
"site": "news",
"source": "kqed",
"order": 9
},
"link": "/forum",
"subscribe": {
"apple": "https://podcasts.apple.com/us/podcast/kqeds-forum/id73329719",
"google": "https://podcasts.google.com/feed/aHR0cHM6Ly9mZWVkcy5tZWdhcGhvbmUuZm0vS1FJTkM5NTU3MzgxNjMz",
"npr": "https://www.npr.org/podcasts/432307980/forum",
"stitcher": "https://www.stitcher.com/podcast/kqedfm-kqeds-forum-podcast",
"rss": "https://feeds.megaphone.fm/KQINC9557381633"
}
},
"freakonomics-radio": {
"id": "freakonomics-radio",
"title": "Freakonomics Radio",
"info": "Freakonomics Radio is a one-hour award-winning podcast and public-radio project hosted by Stephen Dubner, with co-author Steve Levitt as a regular guest. It is produced in partnership with WNYC.",
"imageSrc": "https://ww2.kqed.org/news/wp-content/uploads/sites/10/2018/05/freakonomicsRadio.png",
"officialWebsiteLink": "http://freakonomics.com/",
"airtime": "SUN 1am-2am, SAT 3pm-4pm",
"meta": {
"site": "radio",
"source": "WNYC"
},
"link": "/radio/program/freakonomics-radio",
"subscribe": {
"npr": "https://rpb3r.app.goo.gl/4s8b",
"apple": "https://itunes.apple.com/us/podcast/freakonomics-radio/id354668519",
"tuneIn": "https://tunein.com/podcasts/WNYC-Podcasts/Freakonomics-Radio-p272293/",
"rss": "https://feeds.feedburner.com/freakonomicsradio"
}
},
"fresh-air": {
"id": "fresh-air",
"title": "Fresh Air",
"info": "Hosted by Terry Gross, \u003cem>Fresh Air from WHYY\u003c/em> is the Peabody Award-winning weekday magazine of contemporary arts and issues. One of public radio's most popular programs, Fresh Air features intimate conversations with today's biggest luminaries.",
"airtime": "MON-FRI 7pm-8pm",
"imageSrc": "https://cdn.kqed.org/wp-content/uploads/2024/04/Fresh-Air-Podcast-Tile-360x360-1.jpg",
"officialWebsiteLink": "https://www.npr.org/programs/fresh-air/",
"meta": {
"site": "radio",
"source": "npr"
},
"link": "/radio/program/fresh-air",
"subscribe": {
"npr": "https://rpb3r.app.goo.gl/4s8b",
"apple": "https://itunes.apple.com/WebObjects/MZStore.woa/wa/viewPodcast?s=143441&mt=2&id=214089682&at=11l79Y&ct=nprdirectory",
"tuneIn": "https://tunein.com/radio/Fresh-Air-p17/",
"rss": "https://feeds.npr.org/381444908/podcast.xml"
}
},
"here-and-now": {
"id": "here-and-now",
"title": "Here & Now",
"info": "A live production of NPR and WBUR Boston, in collaboration with stations across the country, Here & Now reflects the fluid world of news as it's happening in the middle of the day, with timely, in-depth news, interviews and conversation. Hosted by Robin Young, Jeremy Hobson and Tonya Mosley.",
"airtime": "MON-THU 11am-12pm",
"imageSrc": "https://cdn.kqed.org/wp-content/uploads/2024/04/Here-And-Now-Podcast-Tile-360x360-1.jpg",
"officialWebsiteLink": "http://www.wbur.org/hereandnow",
"meta": {
"site": "news",
"source": "npr"
},
"link": "/radio/program/here-and-now",
"subsdcribe": {
"apple": "https://itunes.apple.com/WebObjects/MZStore.woa/wa/viewPodcast?mt=2&id=426698661",
"tuneIn": "https://tunein.com/radio/Here--Now-p211/",
"rss": "https://feeds.npr.org/510051/podcast.xml"
}
},
"hidden-brain": {
"id": "hidden-brain",
"title": "Hidden Brain",
"info": "Shankar Vedantam uses science and storytelling to reveal the unconscious patterns that drive human behavior, shape our choices and direct our relationships.",
"imageSrc": "https://ww2.kqed.org/radio/wp-content/uploads/sites/50/2018/05/hiddenbrain.jpg",
"officialWebsiteLink": "https://www.npr.org/series/423302056/hidden-brain",
"airtime": "SUN 7pm-8pm",
"meta": {
"site": "news",
"source": "NPR"
},
"link": "/radio/program/hidden-brain",
"subscribe": {
"apple": "https://itunes.apple.com/us/podcast/hidden-brain/id1028908750?mt=2",
"tuneIn": "https://tunein.com/podcasts/Science-Podcasts/Hidden-Brain-p787503/",
"rss": "https://feeds.npr.org/510308/podcast.xml"
}
},
"how-i-built-this": {
"id": "how-i-built-this",
"title": "How I Built This with Guy Raz",
"info": "Guy Raz dives into the stories behind some of the world's best known companies. How I Built This weaves a narrative journey about innovators, entrepreneurs and idealists—and the movements they built.",
"imageSrc": "https://ww2.kqed.org/news/wp-content/uploads/sites/10/2018/05/howIBuiltThis.png",
"officialWebsiteLink": "https://www.npr.org/podcasts/510313/how-i-built-this",
"airtime": "SUN 7:30pm-8pm",
"meta": {
"site": "news",
"source": "npr"
},
"link": "/radio/program/how-i-built-this",
"subscribe": {
"npr": "https://rpb3r.app.goo.gl/3zxy",
"apple": "https://itunes.apple.com/us/podcast/how-i-built-this-with-guy-raz/id1150510297?mt=2",
"tuneIn": "https://tunein.com/podcasts/Arts--Culture-Podcasts/How-I-Built-This-p910896/",
"rss": "https://feeds.npr.org/510313/podcast.xml"
}
},
"hyphenacion": {
"id": "hyphenacion",
"title": "Hyphenación",
"tagline": "Where conversation and cultura meet",
"info": "What kind of no sabo word is Hyphenación? For us, it’s about living within a hyphenation. Like being a third-gen Mexican-American from the Texas border now living that Bay Area Chicano life. Like Xorje! Each week we bring together a couple of hyphenated Latinos to talk all about personal life choices: family, careers, relationships, belonging … everything is on the table. ",
"imageSrc": "https://cdn.kqed.org/wp-content/uploads/2025/03/Hyphenacion_FinalAssets_PodcastTile.png",
"imageAlt": "KQED Hyphenación",
"officialWebsiteLink": "/podcasts/hyphenacion",
"meta": {
"site": "news",
"source": "kqed",
"order": 15
},
"link": "/podcasts/hyphenacion",
"subscribe": {
"apple": "https://podcasts.apple.com/us/podcast/hyphenaci%C3%B3n/id1191591838",
"spotify": "https://open.spotify.com/show/2p3Fifq96nw9BPcmFdIq0o?si=39209f7b25774f38",
"youtube": "https://www.youtube.com/c/kqedarts",
"amazon": "https://music.amazon.com/podcasts/6c3dd23c-93fb-4aab-97ba-1725fa6315f1/hyphenaci%C3%B3n",
"rss": "https://feeds.megaphone.fm/KQINC2275451163"
}
},
"jerrybrown": {
"id": "jerrybrown",
"title": "The Political Mind of Jerry Brown",
"tagline": "Lessons from a lifetime in politics",
"info": "The Political Mind of Jerry Brown brings listeners the wisdom of the former Governor, Mayor, and presidential candidate. Scott Shafer interviewed Brown for more than 40 hours, covering the former governor's life and half-century in the political game – and Brown has some lessons he'd like to share. ",
"imageSrc": "https://cdn.kqed.org/wp-content/uploads/2024/04/The-Political-Mind-of-Jerry-Brown-Podcast-Tile-703x703-1.jpg",
"imageAlt": "KQED The Political Mind of Jerry Brown",
"officialWebsiteLink": "/podcasts/jerrybrown",
"meta": {
"site": "news",
"source": "kqed",
"order": 18
},
"link": "/podcasts/jerrybrown",
"subscribe": {
"npr": "https://www.npr.org/podcasts/790253322/the-political-mind-of-jerry-brown",
"apple": "https://itunes.apple.com/us/podcast/id1492194549",
"rss": "https://ww2.kqed.org/news/series/jerrybrown/feed/podcast/",
"tuneIn": "http://tun.in/pjGcK",
"stitcher": "https://www.stitcher.com/podcast/kqed/the-political-mind-of-jerry-brown",
"spotify": "https://open.spotify.com/show/54C1dmuyFyKMFttY6X2j6r?si=K8SgRCoISNK6ZbjpXrX5-w",
"amazon": "https://music.amazon.com/podcasts/44420f75-3b0e-4301-ab3b-16da6b09e543/the-political-mind-of-jerry-brown"
}
},
"latino-usa": {
"id": "latino-usa",
"title": "Latino USA",
"airtime": "MON 1am-2am, SUN 6pm-7pm",
"info": "Latino USA, the radio journal of news and culture, is the only national, English-language radio program produced from a Latino perspective.",
"imageSrc": "https://ww2.kqed.org/radio/wp-content/uploads/sites/50/2018/04/latinoUsa.jpg",
"officialWebsiteLink": "http://latinousa.org/",
"meta": {
"site": "news",
"source": "npr"
},
"link": "/radio/program/latino-usa",
"subscribe": {
"npr": "https://rpb3r.app.goo.gl/xtTd",
"apple": "https://itunes.apple.com/WebObjects/MZStore.woa/wa/viewPodcast?s=143441&mt=2&id=79681317&at=11l79Y&ct=nprdirectory",
"tuneIn": "https://tunein.com/radio/Latino-USA-p621/",
"rss": "https://feeds.npr.org/510016/podcast.xml"
}
},
"marketplace": {
"id": "marketplace",
"title": "Marketplace",
"info": "Our flagship program, helmed by Kai Ryssdal, examines what the day in money delivered, through stories, conversations, newsworthy numbers and more. Updated Monday through Friday at about 3:30 p.m. PT.",
"airtime": "MON-FRI 4pm-4:30pm, MON-WED 6:30pm-7pm",
"imageSrc": "https://cdn.kqed.org/wp-content/uploads/2024/04/Marketplace-Podcast-Tile-360x360-1.jpg",
"officialWebsiteLink": "https://www.marketplace.org/",
"meta": {
"site": "news",
"source": "American Public Media"
},
"link": "/radio/program/marketplace",
"subscribe": {
"apple": "https://itunes.apple.com/WebObjects/MZStore.woa/wa/viewPodcast?s=143441&mt=2&id=201853034&at=11l79Y&ct=nprdirectory",
"tuneIn": "https://tunein.com/radio/APM-Marketplace-p88/",
"rss": "https://feeds.publicradio.org/public_feeds/marketplace-pm/rss/rss"
}
},
"masters-of-scale": {
"id": "masters-of-scale",
"title": "Masters of Scale",
"info": "Masters of Scale is an original podcast in which LinkedIn co-founder and Greylock Partner Reid Hoffman sets out to describe and prove theories that explain how great entrepreneurs take their companies from zero to a gazillion in ingenious fashion.",
"airtime": "Every other Wednesday June 12 through October 16 at 8pm (repeats Thursdays at 2am)",
"imageSrc": "https://cdn.kqed.org/wp-content/uploads/2024/04/Masters-of-Scale-Podcast-Tile-360x360-1.jpg",
"officialWebsiteLink": "https://mastersofscale.com/",
"meta": {
"site": "radio",
"source": "WaitWhat"
},
"link": "/radio/program/masters-of-scale",
"subscribe": {
"apple": "http://mastersofscale.app.link/",
"rss": "https://rss.art19.com/masters-of-scale"
}
},
"mindshift": {
"id": "mindshift",
"title": "MindShift",
"tagline": "A podcast about the future of learning and how we raise our kids",
"info": "The MindShift podcast explores the innovations in education that are shaping how kids learn. Hosts Ki Sung and Katrina Schwartz introduce listeners to educators, researchers, parents and students who are developing effective ways to improve how kids learn. We cover topics like how fed-up administrators are developing surprising tactics to deal with classroom disruptions; how listening to podcasts are helping kids develop reading skills; the consequences of overparenting; and why interdisciplinary learning can engage students on all ends of the traditional achievement spectrum. This podcast is part of the MindShift education site, a division of KQED News. KQED is an NPR/PBS member station based in San Francisco. You can also visit the MindShift website for episodes and supplemental blog posts or tweet us \u003ca href=\"https://twitter.com/MindShiftKQED\">@MindShiftKQED\u003c/a> or visit us at \u003ca href=\"/mindshift\">MindShift.KQED.org\u003c/a>",
"imageSrc": "https://cdn.kqed.org/wp-content/uploads/2024/04/Mindshift-Podcast-Tile-703x703-1.jpg",
"imageAlt": "KQED MindShift: How We Will Learn",
"officialWebsiteLink": "/mindshift/",
"meta": {
"site": "news",
"source": "kqed",
"order": 12
},
"link": "/podcasts/mindshift",
"subscribe": {
"apple": "https://podcasts.apple.com/us/podcast/mindshift-podcast/id1078765985",
"google": "https://podcasts.google.com/feed/aHR0cHM6Ly9mZWVkcy5tZWdhcGhvbmUuZm0vS1FJTkM1NzY0NjAwNDI5",
"npr": "https://www.npr.org/podcasts/464615685/mind-shift-podcast",
"stitcher": "https://www.stitcher.com/podcast/kqed/stories-teachers-share",
"spotify": "https://open.spotify.com/show/0MxSpNYZKNprFLCl7eEtyx"
}
},
"morning-edition": {
"id": "morning-edition",
"title": "Morning Edition",
"info": "\u003cem>Morning Edition\u003c/em> takes listeners around the country and the world with multi-faceted stories and commentaries every weekday. Hosts Steve Inskeep, David Greene and Rachel Martin bring you the latest breaking news and features to prepare you for the day.",
"airtime": "MON-FRI 3am-9am",
"imageSrc": "https://cdn.kqed.org/wp-content/uploads/2024/04/Morning-Edition-Podcast-Tile-360x360-1.jpg",
"officialWebsiteLink": "https://www.npr.org/programs/morning-edition/",
"meta": {
"site": "news",
"source": "npr"
},
"link": "/radio/program/morning-edition"
},
"onourwatch": {
"id": "onourwatch",
"title": "On Our Watch",
"tagline": "Deeply-reported investigative journalism",
"info": "For decades, the process for how police police themselves has been inconsistent – if not opaque. In some states, like California, these proceedings were completely hidden. After a new police transparency law unsealed scores of internal affairs files, our reporters set out to examine these cases and the shadow world of police discipline. On Our Watch brings listeners into the rooms where officers are questioned and witnesses are interrogated to find out who this system is really protecting. Is it the officers, or the public they've sworn to serve?",
"imageSrc": "https://cdn.kqed.org/wp-content/uploads/2024/04/On-Our-Watch-Podcast-Tile-703x703-1.jpg",
"imageAlt": "On Our Watch from NPR and KQED",
"officialWebsiteLink": "/podcasts/onourwatch",
"meta": {
"site": "news",
"source": "kqed",
"order": 11
},
"link": "/podcasts/onourwatch",
"subscribe": {
"apple": "https://podcasts.apple.com/podcast/id1567098962",
"google": "https://podcasts.google.com/feed/aHR0cHM6Ly9mZWVkcy5ucHIub3JnLzUxMDM2MC9wb2RjYXN0LnhtbD9zYz1nb29nbGVwb2RjYXN0cw",
"npr": "https://rpb3r.app.goo.gl/onourwatch",
"spotify": "https://open.spotify.com/show/0OLWoyizopu6tY1XiuX70x",
"tuneIn": "https://tunein.com/radio/On-Our-Watch-p1436229/",
"stitcher": "https://www.stitcher.com/show/on-our-watch",
"rss": "https://feeds.npr.org/510360/podcast.xml"
}
},
"on-the-media": {
"id": "on-the-media",
"title": "On The Media",
"info": "Our weekly podcast explores how the media 'sausage' is made, casts an incisive eye on fluctuations in the marketplace of ideas, and examines threats to the freedom of information and expression in America and abroad. For one hour a week, the show tries to lift the veil from the process of \"making media,\" especially news media, because it's through that lens that we see the world and the world sees us",
"airtime": "SUN 2pm-3pm, MON 12am-1am",
"imageSrc": "https://ww2.kqed.org/radio/wp-content/uploads/sites/50/2018/04/onTheMedia.png",
"officialWebsiteLink": "https://www.wnycstudios.org/shows/otm",
"meta": {
"site": "news",
"source": "wnyc"
},
"link": "/radio/program/on-the-media",
"subscribe": {
"apple": "https://itunes.apple.com/us/podcast/on-the-media/id73330715?mt=2",
"tuneIn": "https://tunein.com/radio/On-the-Media-p69/",
"rss": "http://feeds.wnyc.org/onthemedia"
}
},
"pbs-newshour": {
"id": "pbs-newshour",
"title": "PBS NewsHour",
"info": "Analysis, background reports and updates from the PBS NewsHour putting today's news in context.",
"airtime": "MON-FRI 3pm-4pm",
"imageSrc": "https://cdn.kqed.org/wp-content/uploads/2024/04/PBS-News-Hour-Podcast-Tile-360x360-1.jpg",
"officialWebsiteLink": "https://www.pbs.org/newshour/",
"meta": {
"site": "news",
"source": "pbs"
},
"link": "/radio/program/pbs-newshour",
"subscribe": {
"apple": "https://itunes.apple.com/us/podcast/pbs-newshour-full-show/id394432287?mt=2",
"tuneIn": "https://tunein.com/radio/PBS-NewsHour---Full-Show-p425698/",
"rss": "https://www.pbs.org/newshour/feeds/rss/podcasts/show"
}
},
"perspectives": {
"id": "perspectives",
"title": "Perspectives",
"tagline": "KQED's series of daily listener commentaries since 1991",
"info": "KQED's series of daily listener commentaries since 1991.",
"imageSrc": "https://cdn.kqed.org/wp-content/uploads/2025/01/Perspectives_Tile_Final.jpg",
"imageAlt": "KQED Perspectives",
"officialWebsiteLink": "/perspectives/",
"meta": {
"site": "radio",
"source": "kqed",
"order": 14
},
"link": "/perspectives",
"subscribe": {
"apple": "https://podcasts.apple.com/us/podcast/id73801135",
"npr": "https://www.npr.org/podcasts/432309616/perspectives",
"rss": "https://ww2.kqed.org/perspectives/category/perspectives/feed/",
"google": "https://podcasts.google.com/feed/aHR0cHM6Ly93dzIua3FlZC5vcmcvcGVyc3BlY3RpdmVzL2NhdGVnb3J5L3BlcnNwZWN0aXZlcy9mZWVkLw"
}
},
"planet-money": {
"id": "planet-money",
"title": "Planet Money",
"info": "The economy explained. Imagine you could call up a friend and say, Meet me at the bar and tell me what's going on with the economy. Now imagine that's actually a fun evening.",
"airtime": "SUN 3pm-4pm",
"imageSrc": "https://ww2.kqed.org/radio/wp-content/uploads/sites/50/2018/04/planetmoney.jpg",
"officialWebsiteLink": "https://www.npr.org/sections/money/",
"meta": {
"site": "news",
"source": "npr"
},
"link": "/radio/program/planet-money",
"subscribe": {
"npr": "https://rpb3r.app.goo.gl/M4f5",
"apple": "https://itunes.apple.com/us/podcast/planet-money/id290783428?mt=2",
"tuneIn": "https://tunein.com/podcasts/Business--Economics-Podcasts/Planet-Money-p164680/",
"rss": "https://feeds.npr.org/510289/podcast.xml"
}
},
"politicalbreakdown": {
"id": "politicalbreakdown",
"title": "Political Breakdown",
"tagline": "Politics from a personal perspective",
"info": "Political Breakdown is a new series that explores the political intersection of California and the nation. Each week hosts Scott Shafer and Marisa Lagos are joined with a new special guest to unpack politics -- with personality — and offer an insider’s glimpse at how politics happens.",
"airtime": "THU 6:30pm-7pm",
"imageSrc": "https://cdn.kqed.org/wp-content/uploads/2024/04/Political-Breakdown-2024-Podcast-Tile-703x703-1.jpg",
"imageAlt": "KQED Political Breakdown",
"officialWebsiteLink": "/podcasts/politicalbreakdown",
"meta": {
"site": "radio",
"source": "kqed",
"order": 5
},
"link": "/podcasts/politicalbreakdown",
"subscribe": {
"apple": "https://podcasts.apple.com/us/podcast/political-breakdown/id1327641087",
"amazon": "https://music.amazon.com/podcasts/e0c2d153-ad36-4c8d-901d-f1da6a724824/political-breakdown",
"npr": "https://www.npr.org/podcasts/572155894/political-breakdown",
"stitcher": "https://www.stitcher.com/podcast/kqed/political-breakdown",
"spotify": "https://open.spotify.com/show/07RVyIjIdk2WDuVehvBMoN",
"rss": "https://ww2.kqed.org/news/tag/political-breakdown/feed/podcast"
}
},
"possible": {
"id": "possible",
"title": "Possible",
"info": "Possible is hosted by entrepreneur Reid Hoffman and writer Aria Finger. Together in Possible, Hoffman and Finger lead enlightening discussions about building a brighter collective future. The show features interviews with visionary guests like Trevor Noah, Sam Altman and Janette Sadik-Khan. Possible paints an optimistic portrait of the world we can create through science, policy, business, art and our shared humanity. It asks: What if everything goes right for once? How can we get there? Each episode also includes a short fiction story generated by advanced AI GPT-4, serving as a thought-provoking springboard to speculate how humanity could leverage technology for good.",
"airtime": "SUN 2pm",
"imageSrc": "https://cdn.kqed.org/wp-content/uploads/2024/04/Possible-Podcast-Tile-360x360-1.jpg",
"officialWebsiteLink": "https://www.possible.fm/",
"meta": {
"site": "news",
"source": "Possible"
},
"link": "/radio/program/possible",
"subscribe": {
"apple": "https://podcasts.apple.com/us/podcast/possible/id1677184070",
"spotify": "https://open.spotify.com/show/730YpdUSNlMyPQwNnyjp4k"
}
},
"pri-the-world": {
"id": "pri-the-world",
"title": "PRI's The World: Latest Edition",
"info": "Each weekday, host Marco Werman and his team of producers bring you the world's most interesting stories in an hour of radio that reminds us just how small our planet really is.",
"airtime": "MON-FRI 2pm-3pm",
"imageSrc": "https://cdn.kqed.org/wp-content/uploads/2024/04/The-World-Podcast-Tile-360x360-1.jpg",
"officialWebsiteLink": "https://www.pri.org/programs/the-world",
"meta": {
"site": "news",
"source": "PRI"
},
"link": "/radio/program/pri-the-world",
"subscribe": {
"apple": "https://itunes.apple.com/us/podcast/pris-the-world-latest-edition/id278196007?mt=2",
"tuneIn": "https://tunein.com/podcasts/News--Politics-Podcasts/PRIs-The-World-p24/",
"rss": "http://feeds.feedburner.com/pri/theworld"
}
},
"radiolab": {
"id": "radiolab",
"title": "Radiolab",
"info": "A two-time Peabody Award-winner, Radiolab is an investigation told through sounds and stories, and centered around one big idea. In the Radiolab world, information sounds like music and science and culture collide. Hosted by Jad Abumrad and Robert Krulwich, the show is designed for listeners who demand skepticism, but appreciate wonder. WNYC Studios is the producer of other leading podcasts including Freakonomics Radio, Death, Sex & Money, On the Media and many more.",
"airtime": "SUN 12am-1am, SAT 2pm-3pm",
"imageSrc": "https://ww2.kqed.org/radio/wp-content/uploads/sites/50/2018/04/radiolab1400.png",
"officialWebsiteLink": "https://www.wnycstudios.org/shows/radiolab/",
"meta": {
"site": "science",
"source": "WNYC"
},
"link": "/radio/program/radiolab",
"subscribe": {
"apple": "https://itunes.apple.com/us/podcast/radiolab/id152249110?mt=2",
"tuneIn": "https://tunein.com/radio/RadioLab-p68032/",
"rss": "https://feeds.wnyc.org/radiolab"
}
},
"reveal": {
"id": "reveal",
"title": "Reveal",
"info": "Created by The Center for Investigative Reporting and PRX, Reveal is public radios first one-hour weekly radio show and podcast dedicated to investigative reporting. Credible, fact based and without a partisan agenda, Reveal combines the power and artistry of driveway moment storytelling with data-rich reporting on critically important issues. The result is stories that inform and inspire, arming our listeners with information to right injustices, hold the powerful accountable and improve lives.Reveal is hosted by Al Letson and showcases the award-winning work of CIR and newsrooms large and small across the nation. In a radio and podcast market crowded with choices, Reveal focuses on important and often surprising stories that illuminate the world for our listeners.",
"airtime": "SAT 4pm-5pm",
"imageSrc": "https://ww2.kqed.org/radio/wp-content/uploads/sites/50/2018/04/reveal300px.png",
"officialWebsiteLink": "https://www.revealnews.org/episodes/",
"meta": {
"site": "news",
"source": "npr"
},
"link": "/radio/program/reveal",
"subscribe": {
"apple": "https://itunes.apple.com/us/podcast/reveal/id886009669",
"tuneIn": "https://tunein.com/radio/Reveal-p679597/",
"rss": "http://feeds.revealradio.org/revealpodcast"
}
},
"rightnowish": {
"id": "rightnowish",
"title": "Rightnowish",
"tagline": "Art is where you find it",
"info": "Rightnowish digs into life in the Bay Area right now… ish. Journalist Pendarvis Harshaw takes us to galleries painted on the sides of liquor stores in West Oakland. We'll dance in warehouses in the Bayview, make smoothies with kids in South Berkeley, and listen to classical music in a 1984 Cutlass Supreme in Richmond. Every week, Pen talks to movers and shakers about how the Bay Area shapes what they create, and how they shape the place we call home.",
"imageSrc": "https://cdn.kqed.org/wp-content/uploads/2024/04/Rightnowish-Podcast-Tile-500x500-1.jpg",
"imageAlt": "KQED Rightnowish with Pendarvis Harshaw",
"officialWebsiteLink": "/podcasts/rightnowish",
"meta": {
"site": "arts",
"source": "kqed",
"order": 16
},
"link": "/podcasts/rightnowish",
"subscribe": {
"npr": "https://www.npr.org/podcasts/721590300/rightnowish",
"rss": "https://ww2.kqed.org/arts/programs/rightnowish/feed/podcast",
"apple": "https://podcasts.apple.com/us/podcast/rightnowish/id1482187648",
"stitcher": "https://www.stitcher.com/podcast/kqed/rightnowish",
"google": "https://podcasts.google.com/feed/aHR0cHM6Ly9mZWVkcy5tZWdhcGhvbmUuZm0vS1FJTkMxMjU5MTY3NDc4",
"spotify": "https://open.spotify.com/show/7kEJuafTzTVan7B78ttz1I"
}
},
"science-friday": {
"id": "science-friday",
"title": "Science Friday",
"info": "Science Friday is a weekly science talk show, broadcast live over public radio stations nationwide. Each week, the show focuses on science topics that are in the news and tries to bring an educated, balanced discussion to bear on the scientific issues at hand. Panels of expert guests join host Ira Flatow, a veteran science journalist, to discuss science and to take questions from listeners during the call-in portion of the program.",
"airtime": "FRI 11am-1pm",
"imageSrc": "https://cdn.kqed.org/wp-content/uploads/2024/04/Science-Friday-Podcast-Tile-360x360-1.jpg",
"officialWebsiteLink": "https://www.wnycstudios.org/shows/science-friday",
"meta": {
"site": "news",
"source": "npr"
},
"link": "/radio/program/science-friday",
"subscribe": {
"apple": "https://itunes.apple.com/WebObjects/MZStore.woa/wa/viewPodcast?s=143441&mt=2&id=73329284&at=11l79Y&ct=nprdirectory",
"tuneIn": "https://tunein.com/radio/Science-Friday-p394/",
"rss": "http://feeds.wnyc.org/science-friday"
}
},
"snap-judgment": {
"id": "snap-judgment",
"title": "Snap Judgment",
"tagline": "Real stories with killer beats",
"info": "The Snap Judgment radio show and podcast mixes real stories with killer beats to produce cinematic, dramatic radio. Snap's musical brand of storytelling dares listeners to see the world through the eyes of another. This is storytelling... with a BEAT!! Snap first aired on public radio stations nationwide in July 2010. Today, Snap Judgment airs on over 450 public radio stations and is brought to the airwaves by KQED & PRX.",
"airtime": "SAT 1pm-2pm, 9pm-10pm",
"imageSrc": "https://cdn.kqed.org/wp-content/uploads/2024/05/Snap-Judgment-Podcast-Tile-703x703-1.jpg",
"imageAlt": "KQED Snap Judgment",
"officialWebsiteLink": "https://snapjudgment.org",
"meta": {
"site": "arts",
"source": "kqed",
"order": 4
},
"link": "https://snapjudgment.org",
"subscribe": {
"apple": "https://podcasts.apple.com/us/podcast/snap-judgment/id283657561",
"npr": "https://www.npr.org/podcasts/449018144/snap-judgment",
"stitcher": "https://www.pandora.com/podcast/snap-judgment/PC:241?source=stitcher-sunset",
"spotify": "https://open.spotify.com/show/3Cct7ZWmxHNAtLgBTqjC5v",
"rss": "https://snap.feed.snapjudgment.org/"
}
},
"soldout": {
"id": "soldout",
"title": "SOLD OUT: Rethinking Housing in America",
"tagline": "A new future for housing",
"info": "Sold Out: Rethinking Housing in America",
"imageSrc": "https://cdn.kqed.org/wp-content/uploads/2024/04/Sold-Out-Podcast-Tile-703x703-1.jpg",
"imageAlt": "KQED Sold Out: Rethinking Housing in America",
"officialWebsiteLink": "/podcasts/soldout",
"meta": {
"site": "news",
"source": "kqed",
"order": 13
},
"link": "/podcasts/soldout",
"subscribe": {
"npr": "https://www.npr.org/podcasts/911586047/s-o-l-d-o-u-t-a-new-future-for-housing",
"apple": "https://podcasts.apple.com/us/podcast/introducing-sold-out-rethinking-housing-in-america/id1531354937",
"rss": "https://feeds.megaphone.fm/soldout",
"spotify": "https://open.spotify.com/show/38dTBSk2ISFoPiyYNoKn1X",
"stitcher": "https://www.stitcher.com/podcast/kqed/sold-out-rethinking-housing-in-america",
"tunein": "https://tunein.com/radio/SOLD-OUT-Rethinking-Housing-in-America-p1365871/"
}
},
"spooked": {
"id": "spooked",
"title": "Spooked",
"tagline": "True-life supernatural stories",
"info": "",
"imageSrc": "https://cdn.kqed.org/wp-content/uploads/2024/10/Spooked-Podcast-Tile-703x703-1.jpg",
"imageAlt": "KQED Spooked",
"officialWebsiteLink": "https://spookedpodcast.org/",
"meta": {
"site": "news",
"source": "kqed",
"order": 7
},
"link": "https://spookedpodcast.org/",
"subscribe": {
"apple": "https://podcasts.apple.com/us/podcast/spooked/id1279361017",
"npr": "https://www.npr.org/podcasts/549547848/snap-judgment-presents-spooked",
"spotify": "https://open.spotify.com/show/76571Rfl3m7PLJQZKQIGCT",
"rss": "https://feeds.simplecast.com/TBotaapn"
}
},
"tech-nation": {
"id": "tech-nation",
"title": "Tech Nation Radio Podcast",
"info": "Tech Nation is a weekly public radio program, hosted by Dr. Moira Gunn. Founded in 1993, it has grown from a simple interview show to a multi-faceted production, featuring conversations with noted technology and science leaders, and a weekly science and technology-related commentary.",
"airtime": "FRI 10pm",
"imageSrc": "https://cdn.kqed.org/wp-content/uploads/2024/04/Tech-Nation-Radio-Podcast-Tile-360x360-1.jpg",
"officialWebsiteLink": "http://technation.podomatic.com/",
"meta": {
"site": "science",
"source": "Tech Nation Media"
},
"link": "/radio/program/tech-nation",
"subscribe": {
"rss": "https://technation.podomatic.com/rss2.xml"
}
},
"ted-radio-hour": {
"id": "ted-radio-hour",
"title": "TED Radio Hour",
"info": "The TED Radio Hour is a journey through fascinating ideas, astonishing inventions, fresh approaches to old problems, and new ways to think and create.",
"airtime": "SUN 3pm-4pm, SAT 10pm-11pm",
"imageSrc": "https://ww2.kqed.org/radio/wp-content/uploads/sites/50/2018/04/tedRadioHour.jpg",
"officialWebsiteLink": "https://www.npr.org/programs/ted-radio-hour/?showDate=2018-06-22",
"meta": {
"site": "news",
"source": "npr"
},
"link": "/radio/program/ted-radio-hour",
"subscribe": {
"npr": "https://rpb3r.app.goo.gl/8vsS",
"apple": "https://itunes.apple.com/WebObjects/MZStore.woa/wa/viewPodcast?s=143441&mt=2&id=523121474&at=11l79Y&ct=nprdirectory",
"tuneIn": "https://tunein.com/radio/TED-Radio-Hour-p418021/",
"rss": "https://feeds.npr.org/510298/podcast.xml"
}
},
"thebay": {
"id": "thebay",
"title": "The Bay",
"tagline": "Local news to keep you rooted",
"info": "Host Devin Katayama walks you through the biggest story of the day with reporters and newsmakers.",
"imageSrc": "https://cdn.kqed.org/wp-content/uploads/2024/04/The-Bay-Podcast-Tile-703x703-1.jpg",
"imageAlt": "KQED The Bay",
"officialWebsiteLink": "/podcasts/thebay",
"meta": {
"site": "radio",
"source": "kqed",
"order": 2
},
"link": "/podcasts/thebay",
"subscribe": {
"apple": "https://podcasts.apple.com/us/podcast/the-bay/id1350043452",
"amazon": "https://music.amazon.com/podcasts/d800ea4c-7a2c-42f2-b861-edaf78a5db0b/the-bay",
"npr": "https://www.npr.org/podcasts/586725995/the-bay",
"stitcher": "https://www.stitcher.com/podcast/kqed/the-bay",
"spotify": "https://open.spotify.com/show/4BIKBKIujizLHlIlBNaAqQ",
"rss": "https://feeds.megaphone.fm/KQINC8259786327"
}
},
"thelatest": {
"id": "thelatest",
"title": "The Latest",
"tagline": "Trusted local news in real time",
"info": "",
"imageSrc": "https://cdn.kqed.org/wp-content/uploads/2025/05/The-Latest-2025-Podcast-Tile-703x703-1.jpg",
"imageAlt": "KQED The Latest",
"officialWebsiteLink": "/thelatest",
"meta": {
"site": "news",
"source": "kqed",
"order": 6
},
"link": "/thelatest",
"subscribe": {
"apple": "https://podcasts.apple.com/us/podcast/the-latest-from-kqed/id1197721799",
"npr": "https://www.npr.org/podcasts/1257949365/the-latest-from-k-q-e-d",
"spotify": "https://open.spotify.com/show/5KIIXMgM9GTi5AepwOYvIZ?si=bd3053fec7244dba",
"rss": "https://feeds.megaphone.fm/KQINC9137121918"
}
},
"theleap": {
"id": "theleap",
"title": "The Leap",
"tagline": "What if you closed your eyes, and jumped?",
"info": "Stories about people making dramatic, risky changes, told by award-winning public radio reporter Judy Campbell.",
"imageSrc": "https://cdn.kqed.org/wp-content/uploads/2024/04/The-Leap-Podcast-Tile-703x703-1.jpg",
"imageAlt": "KQED The Leap",
"officialWebsiteLink": "/podcasts/theleap",
"meta": {
"site": "news",
"source": "kqed",
"order": 17
},
"link": "/podcasts/theleap",
"subscribe": {
"apple": "https://podcasts.apple.com/us/podcast/the-leap/id1046668171",
"npr": "https://www.npr.org/podcasts/447248267/the-leap",
"stitcher": "https://www.stitcher.com/podcast/kqed/the-leap",
"spotify": "https://open.spotify.com/show/3sSlVHHzU0ytLwuGs1SD1U",
"rss": "https://ww2.kqed.org/news/programs/the-leap/feed/podcast"
}
},
"the-moth-radio-hour": {
"id": "the-moth-radio-hour",
"title": "The Moth Radio Hour",
"info": "Since its launch in 1997, The Moth has presented thousands of true stories, told live and without notes, to standing-room-only crowds worldwide. Moth storytellers stand alone, under a spotlight, with only a microphone and a roomful of strangers. The storyteller and the audience embark on a high-wire act of shared experience which is both terrifying and exhilarating. Since 2008, The Moth podcast has featured many of our favorite stories told live on Moth stages around the country. For information on all of our programs and live events, visit themoth.org.",
"airtime": "SAT 8pm-9pm and SUN 11am-12pm",
"imageSrc": "https://ww2.kqed.org/radio/wp-content/uploads/sites/50/2018/04/theMoth.jpg",
"officialWebsiteLink": "https://themoth.org/",
"meta": {
"site": "arts",
"source": "prx"
},
"link": "/radio/program/the-moth-radio-hour",
"subscribe": {
"apple": "https://itunes.apple.com/us/podcast/the-moth-podcast/id275699983?mt=2",
"tuneIn": "https://tunein.com/radio/The-Moth-p273888/",
"rss": "http://feeds.themoth.org/themothpodcast"
}
},
"the-new-yorker-radio-hour": {
"id": "the-new-yorker-radio-hour",
"title": "The New Yorker Radio Hour",
"info": "The New Yorker Radio Hour is a weekly program presented by the magazine's editor, David Remnick, and produced by WNYC Studios and The New Yorker. Each episode features a diverse mix of interviews, profiles, storytelling, and an occasional burst of humor inspired by the magazine, and shaped by its writers, artists, and editors. This isn't a radio version of a magazine, but something all its own, reflecting the rich possibilities of audio storytelling and conversation. Theme music for the show was composed and performed by Merrill Garbus of tUnE-YArDs.",
"airtime": "SAT 10am-11am",
"imageSrc": "https://cdn.kqed.org/wp-content/uploads/2024/04/The-New-Yorker-Podcast-Tile-360x360-1.jpg",
"officialWebsiteLink": "https://www.wnycstudios.org/shows/tnyradiohour",
"meta": {
"site": "arts",
"source": "WNYC"
},
"link": "/radio/program/the-new-yorker-radio-hour",
"subscribe": {
"apple": "https://itunes.apple.com/us/podcast/id1050430296",
"tuneIn": "https://tunein.com/podcasts/WNYC-Podcasts/New-Yorker-Radio-Hour-p803804/",
"rss": "https://feeds.feedburner.com/newyorkerradiohour"
}
},
"the-sam-sanders-show": {
"id": "the-sam-sanders-show",
"title": "The Sam Sanders Show",
"info": "One of public radio's most dynamic voices, Sam Sanders helped launch The NPR Politics Podcast and hosted NPR's hit show It's Been A Minute. Now, the award-winning host returns with something brand new, The Sam Sanders Show. Every week, Sam Sanders and friends dig into the culture that shapes our lives: what's driving the biggest trends, how artists really think, and even the memes you can't stop scrolling past. Sam is beloved for his way of unpacking the world and bringing you up close to fresh currents and engaging conversations. The Sam Sanders Show is smart, funny and always a good time.",
"airtime": "FRI 12-1pm AND SAT 11am-12pm",
"imageSrc": "https://cdn.kqed.org/wp-content/uploads/2025/11/The-Sam-Sanders-Show-Podcast-Tile-400x400-1.jpg",
"officialWebsiteLink": "https://www.kcrw.com/shows/the-sam-sanders-show/latest",
"meta": {
"site": "arts",
"source": "KCRW"
},
"link": "https://www.kcrw.com/shows/the-sam-sanders-show/latest",
"subscribe": {
"rss": "https://feed.cdnstream1.com/zjb/feed/download/ac/28/59/ac28594c-e1d0-4231-8728-61865cdc80e8.xml"
}
},
"the-splendid-table": {
"id": "the-splendid-table",
"title": "The Splendid Table",
"info": "\u003cem>The Splendid Table\u003c/em> hosts our nation's conversations about cooking, sustainability and food culture.",
"imageSrc": "https://cdn.kqed.org/wp-content/uploads/2024/04/The-Splendid-Table-Podcast-Tile-360x360-1.jpg",
"officialWebsiteLink": "https://www.splendidtable.org/",
"airtime": "SUN 10-11 pm",
"meta": {
"site": "radio",
"source": "npr"
},
"link": "/radio/program/the-splendid-table"
},
"this-american-life": {
"id": "this-american-life",
"title": "This American Life",
"info": "This American Life is a weekly public radio show, heard by 2.2 million people on more than 500 stations. Another 2.5 million people download the weekly podcast. It is hosted by Ira Glass, produced in collaboration with Chicago Public Media, delivered to stations by PRX The Public Radio Exchange, and has won all of the major broadcasting awards.",
"airtime": "SAT 12pm-1pm, 7pm-8pm",
"imageSrc": "https://ww2.kqed.org/radio/wp-content/uploads/sites/50/2018/04/thisAmericanLife.png",
"officialWebsiteLink": "https://www.thisamericanlife.org/",
"meta": {
"site": "news",
"source": "wbez"
},
"link": "/radio/program/this-american-life",
"subscribe": {
"apple": "https://itunes.apple.com/WebObjects/MZStore.woa/wa/viewPodcast?s=143441&mt=2&id=201671138&at=11l79Y&ct=nprdirectory",
"rss": "https://www.thisamericanlife.org/podcast/rss.xml"
}
},
"tinydeskradio": {
"id": "tinydeskradio",
"title": "Tiny Desk Radio",
"info": "We're bringing the best of Tiny Desk to the airwaves, only on public radio.",
"airtime": "SUN 8pm and SAT 9pm",
"imageSrc": "https://cdn.kqed.org/wp-content/uploads/2025/04/300x300-For-Member-Station-Logo-Tiny-Desk-Radio-@2x.png",
"officialWebsiteLink": "https://www.npr.org/series/g-s1-52030/tiny-desk-radio",
"meta": {
"site": "news",
"source": "npr"
},
"link": "/radio/program/tinydeskradio",
"subscribe": {
"rss": "https://feeds.npr.org/g-s1-52030/rss.xml"
}
},
"wait-wait-dont-tell-me": {
"id": "wait-wait-dont-tell-me",
"title": "Wait Wait... Don't Tell Me!",
"info": "Peter Sagal and Bill Kurtis host the weekly NPR News quiz show alongside some of the best and brightest news and entertainment personalities.",
"airtime": "SUN 10am-11am, SAT 11am-12pm, SAT 6pm-7pm",
"imageSrc": "https://cdn.kqed.org/wp-content/uploads/2024/04/Wait-Wait-Podcast-Tile-300x300-1.jpg",
"officialWebsiteLink": "https://www.npr.org/programs/wait-wait-dont-tell-me/",
"meta": {
"site": "news",
"source": "npr"
},
"link": "/radio/program/wait-wait-dont-tell-me",
"subscribe": {
"npr": "https://rpb3r.app.goo.gl/Xogv",
"apple": "https://itunes.apple.com/WebObjects/MZStore.woa/wa/viewPodcast?s=143441&mt=2&id=121493804&at=11l79Y&ct=nprdirectory",
"tuneIn": "https://tunein.com/radio/Wait-Wait-Dont-Tell-Me-p46/",
"rss": "https://feeds.npr.org/344098539/podcast.xml"
}
},
"weekend-edition-saturday": {
"id": "weekend-edition-saturday",
"title": "Weekend Edition Saturday",
"info": "Weekend Edition Saturday wraps up the week's news and offers a mix of analysis and features on a wide range of topics, including arts, sports, entertainment, and human interest stories. The two-hour program is hosted by NPR's Peabody Award-winning Scott Simon.",
"airtime": "SAT 5am-10am",
"imageSrc": "https://cdn.kqed.org/wp-content/uploads/2024/04/Weekend-Edition-Podcast-Tile-360x360-1.jpg",
"officialWebsiteLink": "https://www.npr.org/programs/weekend-edition-saturday/",
"meta": {
"site": "news",
"source": "npr"
},
"link": "/radio/program/weekend-edition-saturday"
},
"weekend-edition-sunday": {
"id": "weekend-edition-sunday",
"title": "Weekend Edition Sunday",
"info": "Weekend Edition Sunday features interviews with newsmakers, artists, scientists, politicians, musicians, writers, theologians and historians. The program has covered news events from Nelson Mandela's 1990 release from a South African prison to the capture of Saddam Hussein.",
"airtime": "SUN 5am-10am",
"imageSrc": "https://cdn.kqed.org/wp-content/uploads/2024/04/Weekend-Edition-Podcast-Tile-360x360-1.jpg",
"officialWebsiteLink": "https://www.npr.org/programs/weekend-edition-sunday/",
"meta": {
"site": "news",
"source": "npr"
},
"link": "/radio/program/weekend-edition-sunday"
}
},
"racesReducer": {},
"racesGenElectionReducer": {},
"racesGenElection2026Reducer": {},
"radioSchedulesReducer": {},
"listsReducer": {},
"recallGuideReducer": {
"intros": {},
"policy": {},
"candidates": {}
},
"savedArticleReducer": {
"articles": [],
"status": {}
},
"newslettersReducer": {
"isFetching": false,
"fetchFailed": false,
"hasFetched": false,
"newsletters": {},
"isSubscribing": false,
"isUnsubscribing": false,
"subscribedNewsletters": {}
},
"termsReducer": {
"about": {
"name": "About",
"type": "terms",
"id": "about",
"slug": "about",
"link": "/about",
"taxonomy": "site"
},
"arts": {
"name": "Arts & Culture",
"grouping": [
"arts",
"pop",
"trulyca"
],
"description": "KQED Arts provides daily in-depth coverage of the Bay Area's music, art, film, performing arts, literature and arts news, as well as cultural commentary and criticism.",
"type": "terms",
"id": "arts",
"slug": "arts",
"link": "/arts",
"taxonomy": "site"
},
"artschool": {
"name": "Art School",
"parent": "arts",
"type": "terms",
"id": "artschool",
"slug": "artschool",
"link": "/artschool",
"taxonomy": "site"
},
"bayareabites": {
"name": "KQED food",
"grouping": [
"food",
"bayareabites",
"checkplease"
],
"parent": "food",
"type": "terms",
"id": "bayareabites",
"slug": "bayareabites",
"link": "/food",
"taxonomy": "site"
},
"bayareahiphop": {
"name": "Bay Area Hiphop",
"type": "terms",
"id": "bayareahiphop",
"slug": "bayareahiphop",
"link": "/bayareahiphop",
"taxonomy": "site"
},
"campaign21": {
"name": "Campaign 21",
"type": "terms",
"id": "campaign21",
"slug": "campaign21",
"link": "/campaign21",
"taxonomy": "site"
},
"careers": {
"name": "Careers",
"type": "terms",
"id": "careers",
"slug": "careers",
"link": "/careers",
"taxonomy": "site"
},
"checkplease": {
"name": "KQED food",
"grouping": [
"food",
"bayareabites",
"checkplease"
],
"parent": "food",
"type": "terms",
"id": "checkplease",
"slug": "checkplease",
"link": "/food",
"taxonomy": "site"
},
"education": {
"name": "Education",
"grouping": [
"education"
],
"type": "terms",
"id": "education",
"slug": "education",
"link": "/education",
"taxonomy": "site"
},
"elections": {
"name": "Elections",
"type": "terms",
"id": "elections",
"slug": "elections",
"link": "/elections",
"taxonomy": "site"
},
"events": {
"name": "Events",
"type": "terms",
"id": "events",
"slug": "events",
"link": "/events",
"taxonomy": "site"
},
"event": {
"name": "Event",
"alias": "events",
"type": "terms",
"id": "event",
"slug": "event",
"link": "/event",
"taxonomy": "site"
},
"filmschoolshorts": {
"name": "Film School Shorts",
"type": "terms",
"id": "filmschoolshorts",
"slug": "filmschoolshorts",
"link": "/filmschoolshorts",
"taxonomy": "site"
},
"food": {
"name": "KQED food",
"grouping": [
"food",
"bayareabites",
"checkplease"
],
"type": "terms",
"id": "food",
"slug": "food",
"link": "/food",
"taxonomy": "site"
},
"forum": {
"name": "Forum",
"relatedContentQuery": "posts/forum?",
"parent": "news",
"type": "terms",
"id": "forum",
"slug": "forum",
"link": "/forum",
"taxonomy": "site"
},
"futureofyou": {
"name": "Future of You",
"grouping": [
"science",
"futureofyou"
],
"parent": "science",
"type": "terms",
"id": "futureofyou",
"slug": "futureofyou",
"link": "/futureofyou",
"taxonomy": "site"
},
"jpepinheart": {
"name": "KQED food",
"relatedContentQuery": "posts/food,bayareabites,checkplease",
"parent": "food",
"type": "terms",
"id": "jpepinheart",
"slug": "jpepinheart",
"link": "/food",
"taxonomy": "site"
},
"liveblog": {
"name": "Live Blog",
"type": "terms",
"id": "liveblog",
"slug": "liveblog",
"link": "/liveblog",
"taxonomy": "site"
},
"livetv": {
"name": "Live TV",
"parent": "tv",
"type": "terms",
"id": "livetv",
"slug": "livetv",
"link": "/livetv",
"taxonomy": "site"
},
"lowdown": {
"name": "The Lowdown",
"relatedContentQuery": "posts/lowdown?",
"parent": "news",
"type": "terms",
"id": "lowdown",
"slug": "lowdown",
"link": "/lowdown",
"taxonomy": "site"
},
"mindshift": {
"name": "Mindshift",
"parent": "news",
"description": "MindShift explores the future of education by highlighting the innovative – and sometimes counterintuitive – ways educators and parents are helping all children succeed.",
"type": "terms",
"id": "mindshift",
"slug": "mindshift",
"link": "/mindshift",
"taxonomy": "site"
},
"news": {
"name": "News",
"grouping": [
"news",
"forum"
],
"type": "terms",
"id": "news",
"slug": "news",
"link": "/news",
"taxonomy": "site"
},
"newsletters": {
"name": "newsletters",
"type": "terms",
"id": "newsletters",
"slug": "newsletters",
"link": "/newsletters",
"taxonomy": "site"
},
"perspectives": {
"name": "Perspectives",
"parent": "radio",
"type": "terms",
"id": "perspectives",
"slug": "perspectives",
"link": "/perspectives",
"taxonomy": "site"
},
"podcasts": {
"name": "Podcasts",
"type": "terms",
"id": "podcasts",
"slug": "podcasts",
"link": "/podcasts",
"taxonomy": "site"
},
"pop": {
"name": "Pop",
"parent": "arts",
"type": "terms",
"id": "pop",
"slug": "pop",
"link": "/pop",
"taxonomy": "site"
},
"pressroom": {
"name": "Pressroom",
"type": "terms",
"id": "pressroom",
"slug": "pressroom",
"link": "/pressroom",
"taxonomy": "site"
},
"quest": {
"name": "Quest",
"parent": "science",
"type": "terms",
"id": "quest",
"slug": "quest",
"link": "/quest",
"taxonomy": "site"
},
"radio": {
"name": "Radio",
"grouping": [
"forum",
"perspectives"
],
"description": "Listen to KQED Public Radio – home of Forum and The California Report – on 88.5 FM in San Francisco, 89.3 FM in Sacramento, 88.3 FM in Santa Rosa and 88.1 FM in Martinez.",
"type": "terms",
"id": "radio",
"slug": "radio",
"link": "/radio",
"taxonomy": "site"
},
"root": {
"name": "KQED",
"image": "https://ww2.kqed.org/app/uploads/2020/02/KQED-OG-Image@1x.png",
"imageWidth": 1200,
"imageHeight": 630,
"headData": {
"title": "KQED | News, Radio, Podcasts, TV | Public Media for Northern California",
"description": "KQED provides public radio, television, and independent reporting on issues that matter to the Bay Area. We’re the NPR and PBS member station for Northern California."
},
"type": "terms",
"id": "root",
"slug": "root",
"link": "/root",
"taxonomy": "site"
},
"science": {
"name": "Science",
"grouping": [
"science",
"futureofyou"
],
"description": "KQED Science brings you award-winning science and environment coverage from the Bay Area and beyond.",
"type": "terms",
"id": "science",
"slug": "science",
"link": "/science",
"taxonomy": "site"
},
"stateofhealth": {
"name": "State of Health",
"parent": "science",
"type": "terms",
"id": "stateofhealth",
"slug": "stateofhealth",
"link": "/stateofhealth",
"taxonomy": "site"
},
"support": {
"name": "Support",
"type": "terms",
"id": "support",
"slug": "support",
"link": "/support",
"taxonomy": "site"
},
"thedolist": {
"name": "The Do List",
"parent": "arts",
"type": "terms",
"id": "thedolist",
"slug": "thedolist",
"link": "/thedolist",
"taxonomy": "site"
},
"trulyca": {
"name": "Truly CA",
"grouping": [
"arts",
"pop",
"trulyca"
],
"parent": "arts",
"type": "terms",
"id": "trulyca",
"slug": "trulyca",
"link": "/trulyca",
"taxonomy": "site"
},
"tv": {
"name": "TV",
"type": "terms",
"id": "tv",
"slug": "tv",
"link": "/tv",
"taxonomy": "site"
},
"voterguide": {
"name": "Voter Guide",
"parent": "elections",
"alias": "elections",
"type": "terms",
"id": "voterguide",
"slug": "voterguide",
"link": "/voterguide",
"taxonomy": "site"
},
"guiaelectoral": {
"name": "Guia Electoral",
"parent": "elections",
"alias": "elections",
"type": "terms",
"id": "guiaelectoral",
"slug": "guiaelectoral",
"link": "/guiaelectoral",
"taxonomy": "site"
},
"source_science_1843614": {
"type": "terms",
"id": "source_science_1843614",
"meta": {
"override": true
},
"name": "PBS Newshour",
"link": "http://www.pbs.org/newshour/",
"isLoading": false
},
"science_28": {
"type": "terms",
"id": "science_28",
"meta": {
"index": "terms_1716263798",
"site": "science",
"id": "28",
"found": true
},
"relationships": {},
"featImg": null,
"name": "Astronomy",
"description": "Explore the universe with KQED Science! Dive into the latest astronomy news, discover celestial events, and unravel the mysteries of outer space.",
"taxonomy": "category",
"headData": {
"twImgId": null,
"twTitle": null,
"ogTitle": null,
"ogImgId": null,
"twDescription": null,
"description": "Explore the universe with KQED Science! Dive into the latest astronomy news, discover celestial events, and unravel the mysteries of outer space.",
"title": "Astronomy Articles | KQED Science",
"ogDescription": null
},
"ttid": 30,
"slug": "astronomy",
"isLoading": false,
"link": "/science/category/astronomy"
},
"science_40": {
"type": "terms",
"id": "science_40",
"meta": {
"index": "terms_1716263798",
"site": "science",
"id": "40",
"found": true
},
"relationships": {},
"featImg": null,
"name": "News",
"description": null,
"taxonomy": "category",
"headData": {
"twImgId": null,
"twTitle": null,
"ogTitle": null,
"ogImgId": null,
"twDescription": null,
"description": null,
"title": "News Archives | KQED Science",
"ogDescription": null
},
"ttid": 42,
"slug": "news",
"isLoading": false,
"link": "/science/category/news"
}
},
"userPermissionsReducer": {
"wpLoggedIn": false
},
"eventsReducer": {},
"fssReducer": {},
"tvDailyScheduleReducer": {},
"tvWeeklyScheduleReducer": {},
"tvPrimetimeScheduleReducer": {},
"tvMonthlyScheduleReducer": {},
"userAccountReducer": {
"user": {
"email": null,
"emailStatus": "EMAIL_UNVALIDATED",
"loggedStatus": "LOGGED_OUT",
"loggingChecked": false,
"articles": [],
"firstName": null,
"lastName": null,
"phoneNumber": null,
"fetchingMembership": false,
"membershipError": false,
"memberships": [
{
"id": null,
"startDate": null,
"firstName": null,
"lastName": null,
"familyNumber": null,
"memberNumber": null,
"memberSince": null,
"expirationDate": null,
"pfsEligible": false,
"isSustaining": false,
"membershipLevel": "Prospect",
"membershipStatus": "Non Member",
"lastGiftDate": null,
"renewalDate": null,
"lastDonationAmount": null
}
]
},
"authModal": {
"isOpen": false,
"view": "LANDING_VIEW"
},
"error": null
},
"youthMediaReducer": {},
"checkPleaseReducer": {
"filterData": {
"region": {
"key": "Restaurant Region",
"filters": [
"Any Region"
]
},
"cuisine": {
"key": "Restaurant Cuisine",
"filters": [
"Any Cuisine"
]
}
},
"restaurantDataById": {},
"restaurantIdsSorted": [],
"error": null
},
"userAgentReducer": {
"userAgent": "Mozilla/5.0 AppleWebKit/537.36 (KHTML, like Gecko; compatible; ClaudeBot/1.0; +claudebot@anthropic.com)",
"isBot": true
}
}