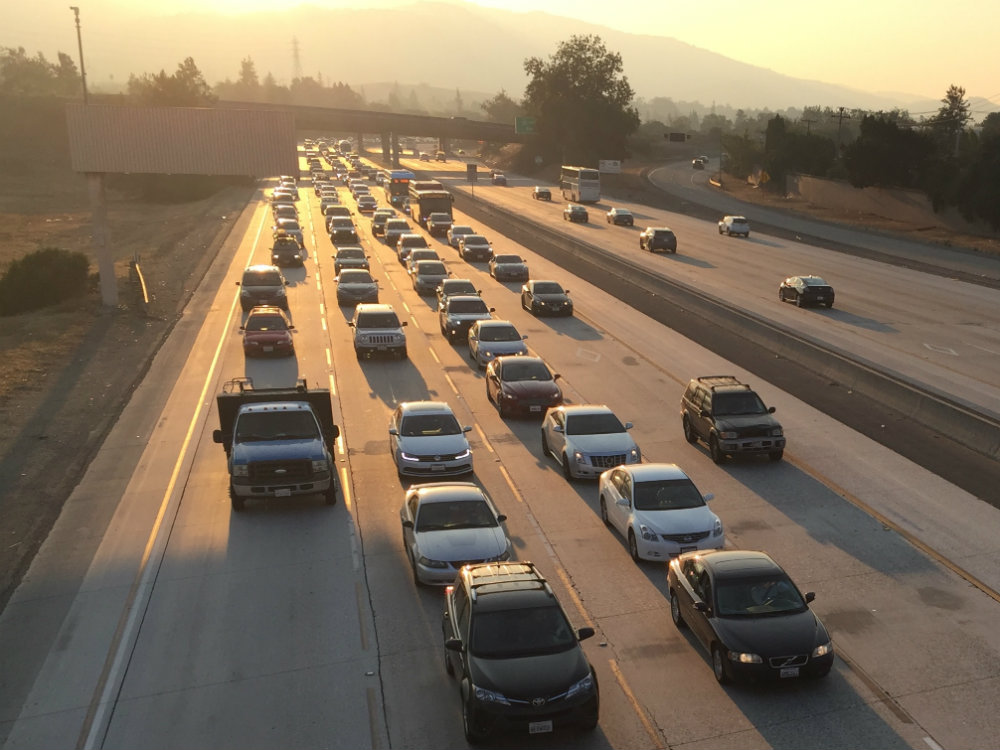
On Oct. 13, 2017, during the North Bay fires, cars slow during rush hour traffic on Highway 280 in Cupertino. Haze from the fires is visible in the air. (Isha Salian/Peninsula Press)
California Tackles Air Pollution Disparities With Data, Policy Efforts
Startups and California government agencies are working to improve data collection on air quality statewide, while policymakers in the Bay Area attempt to close the disparity in pollution levels between wealthy and disadvantaged communities. But as they do so, future wildfires like those that tore through the North Bay in 2017 threaten to set back the state's efforts to clean up the air.
As the North Bay fires burned more than 100,000 acres over the course of a few weeks last October, 100 miles south, in Santa Clara, Sutter Health pediatrician Manisha Panchal was stunned at the number of patients coming to her with coughs and bronchospasms — even children who had never wheezed before.
During the fires, the entire Bay Area got a taste of what it’s like to walk around during a high pollution day in Beijing, China. The fires released as much pollution into the air as a full year of cars on California roads.
But on a typical day, air quality is not top of mind for most locals.
“It comes out when there’s the wildfires,” said Panchal, “and then it goes away, and people forget.”
As climate change continues, wildfires could become the “new normal” for California, Gov. Jerry Brown warned last year. Despite the strides California policymakers have made to reduce emissions, this natural phenomenon will contribute to climate change and short-term air pollution. However, it’s not the only concern state officials have about air quality.
While California holds a reputation as a leader in environmental policy, it still ranks worst out of all 50 states for average public exposure to particulate matter pollution — tiny particles measured in microns, a millionth of a meter — largely due to the state’s topography and population density. California is also home to seven of the 10 U.S. metropolitan areas with the highest short-term levels of particle pollution. In 2018, the Bay Area ranked sixth on the list, above the notoriously polluted Los Angeles-Long Beach area.
And though overall air quality statewide is improving, there are communities where pollution levels are the same or worse, University of Southern California lung health expert Ed Avol said. Startups and local air districts are working to reduce this disparity in the air people breathe, but they face several challenges to do so.
Understanding air quality at a hyperlocal level is a problem for both local residents and public officials. Data monitoring stations are spaced far apart, taking regional air measurements that differ drastically from what an individual may be actually breathing at any given time. As population and traffic congestion in the Bay Area grow, existing infrastructure keeps many local schools and athletic facilities a stone’s throw from emissions-heavy freeway routes. And as has been well-documented, low-income areas and communities of color face stronger impacts from polluted air.
“They get overexposed because we can afford to live in a more desirable place, and this becomes an issue of environmental justice, environmental racism,” said Avol.
To be sure, air quality in many areas around the world is far worse than it is in the Bay Area. Cities like Beijing and New Delhi rank far higher in pollution measures on a daily basis. But the issue is worth working on locally because today’s levels still produce negative health effects, researchers say, particularly for disadvantaged populations.
Filling in the Data Gap
On an average day, a Bay Area resident who looks at the Environmental Protection Agency’s AirNow air quality website sees nothing to be concerned about. However, startups taking a closer look find pollution can vary greatly from neighborhood to neighborhood.
San Francisco-based Aclima is a startup that says it’s “filling in the pixels” on air pollution data by collecting street-level measurements. Aclima works with companies like Google and researchers and public agencies like the EPA to measure air quality. The company drove two Google Street View cars, mounted with an air monitoring sensor the size of two shoeboxes, more than 100,000 miles across California. The sensors collected a billion data points over two years, according to vice president of communications Kim Hunter.
Sensors on the roof of the Bay Area air district’s San Pablo monitoring station connect to equipment in a laboratory below. (Isha Salian/Peninsula Press)
The company’s street-by-street visualization of Oakland shows hot spots of pollutants near the Port of Oakland, as well as on Interstate 880 and other major roads. Pollution can increase by five to eight times from one end of a block to another, said the company’s chief scientist Melissa Lunden.
These variations can depend on factors less obvious than proximity to roadways or factories. Subtle features can make a difference, like wind patterns, the presence of trees between roads and residences and whether freeways are at ground level or elevated. Aclima says its granular data could help buildings and cities make informed decisions about emissions exposure.
Recent advances in sensor technology allow startups to develop cheaper, portable devices that could allow monitoring agencies to expand their data collection, said Lunden. The sensor Aclima is developing costs “100 to 1,000” times less than the equipment currently used by researchers and officials.
Installing a full Bay Area Air Quality Management District monitoring station costs around $250,000 and require more than half a full-time employee’s work hours to operate, said Eric Stevenson, the district’s director of meteorology and measurements. Since it’s such a large investment, he said the district sites most stations to represent very large geographical areas.
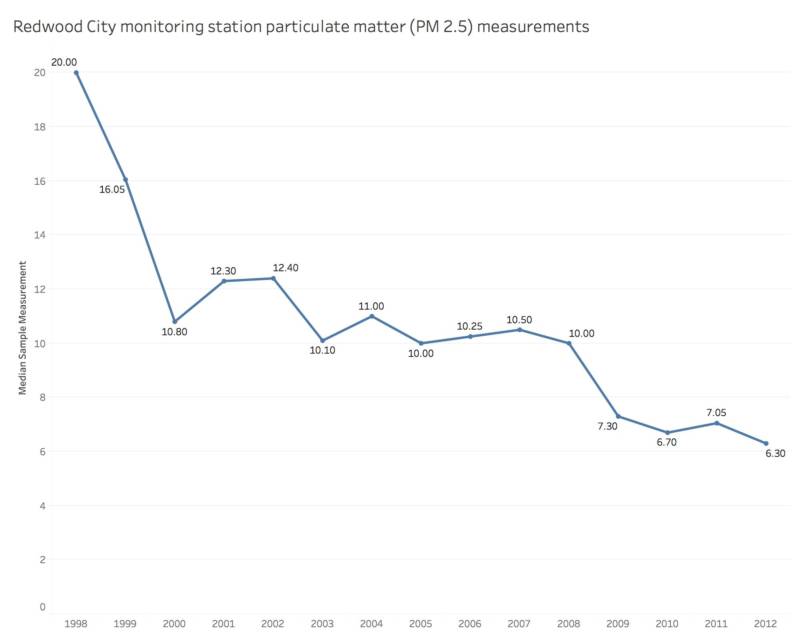
The district currently runs 33 air monitoring stations in the region to measure ambient air quality for that area. Just four of the seven stations between Redwood City and Gilroy measure particulate matter.
A line graph showing the reduction in particulate matter pollution in Redwood City between 1998 and 2012. The median PM 2.5 reading in 1998 was 20 micrograms per cubic meter. In 2012, it was down to 6. Data from the Environmental Protection Agency’s Air Quality System Data Mart. (Isha Salian/Peninsula Press)
“I think it’s a failing of the air districts, and the state government, which doesn’t require the air districts to do more,” said Bill Magavern, policy director at the Coalition for Clean Air.
Magavern says the air monitoring network does what’s required to comply with EPA rules about pollutant reporting, but this level of monitoring does not capture important neighborhood-level data.
His coalition has begun a project to install cheaper, portable monitors at schools and residences in the Los Angeles area. Once communities and government officials have a better understanding of hyperlocal air data, they can begin taking action to mitigate pollution.
California is now making strides to collect this kind of data on more narrow pockets of the state.
The aim: for all residents to be breathing the same quality air.
Getting Down to the Neighborhood Level
Growing up in Bell Gardens, a city in Los Angeles County, state Assemblywoman Cristina Garcia saw truck and freight traffic from the Port of Long Beach go by every day, spewing pollution into the air. Six freeways and a rail yard “choke my community,” she said.
Garcia noticed that districts like hers — working-class areas, communities of color, were often located in regions with poorer air quality. This experience prompted Garcia to take up the cause of environmental justice as a state legislator.
“My community has been treated like a wasteland,” she said. Garcia always heard that as the environment of California improved overall, her district would catch up, too. But she wasn’t seeing the results: “We’ve been calling it trickle-down environmentalism for a few years now.”
So Garcia proposed Assembly Bill 617, a regulation that mandates local air districts identify disadvantaged communities in each region for closer monitoring. The districts must then implement action plans to decrease pollution in those specific areas.
The bill passed last year, and local air districts had to submit a draft description of the first target communities by April 30. Garcia said she expects some positive results in air quality by 2023.
For now, the Bay Area air district is looking primarily at West Oakland as a site for action plans to reduce emissions, and at Richmond as a site for additional air monitoring. The Port of Oakland and highway traffic are major emitters for the region.
“The important thing is that we protect the health of every resident of the Bay Area,” Stevenson said. “No one else is doing this — no one else in the country.”
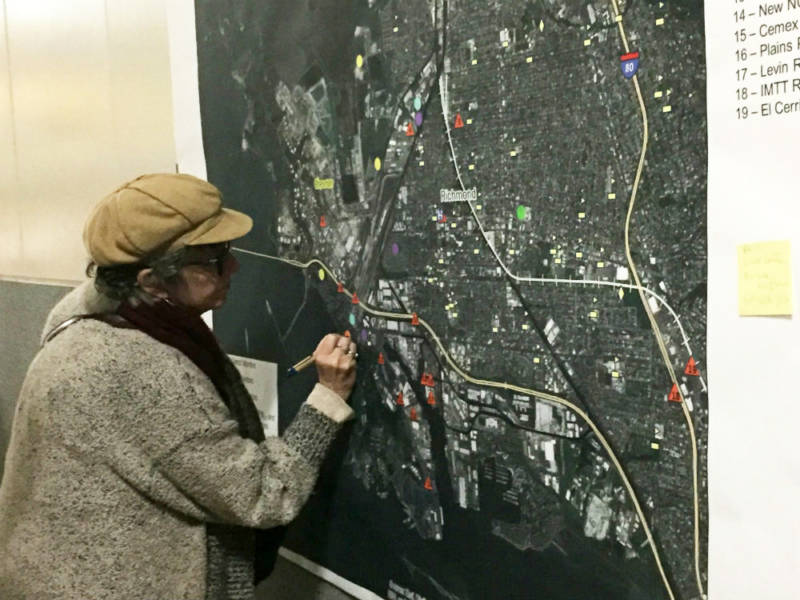
At an air district event, Point Richmond resident Lori Goldwin marks a potential site for community air monitoring. (Isha Salian/Peninsula Press)
On a recent Wednesday night in Richmond, around 60 community members gathered to discuss the air district’s plans for additional air monitoring in the city. The air district responded to community concerns about whether monitoring data would be easily accessible online, and that the data would lead to action.
“These are human rights violations when you’re talking about disproportionate impact,” Henry Clark, executive director of the advocacy group West County Toxics Coalition, at the meeting.
In an effort to include local residents in the monitoring process, the air district asked attendees to suggest potential sites for placing new air monitors. They could out fill a form online, or place a neon sticker on a large map of Richmond pinned to the wall.
“I put a dot where I live at the top of the hill,” said attendee Lori Goldwin, a resident of Point Richmond. In the past six months, she’s started to notice odors from polluted air in her neighborhood.
“Maybe I’ll be run out of town by this,” she said. “I don’t want to move, but I could move.”
Rethinking School Design
Children are more vulnerable to irritation from traffic and air pollution because their lungs are still developing, said Avol. And while children are exposed to air pollution at home, another major factor is the location of their schools. California Air Resources Board lung researcher Barbara Weller said even in Bay Area, where overall pollution is fairly low, having schools near traffic is associated with increased wheeze in children.
A 2003 California guideline recommends that no new schools should be built within 500 feet of a major road or freeway. But while “it’s wonderful that new schools are sited away from traffic … a lot of schools were already built,” Weller said. California has more than 1,000 active public schools located within 500 feet of major roads – a third of which opened in 2004 or later, an analysis of data collected by the Center for Public Integrity shows.
Dr. Panchal’s children attend one of those schools – Bullis Charter School in Los Altos, opened in 2004. She says the lunch tables are located right next to San Antonio Road, separated by a fence. “Why would they put the tables there?” she said. “For that one hour the kids are just breathing these particles.”
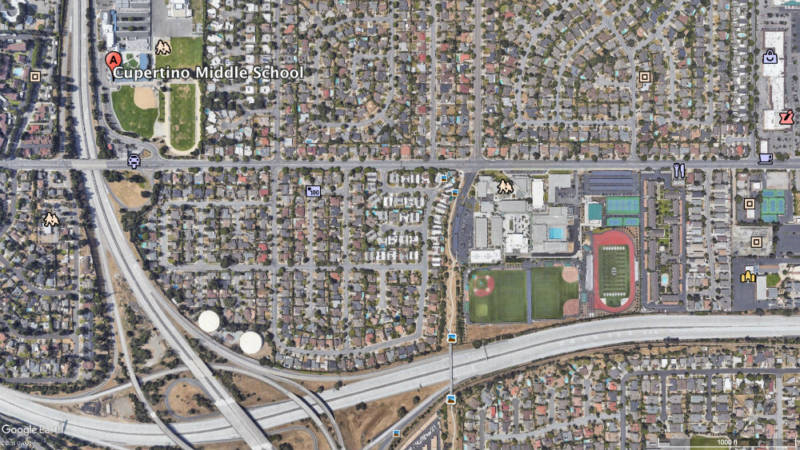
Cupertino Middle School (upper left) is located within 500 feet of Highway 85. Neighboring Homestead High School’s playing fields directly border Interstate 280. The average annual daily vehicles on the interstate in Sunnyvale jumped from 85,000 in 1993 to 120,000 in 2016. (Isha Salian/Peninsula Press)
The air resources board says the layout of the campus makes a difference for students’ exposure levels to polluted air. Weller recommends moving playgrounds, fields and other outdoor areas further from roads as a solution to lessen the health impacts of vehicle emissions. Parking lots or enclosed areas could border the road instead, Avol said.
“We should not be thinking, ‘If we get to this one level everything will be fine,’” said Avol. “There is no threshold, there is no safe line.”
lower waypointnext waypoint
Player sponsored by
window.__IS_SSR__=true
window.__INITIAL_STATE__={
"attachmentsReducer": {
"audio_0": {
"type": "attachments",
"id": "audio_0",
"imgSizes": {
"kqedFullSize": {
"file": "https://ww2.kqed.org/news/wp-content/themes/KQED-unified/img/audio_bgs/background0.jpg"
}
}
},
"audio_1": {
"type": "attachments",
"id": "audio_1",
"imgSizes": {
"kqedFullSize": {
"file": "https://ww2.kqed.org/news/wp-content/themes/KQED-unified/img/audio_bgs/background1.jpg"
}
}
},
"audio_2": {
"type": "attachments",
"id": "audio_2",
"imgSizes": {
"kqedFullSize": {
"file": "https://ww2.kqed.org/news/wp-content/themes/KQED-unified/img/audio_bgs/background2.jpg"
}
}
},
"audio_3": {
"type": "attachments",
"id": "audio_3",
"imgSizes": {
"kqedFullSize": {
"file": "https://ww2.kqed.org/news/wp-content/themes/KQED-unified/img/audio_bgs/background3.jpg"
}
}
},
"audio_4": {
"type": "attachments",
"id": "audio_4",
"imgSizes": {
"kqedFullSize": {
"file": "https://ww2.kqed.org/news/wp-content/themes/KQED-unified/img/audio_bgs/background4.jpg"
}
}
},
"placeholder": {
"type": "attachments",
"id": "placeholder",
"imgSizes": {
"thumbnail": {
"file": "https://cdn.kqed.org/wp-content/uploads/2024/12/KQED-Default-Image-816638274-2000x1333-1-160x107.jpg",
"width": 160,
"height": 107,
"mimeType": "image/jpeg"
},
"medium": {
"file": "https://cdn.kqed.org/wp-content/uploads/2024/12/KQED-Default-Image-816638274-2000x1333-1-800x533.jpg",
"width": 800,
"height": 533,
"mimeType": "image/jpeg"
},
"medium_large": {
"file": "https://cdn.kqed.org/wp-content/uploads/2024/12/KQED-Default-Image-816638274-2000x1333-1-768x512.jpg",
"width": 768,
"height": 512,
"mimeType": "image/jpeg"
},
"large": {
"file": "https://cdn.kqed.org/wp-content/uploads/2024/12/KQED-Default-Image-816638274-2000x1333-1-1020x680.jpg",
"width": 1020,
"height": 680,
"mimeType": "image/jpeg"
},
"1536x1536": {
"file": "https://cdn.kqed.org/wp-content/uploads/2024/12/KQED-Default-Image-816638274-2000x1333-1-1536x1024.jpg",
"width": 1536,
"height": 1024,
"mimeType": "image/jpeg"
},
"fd-lrg": {
"file": "https://cdn.kqed.org/wp-content/uploads/2024/12/KQED-Default-Image-816638274-2000x1333-1-1536x1024.jpg",
"width": 1536,
"height": 1024,
"mimeType": "image/jpeg"
},
"fd-med": {
"file": "https://cdn.kqed.org/wp-content/uploads/2024/12/KQED-Default-Image-816638274-2000x1333-1-1020x680.jpg",
"width": 1020,
"height": 680,
"mimeType": "image/jpeg"
},
"fd-sm": {
"file": "https://cdn.kqed.org/wp-content/uploads/2024/12/KQED-Default-Image-816638274-2000x1333-1-800x533.jpg",
"width": 800,
"height": 533,
"mimeType": "image/jpeg"
},
"post-thumbnail": {
"file": "https://cdn.kqed.org/wp-content/uploads/2024/12/KQED-Default-Image-816638274-2000x1333-1-672x372.jpg",
"width": 672,
"height": 372,
"mimeType": "image/jpeg"
},
"twentyfourteen-full-width": {
"file": "https://cdn.kqed.org/wp-content/uploads/2024/12/KQED-Default-Image-816638274-2000x1333-1-1038x576.jpg",
"width": 1038,
"height": 576,
"mimeType": "image/jpeg"
},
"xxsmall": {
"file": "https://cdn.kqed.org/wp-content/uploads/2024/12/KQED-Default-Image-816638274-2000x1333-1-160x107.jpg",
"width": 160,
"height": 107,
"mimeType": "image/jpeg"
},
"xsmall": {
"file": "https://cdn.kqed.org/wp-content/uploads/2024/12/KQED-Default-Image-816638274-2000x1333-1-672x372.jpg",
"width": 672,
"height": 372,
"mimeType": "image/jpeg"
},
"small": {
"file": "https://cdn.kqed.org/wp-content/uploads/2024/12/KQED-Default-Image-816638274-2000x1333-1-672x372.jpg",
"width": 672,
"height": 372,
"mimeType": "image/jpeg"
},
"xlarge": {
"file": "https://cdn.kqed.org/wp-content/uploads/2024/12/KQED-Default-Image-816638274-2000x1333-1-1020x680.jpg",
"width": 1020,
"height": 680,
"mimeType": "image/jpeg"
},
"full-width": {
"file": "https://cdn.kqed.org/wp-content/uploads/2024/12/KQED-Default-Image-816638274-2000x1333-1-1920x1280.jpg",
"width": 1920,
"height": 1280,
"mimeType": "image/jpeg"
},
"guest-author-32": {
"file": "https://cdn.kqed.org/wp-content/uploads/2025/01/KQED-Default-Image-816638274-1333x1333-1-160x160.jpg",
"width": 32,
"height": 32,
"mimeType": "image/jpeg"
},
"guest-author-50": {
"file": "https://cdn.kqed.org/wp-content/uploads/2025/01/KQED-Default-Image-816638274-1333x1333-1-160x160.jpg",
"width": 50,
"height": 50,
"mimeType": "image/jpeg"
},
"guest-author-64": {
"file": "https://cdn.kqed.org/wp-content/uploads/2025/01/KQED-Default-Image-816638274-1333x1333-1-160x160.jpg",
"width": 64,
"height": 64,
"mimeType": "image/jpeg"
},
"guest-author-96": {
"file": "https://cdn.kqed.org/wp-content/uploads/2025/01/KQED-Default-Image-816638274-1333x1333-1-160x160.jpg",
"width": 96,
"height": 96,
"mimeType": "image/jpeg"
},
"guest-author-128": {
"file": "https://cdn.kqed.org/wp-content/uploads/2025/01/KQED-Default-Image-816638274-1333x1333-1-160x160.jpg",
"width": 128,
"height": 128,
"mimeType": "image/jpeg"
},
"detail": {
"file": "https://cdn.kqed.org/wp-content/uploads/2025/01/KQED-Default-Image-816638274-1333x1333-1-160x160.jpg",
"width": 160,
"height": 160,
"mimeType": "image/jpeg"
},
"kqedFullSize": {
"file": "https://cdn.kqed.org/wp-content/uploads/2024/12/KQED-Default-Image-816638274-2000x1333-1.jpg",
"width": 2000,
"height": 1333
}
}
},
"news_11666474": {
"type": "attachments",
"id": "news_11666474",
"meta": {
"index": "attachments_1716263798",
"site": "news",
"id": "11666474",
"found": true
},
"parent": 0,
"imgSizes": {
"small": {
"file": "https://ww2.kqed.org/app/uploads/sites/10/2018/05/RushHour-520x390.jpg",
"width": 520,
"mimeType": "image/jpeg",
"height": 390
},
"twentyfourteen-full-width": {
"file": "https://ww2.kqed.org/app/uploads/sites/10/2018/05/RushHour-1000x576.jpg",
"width": 1000,
"mimeType": "image/jpeg",
"height": 576
},
"thumbnail": {
"file": "https://ww2.kqed.org/app/uploads/sites/10/2018/05/RushHour-160x120.jpg",
"width": 160,
"mimeType": "image/jpeg",
"height": 120
},
"fd-sm": {
"file": "https://ww2.kqed.org/app/uploads/sites/10/2018/05/RushHour-960x720.jpg",
"width": 960,
"mimeType": "image/jpeg",
"height": 720
},
"post-thumbnail": {
"file": "https://ww2.kqed.org/app/uploads/sites/10/2018/05/RushHour-672x372.jpg",
"width": 672,
"mimeType": "image/jpeg",
"height": 372
},
"xsmall": {
"file": "https://ww2.kqed.org/app/uploads/sites/10/2018/05/RushHour-375x281.jpg",
"width": 375,
"mimeType": "image/jpeg",
"height": 281
},
"kqedFullSize": {
"file": "https://ww2.kqed.org/app/uploads/sites/10/2018/05/RushHour.jpg",
"width": 1000,
"height": 750
},
"guest-author-50": {
"file": "https://ww2.kqed.org/app/uploads/sites/10/2018/05/RushHour-50x50.jpg",
"width": 50,
"mimeType": "image/jpeg",
"height": 50
},
"guest-author-96": {
"file": "https://ww2.kqed.org/app/uploads/sites/10/2018/05/RushHour-96x96.jpg",
"width": 96,
"mimeType": "image/jpeg",
"height": 96
},
"medium": {
"file": "https://ww2.kqed.org/app/uploads/sites/10/2018/05/RushHour-800x600.jpg",
"width": 800,
"mimeType": "image/jpeg",
"height": 600
},
"guest-author-64": {
"file": "https://ww2.kqed.org/app/uploads/sites/10/2018/05/RushHour-64x64.jpg",
"width": 64,
"mimeType": "image/jpeg",
"height": 64
},
"guest-author-32": {
"file": "https://ww2.kqed.org/app/uploads/sites/10/2018/05/RushHour-32x32.jpg",
"width": 32,
"mimeType": "image/jpeg",
"height": 32
},
"detail": {
"file": "https://ww2.kqed.org/app/uploads/sites/10/2018/05/RushHour-150x150.jpg",
"width": 150,
"mimeType": "image/jpeg",
"height": 150
},
"guest-author-128": {
"file": "https://ww2.kqed.org/app/uploads/sites/10/2018/05/RushHour-128x128.jpg",
"width": 128,
"mimeType": "image/jpeg",
"height": 128
},
"xxsmall": {
"file": "https://ww2.kqed.org/app/uploads/sites/10/2018/05/RushHour-240x180.jpg",
"width": 240,
"mimeType": "image/jpeg",
"height": 180
}
},
"publishDate": 1525457697,
"modified": 1525459205,
"caption": "On Oct. 13, 2017, during the North Bay fires, cars slow during rush hour traffic on Highway 280 in Cupertino. Haze from the fires is visible in the air. ",
"description": "On Oct. 13, 2017, during the North Bay fires, cars slow during rush hour traffic on Highway 280 in Cupertino. Haze from the fires is visible in the air. ",
"title": "Rush Hour on Highway 280",
"credit": "Isha Salian/Peninsula Press",
"status": "inherit",
"isLoading": false,
"fetchFailed": false
}
},
"audioPlayerReducer": {
"postId": "stream_live",
"isPaused": true,
"isPlaying": false,
"pfsActive": false,
"pledgeModalIsOpen": true,
"playerDrawerIsOpen": false,
"liveAudioPlayStartedAt": 0,
"liveAudioPlayContext": ""
},
"authorsReducer": {
"byline_news_11666412": {
"type": "authors",
"id": "byline_news_11666412",
"meta": {
"override": true
},
"slug": "byline_news_11666412",
"name": "\u003cstrong>Isha Salian\u003cbr/>\u003ca href=\"http://peninsulapress.com/author/ishasalian/\">Peninsula Press\u003c/strong>",
"isLoading": false
}
},
"pagesReducer": {},
"pfsSessionReducer": {},
"postsReducer": {
"stream_live": {
"type": "live",
"id": "stream_live",
"audioUrl": "https://streams.kqed.org/kqedradio",
"title": "Live Stream",
"excerpt": "Live Stream information currently unavailable.",
"link": "/radio",
"featImg": "",
"label": {
"name": "KQED Live",
"link": "/"
}
},
"stream_kqedNewscast": {
"type": "posts",
"id": "stream_kqedNewscast",
"audioUrl": "https://www.kqed.org/.stream/anon/radio/RDnews/newscast.mp3?_=1",
"title": "KQED Newscast",
"featImg": "",
"label": {
"name": "88.5 FM",
"link": "/"
}
},
"news_11666412": {
"type": "posts",
"id": "news_11666412",
"meta": {
"index": "posts_1716263798",
"site": "news",
"id": "11666412",
"found": true
},
"articlePosition": 0,
"guestAuthors": [],
"slug": "california-tackles-air-pollution-disparities-with-data-policy-efforts",
"title": "California Tackles Air Pollution Disparities With Data, Policy Efforts",
"publishDate": 1525466373,
"format": "image",
"headTitle": "California Tackles Air Pollution Disparities With Data, Policy Efforts | KQED",
"labelTerm": {},
"content": "\u003cp>As the North Bay fires burned more than 100,000 acres over the course of a few weeks last October, 100 miles south, in Santa Clara, Sutter Health pediatrician Manisha Panchal was stunned at the number of patients coming to her with coughs and bronchospasms — even children who had never wheezed before.\u003c/p>\n\u003cp>During the fires, the entire Bay Area got a taste of what it’s like to walk around during a high pollution day in Beijing, China. The fires released as much pollution into the air as a full year of cars on California roads.\u003c/p>\n\u003cp>But on a typical day, air quality is not top of mind for most locals.\u003c/p>\n\u003cp>“It comes out when there’s the wildfires,” said Panchal, “and then it goes away, and people forget.”\u003c/p>\n\u003cp>As climate change continues, wildfires could become the “new normal” for California, Gov. Jerry Brown warned last year. Despite the strides California policymakers have made to reduce emissions, this natural phenomenon will contribute to climate change and short-term air pollution. However, it’s not the only concern state officials have about air quality.\u003c/p>\n\u003cp>[ad fullwidth]\u003c/p>\n\u003cp>While California holds a reputation as a leader in environmental policy, it \u003ca href=\"https://www.americashealthrankings.org/explore/annual/measure/air/state/ALL\">still ranks\u003c/a> worst out of all 50 states for average public exposure to particulate matter pollution — tiny particles measured in microns, a millionth of a meter — largely due to the state’s topography and population density. California is also home to seven of the 10 U.S. metropolitan areas with the highest short-term levels of particle pollution. In 2018, the Bay Area ranked \u003ca href=\"http://www.lung.org/our-initiatives/healthy-air/sota/city-rankings/most-polluted-cities.html\">sixth\u003c/a> on the list, above the notoriously polluted Los Angeles-Long Beach area.\u003c/p>\n\u003cp>And though overall air quality statewide is improving, there are communities where pollution levels are the same or worse, University of Southern California lung health expert Ed Avol said. Startups and local air districts are working to reduce this disparity in the air people breathe, but they face several challenges to do so.\u003c/p>\n\u003cp>Understanding air quality at a hyperlocal level is a problem for both local residents and public officials. Data monitoring stations are spaced far apart, taking regional air measurements that differ drastically from what an individual may be actually breathing at any given time. As population and traffic congestion in the Bay Area grow, existing infrastructure keeps many local schools and athletic facilities a stone’s throw from emissions-heavy freeway routes. And as has been \u003ca href=\"http://www.lung.org/our-initiatives/healthy-air/outdoor/air-pollution/disparities.html\">well-documented\u003c/a>, low-income areas and communities of color face stronger impacts from polluted air.\u003c/p>\n\u003cp>“They get overexposed because we can afford to live in a more desirable place, and this becomes an issue of environmental justice, environmental racism,” said Avol.\u003c/p>\n\u003cp>To be sure, air quality in many areas around the world is far worse than it is in the Bay Area. Cities like Beijing and New Delhi rank far higher in pollution measures on a daily basis. But the issue is worth working on locally because today’s levels still produce negative health effects, researchers say, particularly for disadvantaged populations.\u003c/p>\n\u003cp>\u003cstrong>Filling in the Data Gap\u003c/strong>\u003c/p>\n\u003cp>On an average day, a Bay Area resident who looks at the Environmental Protection Agency’s \u003ca href=\"https://airnow.gov/index.cfm?action=airnow.local_city\">AirNow\u003c/a> air quality website sees nothing to be concerned about. However, startups taking a closer look find pollution can vary greatly from neighborhood to neighborhood.\u003c/p>\n\u003cp>San Francisco-based Aclima is a startup that says it’s “filling in the pixels” on air pollution data by collecting street-level measurements. Aclima works with companies like Google and researchers and public agencies like the EPA to measure air quality. The company drove two Google Street View cars, mounted with an air monitoring sensor the size of two shoeboxes, more than 100,000 miles across California. The sensors collected a billion data points over two years, according to vice president of communications Kim Hunter.\u003c/p>\n\u003cfigure id=\"attachment_11666468\" class=\"wp-caption alignright\" style=\"max-width: 800px\">\u003cimg loading=\"lazy\" decoding=\"async\" class=\"size-medium wp-image-11666468\" src=\"https://ww2.kqed.org/news/wp-content/uploads/sites/10/2018/05/AirMonitoringSensors-800x1066.jpg\" alt=\"Air monitoring equipment set up on a roof.\" width=\"800\" height=\"1066\">\u003cfigcaption class=\"wp-caption-text\">Sensors on the roof of the Bay Area air district’s San Pablo monitoring station connect to equipment in a laboratory below. \u003ccite>(Isha Salian/Peninsula Press)\u003c/cite>\u003c/figcaption>\u003c/figure>\n\u003cp>The company’s street-by-street visualization of Oakland shows hot spots of pollutants near the Port of Oakland, as well as on Interstate 880 and other major roads. Pollution can \u003ca href=\"https://blog.aclima.io/how-traffic-affects-your-short-term-pollution-exposure-a3b6bae8b71b\">increase\u003c/a> by five to eight times from one end of a block to another, said the company’s chief scientist Melissa Lunden.\u003c/p>\n\u003cp>These variations can depend on factors less obvious than proximity to roadways or factories. Subtle features can make a difference, like wind patterns, the presence of trees between roads and residences and whether freeways are at ground level or elevated. Aclima says its granular data could help buildings and cities make informed decisions about emissions exposure.\u003c/p>\n\u003cp>Recent advances in sensor technology allow startups to develop cheaper, portable devices that could allow monitoring agencies to expand their data collection, said Lunden. The sensor Aclima is developing costs “100 to 1,000” times less than the equipment currently used by researchers and officials.\u003c/p>\n\u003cp>Installing a full Bay Area Air Quality Management District monitoring station costs around $250,000 and require more than half a full-time employee’s work hours to operate, said Eric Stevenson, the district’s director of meteorology and measurements. Since it’s such a large investment, he said the district sites most stations to represent very large geographical areas.\u003c/p>\n\u003cp>The district currently runs 33 air monitoring stations in the region to measure ambient air quality for that area. Just four of the seven stations between Redwood City and Gilroy measure particulate matter.\u003c/p>\n\u003cfigure id=\"attachment_11666472\" class=\"wp-caption aligncenter\" style=\"max-width: 800px\">\u003cimg loading=\"lazy\" decoding=\"async\" class=\"size-medium wp-image-11666472\" src=\"https://ww2.kqed.org/news/wp-content/uploads/sites/10/2018/05/Redwood-city-air-data-by-year-800x640.jpg\" alt=\"A line chart of particulate matter in Redwood City\" width=\"800\" height=\"640\" srcset=\"https://cdn.kqed.org/wp-content/uploads/sites/10/2018/05/Redwood-city-air-data-by-year-800x640.jpg 800w, https://cdn.kqed.org/wp-content/uploads/sites/10/2018/05/Redwood-city-air-data-by-year-160x128.jpg 160w, https://cdn.kqed.org/wp-content/uploads/sites/10/2018/05/Redwood-city-air-data-by-year-1020x816.jpg 1020w, https://cdn.kqed.org/wp-content/uploads/sites/10/2018/05/Redwood-city-air-data-by-year-1200x960.jpg 1200w, https://cdn.kqed.org/wp-content/uploads/sites/10/2018/05/Redwood-city-air-data-by-year-1920x1536.jpg 1920w, https://cdn.kqed.org/wp-content/uploads/sites/10/2018/05/Redwood-city-air-data-by-year-1180x944.jpg 1180w, https://cdn.kqed.org/wp-content/uploads/sites/10/2018/05/Redwood-city-air-data-by-year-960x768.jpg 960w, https://cdn.kqed.org/wp-content/uploads/sites/10/2018/05/Redwood-city-air-data-by-year-240x192.jpg 240w, https://cdn.kqed.org/wp-content/uploads/sites/10/2018/05/Redwood-city-air-data-by-year-375x300.jpg 375w, https://cdn.kqed.org/wp-content/uploads/sites/10/2018/05/Redwood-city-air-data-by-year-520x416.jpg 520w, https://cdn.kqed.org/wp-content/uploads/sites/10/2018/05/Redwood-city-air-data-by-year.jpg 2000w\" sizes=\"(max-width: 800px) 100vw, 800px\">\u003cfigcaption class=\"wp-caption-text\">A line graph showing the reduction in particulate matter pollution in Redwood City between 1998 and 2012. The median PM 2.5 reading in 1998 was 20 micrograms per cubic meter. In 2012, it was down to 6. Data from the Environmental Protection Agency’s Air Quality System Data Mart. \u003ccite>(Isha Salian/Peninsula Press)\u003c/cite>\u003c/figcaption>\u003c/figure>\n\u003cp>“I think it’s a failing of the air districts, and the state government, which doesn’t require the air districts to do more,” said Bill Magavern, policy director at the Coalition for Clean Air.\u003c/p>\n\u003cp>Magavern says the air monitoring network does what’s required to comply with EPA rules about pollutant reporting, but this level of monitoring does not capture important neighborhood-level data.\u003c/p>\n\u003cp>His coalition has begun a project to install cheaper, portable monitors at schools and residences in the Los Angeles area. Once communities and government officials have a better understanding of hyperlocal air data, they can begin taking action to mitigate pollution.\u003c/p>\n\u003cp>California is now making strides to collect this kind of data on more narrow pockets of the state.\u003c/p>\n\u003cp>The aim: for all residents to be breathing the same quality air.\u003c/p>\n\u003cp>\u003cstrong>Getting Down to the Neighborhood Level\u003c/strong>\u003c/p>\n\u003cp>Growing up in Bell Gardens, a city in Los Angeles County, state Assemblywoman Cristina Garcia saw truck and freight traffic from the Port of Long Beach go by every day, spewing pollution into the air. Six freeways and a rail yard “choke my community,” she said.\u003c/p>\n\u003cp>Garcia noticed that districts like hers — working-class areas, communities of color, were often located in regions with poorer air quality. This experience prompted Garcia to take up the cause of environmental justice as a state legislator.\u003c/p>\n\u003cp>“My community has been treated like a wasteland,” she said. Garcia always heard that as the environment of California improved overall, her district would catch up, too. But she wasn’t seeing the results: “We’ve been calling it trickle-down environmentalism for a few years now.”\u003c/p>\n\u003cp>So Garcia proposed Assembly Bill 617, a regulation that mandates local air districts identify disadvantaged communities in each region for closer monitoring. The districts must then implement action plans to decrease pollution in those specific areas.\u003c/p>\n\u003cp>The bill passed last year, and local air districts had to submit a draft description of the first target communities by April 30. Garcia said she expects some positive results in air quality by 2023.\u003c/p>\n\u003cp>For now, the Bay Area air district is looking primarily at West Oakland as a site for action plans to reduce emissions, and at Richmond as a site for additional air monitoring. The Port of Oakland and highway traffic are major emitters for the region.\u003c/p>\n\u003cp>“The important thing is that we protect the health of every resident of the Bay Area,” Stevenson said. “No one else is doing this — no one else in the country.”\u003c/p>\n\u003cfigure id=\"attachment_11666473\" class=\"wp-caption alignleft\" style=\"max-width: 800px\">\u003cimg loading=\"lazy\" decoding=\"async\" class=\"size-medium wp-image-11666473\" src=\"https://ww2.kqed.org/news/wp-content/uploads/sites/10/2018/05/Richmond-800x600.jpg\" alt=\"A woman marking up a map for air monitoring.\" width=\"800\" height=\"600\" srcset=\"https://cdn.kqed.org/wp-content/uploads/sites/10/2018/05/Richmond-800x600.jpg 800w, https://cdn.kqed.org/wp-content/uploads/sites/10/2018/05/Richmond-160x120.jpg 160w, https://cdn.kqed.org/wp-content/uploads/sites/10/2018/05/Richmond-960x720.jpg 960w, https://cdn.kqed.org/wp-content/uploads/sites/10/2018/05/Richmond-240x180.jpg 240w, https://cdn.kqed.org/wp-content/uploads/sites/10/2018/05/Richmond-375x281.jpg 375w, https://cdn.kqed.org/wp-content/uploads/sites/10/2018/05/Richmond-520x390.jpg 520w, https://cdn.kqed.org/wp-content/uploads/sites/10/2018/05/Richmond.jpg 1000w\" sizes=\"(max-width: 800px) 100vw, 800px\">\u003cfigcaption class=\"wp-caption-text\">At an air district event, Point Richmond resident Lori Goldwin marks a potential site for community air monitoring. \u003ccite>(Isha Salian/Peninsula Press)\u003c/cite>\u003c/figcaption>\u003c/figure>\n\u003cp>On a recent Wednesday night in Richmond, around 60 community members gathered to discuss the air district’s plans for additional air monitoring in the city. The air district responded to community concerns about whether monitoring data would be easily accessible online, and that the data would lead to action.\u003c/p>\n\u003cp>“These are human rights violations when you’re talking about disproportionate impact,” Henry Clark, executive director of the advocacy group West County Toxics Coalition, at the meeting.\u003c/p>\n\u003cp>In an effort to include local residents in the monitoring process, the air district asked attendees to suggest potential sites for placing new air monitors. They could out fill a form online, or place a neon sticker on a large map of Richmond pinned to the wall.\u003c/p>\n\u003cp>“I put a dot where I live at the top of the hill,” said attendee Lori Goldwin, a resident of Point Richmond. In the past six months, she’s started to notice odors from polluted air in her neighborhood.\u003c/p>\n\u003cp>“Maybe I’ll be run out of town by this,” she said. “I don’t want to move, but I could move.”\u003c/p>\n\u003cp>\u003cstrong>Rethinking School Design\u003c/strong>\u003c/p>\n\u003cp>Children are more vulnerable to irritation from traffic and air pollution because their lungs are still developing, said Avol. And while children are exposed to air pollution at home, another major factor is the location of their schools. California Air Resources Board lung researcher Barbara Weller said even in Bay Area, where overall pollution is fairly low, having schools near traffic is associated with increased wheeze in children.\u003c/p>\n\u003cp>These schools are more prevalent in disadvantaged communities. Statewide, 58.7 percent of students were eligible for free or reduced-price school lunches during the 2014-2015 school year. \u003ca href=\"https://public.tableau.com/profile/marnette.federis#!/vizhome/Schoolsfrpmmap1/Dashboard1\" rel=\"noopener\" target=\"_blank\">For schools located within 500 feet of major roads, that figure jumps to 67.2 percent.\u003c/a>\u003c/p>\n\u003cp>A 2003 California guideline \u003ca href=\"https://leginfo.legislature.ca.gov/faces/billCompareClient.xhtml?bill_id=200320040SB352\">recommends\u003c/a> that no new schools should be built within 500 feet of a major road or freeway. But while “it’s wonderful that new schools are sited away from traffic … a lot of schools were already built,” Weller said. California has more than 1,000 active public schools located within 500 feet of major roads – a third of which opened in 2004 or later, an analysis of data collected by the Center for Public Integrity shows.\u003c/p>\n\u003cp>Dr. Panchal’s children attend one of those schools – Bullis Charter School in Los Altos, opened in 2004. She says the lunch tables are located right next to San Antonio Road, separated by a fence. “Why would they put the tables there?” she said. “For that one hour the kids are just breathing these particles.”\u003c/p>\n\u003cfigure id=\"attachment_11666469\" class=\"wp-caption aligncenter\" style=\"max-width: 800px\">\u003cimg loading=\"lazy\" decoding=\"async\" class=\"size-medium wp-image-11666469\" src=\"https://ww2.kqed.org/news/wp-content/uploads/sites/10/2018/05/CupertinoMiddleHomesteadHigh-800x450.jpg\" alt=\"A Google map of Cupertino Middle School and Homestead High School and its location a few hundred feet away from the freeway.\" width=\"800\" height=\"450\">\u003cfigcaption class=\"wp-caption-text\">Cupertino Middle School (upper left) is located within 500 feet of Highway 85. Neighboring Homestead High School’s playing fields directly border Interstate 280. The average annual daily vehicles on the interstate in Sunnyvale jumped from 85,000 in 1993 to 120,000 in 2016. \u003ccite>(Isha Salian/Peninsula Press)\u003c/cite>\u003c/figcaption>\u003c/figure>\n\u003cp>The air resources board says the layout of the campus makes a difference for students’ exposure levels to polluted air. Weller recommends moving playgrounds, fields and other outdoor areas further from roads as a solution to lessen the health impacts of vehicle emissions. Parking lots or enclosed areas could border the road instead, Avol said.\u003c/p>\n\u003cp>[ad floatright]\u003c/p>\n\u003cp>“We should not be thinking, ‘If we get to this one level everything will be fine,’” said Avol. “There is no threshold, there is no safe line.”\u003c/p>\n\n",
"blocks": [],
"excerpt": "Startups and California government agencies are working to improve data collection on air quality statewide, while policymakers in the Bay Area attempt to close the disparity in pollution levels between wealthy and disadvantaged communities. But as they do so, future wildfires like those that tore through the North Bay in 2017 threaten to set back the state's efforts to clean up the air.",
"status": "publish",
"parent": 0,
"modified": 1726001428,
"stats": {
"hasAudio": false,
"hasVideo": false,
"hasChartOrMap": false,
"iframeSrcs": [],
"hasGoogleForm": false,
"hasGallery": false,
"hasHearkenModule": false,
"hasPolis": false,
"paragraphCount": 45,
"wordCount": 2052
},
"headData": {
"title": "California Tackles Air Pollution Disparities With Data, Policy Efforts | KQED",
"description": "Startups and California government agencies are working to improve data collection on air quality statewide, while policymakers in the Bay Area attempt to close the disparity in pollution levels between wealthy and disadvantaged communities. But as they do so, future wildfires like those that tore through the North Bay in 2017 threaten to set back the state's efforts to clean up the air.",
"ogTitle": "",
"ogDescription": "",
"ogImgId": "",
"twTitle": "",
"twDescription": "",
"twImgId": "",
"schema": {
"@context": "https://schema.org",
"@type": "NewsArticle",
"headline": "California Tackles Air Pollution Disparities With Data, Policy Efforts",
"datePublished": "2018-05-04T13:39:33-07:00",
"dateModified": "2024-09-10T13:50:28-07:00",
"image": "https://cdn.kqed.org/wp-content/uploads/2020/02/KQED-OG-Image@1x.png",
"isAccessibleForFree": "True",
"publisher": {
"@type": "NewsMediaOrganization",
"@id": "https://www.kqed.org/#organization",
"name": "KQED",
"logo": "https://cdn.kqed.org/wp-content/uploads/2020/02/KQED-OG-Image@1x.png",
"url": "https://www.kqed.org",
"sameAs": [
"https://www.facebook.com/KQED",
"https://twitter.com/KQED",
"https://www.instagram.com/kqed/",
"https://www.tiktok.com/@kqedofficial",
"https://www.linkedin.com/company/kqed",
"https://www.youtube.com/channel/UCeC0IOo7i1P_61zVUWbJ4nw"
]
}
},
"authorsData": [],
"tagData": []
},
"source": "Peninsula Press",
"sourceUrl": "http://peninsulapress.com/",
"sticky": false,
"nprByline": "\u003cstrong>Isha Salian\u003cbr/>\u003ca href=\"http://peninsulapress.com/author/ishasalian/\">Peninsula Press\u003c/strong>",
"path": "/news/11666412/california-tackles-air-pollution-disparities-with-data-policy-efforts",
"audioTrackLength": null,
"parsedContent": [
{
"type": "contentString",
"content": "\u003cdiv class=\"post-body\">\u003cp>\u003cp>As the North Bay fires burned more than 100,000 acres over the course of a few weeks last October, 100 miles south, in Santa Clara, Sutter Health pediatrician Manisha Panchal was stunned at the number of patients coming to her with coughs and bronchospasms — even children who had never wheezed before.\u003c/p>\n\u003cp>During the fires, the entire Bay Area got a taste of what it’s like to walk around during a high pollution day in Beijing, China. The fires released as much pollution into the air as a full year of cars on California roads.\u003c/p>\n\u003cp>But on a typical day, air quality is not top of mind for most locals.\u003c/p>\n\u003cp>“It comes out when there’s the wildfires,” said Panchal, “and then it goes away, and people forget.”\u003c/p>\n\u003cp>As climate change continues, wildfires could become the “new normal” for California, Gov. Jerry Brown warned last year. Despite the strides California policymakers have made to reduce emissions, this natural phenomenon will contribute to climate change and short-term air pollution. However, it’s not the only concern state officials have about air quality.\u003c/p>\n\u003cp>\u003c/p>\u003c/div>",
"attributes": {
"named": {},
"numeric": []
}
},
{
"type": "component",
"content": "",
"name": "ad",
"attributes": {
"named": {
"label": "fullwidth"
},
"numeric": [
"fullwidth"
]
}
},
{
"type": "contentString",
"content": "\u003cdiv class=\"post-body\">\u003cp>\u003c/p>\n\u003cp>While California holds a reputation as a leader in environmental policy, it \u003ca href=\"https://www.americashealthrankings.org/explore/annual/measure/air/state/ALL\">still ranks\u003c/a> worst out of all 50 states for average public exposure to particulate matter pollution — tiny particles measured in microns, a millionth of a meter — largely due to the state’s topography and population density. California is also home to seven of the 10 U.S. metropolitan areas with the highest short-term levels of particle pollution. In 2018, the Bay Area ranked \u003ca href=\"http://www.lung.org/our-initiatives/healthy-air/sota/city-rankings/most-polluted-cities.html\">sixth\u003c/a> on the list, above the notoriously polluted Los Angeles-Long Beach area.\u003c/p>\n\u003cp>And though overall air quality statewide is improving, there are communities where pollution levels are the same or worse, University of Southern California lung health expert Ed Avol said. Startups and local air districts are working to reduce this disparity in the air people breathe, but they face several challenges to do so.\u003c/p>\n\u003cp>Understanding air quality at a hyperlocal level is a problem for both local residents and public officials. Data monitoring stations are spaced far apart, taking regional air measurements that differ drastically from what an individual may be actually breathing at any given time. As population and traffic congestion in the Bay Area grow, existing infrastructure keeps many local schools and athletic facilities a stone’s throw from emissions-heavy freeway routes. And as has been \u003ca href=\"http://www.lung.org/our-initiatives/healthy-air/outdoor/air-pollution/disparities.html\">well-documented\u003c/a>, low-income areas and communities of color face stronger impacts from polluted air.\u003c/p>\n\u003cp>“They get overexposed because we can afford to live in a more desirable place, and this becomes an issue of environmental justice, environmental racism,” said Avol.\u003c/p>\n\u003cp>To be sure, air quality in many areas around the world is far worse than it is in the Bay Area. Cities like Beijing and New Delhi rank far higher in pollution measures on a daily basis. But the issue is worth working on locally because today’s levels still produce negative health effects, researchers say, particularly for disadvantaged populations.\u003c/p>\n\u003cp>\u003cstrong>Filling in the Data Gap\u003c/strong>\u003c/p>\n\u003cp>On an average day, a Bay Area resident who looks at the Environmental Protection Agency’s \u003ca href=\"https://airnow.gov/index.cfm?action=airnow.local_city\">AirNow\u003c/a> air quality website sees nothing to be concerned about. However, startups taking a closer look find pollution can vary greatly from neighborhood to neighborhood.\u003c/p>\n\u003cp>San Francisco-based Aclima is a startup that says it’s “filling in the pixels” on air pollution data by collecting street-level measurements. Aclima works with companies like Google and researchers and public agencies like the EPA to measure air quality. The company drove two Google Street View cars, mounted with an air monitoring sensor the size of two shoeboxes, more than 100,000 miles across California. The sensors collected a billion data points over two years, according to vice president of communications Kim Hunter.\u003c/p>\n\u003cfigure id=\"attachment_11666468\" class=\"wp-caption alignright\" style=\"max-width: 800px\">\u003cimg loading=\"lazy\" decoding=\"async\" class=\"size-medium wp-image-11666468\" src=\"https://ww2.kqed.org/news/wp-content/uploads/sites/10/2018/05/AirMonitoringSensors-800x1066.jpg\" alt=\"Air monitoring equipment set up on a roof.\" width=\"800\" height=\"1066\">\u003cfigcaption class=\"wp-caption-text\">Sensors on the roof of the Bay Area air district’s San Pablo monitoring station connect to equipment in a laboratory below. \u003ccite>(Isha Salian/Peninsula Press)\u003c/cite>\u003c/figcaption>\u003c/figure>\n\u003cp>The company’s street-by-street visualization of Oakland shows hot spots of pollutants near the Port of Oakland, as well as on Interstate 880 and other major roads. Pollution can \u003ca href=\"https://blog.aclima.io/how-traffic-affects-your-short-term-pollution-exposure-a3b6bae8b71b\">increase\u003c/a> by five to eight times from one end of a block to another, said the company’s chief scientist Melissa Lunden.\u003c/p>\n\u003cp>These variations can depend on factors less obvious than proximity to roadways or factories. Subtle features can make a difference, like wind patterns, the presence of trees between roads and residences and whether freeways are at ground level or elevated. Aclima says its granular data could help buildings and cities make informed decisions about emissions exposure.\u003c/p>\n\u003cp>Recent advances in sensor technology allow startups to develop cheaper, portable devices that could allow monitoring agencies to expand their data collection, said Lunden. The sensor Aclima is developing costs “100 to 1,000” times less than the equipment currently used by researchers and officials.\u003c/p>\n\u003cp>Installing a full Bay Area Air Quality Management District monitoring station costs around $250,000 and require more than half a full-time employee’s work hours to operate, said Eric Stevenson, the district’s director of meteorology and measurements. Since it’s such a large investment, he said the district sites most stations to represent very large geographical areas.\u003c/p>\n\u003cp>The district currently runs 33 air monitoring stations in the region to measure ambient air quality for that area. Just four of the seven stations between Redwood City and Gilroy measure particulate matter.\u003c/p>\n\u003cfigure id=\"attachment_11666472\" class=\"wp-caption aligncenter\" style=\"max-width: 800px\">\u003cimg loading=\"lazy\" decoding=\"async\" class=\"size-medium wp-image-11666472\" src=\"https://ww2.kqed.org/news/wp-content/uploads/sites/10/2018/05/Redwood-city-air-data-by-year-800x640.jpg\" alt=\"A line chart of particulate matter in Redwood City\" width=\"800\" height=\"640\" srcset=\"https://cdn.kqed.org/wp-content/uploads/sites/10/2018/05/Redwood-city-air-data-by-year-800x640.jpg 800w, https://cdn.kqed.org/wp-content/uploads/sites/10/2018/05/Redwood-city-air-data-by-year-160x128.jpg 160w, https://cdn.kqed.org/wp-content/uploads/sites/10/2018/05/Redwood-city-air-data-by-year-1020x816.jpg 1020w, https://cdn.kqed.org/wp-content/uploads/sites/10/2018/05/Redwood-city-air-data-by-year-1200x960.jpg 1200w, https://cdn.kqed.org/wp-content/uploads/sites/10/2018/05/Redwood-city-air-data-by-year-1920x1536.jpg 1920w, https://cdn.kqed.org/wp-content/uploads/sites/10/2018/05/Redwood-city-air-data-by-year-1180x944.jpg 1180w, https://cdn.kqed.org/wp-content/uploads/sites/10/2018/05/Redwood-city-air-data-by-year-960x768.jpg 960w, https://cdn.kqed.org/wp-content/uploads/sites/10/2018/05/Redwood-city-air-data-by-year-240x192.jpg 240w, https://cdn.kqed.org/wp-content/uploads/sites/10/2018/05/Redwood-city-air-data-by-year-375x300.jpg 375w, https://cdn.kqed.org/wp-content/uploads/sites/10/2018/05/Redwood-city-air-data-by-year-520x416.jpg 520w, https://cdn.kqed.org/wp-content/uploads/sites/10/2018/05/Redwood-city-air-data-by-year.jpg 2000w\" sizes=\"(max-width: 800px) 100vw, 800px\">\u003cfigcaption class=\"wp-caption-text\">A line graph showing the reduction in particulate matter pollution in Redwood City between 1998 and 2012. The median PM 2.5 reading in 1998 was 20 micrograms per cubic meter. In 2012, it was down to 6. Data from the Environmental Protection Agency’s Air Quality System Data Mart. \u003ccite>(Isha Salian/Peninsula Press)\u003c/cite>\u003c/figcaption>\u003c/figure>\n\u003cp>“I think it’s a failing of the air districts, and the state government, which doesn’t require the air districts to do more,” said Bill Magavern, policy director at the Coalition for Clean Air.\u003c/p>\n\u003cp>Magavern says the air monitoring network does what’s required to comply with EPA rules about pollutant reporting, but this level of monitoring does not capture important neighborhood-level data.\u003c/p>\n\u003cp>His coalition has begun a project to install cheaper, portable monitors at schools and residences in the Los Angeles area. Once communities and government officials have a better understanding of hyperlocal air data, they can begin taking action to mitigate pollution.\u003c/p>\n\u003cp>California is now making strides to collect this kind of data on more narrow pockets of the state.\u003c/p>\n\u003cp>The aim: for all residents to be breathing the same quality air.\u003c/p>\n\u003cp>\u003cstrong>Getting Down to the Neighborhood Level\u003c/strong>\u003c/p>\n\u003cp>Growing up in Bell Gardens, a city in Los Angeles County, state Assemblywoman Cristina Garcia saw truck and freight traffic from the Port of Long Beach go by every day, spewing pollution into the air. Six freeways and a rail yard “choke my community,” she said.\u003c/p>\n\u003cp>Garcia noticed that districts like hers — working-class areas, communities of color, were often located in regions with poorer air quality. This experience prompted Garcia to take up the cause of environmental justice as a state legislator.\u003c/p>\n\u003cp>“My community has been treated like a wasteland,” she said. Garcia always heard that as the environment of California improved overall, her district would catch up, too. But she wasn’t seeing the results: “We’ve been calling it trickle-down environmentalism for a few years now.”\u003c/p>\n\u003cp>So Garcia proposed Assembly Bill 617, a regulation that mandates local air districts identify disadvantaged communities in each region for closer monitoring. The districts must then implement action plans to decrease pollution in those specific areas.\u003c/p>\n\u003cp>The bill passed last year, and local air districts had to submit a draft description of the first target communities by April 30. Garcia said she expects some positive results in air quality by 2023.\u003c/p>\n\u003cp>For now, the Bay Area air district is looking primarily at West Oakland as a site for action plans to reduce emissions, and at Richmond as a site for additional air monitoring. The Port of Oakland and highway traffic are major emitters for the region.\u003c/p>\n\u003cp>“The important thing is that we protect the health of every resident of the Bay Area,” Stevenson said. “No one else is doing this — no one else in the country.”\u003c/p>\n\u003cfigure id=\"attachment_11666473\" class=\"wp-caption alignleft\" style=\"max-width: 800px\">\u003cimg loading=\"lazy\" decoding=\"async\" class=\"size-medium wp-image-11666473\" src=\"https://ww2.kqed.org/news/wp-content/uploads/sites/10/2018/05/Richmond-800x600.jpg\" alt=\"A woman marking up a map for air monitoring.\" width=\"800\" height=\"600\" srcset=\"https://cdn.kqed.org/wp-content/uploads/sites/10/2018/05/Richmond-800x600.jpg 800w, https://cdn.kqed.org/wp-content/uploads/sites/10/2018/05/Richmond-160x120.jpg 160w, https://cdn.kqed.org/wp-content/uploads/sites/10/2018/05/Richmond-960x720.jpg 960w, https://cdn.kqed.org/wp-content/uploads/sites/10/2018/05/Richmond-240x180.jpg 240w, https://cdn.kqed.org/wp-content/uploads/sites/10/2018/05/Richmond-375x281.jpg 375w, https://cdn.kqed.org/wp-content/uploads/sites/10/2018/05/Richmond-520x390.jpg 520w, https://cdn.kqed.org/wp-content/uploads/sites/10/2018/05/Richmond.jpg 1000w\" sizes=\"(max-width: 800px) 100vw, 800px\">\u003cfigcaption class=\"wp-caption-text\">At an air district event, Point Richmond resident Lori Goldwin marks a potential site for community air monitoring. \u003ccite>(Isha Salian/Peninsula Press)\u003c/cite>\u003c/figcaption>\u003c/figure>\n\u003cp>On a recent Wednesday night in Richmond, around 60 community members gathered to discuss the air district’s plans for additional air monitoring in the city. The air district responded to community concerns about whether monitoring data would be easily accessible online, and that the data would lead to action.\u003c/p>\n\u003cp>“These are human rights violations when you’re talking about disproportionate impact,” Henry Clark, executive director of the advocacy group West County Toxics Coalition, at the meeting.\u003c/p>\n\u003cp>In an effort to include local residents in the monitoring process, the air district asked attendees to suggest potential sites for placing new air monitors. They could out fill a form online, or place a neon sticker on a large map of Richmond pinned to the wall.\u003c/p>\n\u003cp>“I put a dot where I live at the top of the hill,” said attendee Lori Goldwin, a resident of Point Richmond. In the past six months, she’s started to notice odors from polluted air in her neighborhood.\u003c/p>\n\u003cp>“Maybe I’ll be run out of town by this,” she said. “I don’t want to move, but I could move.”\u003c/p>\n\u003cp>\u003cstrong>Rethinking School Design\u003c/strong>\u003c/p>\n\u003cp>Children are more vulnerable to irritation from traffic and air pollution because their lungs are still developing, said Avol. And while children are exposed to air pollution at home, another major factor is the location of their schools. California Air Resources Board lung researcher Barbara Weller said even in Bay Area, where overall pollution is fairly low, having schools near traffic is associated with increased wheeze in children.\u003c/p>\n\u003cp>These schools are more prevalent in disadvantaged communities. Statewide, 58.7 percent of students were eligible for free or reduced-price school lunches during the 2014-2015 school year. \u003ca href=\"https://public.tableau.com/profile/marnette.federis#!/vizhome/Schoolsfrpmmap1/Dashboard1\" rel=\"noopener\" target=\"_blank\">For schools located within 500 feet of major roads, that figure jumps to 67.2 percent.\u003c/a>\u003c/p>\n\u003cp>A 2003 California guideline \u003ca href=\"https://leginfo.legislature.ca.gov/faces/billCompareClient.xhtml?bill_id=200320040SB352\">recommends\u003c/a> that no new schools should be built within 500 feet of a major road or freeway. But while “it’s wonderful that new schools are sited away from traffic … a lot of schools were already built,” Weller said. California has more than 1,000 active public schools located within 500 feet of major roads – a third of which opened in 2004 or later, an analysis of data collected by the Center for Public Integrity shows.\u003c/p>\n\u003cp>Dr. Panchal’s children attend one of those schools – Bullis Charter School in Los Altos, opened in 2004. She says the lunch tables are located right next to San Antonio Road, separated by a fence. “Why would they put the tables there?” she said. “For that one hour the kids are just breathing these particles.”\u003c/p>\n\u003cfigure id=\"attachment_11666469\" class=\"wp-caption aligncenter\" style=\"max-width: 800px\">\u003cimg loading=\"lazy\" decoding=\"async\" class=\"size-medium wp-image-11666469\" src=\"https://ww2.kqed.org/news/wp-content/uploads/sites/10/2018/05/CupertinoMiddleHomesteadHigh-800x450.jpg\" alt=\"A Google map of Cupertino Middle School and Homestead High School and its location a few hundred feet away from the freeway.\" width=\"800\" height=\"450\">\u003cfigcaption class=\"wp-caption-text\">Cupertino Middle School (upper left) is located within 500 feet of Highway 85. Neighboring Homestead High School’s playing fields directly border Interstate 280. The average annual daily vehicles on the interstate in Sunnyvale jumped from 85,000 in 1993 to 120,000 in 2016. \u003ccite>(Isha Salian/Peninsula Press)\u003c/cite>\u003c/figcaption>\u003c/figure>\n\u003cp>The air resources board says the layout of the campus makes a difference for students’ exposure levels to polluted air. Weller recommends moving playgrounds, fields and other outdoor areas further from roads as a solution to lessen the health impacts of vehicle emissions. Parking lots or enclosed areas could border the road instead, Avol said.\u003c/p>\n\u003cp>\u003c/p>\u003c/div>",
"attributes": {
"named": {},
"numeric": []
}
},
{
"type": "component",
"content": "",
"name": "ad",
"attributes": {
"named": {
"label": "floatright"
},
"numeric": [
"floatright"
]
}
},
{
"type": "contentString",
"content": "\u003cdiv class=\"post-body\">\u003cp>\u003c/p>\n\u003cp>“We should not be thinking, ‘If we get to this one level everything will be fine,’” said Avol. “There is no threshold, there is no safe line.”\u003c/p>\n\n\u003c/div>\u003c/p>",
"attributes": {
"named": {},
"numeric": []
}
}
],
"link": "/news/11666412/california-tackles-air-pollution-disparities-with-data-policy-efforts",
"authors": [
"byline_news_11666412"
],
"programs": [
"news_72"
],
"categories": [
"news_34165",
"news_19906",
"news_457",
"news_8",
"news_356"
],
"tags": [
"news_2036",
"news_255"
],
"affiliates": [
"news_5933"
],
"featImg": "news_11666474",
"label": "source_news_11666412",
"isLoading": false,
"hasAllInfo": true
}
},
"podcastsReducer": {
"isFetching": false,
"fetchFailed": false,
"hasFetched": false,
"podcasts": {}
},
"radioProgramsReducer": {
"isFetching": false,
"fetchFailed": false,
"hasFetched": false,
"radioPrograms": {}
},
"programsReducer": {
"all-things-considered": {
"id": "all-things-considered",
"title": "All Things Considered",
"info": "Every weekday, \u003cem>All Things Considered\u003c/em> hosts Robert Siegel, Audie Cornish, Ari Shapiro, and Kelly McEvers present the program's trademark mix of news, interviews, commentaries, reviews, and offbeat features. Michel Martin hosts on the weekends.",
"airtime": "MON-FRI 1pm-2pm, 4:30pm-6:30pm\u003cbr />SAT-SUN 5pm-6pm",
"imageSrc": "https://cdn.kqed.org/wp-content/uploads/2024/04/All-Things-Considered-Podcast-Tile-360x360-1.jpg",
"officialWebsiteLink": "https://www.npr.org/programs/all-things-considered/",
"meta": {
"site": "news",
"source": "npr"
},
"link": "/radio/program/all-things-considered"
},
"american-suburb-podcast": {
"id": "american-suburb-podcast",
"title": "American Suburb: The Podcast",
"tagline": "The flip side of gentrification, told through one town",
"info": "Gentrification is changing cities across America, forcing people from neighborhoods they have long called home. Call them the displaced. Now those priced out of the Bay Area are looking for a better life in an unlikely place. American Suburb follows this migration to one California town along the Delta, 45 miles from San Francisco. But is this once sleepy suburb ready for them?",
"imageSrc": "https://cdn.kqed.org/wp-content/uploads/2024/04/American-Suburb-Podcast-Tile-703x703-1.jpg",
"officialWebsiteLink": "/news/series/american-suburb-podcast",
"meta": {
"site": "news",
"source": "kqed",
"order": 19
},
"link": "/news/series/american-suburb-podcast/",
"subscribe": {
"npr": "https://rpb3r.app.goo.gl/RBrW",
"apple": "https://itunes.apple.com/WebObjects/MZStore.woa/wa/viewPodcast?mt=2&id=1287748328",
"tuneIn": "https://tunein.com/radio/American-Suburb-p1086805/",
"rss": "https://ww2.kqed.org/news/series/american-suburb-podcast/feed/podcast",
"google": "https://podcasts.google.com/feed/aHR0cHM6Ly9mZWVkcy5tZWdhcGhvbmUuZm0vS1FJTkMzMDExODgxNjA5"
}
},
"baycurious": {
"id": "baycurious",
"title": "Bay Curious",
"tagline": "Exploring the Bay Area, one question at a time",
"info": "KQED’s new podcast, Bay Curious, gets to the bottom of the mysteries — both profound and peculiar — that give the Bay Area its unique identity. And we’ll do it with your help! You ask the questions. You decide what Bay Curious investigates. And you join us on the journey to find the answers.",
"imageSrc": "https://cdn.kqed.org/wp-content/uploads/2024/04/Bay-Curious-Podcast-Tile-703x703-1.jpg",
"imageAlt": "KQED Bay Curious",
"officialWebsiteLink": "/news/series/baycurious",
"meta": {
"site": "news",
"source": "kqed",
"order": 3
},
"link": "/podcasts/baycurious",
"subscribe": {
"apple": "https://podcasts.apple.com/us/podcast/bay-curious/id1172473406",
"npr": "https://www.npr.org/podcasts/500557090/bay-curious",
"rss": "https://ww2.kqed.org/news/category/bay-curious-podcast/feed/podcast",
"amazon": "https://music.amazon.com/podcasts/9a90d476-aa04-455d-9a4c-0871ed6216d4/bay-curious",
"stitcher": "https://www.stitcher.com/podcast/kqed/bay-curious",
"spotify": "https://open.spotify.com/show/6O76IdmhixfijmhTZLIJ8k"
}
},
"bbc-world-service": {
"id": "bbc-world-service",
"title": "BBC World Service",
"info": "The day's top stories from BBC News compiled twice daily in the week, once at weekends.",
"airtime": "MON-FRI 9pm-10pm, TUE-FRI 1am-2am",
"imageSrc": "https://cdn.kqed.org/wp-content/uploads/2024/04/BBC-World-Service-Podcast-Tile-360x360-1.jpg",
"officialWebsiteLink": "https://www.bbc.co.uk/sounds/play/live:bbc_world_service",
"meta": {
"site": "news",
"source": "BBC World Service"
},
"link": "/radio/program/bbc-world-service",
"subscribe": {
"apple": "https://itunes.apple.com/us/podcast/global-news-podcast/id135067274?mt=2",
"tuneIn": "https://tunein.com/radio/BBC-World-Service-p455581/",
"rss": "https://podcasts.files.bbci.co.uk/p02nq0gn.rss"
}
},
"californiareport": {
"id": "californiareport",
"title": "The California Report",
"tagline": "California, day by day",
"info": "KQED’s statewide radio news program providing daily coverage of issues, trends and public policy decisions.",
"imageSrc": "https://cdn.kqed.org/wp-content/uploads/2024/04/The-California-Report-Podcast-Tile-703x703-1.jpg",
"imageAlt": "KQED The California Report",
"officialWebsiteLink": "/californiareport",
"meta": {
"site": "news",
"source": "kqed",
"order": 8
},
"link": "/californiareport",
"subscribe": {
"apple": "https://podcasts.apple.com/us/podcast/kqeds-the-california-report/id79681292",
"amazon": "https://music.amazon.com/podcasts/26099305-72af-4542-9dde-ac1807fe36d5/kqed-s-the-california-report",
"npr": "https://www.npr.org/podcasts/432285393/the-california-report",
"stitcher": "https://www.stitcher.com/podcast/kqedfm-kqeds-the-california-report-podcast-8838",
"rss": "https://ww2.kqed.org/news/tag/tcram/feed/podcast"
}
},
"californiareportmagazine": {
"id": "californiareportmagazine",
"title": "The California Report Magazine",
"tagline": "Your state, your stories",
"info": "Every week, The California Report Magazine takes you on a road trip for the ears: to visit the places and meet the people who make California unique. The in-depth storytelling podcast from the California Report.",
"airtime": "FRI 4:30pm-5pm, 6:30pm-7pm, 11pm-11:30pm",
"imageSrc": "https://cdn.kqed.org/wp-content/uploads/2024/04/The-California-Report-Magazine-Podcast-Tile-703x703-1.jpg",
"imageAlt": "KQED The California Report Magazine",
"officialWebsiteLink": "/californiareportmagazine",
"meta": {
"site": "news",
"source": "kqed",
"order": 10
},
"link": "/californiareportmagazine",
"subscribe": {
"apple": "https://podcasts.apple.com/us/podcast/the-california-report-magazine/id1314750545",
"google": "https://podcasts.google.com/feed/aHR0cHM6Ly9mZWVkcy5tZWdhcGhvbmUuZm0vS1FJTkM3NjkwNjk1OTAz",
"npr": "https://www.npr.org/podcasts/564733126/the-california-report-magazine",
"stitcher": "https://www.stitcher.com/podcast/kqed/the-california-report-magazine",
"rss": "https://ww2.kqed.org/news/tag/tcrmag/feed/podcast"
}
},
"city-arts": {
"id": "city-arts",
"title": "City Arts & Lectures",
"info": "A one-hour radio program to hear celebrated writers, artists and thinkers address contemporary ideas and values, often discussing the creative process. Please note: tapes or transcripts are not available",
"imageSrc": "https://ww2.kqed.org/radio/wp-content/uploads/sites/50/2018/05/cityartsandlecture-300x300.jpg",
"officialWebsiteLink": "https://www.cityarts.net/",
"airtime": "SUN 1pm-2pm, TUE 10pm, WED 1am",
"meta": {
"site": "news",
"source": "City Arts & Lectures"
},
"link": "https://www.cityarts.net",
"subscribe": {
"tuneIn": "https://tunein.com/radio/City-Arts-and-Lectures-p692/",
"rss": "https://www.cityarts.net/feed/"
}
},
"closealltabs": {
"id": "closealltabs",
"title": "Close All Tabs",
"tagline": "Your irreverent guide to the trends redefining our world",
"info": "Close All Tabs breaks down how digital culture shapes our world through thoughtful insights and irreverent humor.",
"imageSrc": "https://cdn.kqed.org/wp-content/uploads/2025/02/CAT_2_Tile-scaled.jpg",
"imageAlt": "KQED Close All Tabs",
"officialWebsiteLink": "/podcasts/closealltabs",
"meta": {
"site": "news",
"source": "kqed",
"order": 1
},
"link": "/podcasts/closealltabs",
"subscribe": {
"apple": "https://podcasts.apple.com/us/podcast/close-all-tabs/id214663465",
"rss": "https://feeds.megaphone.fm/KQINC6993880386",
"amazon": "https://music.amazon.com/podcasts/92d9d4ac-67a3-4eed-b10a-fb45d45b1ef2/close-all-tabs",
"spotify": "https://open.spotify.com/show/6LAJFHnGK1pYXYzv6SIol6?si=deb0cae19813417c"
}
},
"code-switch-life-kit": {
"id": "code-switch-life-kit",
"title": "Code Switch / Life Kit",
"info": "\u003cem>Code Switch\u003c/em>, which listeners will hear in the first part of the hour, has fearless and much-needed conversations about race. Hosted by journalists of color, the show tackles the subject of race head-on, exploring how it impacts every part of society — from politics and pop culture to history, sports and more.\u003cbr />\u003cbr />\u003cem>Life Kit\u003c/em>, which will be in the second part of the hour, guides you through spaces and feelings no one prepares you for — from finances to mental health, from workplace microaggressions to imposter syndrome, from relationships to parenting. The show features experts with real world experience and shares their knowledge. Because everyone needs a little help being human.\u003cbr />\u003cbr />\u003ca href=\"https://www.npr.org/podcasts/510312/codeswitch\">\u003cem>Code Switch\u003c/em> offical site and podcast\u003c/a>\u003cbr />\u003ca href=\"https://www.npr.org/lifekit\">\u003cem>Life Kit\u003c/em> offical site and podcast\u003c/a>\u003cbr />",
"airtime": "SUN 9pm-10pm",
"imageSrc": "https://cdn.kqed.org/wp-content/uploads/2024/04/Code-Switch-Life-Kit-Podcast-Tile-360x360-1.jpg",
"meta": {
"site": "radio",
"source": "npr"
},
"link": "/radio/program/code-switch-life-kit",
"subscribe": {
"apple": "https://podcasts.apple.com/podcast/1112190608?mt=2&at=11l79Y&ct=nprdirectory",
"google": "https://podcasts.google.com/feed/aHR0cHM6Ly93d3cubnByLm9yZy9yc3MvcG9kY2FzdC5waHA_aWQ9NTEwMzEy",
"spotify": "https://open.spotify.com/show/3bExJ9JQpkwNhoHvaIIuyV",
"rss": "https://feeds.npr.org/510312/podcast.xml"
}
},
"commonwealth-club": {
"id": "commonwealth-club",
"title": "Commonwealth Club of California Podcast",
"info": "The Commonwealth Club of California is the nation's oldest and largest public affairs forum. As a non-partisan forum, The Club brings to the public airwaves diverse viewpoints on important topics. The Club's weekly radio broadcast - the oldest in the U.S., dating back to 1924 - is carried across the nation on public radio stations and is now podcasting. Our website archive features audio of our recent programs, as well as selected speeches from our long and distinguished history. This podcast feed is usually updated twice a week and is always un-edited.",
"airtime": "THU 10pm, FRI 1am",
"imageSrc": "https://cdn.kqed.org/wp-content/uploads/2024/04/Commonwealth-Club-Podcast-Tile-360x360-1.jpg",
"officialWebsiteLink": "https://www.commonwealthclub.org/podcasts",
"meta": {
"site": "news",
"source": "Commonwealth Club of California"
},
"link": "/radio/program/commonwealth-club",
"subscribe": {
"apple": "https://itunes.apple.com/us/podcast/commonwealth-club-of-california-podcast/id976334034?mt=2",
"google": "https://podcasts.google.com/feed/aHR0cDovL3d3dy5jb21tb253ZWFsdGhjbHViLm9yZy9hdWRpby9wb2RjYXN0L3dlZWtseS54bWw",
"tuneIn": "https://tunein.com/radio/Commonwealth-Club-of-California-p1060/"
}
},
"forum": {
"id": "forum",
"title": "Forum",
"tagline": "The conversation starts here",
"info": "KQED’s live call-in program discussing local, state, national and international issues, as well as in-depth interviews.",
"airtime": "MON-FRI 9am-11am, 10pm-11pm",
"imageSrc": "https://cdn.kqed.org/wp-content/uploads/2024/04/Forum-Podcast-Tile-703x703-1.jpg",
"imageAlt": "KQED Forum with Mina Kim and Alexis Madrigal",
"officialWebsiteLink": "/forum",
"meta": {
"site": "news",
"source": "kqed",
"order": 9
},
"link": "/forum",
"subscribe": {
"apple": "https://podcasts.apple.com/us/podcast/kqeds-forum/id73329719",
"google": "https://podcasts.google.com/feed/aHR0cHM6Ly9mZWVkcy5tZWdhcGhvbmUuZm0vS1FJTkM5NTU3MzgxNjMz",
"npr": "https://www.npr.org/podcasts/432307980/forum",
"stitcher": "https://www.stitcher.com/podcast/kqedfm-kqeds-forum-podcast",
"rss": "https://feeds.megaphone.fm/KQINC9557381633"
}
},
"freakonomics-radio": {
"id": "freakonomics-radio",
"title": "Freakonomics Radio",
"info": "Freakonomics Radio is a one-hour award-winning podcast and public-radio project hosted by Stephen Dubner, with co-author Steve Levitt as a regular guest. It is produced in partnership with WNYC.",
"imageSrc": "https://ww2.kqed.org/news/wp-content/uploads/sites/10/2018/05/freakonomicsRadio.png",
"officialWebsiteLink": "http://freakonomics.com/",
"airtime": "SUN 1am-2am, SAT 3pm-4pm",
"meta": {
"site": "radio",
"source": "WNYC"
},
"link": "/radio/program/freakonomics-radio",
"subscribe": {
"npr": "https://rpb3r.app.goo.gl/4s8b",
"apple": "https://itunes.apple.com/us/podcast/freakonomics-radio/id354668519",
"tuneIn": "https://tunein.com/podcasts/WNYC-Podcasts/Freakonomics-Radio-p272293/",
"rss": "https://feeds.feedburner.com/freakonomicsradio"
}
},
"fresh-air": {
"id": "fresh-air",
"title": "Fresh Air",
"info": "Hosted by Terry Gross, \u003cem>Fresh Air from WHYY\u003c/em> is the Peabody Award-winning weekday magazine of contemporary arts and issues. One of public radio's most popular programs, Fresh Air features intimate conversations with today's biggest luminaries.",
"airtime": "MON-FRI 7pm-8pm",
"imageSrc": "https://cdn.kqed.org/wp-content/uploads/2024/04/Fresh-Air-Podcast-Tile-360x360-1.jpg",
"officialWebsiteLink": "https://www.npr.org/programs/fresh-air/",
"meta": {
"site": "radio",
"source": "npr"
},
"link": "/radio/program/fresh-air",
"subscribe": {
"npr": "https://rpb3r.app.goo.gl/4s8b",
"apple": "https://itunes.apple.com/WebObjects/MZStore.woa/wa/viewPodcast?s=143441&mt=2&id=214089682&at=11l79Y&ct=nprdirectory",
"tuneIn": "https://tunein.com/radio/Fresh-Air-p17/",
"rss": "https://feeds.npr.org/381444908/podcast.xml"
}
},
"here-and-now": {
"id": "here-and-now",
"title": "Here & Now",
"info": "A live production of NPR and WBUR Boston, in collaboration with stations across the country, Here & Now reflects the fluid world of news as it's happening in the middle of the day, with timely, in-depth news, interviews and conversation. Hosted by Robin Young, Jeremy Hobson and Tonya Mosley.",
"airtime": "MON-THU 11am-12pm",
"imageSrc": "https://cdn.kqed.org/wp-content/uploads/2024/04/Here-And-Now-Podcast-Tile-360x360-1.jpg",
"officialWebsiteLink": "http://www.wbur.org/hereandnow",
"meta": {
"site": "news",
"source": "npr"
},
"link": "/radio/program/here-and-now",
"subsdcribe": {
"apple": "https://itunes.apple.com/WebObjects/MZStore.woa/wa/viewPodcast?mt=2&id=426698661",
"tuneIn": "https://tunein.com/radio/Here--Now-p211/",
"rss": "https://feeds.npr.org/510051/podcast.xml"
}
},
"hidden-brain": {
"id": "hidden-brain",
"title": "Hidden Brain",
"info": "Shankar Vedantam uses science and storytelling to reveal the unconscious patterns that drive human behavior, shape our choices and direct our relationships.",
"imageSrc": "https://ww2.kqed.org/radio/wp-content/uploads/sites/50/2018/05/hiddenbrain.jpg",
"officialWebsiteLink": "https://www.npr.org/series/423302056/hidden-brain",
"airtime": "SUN 7pm-8pm",
"meta": {
"site": "news",
"source": "NPR"
},
"link": "/radio/program/hidden-brain",
"subscribe": {
"apple": "https://itunes.apple.com/us/podcast/hidden-brain/id1028908750?mt=2",
"tuneIn": "https://tunein.com/podcasts/Science-Podcasts/Hidden-Brain-p787503/",
"rss": "https://feeds.npr.org/510308/podcast.xml"
}
},
"how-i-built-this": {
"id": "how-i-built-this",
"title": "How I Built This with Guy Raz",
"info": "Guy Raz dives into the stories behind some of the world's best known companies. How I Built This weaves a narrative journey about innovators, entrepreneurs and idealists—and the movements they built.",
"imageSrc": "https://ww2.kqed.org/news/wp-content/uploads/sites/10/2018/05/howIBuiltThis.png",
"officialWebsiteLink": "https://www.npr.org/podcasts/510313/how-i-built-this",
"airtime": "SUN 7:30pm-8pm",
"meta": {
"site": "news",
"source": "npr"
},
"link": "/radio/program/how-i-built-this",
"subscribe": {
"npr": "https://rpb3r.app.goo.gl/3zxy",
"apple": "https://itunes.apple.com/us/podcast/how-i-built-this-with-guy-raz/id1150510297?mt=2",
"tuneIn": "https://tunein.com/podcasts/Arts--Culture-Podcasts/How-I-Built-This-p910896/",
"rss": "https://feeds.npr.org/510313/podcast.xml"
}
},
"hyphenacion": {
"id": "hyphenacion",
"title": "Hyphenación",
"tagline": "Where conversation and cultura meet",
"info": "What kind of no sabo word is Hyphenación? For us, it’s about living within a hyphenation. Like being a third-gen Mexican-American from the Texas border now living that Bay Area Chicano life. Like Xorje! Each week we bring together a couple of hyphenated Latinos to talk all about personal life choices: family, careers, relationships, belonging … everything is on the table. ",
"imageSrc": "https://cdn.kqed.org/wp-content/uploads/2025/03/Hyphenacion_FinalAssets_PodcastTile.png",
"imageAlt": "KQED Hyphenación",
"officialWebsiteLink": "/podcasts/hyphenacion",
"meta": {
"site": "news",
"source": "kqed",
"order": 15
},
"link": "/podcasts/hyphenacion",
"subscribe": {
"apple": "https://podcasts.apple.com/us/podcast/hyphenaci%C3%B3n/id1191591838",
"spotify": "https://open.spotify.com/show/2p3Fifq96nw9BPcmFdIq0o?si=39209f7b25774f38",
"youtube": "https://www.youtube.com/c/kqedarts",
"amazon": "https://music.amazon.com/podcasts/6c3dd23c-93fb-4aab-97ba-1725fa6315f1/hyphenaci%C3%B3n",
"rss": "https://feeds.megaphone.fm/KQINC2275451163"
}
},
"jerrybrown": {
"id": "jerrybrown",
"title": "The Political Mind of Jerry Brown",
"tagline": "Lessons from a lifetime in politics",
"info": "The Political Mind of Jerry Brown brings listeners the wisdom of the former Governor, Mayor, and presidential candidate. Scott Shafer interviewed Brown for more than 40 hours, covering the former governor's life and half-century in the political game – and Brown has some lessons he'd like to share. ",
"imageSrc": "https://cdn.kqed.org/wp-content/uploads/2024/04/The-Political-Mind-of-Jerry-Brown-Podcast-Tile-703x703-1.jpg",
"imageAlt": "KQED The Political Mind of Jerry Brown",
"officialWebsiteLink": "/podcasts/jerrybrown",
"meta": {
"site": "news",
"source": "kqed",
"order": 18
},
"link": "/podcasts/jerrybrown",
"subscribe": {
"npr": "https://www.npr.org/podcasts/790253322/the-political-mind-of-jerry-brown",
"apple": "https://itunes.apple.com/us/podcast/id1492194549",
"rss": "https://ww2.kqed.org/news/series/jerrybrown/feed/podcast/",
"tuneIn": "http://tun.in/pjGcK",
"stitcher": "https://www.stitcher.com/podcast/kqed/the-political-mind-of-jerry-brown",
"spotify": "https://open.spotify.com/show/54C1dmuyFyKMFttY6X2j6r?si=K8SgRCoISNK6ZbjpXrX5-w",
"amazon": "https://music.amazon.com/podcasts/44420f75-3b0e-4301-ab3b-16da6b09e543/the-political-mind-of-jerry-brown"
}
},
"latino-usa": {
"id": "latino-usa",
"title": "Latino USA",
"airtime": "MON 1am-2am, SUN 6pm-7pm",
"info": "Latino USA, the radio journal of news and culture, is the only national, English-language radio program produced from a Latino perspective.",
"imageSrc": "https://ww2.kqed.org/radio/wp-content/uploads/sites/50/2018/04/latinoUsa.jpg",
"officialWebsiteLink": "http://latinousa.org/",
"meta": {
"site": "news",
"source": "npr"
},
"link": "/radio/program/latino-usa",
"subscribe": {
"npr": "https://rpb3r.app.goo.gl/xtTd",
"apple": "https://itunes.apple.com/WebObjects/MZStore.woa/wa/viewPodcast?s=143441&mt=2&id=79681317&at=11l79Y&ct=nprdirectory",
"tuneIn": "https://tunein.com/radio/Latino-USA-p621/",
"rss": "https://feeds.npr.org/510016/podcast.xml"
}
},
"marketplace": {
"id": "marketplace",
"title": "Marketplace",
"info": "Our flagship program, helmed by Kai Ryssdal, examines what the day in money delivered, through stories, conversations, newsworthy numbers and more. Updated Monday through Friday at about 3:30 p.m. PT.",
"airtime": "MON-FRI 4pm-4:30pm, MON-WED 6:30pm-7pm",
"imageSrc": "https://cdn.kqed.org/wp-content/uploads/2024/04/Marketplace-Podcast-Tile-360x360-1.jpg",
"officialWebsiteLink": "https://www.marketplace.org/",
"meta": {
"site": "news",
"source": "American Public Media"
},
"link": "/radio/program/marketplace",
"subscribe": {
"apple": "https://itunes.apple.com/WebObjects/MZStore.woa/wa/viewPodcast?s=143441&mt=2&id=201853034&at=11l79Y&ct=nprdirectory",
"tuneIn": "https://tunein.com/radio/APM-Marketplace-p88/",
"rss": "https://feeds.publicradio.org/public_feeds/marketplace-pm/rss/rss"
}
},
"masters-of-scale": {
"id": "masters-of-scale",
"title": "Masters of Scale",
"info": "Masters of Scale is an original podcast in which LinkedIn co-founder and Greylock Partner Reid Hoffman sets out to describe and prove theories that explain how great entrepreneurs take their companies from zero to a gazillion in ingenious fashion.",
"airtime": "Every other Wednesday June 12 through October 16 at 8pm (repeats Thursdays at 2am)",
"imageSrc": "https://cdn.kqed.org/wp-content/uploads/2024/04/Masters-of-Scale-Podcast-Tile-360x360-1.jpg",
"officialWebsiteLink": "https://mastersofscale.com/",
"meta": {
"site": "radio",
"source": "WaitWhat"
},
"link": "/radio/program/masters-of-scale",
"subscribe": {
"apple": "http://mastersofscale.app.link/",
"rss": "https://rss.art19.com/masters-of-scale"
}
},
"mindshift": {
"id": "mindshift",
"title": "MindShift",
"tagline": "A podcast about the future of learning and how we raise our kids",
"info": "The MindShift podcast explores the innovations in education that are shaping how kids learn. Hosts Ki Sung and Katrina Schwartz introduce listeners to educators, researchers, parents and students who are developing effective ways to improve how kids learn. We cover topics like how fed-up administrators are developing surprising tactics to deal with classroom disruptions; how listening to podcasts are helping kids develop reading skills; the consequences of overparenting; and why interdisciplinary learning can engage students on all ends of the traditional achievement spectrum. This podcast is part of the MindShift education site, a division of KQED News. KQED is an NPR/PBS member station based in San Francisco. You can also visit the MindShift website for episodes and supplemental blog posts or tweet us \u003ca href=\"https://twitter.com/MindShiftKQED\">@MindShiftKQED\u003c/a> or visit us at \u003ca href=\"/mindshift\">MindShift.KQED.org\u003c/a>",
"imageSrc": "https://cdn.kqed.org/wp-content/uploads/2024/04/Mindshift-Podcast-Tile-703x703-1.jpg",
"imageAlt": "KQED MindShift: How We Will Learn",
"officialWebsiteLink": "/mindshift/",
"meta": {
"site": "news",
"source": "kqed",
"order": 12
},
"link": "/podcasts/mindshift",
"subscribe": {
"apple": "https://podcasts.apple.com/us/podcast/mindshift-podcast/id1078765985",
"google": "https://podcasts.google.com/feed/aHR0cHM6Ly9mZWVkcy5tZWdhcGhvbmUuZm0vS1FJTkM1NzY0NjAwNDI5",
"npr": "https://www.npr.org/podcasts/464615685/mind-shift-podcast",
"stitcher": "https://www.stitcher.com/podcast/kqed/stories-teachers-share",
"spotify": "https://open.spotify.com/show/0MxSpNYZKNprFLCl7eEtyx"
}
},
"morning-edition": {
"id": "morning-edition",
"title": "Morning Edition",
"info": "\u003cem>Morning Edition\u003c/em> takes listeners around the country and the world with multi-faceted stories and commentaries every weekday. Hosts Steve Inskeep, David Greene and Rachel Martin bring you the latest breaking news and features to prepare you for the day.",
"airtime": "MON-FRI 3am-9am",
"imageSrc": "https://cdn.kqed.org/wp-content/uploads/2024/04/Morning-Edition-Podcast-Tile-360x360-1.jpg",
"officialWebsiteLink": "https://www.npr.org/programs/morning-edition/",
"meta": {
"site": "news",
"source": "npr"
},
"link": "/radio/program/morning-edition"
},
"onourwatch": {
"id": "onourwatch",
"title": "On Our Watch",
"tagline": "Deeply-reported investigative journalism",
"info": "For decades, the process for how police police themselves has been inconsistent – if not opaque. In some states, like California, these proceedings were completely hidden. After a new police transparency law unsealed scores of internal affairs files, our reporters set out to examine these cases and the shadow world of police discipline. On Our Watch brings listeners into the rooms where officers are questioned and witnesses are interrogated to find out who this system is really protecting. Is it the officers, or the public they've sworn to serve?",
"imageSrc": "https://cdn.kqed.org/wp-content/uploads/2024/04/On-Our-Watch-Podcast-Tile-703x703-1.jpg",
"imageAlt": "On Our Watch from NPR and KQED",
"officialWebsiteLink": "/podcasts/onourwatch",
"meta": {
"site": "news",
"source": "kqed",
"order": 11
},
"link": "/podcasts/onourwatch",
"subscribe": {
"apple": "https://podcasts.apple.com/podcast/id1567098962",
"google": "https://podcasts.google.com/feed/aHR0cHM6Ly9mZWVkcy5ucHIub3JnLzUxMDM2MC9wb2RjYXN0LnhtbD9zYz1nb29nbGVwb2RjYXN0cw",
"npr": "https://rpb3r.app.goo.gl/onourwatch",
"spotify": "https://open.spotify.com/show/0OLWoyizopu6tY1XiuX70x",
"tuneIn": "https://tunein.com/radio/On-Our-Watch-p1436229/",
"stitcher": "https://www.stitcher.com/show/on-our-watch",
"rss": "https://feeds.npr.org/510360/podcast.xml"
}
},
"on-the-media": {
"id": "on-the-media",
"title": "On The Media",
"info": "Our weekly podcast explores how the media 'sausage' is made, casts an incisive eye on fluctuations in the marketplace of ideas, and examines threats to the freedom of information and expression in America and abroad. For one hour a week, the show tries to lift the veil from the process of \"making media,\" especially news media, because it's through that lens that we see the world and the world sees us",
"airtime": "SUN 2pm-3pm, MON 12am-1am",
"imageSrc": "https://ww2.kqed.org/radio/wp-content/uploads/sites/50/2018/04/onTheMedia.png",
"officialWebsiteLink": "https://www.wnycstudios.org/shows/otm",
"meta": {
"site": "news",
"source": "wnyc"
},
"link": "/radio/program/on-the-media",
"subscribe": {
"apple": "https://itunes.apple.com/us/podcast/on-the-media/id73330715?mt=2",
"tuneIn": "https://tunein.com/radio/On-the-Media-p69/",
"rss": "http://feeds.wnyc.org/onthemedia"
}
},
"pbs-newshour": {
"id": "pbs-newshour",
"title": "PBS NewsHour",
"info": "Analysis, background reports and updates from the PBS NewsHour putting today's news in context.",
"airtime": "MON-FRI 3pm-4pm",
"imageSrc": "https://cdn.kqed.org/wp-content/uploads/2024/04/PBS-News-Hour-Podcast-Tile-360x360-1.jpg",
"officialWebsiteLink": "https://www.pbs.org/newshour/",
"meta": {
"site": "news",
"source": "pbs"
},
"link": "/radio/program/pbs-newshour",
"subscribe": {
"apple": "https://itunes.apple.com/us/podcast/pbs-newshour-full-show/id394432287?mt=2",
"tuneIn": "https://tunein.com/radio/PBS-NewsHour---Full-Show-p425698/",
"rss": "https://www.pbs.org/newshour/feeds/rss/podcasts/show"
}
},
"perspectives": {
"id": "perspectives",
"title": "Perspectives",
"tagline": "KQED's series of daily listener commentaries since 1991",
"info": "KQED's series of daily listener commentaries since 1991.",
"imageSrc": "https://cdn.kqed.org/wp-content/uploads/2025/01/Perspectives_Tile_Final.jpg",
"imageAlt": "KQED Perspectives",
"officialWebsiteLink": "/perspectives/",
"meta": {
"site": "radio",
"source": "kqed",
"order": 14
},
"link": "/perspectives",
"subscribe": {
"apple": "https://podcasts.apple.com/us/podcast/id73801135",
"npr": "https://www.npr.org/podcasts/432309616/perspectives",
"rss": "https://ww2.kqed.org/perspectives/category/perspectives/feed/",
"google": "https://podcasts.google.com/feed/aHR0cHM6Ly93dzIua3FlZC5vcmcvcGVyc3BlY3RpdmVzL2NhdGVnb3J5L3BlcnNwZWN0aXZlcy9mZWVkLw"
}
},
"planet-money": {
"id": "planet-money",
"title": "Planet Money",
"info": "The economy explained. Imagine you could call up a friend and say, Meet me at the bar and tell me what's going on with the economy. Now imagine that's actually a fun evening.",
"airtime": "SUN 3pm-4pm",
"imageSrc": "https://ww2.kqed.org/radio/wp-content/uploads/sites/50/2018/04/planetmoney.jpg",
"officialWebsiteLink": "https://www.npr.org/sections/money/",
"meta": {
"site": "news",
"source": "npr"
},
"link": "/radio/program/planet-money",
"subscribe": {
"npr": "https://rpb3r.app.goo.gl/M4f5",
"apple": "https://itunes.apple.com/us/podcast/planet-money/id290783428?mt=2",
"tuneIn": "https://tunein.com/podcasts/Business--Economics-Podcasts/Planet-Money-p164680/",
"rss": "https://feeds.npr.org/510289/podcast.xml"
}
},
"politicalbreakdown": {
"id": "politicalbreakdown",
"title": "Political Breakdown",
"tagline": "Politics from a personal perspective",
"info": "Political Breakdown is a new series that explores the political intersection of California and the nation. Each week hosts Scott Shafer and Marisa Lagos are joined with a new special guest to unpack politics -- with personality — and offer an insider’s glimpse at how politics happens.",
"airtime": "THU 6:30pm-7pm",
"imageSrc": "https://cdn.kqed.org/wp-content/uploads/2024/04/Political-Breakdown-2024-Podcast-Tile-703x703-1.jpg",
"imageAlt": "KQED Political Breakdown",
"officialWebsiteLink": "/podcasts/politicalbreakdown",
"meta": {
"site": "radio",
"source": "kqed",
"order": 5
},
"link": "/podcasts/politicalbreakdown",
"subscribe": {
"apple": "https://podcasts.apple.com/us/podcast/political-breakdown/id1327641087",
"amazon": "https://music.amazon.com/podcasts/e0c2d153-ad36-4c8d-901d-f1da6a724824/political-breakdown",
"npr": "https://www.npr.org/podcasts/572155894/political-breakdown",
"stitcher": "https://www.stitcher.com/podcast/kqed/political-breakdown",
"spotify": "https://open.spotify.com/show/07RVyIjIdk2WDuVehvBMoN",
"rss": "https://ww2.kqed.org/news/tag/political-breakdown/feed/podcast"
}
},
"possible": {
"id": "possible",
"title": "Possible",
"info": "Possible is hosted by entrepreneur Reid Hoffman and writer Aria Finger. Together in Possible, Hoffman and Finger lead enlightening discussions about building a brighter collective future. The show features interviews with visionary guests like Trevor Noah, Sam Altman and Janette Sadik-Khan. Possible paints an optimistic portrait of the world we can create through science, policy, business, art and our shared humanity. It asks: What if everything goes right for once? How can we get there? Each episode also includes a short fiction story generated by advanced AI GPT-4, serving as a thought-provoking springboard to speculate how humanity could leverage technology for good.",
"airtime": "SUN 2pm",
"imageSrc": "https://cdn.kqed.org/wp-content/uploads/2024/04/Possible-Podcast-Tile-360x360-1.jpg",
"officialWebsiteLink": "https://www.possible.fm/",
"meta": {
"site": "news",
"source": "Possible"
},
"link": "/radio/program/possible",
"subscribe": {
"apple": "https://podcasts.apple.com/us/podcast/possible/id1677184070",
"spotify": "https://open.spotify.com/show/730YpdUSNlMyPQwNnyjp4k"
}
},
"pri-the-world": {
"id": "pri-the-world",
"title": "PRI's The World: Latest Edition",
"info": "Each weekday, host Marco Werman and his team of producers bring you the world's most interesting stories in an hour of radio that reminds us just how small our planet really is.",
"airtime": "MON-FRI 2pm-3pm",
"imageSrc": "https://cdn.kqed.org/wp-content/uploads/2024/04/The-World-Podcast-Tile-360x360-1.jpg",
"officialWebsiteLink": "https://www.pri.org/programs/the-world",
"meta": {
"site": "news",
"source": "PRI"
},
"link": "/radio/program/pri-the-world",
"subscribe": {
"apple": "https://itunes.apple.com/us/podcast/pris-the-world-latest-edition/id278196007?mt=2",
"tuneIn": "https://tunein.com/podcasts/News--Politics-Podcasts/PRIs-The-World-p24/",
"rss": "http://feeds.feedburner.com/pri/theworld"
}
},
"radiolab": {
"id": "radiolab",
"title": "Radiolab",
"info": "A two-time Peabody Award-winner, Radiolab is an investigation told through sounds and stories, and centered around one big idea. In the Radiolab world, information sounds like music and science and culture collide. Hosted by Jad Abumrad and Robert Krulwich, the show is designed for listeners who demand skepticism, but appreciate wonder. WNYC Studios is the producer of other leading podcasts including Freakonomics Radio, Death, Sex & Money, On the Media and many more.",
"airtime": "SUN 12am-1am, SAT 2pm-3pm",
"imageSrc": "https://ww2.kqed.org/radio/wp-content/uploads/sites/50/2018/04/radiolab1400.png",
"officialWebsiteLink": "https://www.wnycstudios.org/shows/radiolab/",
"meta": {
"site": "science",
"source": "WNYC"
},
"link": "/radio/program/radiolab",
"subscribe": {
"apple": "https://itunes.apple.com/us/podcast/radiolab/id152249110?mt=2",
"tuneIn": "https://tunein.com/radio/RadioLab-p68032/",
"rss": "https://feeds.wnyc.org/radiolab"
}
},
"reveal": {
"id": "reveal",
"title": "Reveal",
"info": "Created by The Center for Investigative Reporting and PRX, Reveal is public radios first one-hour weekly radio show and podcast dedicated to investigative reporting. Credible, fact based and without a partisan agenda, Reveal combines the power and artistry of driveway moment storytelling with data-rich reporting on critically important issues. The result is stories that inform and inspire, arming our listeners with information to right injustices, hold the powerful accountable and improve lives.Reveal is hosted by Al Letson and showcases the award-winning work of CIR and newsrooms large and small across the nation. In a radio and podcast market crowded with choices, Reveal focuses on important and often surprising stories that illuminate the world for our listeners.",
"airtime": "SAT 4pm-5pm",
"imageSrc": "https://ww2.kqed.org/radio/wp-content/uploads/sites/50/2018/04/reveal300px.png",
"officialWebsiteLink": "https://www.revealnews.org/episodes/",
"meta": {
"site": "news",
"source": "npr"
},
"link": "/radio/program/reveal",
"subscribe": {
"apple": "https://itunes.apple.com/us/podcast/reveal/id886009669",
"tuneIn": "https://tunein.com/radio/Reveal-p679597/",
"rss": "http://feeds.revealradio.org/revealpodcast"
}
},
"rightnowish": {
"id": "rightnowish",
"title": "Rightnowish",
"tagline": "Art is where you find it",
"info": "Rightnowish digs into life in the Bay Area right now… ish. Journalist Pendarvis Harshaw takes us to galleries painted on the sides of liquor stores in West Oakland. We'll dance in warehouses in the Bayview, make smoothies with kids in South Berkeley, and listen to classical music in a 1984 Cutlass Supreme in Richmond. Every week, Pen talks to movers and shakers about how the Bay Area shapes what they create, and how they shape the place we call home.",
"imageSrc": "https://cdn.kqed.org/wp-content/uploads/2024/04/Rightnowish-Podcast-Tile-500x500-1.jpg",
"imageAlt": "KQED Rightnowish with Pendarvis Harshaw",
"officialWebsiteLink": "/podcasts/rightnowish",
"meta": {
"site": "arts",
"source": "kqed",
"order": 16
},
"link": "/podcasts/rightnowish",
"subscribe": {
"npr": "https://www.npr.org/podcasts/721590300/rightnowish",
"rss": "https://ww2.kqed.org/arts/programs/rightnowish/feed/podcast",
"apple": "https://podcasts.apple.com/us/podcast/rightnowish/id1482187648",
"stitcher": "https://www.stitcher.com/podcast/kqed/rightnowish",
"google": "https://podcasts.google.com/feed/aHR0cHM6Ly9mZWVkcy5tZWdhcGhvbmUuZm0vS1FJTkMxMjU5MTY3NDc4",
"spotify": "https://open.spotify.com/show/7kEJuafTzTVan7B78ttz1I"
}
},
"science-friday": {
"id": "science-friday",
"title": "Science Friday",
"info": "Science Friday is a weekly science talk show, broadcast live over public radio stations nationwide. Each week, the show focuses on science topics that are in the news and tries to bring an educated, balanced discussion to bear on the scientific issues at hand. Panels of expert guests join host Ira Flatow, a veteran science journalist, to discuss science and to take questions from listeners during the call-in portion of the program.",
"airtime": "FRI 11am-1pm",
"imageSrc": "https://cdn.kqed.org/wp-content/uploads/2024/04/Science-Friday-Podcast-Tile-360x360-1.jpg",
"officialWebsiteLink": "https://www.wnycstudios.org/shows/science-friday",
"meta": {
"site": "news",
"source": "npr"
},
"link": "/radio/program/science-friday",
"subscribe": {
"apple": "https://itunes.apple.com/WebObjects/MZStore.woa/wa/viewPodcast?s=143441&mt=2&id=73329284&at=11l79Y&ct=nprdirectory",
"tuneIn": "https://tunein.com/radio/Science-Friday-p394/",
"rss": "http://feeds.wnyc.org/science-friday"
}
},
"snap-judgment": {
"id": "snap-judgment",
"title": "Snap Judgment",
"tagline": "Real stories with killer beats",
"info": "The Snap Judgment radio show and podcast mixes real stories with killer beats to produce cinematic, dramatic radio. Snap's musical brand of storytelling dares listeners to see the world through the eyes of another. This is storytelling... with a BEAT!! Snap first aired on public radio stations nationwide in July 2010. Today, Snap Judgment airs on over 450 public radio stations and is brought to the airwaves by KQED & PRX.",
"airtime": "SAT 1pm-2pm, 9pm-10pm",
"imageSrc": "https://cdn.kqed.org/wp-content/uploads/2024/05/Snap-Judgment-Podcast-Tile-703x703-1.jpg",
"imageAlt": "KQED Snap Judgment",
"officialWebsiteLink": "https://snapjudgment.org",
"meta": {
"site": "arts",
"source": "kqed",
"order": 4
},
"link": "https://snapjudgment.org",
"subscribe": {
"apple": "https://podcasts.apple.com/us/podcast/snap-judgment/id283657561",
"npr": "https://www.npr.org/podcasts/449018144/snap-judgment",
"stitcher": "https://www.pandora.com/podcast/snap-judgment/PC:241?source=stitcher-sunset",
"spotify": "https://open.spotify.com/show/3Cct7ZWmxHNAtLgBTqjC5v",
"rss": "https://snap.feed.snapjudgment.org/"
}
},
"soldout": {
"id": "soldout",
"title": "SOLD OUT: Rethinking Housing in America",
"tagline": "A new future for housing",
"info": "Sold Out: Rethinking Housing in America",
"imageSrc": "https://cdn.kqed.org/wp-content/uploads/2024/04/Sold-Out-Podcast-Tile-703x703-1.jpg",
"imageAlt": "KQED Sold Out: Rethinking Housing in America",
"officialWebsiteLink": "/podcasts/soldout",
"meta": {
"site": "news",
"source": "kqed",
"order": 13
},
"link": "/podcasts/soldout",
"subscribe": {
"npr": "https://www.npr.org/podcasts/911586047/s-o-l-d-o-u-t-a-new-future-for-housing",
"apple": "https://podcasts.apple.com/us/podcast/introducing-sold-out-rethinking-housing-in-america/id1531354937",
"rss": "https://feeds.megaphone.fm/soldout",
"spotify": "https://open.spotify.com/show/38dTBSk2ISFoPiyYNoKn1X",
"stitcher": "https://www.stitcher.com/podcast/kqed/sold-out-rethinking-housing-in-america",
"tunein": "https://tunein.com/radio/SOLD-OUT-Rethinking-Housing-in-America-p1365871/"
}
},
"spooked": {
"id": "spooked",
"title": "Spooked",
"tagline": "True-life supernatural stories",
"info": "",
"imageSrc": "https://cdn.kqed.org/wp-content/uploads/2024/10/Spooked-Podcast-Tile-703x703-1.jpg",
"imageAlt": "KQED Spooked",
"officialWebsiteLink": "https://spookedpodcast.org/",
"meta": {
"site": "news",
"source": "kqed",
"order": 7
},
"link": "https://spookedpodcast.org/",
"subscribe": {
"apple": "https://podcasts.apple.com/us/podcast/spooked/id1279361017",
"npr": "https://www.npr.org/podcasts/549547848/snap-judgment-presents-spooked",
"spotify": "https://open.spotify.com/show/76571Rfl3m7PLJQZKQIGCT",
"rss": "https://feeds.simplecast.com/TBotaapn"
}
},
"tech-nation": {
"id": "tech-nation",
"title": "Tech Nation Radio Podcast",
"info": "Tech Nation is a weekly public radio program, hosted by Dr. Moira Gunn. Founded in 1993, it has grown from a simple interview show to a multi-faceted production, featuring conversations with noted technology and science leaders, and a weekly science and technology-related commentary.",
"airtime": "FRI 10pm",
"imageSrc": "https://cdn.kqed.org/wp-content/uploads/2024/04/Tech-Nation-Radio-Podcast-Tile-360x360-1.jpg",
"officialWebsiteLink": "http://technation.podomatic.com/",
"meta": {
"site": "science",
"source": "Tech Nation Media"
},
"link": "/radio/program/tech-nation",
"subscribe": {
"rss": "https://technation.podomatic.com/rss2.xml"
}
},
"ted-radio-hour": {
"id": "ted-radio-hour",
"title": "TED Radio Hour",
"info": "The TED Radio Hour is a journey through fascinating ideas, astonishing inventions, fresh approaches to old problems, and new ways to think and create.",
"airtime": "SUN 3pm-4pm, SAT 10pm-11pm",
"imageSrc": "https://ww2.kqed.org/radio/wp-content/uploads/sites/50/2018/04/tedRadioHour.jpg",
"officialWebsiteLink": "https://www.npr.org/programs/ted-radio-hour/?showDate=2018-06-22",
"meta": {
"site": "news",
"source": "npr"
},
"link": "/radio/program/ted-radio-hour",
"subscribe": {
"npr": "https://rpb3r.app.goo.gl/8vsS",
"apple": "https://itunes.apple.com/WebObjects/MZStore.woa/wa/viewPodcast?s=143441&mt=2&id=523121474&at=11l79Y&ct=nprdirectory",
"tuneIn": "https://tunein.com/radio/TED-Radio-Hour-p418021/",
"rss": "https://feeds.npr.org/510298/podcast.xml"
}
},
"thebay": {
"id": "thebay",
"title": "The Bay",
"tagline": "Local news to keep you rooted",
"info": "Host Devin Katayama walks you through the biggest story of the day with reporters and newsmakers.",
"imageSrc": "https://cdn.kqed.org/wp-content/uploads/2024/04/The-Bay-Podcast-Tile-703x703-1.jpg",
"imageAlt": "KQED The Bay",
"officialWebsiteLink": "/podcasts/thebay",
"meta": {
"site": "radio",
"source": "kqed",
"order": 2
},
"link": "/podcasts/thebay",
"subscribe": {
"apple": "https://podcasts.apple.com/us/podcast/the-bay/id1350043452",
"amazon": "https://music.amazon.com/podcasts/d800ea4c-7a2c-42f2-b861-edaf78a5db0b/the-bay",
"npr": "https://www.npr.org/podcasts/586725995/the-bay",
"stitcher": "https://www.stitcher.com/podcast/kqed/the-bay",
"spotify": "https://open.spotify.com/show/4BIKBKIujizLHlIlBNaAqQ",
"rss": "https://feeds.megaphone.fm/KQINC8259786327"
}
},
"thelatest": {
"id": "thelatest",
"title": "The Latest",
"tagline": "Trusted local news in real time",
"info": "",
"imageSrc": "https://cdn.kqed.org/wp-content/uploads/2025/05/The-Latest-2025-Podcast-Tile-703x703-1.jpg",
"imageAlt": "KQED The Latest",
"officialWebsiteLink": "/thelatest",
"meta": {
"site": "news",
"source": "kqed",
"order": 6
},
"link": "/thelatest",
"subscribe": {
"apple": "https://podcasts.apple.com/us/podcast/the-latest-from-kqed/id1197721799",
"npr": "https://www.npr.org/podcasts/1257949365/the-latest-from-k-q-e-d",
"spotify": "https://open.spotify.com/show/5KIIXMgM9GTi5AepwOYvIZ?si=bd3053fec7244dba",
"rss": "https://feeds.megaphone.fm/KQINC9137121918"
}
},
"theleap": {
"id": "theleap",
"title": "The Leap",
"tagline": "What if you closed your eyes, and jumped?",
"info": "Stories about people making dramatic, risky changes, told by award-winning public radio reporter Judy Campbell.",
"imageSrc": "https://cdn.kqed.org/wp-content/uploads/2024/04/The-Leap-Podcast-Tile-703x703-1.jpg",
"imageAlt": "KQED The Leap",
"officialWebsiteLink": "/podcasts/theleap",
"meta": {
"site": "news",
"source": "kqed",
"order": 17
},
"link": "/podcasts/theleap",
"subscribe": {
"apple": "https://podcasts.apple.com/us/podcast/the-leap/id1046668171",
"npr": "https://www.npr.org/podcasts/447248267/the-leap",
"stitcher": "https://www.stitcher.com/podcast/kqed/the-leap",
"spotify": "https://open.spotify.com/show/3sSlVHHzU0ytLwuGs1SD1U",
"rss": "https://ww2.kqed.org/news/programs/the-leap/feed/podcast"
}
},
"the-moth-radio-hour": {
"id": "the-moth-radio-hour",
"title": "The Moth Radio Hour",
"info": "Since its launch in 1997, The Moth has presented thousands of true stories, told live and without notes, to standing-room-only crowds worldwide. Moth storytellers stand alone, under a spotlight, with only a microphone and a roomful of strangers. The storyteller and the audience embark on a high-wire act of shared experience which is both terrifying and exhilarating. Since 2008, The Moth podcast has featured many of our favorite stories told live on Moth stages around the country. For information on all of our programs and live events, visit themoth.org.",
"airtime": "SAT 8pm-9pm and SUN 11am-12pm",
"imageSrc": "https://ww2.kqed.org/radio/wp-content/uploads/sites/50/2018/04/theMoth.jpg",
"officialWebsiteLink": "https://themoth.org/",
"meta": {
"site": "arts",
"source": "prx"
},
"link": "/radio/program/the-moth-radio-hour",
"subscribe": {
"apple": "https://itunes.apple.com/us/podcast/the-moth-podcast/id275699983?mt=2",
"tuneIn": "https://tunein.com/radio/The-Moth-p273888/",
"rss": "http://feeds.themoth.org/themothpodcast"
}
},
"the-new-yorker-radio-hour": {
"id": "the-new-yorker-radio-hour",
"title": "The New Yorker Radio Hour",
"info": "The New Yorker Radio Hour is a weekly program presented by the magazine's editor, David Remnick, and produced by WNYC Studios and The New Yorker. Each episode features a diverse mix of interviews, profiles, storytelling, and an occasional burst of humor inspired by the magazine, and shaped by its writers, artists, and editors. This isn't a radio version of a magazine, but something all its own, reflecting the rich possibilities of audio storytelling and conversation. Theme music for the show was composed and performed by Merrill Garbus of tUnE-YArDs.",
"airtime": "SAT 10am-11am",
"imageSrc": "https://cdn.kqed.org/wp-content/uploads/2024/04/The-New-Yorker-Podcast-Tile-360x360-1.jpg",
"officialWebsiteLink": "https://www.wnycstudios.org/shows/tnyradiohour",
"meta": {
"site": "arts",
"source": "WNYC"
},
"link": "/radio/program/the-new-yorker-radio-hour",
"subscribe": {
"apple": "https://itunes.apple.com/us/podcast/id1050430296",
"tuneIn": "https://tunein.com/podcasts/WNYC-Podcasts/New-Yorker-Radio-Hour-p803804/",
"rss": "https://feeds.feedburner.com/newyorkerradiohour"
}
},
"the-sam-sanders-show": {
"id": "the-sam-sanders-show",
"title": "The Sam Sanders Show",
"info": "One of public radio's most dynamic voices, Sam Sanders helped launch The NPR Politics Podcast and hosted NPR's hit show It's Been A Minute. Now, the award-winning host returns with something brand new, The Sam Sanders Show. Every week, Sam Sanders and friends dig into the culture that shapes our lives: what's driving the biggest trends, how artists really think, and even the memes you can't stop scrolling past. Sam is beloved for his way of unpacking the world and bringing you up close to fresh currents and engaging conversations. The Sam Sanders Show is smart, funny and always a good time.",
"airtime": "FRI 12-1pm AND SAT 11am-12pm",
"imageSrc": "https://cdn.kqed.org/wp-content/uploads/2025/11/The-Sam-Sanders-Show-Podcast-Tile-400x400-1.jpg",
"officialWebsiteLink": "https://www.kcrw.com/shows/the-sam-sanders-show/latest",
"meta": {
"site": "arts",
"source": "KCRW"
},
"link": "https://www.kcrw.com/shows/the-sam-sanders-show/latest",
"subscribe": {
"rss": "https://feed.cdnstream1.com/zjb/feed/download/ac/28/59/ac28594c-e1d0-4231-8728-61865cdc80e8.xml"
}
},
"the-splendid-table": {
"id": "the-splendid-table",
"title": "The Splendid Table",
"info": "\u003cem>The Splendid Table\u003c/em> hosts our nation's conversations about cooking, sustainability and food culture.",
"imageSrc": "https://cdn.kqed.org/wp-content/uploads/2024/04/The-Splendid-Table-Podcast-Tile-360x360-1.jpg",
"officialWebsiteLink": "https://www.splendidtable.org/",
"airtime": "SUN 10-11 pm",
"meta": {
"site": "radio",
"source": "npr"
},
"link": "/radio/program/the-splendid-table"
},
"this-american-life": {
"id": "this-american-life",
"title": "This American Life",
"info": "This American Life is a weekly public radio show, heard by 2.2 million people on more than 500 stations. Another 2.5 million people download the weekly podcast. It is hosted by Ira Glass, produced in collaboration with Chicago Public Media, delivered to stations by PRX The Public Radio Exchange, and has won all of the major broadcasting awards.",
"airtime": "SAT 12pm-1pm, 7pm-8pm",
"imageSrc": "https://ww2.kqed.org/radio/wp-content/uploads/sites/50/2018/04/thisAmericanLife.png",
"officialWebsiteLink": "https://www.thisamericanlife.org/",
"meta": {
"site": "news",
"source": "wbez"
},
"link": "/radio/program/this-american-life",
"subscribe": {
"apple": "https://itunes.apple.com/WebObjects/MZStore.woa/wa/viewPodcast?s=143441&mt=2&id=201671138&at=11l79Y&ct=nprdirectory",
"rss": "https://www.thisamericanlife.org/podcast/rss.xml"
}
},
"tinydeskradio": {
"id": "tinydeskradio",
"title": "Tiny Desk Radio",
"info": "We're bringing the best of Tiny Desk to the airwaves, only on public radio.",
"airtime": "SUN 8pm and SAT 9pm",
"imageSrc": "https://cdn.kqed.org/wp-content/uploads/2025/04/300x300-For-Member-Station-Logo-Tiny-Desk-Radio-@2x.png",
"officialWebsiteLink": "https://www.npr.org/series/g-s1-52030/tiny-desk-radio",
"meta": {
"site": "news",
"source": "npr"
},
"link": "/radio/program/tinydeskradio",
"subscribe": {
"rss": "https://feeds.npr.org/g-s1-52030/rss.xml"
}
},
"wait-wait-dont-tell-me": {
"id": "wait-wait-dont-tell-me",
"title": "Wait Wait... Don't Tell Me!",
"info": "Peter Sagal and Bill Kurtis host the weekly NPR News quiz show alongside some of the best and brightest news and entertainment personalities.",
"airtime": "SUN 10am-11am, SAT 11am-12pm, SAT 6pm-7pm",
"imageSrc": "https://cdn.kqed.org/wp-content/uploads/2024/04/Wait-Wait-Podcast-Tile-300x300-1.jpg",
"officialWebsiteLink": "https://www.npr.org/programs/wait-wait-dont-tell-me/",
"meta": {
"site": "news",
"source": "npr"
},
"link": "/radio/program/wait-wait-dont-tell-me",
"subscribe": {
"npr": "https://rpb3r.app.goo.gl/Xogv",
"apple": "https://itunes.apple.com/WebObjects/MZStore.woa/wa/viewPodcast?s=143441&mt=2&id=121493804&at=11l79Y&ct=nprdirectory",
"tuneIn": "https://tunein.com/radio/Wait-Wait-Dont-Tell-Me-p46/",
"rss": "https://feeds.npr.org/344098539/podcast.xml"
}
},
"weekend-edition-saturday": {
"id": "weekend-edition-saturday",
"title": "Weekend Edition Saturday",
"info": "Weekend Edition Saturday wraps up the week's news and offers a mix of analysis and features on a wide range of topics, including arts, sports, entertainment, and human interest stories. The two-hour program is hosted by NPR's Peabody Award-winning Scott Simon.",
"airtime": "SAT 5am-10am",
"imageSrc": "https://cdn.kqed.org/wp-content/uploads/2024/04/Weekend-Edition-Podcast-Tile-360x360-1.jpg",
"officialWebsiteLink": "https://www.npr.org/programs/weekend-edition-saturday/",
"meta": {
"site": "news",
"source": "npr"
},
"link": "/radio/program/weekend-edition-saturday"
},
"weekend-edition-sunday": {
"id": "weekend-edition-sunday",
"title": "Weekend Edition Sunday",
"info": "Weekend Edition Sunday features interviews with newsmakers, artists, scientists, politicians, musicians, writers, theologians and historians. The program has covered news events from Nelson Mandela's 1990 release from a South African prison to the capture of Saddam Hussein.",
"airtime": "SUN 5am-10am",
"imageSrc": "https://cdn.kqed.org/wp-content/uploads/2024/04/Weekend-Edition-Podcast-Tile-360x360-1.jpg",
"officialWebsiteLink": "https://www.npr.org/programs/weekend-edition-sunday/",
"meta": {
"site": "news",
"source": "npr"
},
"link": "/radio/program/weekend-edition-sunday"
}
},
"racesReducer": {},
"racesGenElectionReducer": {},
"racesGenElection2026Reducer": {},
"radioSchedulesReducer": {},
"listsReducer": {},
"recallGuideReducer": {
"intros": {},
"policy": {},
"candidates": {}
},
"savedArticleReducer": {
"articles": [],
"status": {}
},
"newslettersReducer": {
"isFetching": false,
"fetchFailed": false,
"hasFetched": false,
"newsletters": {},
"isSubscribing": false,
"isUnsubscribing": false,
"subscribedNewsletters": {}
},
"termsReducer": {
"about": {
"name": "About",
"type": "terms",
"id": "about",
"slug": "about",
"link": "/about",
"taxonomy": "site"
},
"arts": {
"name": "Arts & Culture",
"grouping": [
"arts",
"pop",
"trulyca"
],
"description": "KQED Arts provides daily in-depth coverage of the Bay Area's music, art, film, performing arts, literature and arts news, as well as cultural commentary and criticism.",
"type": "terms",
"id": "arts",
"slug": "arts",
"link": "/arts",
"taxonomy": "site"
},
"artschool": {
"name": "Art School",
"parent": "arts",
"type": "terms",
"id": "artschool",
"slug": "artschool",
"link": "/artschool",
"taxonomy": "site"
},
"bayareabites": {
"name": "KQED food",
"grouping": [
"food",
"bayareabites",
"checkplease"
],
"parent": "food",
"type": "terms",
"id": "bayareabites",
"slug": "bayareabites",
"link": "/food",
"taxonomy": "site"
},
"bayareahiphop": {
"name": "Bay Area Hiphop",
"type": "terms",
"id": "bayareahiphop",
"slug": "bayareahiphop",
"link": "/bayareahiphop",
"taxonomy": "site"
},
"campaign21": {
"name": "Campaign 21",
"type": "terms",
"id": "campaign21",
"slug": "campaign21",
"link": "/campaign21",
"taxonomy": "site"
},
"careers": {
"name": "Careers",
"type": "terms",
"id": "careers",
"slug": "careers",
"link": "/careers",
"taxonomy": "site"
},
"checkplease": {
"name": "KQED food",
"grouping": [
"food",
"bayareabites",
"checkplease"
],
"parent": "food",
"type": "terms",
"id": "checkplease",
"slug": "checkplease",
"link": "/food",
"taxonomy": "site"
},
"education": {
"name": "Education",
"grouping": [
"education"
],
"type": "terms",
"id": "education",
"slug": "education",
"link": "/education",
"taxonomy": "site"
},
"elections": {
"name": "Elections",
"type": "terms",
"id": "elections",
"slug": "elections",
"link": "/elections",
"taxonomy": "site"
},
"events": {
"name": "Events",
"type": "terms",
"id": "events",
"slug": "events",
"link": "/events",
"taxonomy": "site"
},
"event": {
"name": "Event",
"alias": "events",
"type": "terms",
"id": "event",
"slug": "event",
"link": "/event",
"taxonomy": "site"
},
"filmschoolshorts": {
"name": "Film School Shorts",
"type": "terms",
"id": "filmschoolshorts",
"slug": "filmschoolshorts",
"link": "/filmschoolshorts",
"taxonomy": "site"
},
"food": {
"name": "KQED food",
"grouping": [
"food",
"bayareabites",
"checkplease"
],
"type": "terms",
"id": "food",
"slug": "food",
"link": "/food",
"taxonomy": "site"
},
"forum": {
"name": "Forum",
"relatedContentQuery": "posts/forum?",
"parent": "news",
"type": "terms",
"id": "forum",
"slug": "forum",
"link": "/forum",
"taxonomy": "site"
},
"futureofyou": {
"name": "Future of You",
"grouping": [
"science",
"futureofyou"
],
"parent": "science",
"type": "terms",
"id": "futureofyou",
"slug": "futureofyou",
"link": "/futureofyou",
"taxonomy": "site"
},
"jpepinheart": {
"name": "KQED food",
"relatedContentQuery": "posts/food,bayareabites,checkplease",
"parent": "food",
"type": "terms",
"id": "jpepinheart",
"slug": "jpepinheart",
"link": "/food",
"taxonomy": "site"
},
"liveblog": {
"name": "Live Blog",
"type": "terms",
"id": "liveblog",
"slug": "liveblog",
"link": "/liveblog",
"taxonomy": "site"
},
"livetv": {
"name": "Live TV",
"parent": "tv",
"type": "terms",
"id": "livetv",
"slug": "livetv",
"link": "/livetv",
"taxonomy": "site"
},
"lowdown": {
"name": "The Lowdown",
"relatedContentQuery": "posts/lowdown?",
"parent": "news",
"type": "terms",
"id": "lowdown",
"slug": "lowdown",
"link": "/lowdown",
"taxonomy": "site"
},
"mindshift": {
"name": "Mindshift",
"parent": "news",
"description": "MindShift explores the future of education by highlighting the innovative – and sometimes counterintuitive – ways educators and parents are helping all children succeed.",
"type": "terms",
"id": "mindshift",
"slug": "mindshift",
"link": "/mindshift",
"taxonomy": "site"
},
"news": {
"name": "News",
"grouping": [
"news",
"forum"
],
"type": "terms",
"id": "news",
"slug": "news",
"link": "/news",
"taxonomy": "site"
},
"newsletters": {
"name": "newsletters",
"type": "terms",
"id": "newsletters",
"slug": "newsletters",
"link": "/newsletters",
"taxonomy": "site"
},
"perspectives": {
"name": "Perspectives",
"parent": "radio",
"type": "terms",
"id": "perspectives",
"slug": "perspectives",
"link": "/perspectives",
"taxonomy": "site"
},
"podcasts": {
"name": "Podcasts",
"type": "terms",
"id": "podcasts",
"slug": "podcasts",
"link": "/podcasts",
"taxonomy": "site"
},
"pop": {
"name": "Pop",
"parent": "arts",
"type": "terms",
"id": "pop",
"slug": "pop",
"link": "/pop",
"taxonomy": "site"
},
"pressroom": {
"name": "Pressroom",
"type": "terms",
"id": "pressroom",
"slug": "pressroom",
"link": "/pressroom",
"taxonomy": "site"
},
"quest": {
"name": "Quest",
"parent": "science",
"type": "terms",
"id": "quest",
"slug": "quest",
"link": "/quest",
"taxonomy": "site"
},
"radio": {
"name": "Radio",
"grouping": [
"forum",
"perspectives"
],
"description": "Listen to KQED Public Radio – home of Forum and The California Report – on 88.5 FM in San Francisco, 89.3 FM in Sacramento, 88.3 FM in Santa Rosa and 88.1 FM in Martinez.",
"type": "terms",
"id": "radio",
"slug": "radio",
"link": "/radio",
"taxonomy": "site"
},
"root": {
"name": "KQED",
"image": "https://ww2.kqed.org/app/uploads/2020/02/KQED-OG-Image@1x.png",
"imageWidth": 1200,
"imageHeight": 630,
"headData": {
"title": "KQED | News, Radio, Podcasts, TV | Public Media for Northern California",
"description": "KQED provides public radio, television, and independent reporting on issues that matter to the Bay Area. We’re the NPR and PBS member station for Northern California."
},
"type": "terms",
"id": "root",
"slug": "root",
"link": "/root",
"taxonomy": "site"
},
"science": {
"name": "Science",
"grouping": [
"science",
"futureofyou"
],
"description": "KQED Science brings you award-winning science and environment coverage from the Bay Area and beyond.",
"type": "terms",
"id": "science",
"slug": "science",
"link": "/science",
"taxonomy": "site"
},
"stateofhealth": {
"name": "State of Health",
"parent": "science",
"type": "terms",
"id": "stateofhealth",
"slug": "stateofhealth",
"link": "/stateofhealth",
"taxonomy": "site"
},
"support": {
"name": "Support",
"type": "terms",
"id": "support",
"slug": "support",
"link": "/support",
"taxonomy": "site"
},
"thedolist": {
"name": "The Do List",
"parent": "arts",
"type": "terms",
"id": "thedolist",
"slug": "thedolist",
"link": "/thedolist",
"taxonomy": "site"
},
"trulyca": {
"name": "Truly CA",
"grouping": [
"arts",
"pop",
"trulyca"
],
"parent": "arts",
"type": "terms",
"id": "trulyca",
"slug": "trulyca",
"link": "/trulyca",
"taxonomy": "site"
},
"tv": {
"name": "TV",
"type": "terms",
"id": "tv",
"slug": "tv",
"link": "/tv",
"taxonomy": "site"
},
"voterguide": {
"name": "Voter Guide",
"parent": "elections",
"alias": "elections",
"type": "terms",
"id": "voterguide",
"slug": "voterguide",
"link": "/voterguide",
"taxonomy": "site"
},
"guiaelectoral": {
"name": "Guia Electoral",
"parent": "elections",
"alias": "elections",
"type": "terms",
"id": "guiaelectoral",
"slug": "guiaelectoral",
"link": "/guiaelectoral",
"taxonomy": "site"
},
"source_news_11666412": {
"type": "terms",
"id": "source_news_11666412",
"meta": {
"override": true
},
"name": "Peninsula Press",
"link": "http://peninsulapress.com/",
"isLoading": false
},
"news_72": {
"type": "terms",
"id": "news_72",
"meta": {
"index": "terms_1716263798",
"site": "news",
"id": "72",
"found": true
},
"relationships": {},
"featImg": "https://ww2.kqed.org/app/uploads/sites/10/2014/10/TCR-2-Logo-Web-Banners-03.png",
"name": "The California Report",
"description": null,
"taxonomy": "program",
"headData": {
"twImgId": null,
"twTitle": null,
"ogTitle": null,
"ogImgId": null,
"twDescription": null,
"description": null,
"title": "The California Report Archives | KQED News",
"ogDescription": null
},
"ttid": 6969,
"slug": "the-california-report",
"isLoading": false,
"link": "/news/program/the-california-report"
},
"news_34165": {
"type": "terms",
"id": "news_34165",
"meta": {
"index": "terms_1716263798",
"site": "news",
"id": "34165",
"found": true
},
"relationships": {},
"name": "Climate",
"slug": "climate",
"taxonomy": "category",
"description": null,
"featImg": null,
"headData": {
"title": "Climate Archives | KQED News",
"description": null,
"ogTitle": null,
"ogDescription": null,
"ogImgId": null,
"twTitle": null,
"twDescription": null,
"twImgId": null
},
"ttid": 34182,
"isLoading": false,
"link": "/news/category/climate"
},
"news_19906": {
"type": "terms",
"id": "news_19906",
"meta": {
"index": "terms_1716263798",
"site": "news",
"id": "19906",
"found": true
},
"relationships": {},
"featImg": null,
"name": "Environment",
"description": null,
"taxonomy": "category",
"headData": {
"twImgId": null,
"twTitle": null,
"ogTitle": null,
"ogImgId": null,
"twDescription": null,
"description": null,
"title": "Environment Archives | KQED News",
"ogDescription": null
},
"ttid": 19923,
"slug": "environment",
"isLoading": false,
"link": "/news/category/environment"
},
"news_457": {
"type": "terms",
"id": "news_457",
"meta": {
"index": "terms_1716263798",
"site": "news",
"id": "457",
"found": true
},
"relationships": {},
"featImg": null,
"name": "Health",
"description": null,
"taxonomy": "category",
"headData": {
"twImgId": null,
"twTitle": null,
"ogTitle": null,
"ogImgId": null,
"twDescription": null,
"description": null,
"title": "Health Archives | KQED News",
"ogDescription": null
},
"ttid": 16998,
"slug": "health",
"isLoading": false,
"link": "/news/category/health"
},
"news_8": {
"type": "terms",
"id": "news_8",
"meta": {
"index": "terms_1716263798",
"site": "news",
"id": "8",
"found": true
},
"relationships": {},
"featImg": null,
"name": "News",
"description": null,
"taxonomy": "category",
"headData": {
"twImgId": null,
"twTitle": null,
"ogTitle": null,
"ogImgId": null,
"twDescription": null,
"description": null,
"title": "News Archives | KQED News",
"ogDescription": null
},
"ttid": 8,
"slug": "news",
"isLoading": false,
"link": "/news/category/news"
},
"news_356": {
"type": "terms",
"id": "news_356",
"meta": {
"index": "terms_1716263798",
"site": "news",
"id": "356",
"found": true
},
"relationships": {},
"featImg": null,
"name": "Science",
"description": null,
"taxonomy": "category",
"headData": {
"twImgId": null,
"twTitle": null,
"ogTitle": null,
"ogImgId": null,
"twDescription": null,
"description": null,
"title": "Science Archives | KQED News",
"ogDescription": null
},
"ttid": 364,
"slug": "science",
"isLoading": false,
"link": "/news/category/science"
},
"news_2036": {
"type": "terms",
"id": "news_2036",
"meta": {
"index": "terms_1716263798",
"site": "news",
"id": "2036",
"found": true
},
"relationships": {},
"featImg": null,
"name": "air pollution",
"description": null,
"taxonomy": "tag",
"headData": {
"twImgId": null,
"twTitle": null,
"ogTitle": null,
"ogImgId": null,
"twDescription": null,
"description": null,
"title": "air pollution Archives | KQED News",
"ogDescription": null
},
"ttid": 2051,
"slug": "air-pollution",
"isLoading": false,
"link": "/news/tag/air-pollution"
},
"news_255": {
"type": "terms",
"id": "news_255",
"meta": {
"index": "terms_1716263798",
"site": "news",
"id": "255",
"found": true
},
"relationships": {},
"featImg": null,
"name": "climate change",
"description": null,
"taxonomy": "tag",
"headData": {
"twImgId": null,
"twTitle": null,
"ogTitle": null,
"ogImgId": null,
"twDescription": null,
"description": null,
"title": "climate change Archives | KQED News",
"ogDescription": null
},
"ttid": 263,
"slug": "climate-change",
"isLoading": false,
"link": "/news/tag/climate-change"
},
"news_5933": {
"type": "terms",
"id": "news_5933",
"meta": {
"index": "terms_1716263798",
"site": "news",
"id": "5933",
"found": true
},
"relationships": {},
"featImg": null,
"name": "Peninsula Press",
"description": null,
"taxonomy": "affiliate",
"headData": {
"twImgId": null,
"twTitle": null,
"ogTitle": null,
"ogImgId": null,
"twDescription": null,
"description": null,
"title": "Peninsula Press Archives | KQED Arts",
"ogDescription": null
},
"ttid": 7088,
"slug": "peninsula-press",
"isLoading": false,
"link": "/news/affiliate/peninsula-press"
}
},
"userPermissionsReducer": {
"wpLoggedIn": false
},
"eventsReducer": {},
"fssReducer": {},
"tvDailyScheduleReducer": {},
"tvWeeklyScheduleReducer": {},
"tvPrimetimeScheduleReducer": {},
"tvMonthlyScheduleReducer": {},
"userAccountReducer": {
"user": {
"email": null,
"emailStatus": "EMAIL_UNVALIDATED",
"loggedStatus": "LOGGED_OUT",
"loggingChecked": false,
"articles": [],
"firstName": null,
"lastName": null,
"phoneNumber": null,
"fetchingMembership": false,
"membershipError": false,
"memberships": [
{
"id": null,
"startDate": null,
"firstName": null,
"lastName": null,
"familyNumber": null,
"memberNumber": null,
"memberSince": null,
"expirationDate": null,
"pfsEligible": false,
"isSustaining": false,
"membershipLevel": "Prospect",
"membershipStatus": "Non Member",
"lastGiftDate": null,
"renewalDate": null,
"lastDonationAmount": null
}
]
},
"authModal": {
"isOpen": false,
"view": "LANDING_VIEW"
},
"error": null
},
"youthMediaReducer": {},
"checkPleaseReducer": {
"filterData": {
"region": {
"key": "Restaurant Region",
"filters": [
"Any Region"
]
},
"cuisine": {
"key": "Restaurant Cuisine",
"filters": [
"Any Cuisine"
]
}
},
"restaurantDataById": {},
"restaurantIdsSorted": [],
"error": null
},
"userAgentReducer": {
"userAgent": "Mozilla/5.0 AppleWebKit/537.36 (KHTML, like Gecko; compatible; ClaudeBot/1.0; +claudebot@anthropic.com)",
"isBot": true
}
}