upper waypoint

Engage the Issues with Your Students by Creating an Interactive Election Guide

Save ArticleSave Article
Failed to save article

Please try again

Elections are one of the best ways to teach politics and government. I also tell my students that my government class is a user’s guide on how to make the best use of the government. Every two years in the fall, I combine these two ideas by having my class create an interactive voters guide. This year however, our principal upped the ante by challenging every student to be involved in our school’s Fall Showcase.

Let me back up a bit. This is my eighth year teaching at Minarets High School in the Sierra Foothills just outside of Yosemite. We were founded as a project-based, 1:1 laptop school. Another difference with our school is that we have a Fall Showcase instead of Back to School Night. Normally, select students present their best projects of the new school year to the parents and other adults attending the Showcase. It’s a great way for the students to make their projects public. Usually, the Showcase was scheduled earlier in the year, but this year with our principal’s challenge to involve every student in the Showcase it was scheduled close to election day. There was only one thing to do: roll out our election guide for the Showcase!

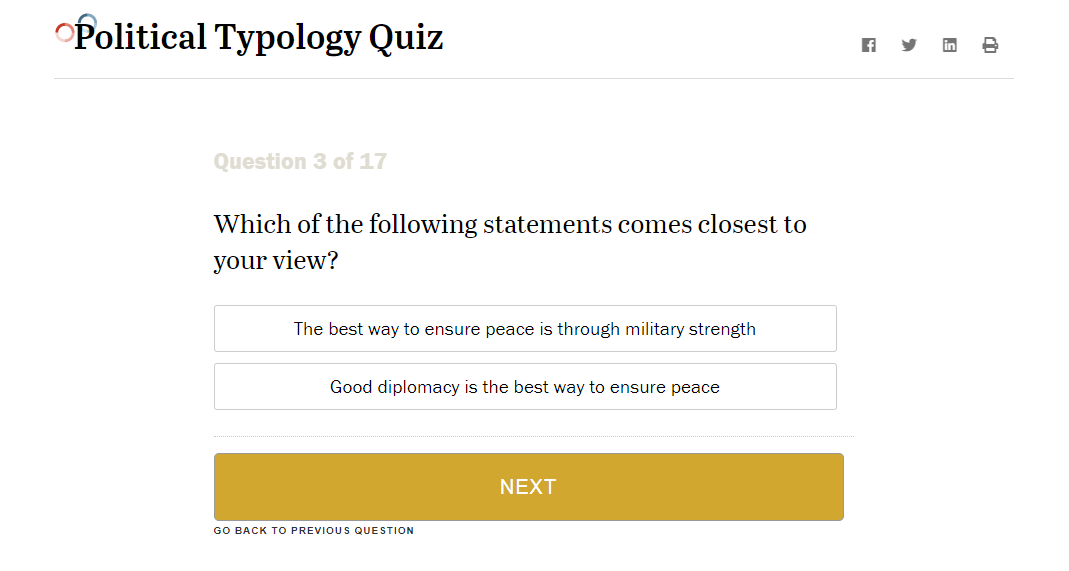
The first step in our process of preparing the election guide is to get a good understanding of the parties and issues. I start by giving my students a couple of different interactive surveys to give them a taste of all the different issues and how the different parties align themselves with those issues. Our first survey is the Pew Center for the People and the Press Political Typology Survey. It asks questions across a wide range of issues, but survey-takers only have two choices and are supposed to select the answer that is closest to their view. Many students complain that they’d like more choices and that their views are not being represented. I tell them that they often have only two choices in American politics and they need to make what they feel is the better choice. At the end of the survey they are given a label of their political type that explains where they fit on the political spectrum.  

Once they have been categorized, I have my students answer a set of writing prompts to help them reflect and make sense of the results of the survey, which includes questions like:

  1. How accurate is your label? Why?
  2. Were there any particular questions that were hard to answer with the choices given? Which ones were they? Why were they hard?

The quiz also provides a breakdown of all the questions and how they fit into the major current issues, which allows my students to understand how and why they were typed.

Sponsored

From there we move on to I Side With, which is a much more detailed and nuanced survey with multiple answers to each question and the ability for students to create their own answers. Each question also has links beneath it to “Learn More,” “Discuss,” “Stats” and “News,” which allows students to research their own answers and develop a greater understanding of the issues. There is also a slider under each set of choices to allow the students to rate how important this question is to them. There are 13 different sets of issues like National Security, Transportation, Environmental and Local with questions on our state and federal races. Once the students have answered the questions they get a rating that matches them by percentage with eight different parties. From there the students can see how their answers and the different parties fall on a spectrum in relation to the different sets of political issues included in the quiz.  Students can also see their answers in the context of other political spectrums, ideologies or classification systems like Keynesian versus Laissez-Faire and Left Wing versus Right Wing.

After taking the “I Side With” survey, students answer another set of questions to help them make sense of what what this all means:

  1. How did this survey compare to the other survey?
  2. Did you like these questions better or worse than the other survey? Why?
  3. Do you agree or disagree with the ideology you were matched with? Why?

The two surveys and responding to the writing prompts take the bulk of one class period.

From there we turn to the issues. I am of the firm belief that students and adults need to be aware of which issues are most important to them so that they can use those issues as a prism through which to view different candidates and propositions. With a greater understanding of the political landscape and how they fit into it under their belt from the previous day’s quizzes and discussions, my AP Government students used KQED’s Voter Guide as a template and built our own major issues guide.

For ten issues, my students created a quick definition of each issue, found the “official” Democratic and Republican stances on that issue, wrote a quick summary of that stance and included a graphic which illustrated how the United States viewed that issue.

Using the guide they created, students then choose their three most important issues through which to judge the candidates and the propositions in the election on November 6. One more set of writing prompts helps them clarify their choice of issues and their stance.

Now that we have our issue guide created, it’s time to work on the local election guide, which gives a breakdown of the candidates and propositions on our local ballot.  We create a website with a page for each candidate or proposition on the ballot. For each page, my students need to find the official website for each candidate or the pro and con site for the propositions. They are also asked to find endorsements from the Fresno Bee, the San Francisco Chronicle and KQED. Finally, they are asked to find as much multimedia as they can. They are to look for mailers, print or internet ads, as well as TV ads and link it all to the website.

How do we decide who does what? I put three people in charge of each ballot issue and have students divide themselves up into writer/editor, producer and researcher roles with clear responsibilities. The writer/editor is in charge of all the text and proofreading. The producer is in charge of the visuals, multimedia and how the page fits the template. The researcher is the main go-getter in finding text, images and media while also putting together the bibliography. There are always a few issues that are left over and I give those out to kids who want extra credit.

In the past, the students were encouraged to share the website with their families, and they used the guide themselves when we conducted our own mock election at school for the seniors. Of course the handful of students who are eligible to vote are expected to use it!  I use it, too. I remember pulling out my phone in the polling booth in 2016 to make sure I was voting correctly on a proposition!

This year with our Fall Showcase we are going to have laptops set up around the perimeter of the room displaying different pages from our website. At each laptop one of the students who created that page will be there to present and explain the proposition or candidate it focuses on, and the different media on the page. We will have about 80 students involved in our part of the Showcase, and we’ll be helping our community vote in an educated manner.  We are also going to put the guide up on the school’s Facebook page to help the public at large when it comes time to vote.

Sponsored

Editor’s Note: For more about about how young people can get involved in the political process, see our blog post on Election Resources for Teaching and Learning.

lower waypoint
next waypoint