Accessible DEI Table TestingAccessible DEI Table Testing
Listen to VoiceOver screenreader recording
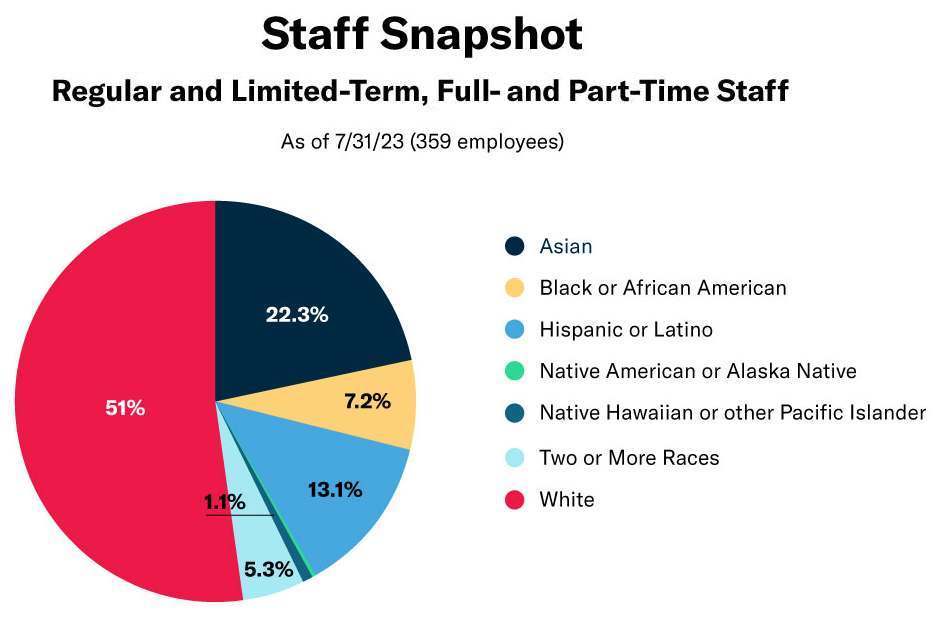
| Percentage of staff | |
|---|---|
| Asian | 22.3% |
| Black or African American | 7.2% |
| Hispanic or Latino | 13.1% |
| Native American or Alaska Native | .3% |
| Native Hawaiian or Other Pacific Islander | .8% |
| Two or More Races | 5.3% |
| White | 51% |
What the pie chart looks like, for reference: