
We started our three year National Science Foundation Cracking the Code: Influencing Millennial Science Engagement audience research in 2018 with a national survey of millennials’ media consumption habits. This survey was conducted by Jacobs Media Strategies and found, among other things, that millennials were the most science curious generation. This survey provided the groundwork for each of the studies that we have conducted over the past three years as part of our Cracking the Code: Influencing Millennial Science Engagement study.
To wrap up our project, we conducted another large survey. The survey was designed by the KQED and Texas Tech University research team and was fielded by YouGov in August 2021. We asked many of the same questions as the original survey, but we also surveyed more audiences (in addition to the nationally representative sample) and dug in deeper to questions that were generated as a result of the past three years of research. Because there is such a large amount of data to examine, we will be uploading several decks focused on narrower themes (e.g., YouTube, Latinx audiences) over the next several months. The first deck linked below is our What Does the Future Look Like in Science Media? presentation and we also include the link to our related Nov. 18, 2021, webinar.
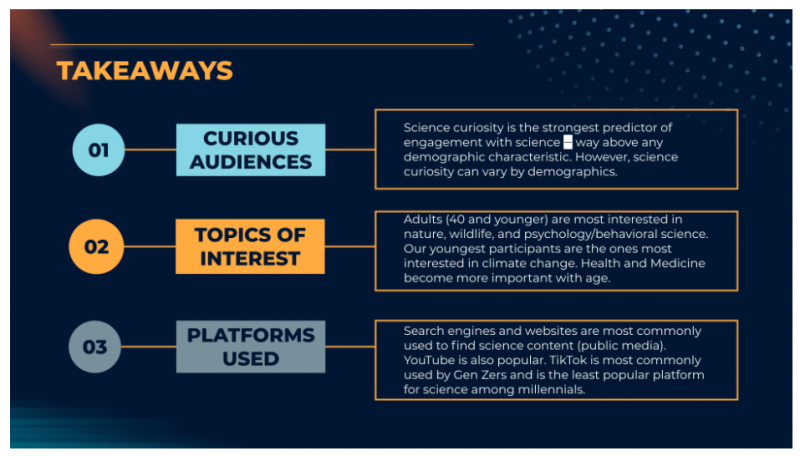
Here are the key takeaways:
Curious Audience: Science curiosity is the strongest predictor of engagement with science - way above any demographic characteristic. However, science curiosity can vary by demographics.
Topics of interest: Adults (40 and younger) are most interested in nature, wildlife, and psychology/behavioral science. Our youngest participants are the ones most interested in climate change. Health and Medicine become more important with age.
Platforms Used: Search engines and websites are most commonly used to find science content (public media). YouTube is also popular. TikTok is most commonly used by Gen Zers and is the least popular platform for science among millennials.
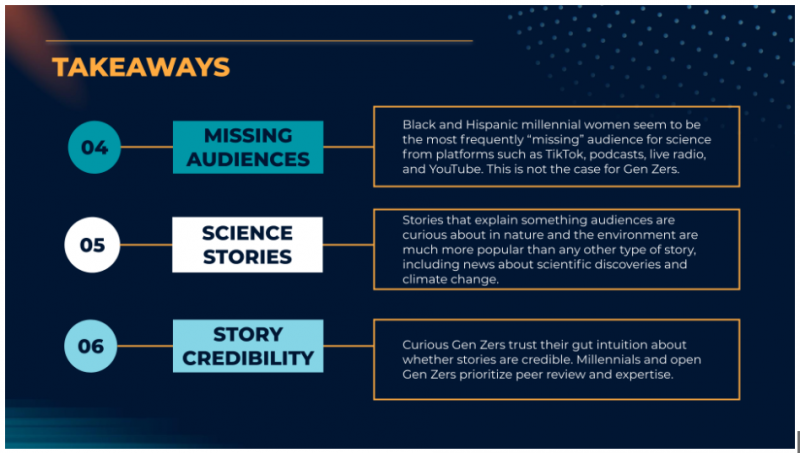
Missing Audience: Black and Hispanic millennial women seem to be the most frequently “missing” audience for science from platforms such as TikTok, podcasts, live radio, and YouTube. This is not the case for Gen Zers.
Science Stories: Stories that explain something audiences are curious about in nature and the environment are much more popular than any other type of story, including news about scientific discoveries and climate change.
Story Credibility: Curious Gen Zers trust their gut intuition about whether stories are credible. Millennials and open Gen Zers prioritize peer review and expertise.
Samples
As stated above, we collected data from four samples: a national sample of 2,000 participants (26% were millennials), a California-only sample of 500 participants (25% were millennials), a Bay Area sample of 500 participants (18% were millennials) and a Bay Area Latinx sample of 500 participants (35% were millennials). This allows us to both make inferences about what is true about younger (millennial and Gen Z) audiences in the U.S., generally, and to look at target audiences that are of specific interest to KQED and our other STEM partners in California — and more specifically, the Bay Area.
Generations
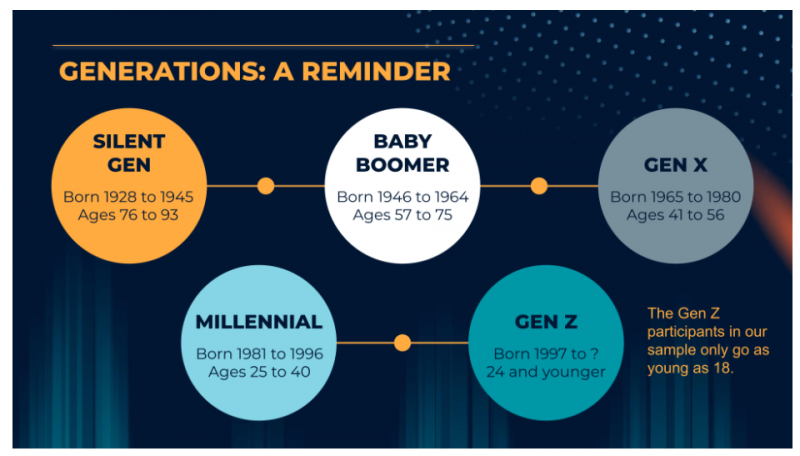
It is easy to forget that millennials are a fully adult audience. At the outset of our project, the youngest millennials were 22 years old. Now, near the end of 2021, millennials range from ages 25 to 40, and about 33% of millennials in our national sample say that they have children at home. In our What Does the Future Look Like in Science Media? presentation, we also focused on Generation Z. There are not currently clear definitions of the start of this generation, but the oldest members of Gen Z were born in 1997 and are about 24 years old. Our survey only sampled adults who are legally able to consent to participate. Thus, our Generation Z sample ranges from 18 to 24 and does not represent the entire generation. We also include some analyses with Gen X (currently ages 41 to 56) and Baby Boomers (currently ages 57 to 75).
Science Curiosity
Of utmost importance to this survey and to the other studies conducted as part of the Cracking the Code project was the identification of the ideal and “missing audiences.” A “missing audience” consists of individuals who are science curious, and thus ought to be engaging with science content. But for some unknown reason they are engaging relatively less than other “science curious” groups or not engaging at all. Someone who is science curious is an individual that is motivated to seek out science for enjoyment and not purely for information. Missing audiences may be engaging less with certain types of content and/or on certain types of platforms.
Science curiosity is the key characteristic for attracting the ideal audience for science media and programming.
In our studies, we used the Science Curiosity Scale, developed by Dan Kahan and myself (with the help of our collaborators Katie Carpenter, Laura Helft and Kathleen Hall Jamieson). This scale, which is designed to appear to participants like a marketing/interests type survey, hides our behavioral and self-reported measures of science interest in an array of items asking about other interests, like business, sports, and entertainment. The purpose of this is to lower the risk of participants answering the questions based on what they think the researchers want to hear.
Scores on our science curiosity scale strongly predict people’s engagement with science media. We have demonstrated this over and over in each of the studies conducted as part of the Cracking the Code project. Furthermore, in this current survey, science curiosity strongly predicts the frequency with which each of the samples (i.e., the national sample, the California sample, the Bay Area sample, and the Bay Area Latinx sample) report accessing science content.
We call this our key characteristic of the target audience because science curiosity is a stronger predictor than any other demographic characteristic. Science curiosity predicts 33% of the variance in participants' responses to the “frequency of accessing science content” question. Compare that with race/ethnicity (which only explains 1.5% of the variance), gender (which only explains 0.48%), or even generation (which accounts only for 0.28% of the variance).
It is worth noting, however, that science curiosity scores can vary based on demographic characteristics. Across many of our studies, we have found small, but statistically significant differences in average science curiosity scores based on gender and generation.
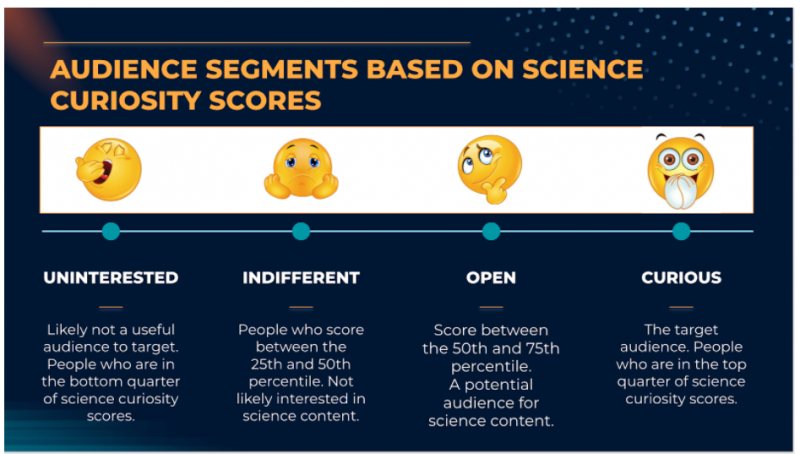
Curious Audiences
Science curiosity scores among this study’s participants range from approximately -2 to 2. We can divide participants' science curiosity scores into quartiles to create four audience segments. The bottom 25% of participants based on their science curiosity scores (scores up to -0.56) are labeled as “uninterested” and seen as not a useful audience to target. Participants who score between the 25th and 50th percentile (scores ranging from -0.56 to 0.03) are labeled “indifferent” and are also not likely to want to engage with science content. Participants who score between the 50th and 75th percentiles (scores ranging from 0.04 to 0.62) are labeled “open” and could be a potential audience for science content. Finally, the top 25% of participants based on their science curiosity scores (scores 0.62 and higher) are seen as the target audience for science content.
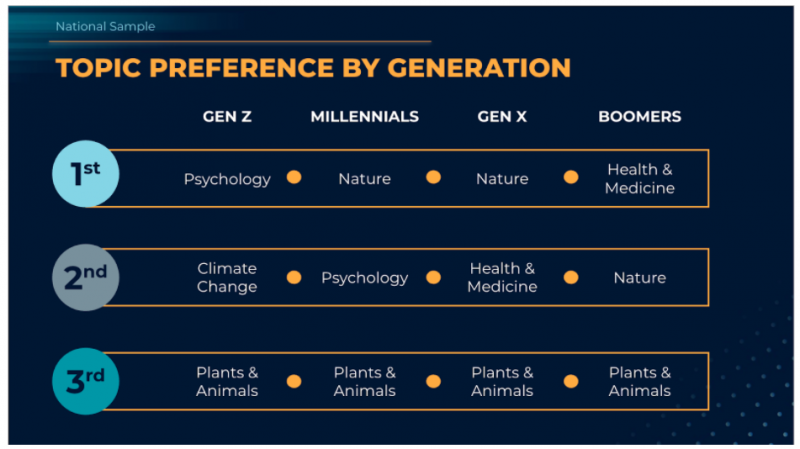
Topics of Interest
Having defined our target audience – science curious millennials and Gen Zers, one of our first questions was what science topics are they most interested in? We included 15 different science-related topics (e.g., plants and animals, climate change, health and medicine, physics, etc.). Interestingly, “Plants & Animals” was the third ranked topic for each of the generations: Gen Zers, Millennials, Gen Xers and Baby Boomers. Gen Z was the only generation to have climate change in their top three (ranked 2nd), and Psychology/Behavioral Science appeared in the top three for both Gen Zers (1st) and Millennials (2nd). “Health & Medicine” was a top three interest for Gen Xers (2nd) and Baby Boomers (1st), possibly suggesting that this topic becomes more important as participants age.
Platforms Used
We also wanted to know what platforms are used by younger adult audiences to access science content, specifically that from “public media.” For this item, we asked how frequently participants access science content from public media that appears live on the radio, streamed live online, on podcasts, on-demand via smart speaker, on specific websites, search engines, stories linked on social media, via YouTube videos, on TikTok videos, Instagram and Facebook, newsletters, or public media stories sent by friends. Over half of the curious millennials in the sample reported regularly going directly to websites, looking for content via search engines, or finding content on YouTube. Around 60% or greater of curious Gen Zers regularly seek such content from social media and/or YouTube, and approximately 50% will regularly use a search engine. Furthermore, while regular TikTok use is fairly low among curious millennials (15%), it is much higher among curious Gen Zers (over 30%).
Missing Audiences for the Platforms
In our research, we have defined “missing audiences” as those science curious individuals who ought to be engaging with science content, but for some unknown reason, are not (or are doing so relatively less than other science curious groups). We used this survey data to determine who some of the missing audiences for science content on particular platforms may be.
In the presentation I note three important points to consider. First, participants' responses are self-reported. We asked them how frequently they engaged with public science media content on the platforms. Participants may inflate or downplay the frequency with which they engage with the various platforms or even ignore the “science content” and/or “public media” aspects of the question and just report how frequently they think they engage with the platforms generally. Second, I point out that what is the desired level of frequency of use may vary across platforms. For example, we may expect that “daily” is an appropriate frequency of engagement for social media but not for newsletters (which may tend to be delivered weekly or monthly). Third, we looked at specific audiences that were requested by KQED team members. These were not audiences that were found to be missing after digging through the data, but audiences that we set out to see if they were less engaged than their counterparts.
Keeping this in mind, we examined whether each of the following four audiences are “missing” audiences on a subset of the platforms. Note that white males were not examined as a potential missing audience as prior data and available audience metrics suggest they are the group most engaged.
- Women of Color: Millennials and Gen Zers who are Black and/or Hispanic/Latina/x and identify as women;
- Men of Color: Millennials and Gen Zers who identify as men who are Black and/or Hispanic/Latino/x;
- White, College-educated Moms: White millennial women with at least some college and who have children at home;
- Women: Millennials and Gen Zers who identify as women, regardless of their other demographic characteristics.
Below are the key findings about the four “missing” audiences our research focused on:
- Millennial women of color (Black and Hispanic/Latina/x millennial women) seem to be the most frequently “missing audience” for science content on platforms such as TikTok, podcasts, live radio, and YouTube.
- Gen Z women of color are NOT missing audiences on these platforms.
- Gen Zers and millennial women are generally a missing audience for podcasts.
- Most younger adults are missing audiences for live radio.
- Most curious younger adults report using newsletters at least monthly, therefore, newsletters would be a good tactic to try out when targeting younger audiences.
Types of Science Stories and Credibility
We also looked at what types of science stories younger adults prefer and how they determine whether those stories contain credible content.
Most curious young adults said that they prefer stories that explain something that they are curious about in nature and/or the environment, and very few curious young adults said that they preferred stories about climate change (even though Gen Zers had climate change as one of their top three topics of interest). Climate change stories were more popular among the young adult samples from the Bay Area than the national sample, but even these participants expressed a greater preference for the explanatory stories.
We followed up with the Bay Area sample to ask how they prefer to read stories about climate change and the vast majority (73%) said that they prefer to read the story online as opposed to listening to a story (radio or on-demand audio, 17%), watching a TikTok video (6%), or reading a Twitter thread (3%). However, when we look by age groups, we see that although more than half of Gen Zers prefer to read a story online, 33% would prefer to see a TikTok video.
Finally, when we asked millennials and Gen Zers how important various factors are when deciding whether a story is credible, we were happy to see that expertise and peer-reviewed content appear in the top 5 for both curious millennials and curious Gen Zers. However, “gut intuition” was the second most important factor to curious Gen Zers. This mirrors a finding from our first survey, which suggested that millennials and younger adults (at that time) trusted their gut intuition about whether a story was credible.
Conclusion
We can’t directly compare this survey to the one conducted in 2018 for a variety of reasons, some methodological (e.g., different sampling companies with different approximations of nationally representative) and some societal (e.g., potential changes due to important events like COVID-19 pandemic). However, we can look for commonalities between the two and we can consider this survey as a snapshot of science media consumption behavior in 2021.
Again, here are the key takeaways:
We will continue to provide results from this survey over the next few months, so stay tuned.