window.__IS_SSR__=true
window.__INITIAL_STATE__={
"attachmentsReducer": {
"audio_0": {
"type": "attachments",
"id": "audio_0",
"imgSizes": {
"kqedFullSize": {
"file": "https://ww2.kqed.org/news/wp-content/themes/KQED-unified/img/audio_bgs/background0.jpg"
}
}
},
"audio_1": {
"type": "attachments",
"id": "audio_1",
"imgSizes": {
"kqedFullSize": {
"file": "https://ww2.kqed.org/news/wp-content/themes/KQED-unified/img/audio_bgs/background1.jpg"
}
}
},
"audio_2": {
"type": "attachments",
"id": "audio_2",
"imgSizes": {
"kqedFullSize": {
"file": "https://ww2.kqed.org/news/wp-content/themes/KQED-unified/img/audio_bgs/background2.jpg"
}
}
},
"audio_3": {
"type": "attachments",
"id": "audio_3",
"imgSizes": {
"kqedFullSize": {
"file": "https://ww2.kqed.org/news/wp-content/themes/KQED-unified/img/audio_bgs/background3.jpg"
}
}
},
"audio_4": {
"type": "attachments",
"id": "audio_4",
"imgSizes": {
"kqedFullSize": {
"file": "https://ww2.kqed.org/news/wp-content/themes/KQED-unified/img/audio_bgs/background4.jpg"
}
}
},
"placeholder": {
"type": "attachments",
"id": "placeholder",
"imgSizes": {
"thumbnail": {
"file": "https://cdn.kqed.org/wp-content/uploads/2024/12/KQED-Default-Image-816638274-2000x1333-1-160x107.jpg",
"width": 160,
"height": 107,
"mimeType": "image/jpeg"
},
"medium": {
"file": "https://cdn.kqed.org/wp-content/uploads/2024/12/KQED-Default-Image-816638274-2000x1333-1-800x533.jpg",
"width": 800,
"height": 533,
"mimeType": "image/jpeg"
},
"medium_large": {
"file": "https://cdn.kqed.org/wp-content/uploads/2024/12/KQED-Default-Image-816638274-2000x1333-1-768x512.jpg",
"width": 768,
"height": 512,
"mimeType": "image/jpeg"
},
"large": {
"file": "https://cdn.kqed.org/wp-content/uploads/2024/12/KQED-Default-Image-816638274-2000x1333-1-1020x680.jpg",
"width": 1020,
"height": 680,
"mimeType": "image/jpeg"
},
"1536x1536": {
"file": "https://cdn.kqed.org/wp-content/uploads/2024/12/KQED-Default-Image-816638274-2000x1333-1-1536x1024.jpg",
"width": 1536,
"height": 1024,
"mimeType": "image/jpeg"
},
"fd-lrg": {
"file": "https://cdn.kqed.org/wp-content/uploads/2024/12/KQED-Default-Image-816638274-2000x1333-1-1536x1024.jpg",
"width": 1536,
"height": 1024,
"mimeType": "image/jpeg"
},
"fd-med": {
"file": "https://cdn.kqed.org/wp-content/uploads/2024/12/KQED-Default-Image-816638274-2000x1333-1-1020x680.jpg",
"width": 1020,
"height": 680,
"mimeType": "image/jpeg"
},
"fd-sm": {
"file": "https://cdn.kqed.org/wp-content/uploads/2024/12/KQED-Default-Image-816638274-2000x1333-1-800x533.jpg",
"width": 800,
"height": 533,
"mimeType": "image/jpeg"
},
"post-thumbnail": {
"file": "https://cdn.kqed.org/wp-content/uploads/2024/12/KQED-Default-Image-816638274-2000x1333-1-672x372.jpg",
"width": 672,
"height": 372,
"mimeType": "image/jpeg"
},
"twentyfourteen-full-width": {
"file": "https://cdn.kqed.org/wp-content/uploads/2024/12/KQED-Default-Image-816638274-2000x1333-1-1038x576.jpg",
"width": 1038,
"height": 576,
"mimeType": "image/jpeg"
},
"xxsmall": {
"file": "https://cdn.kqed.org/wp-content/uploads/2024/12/KQED-Default-Image-816638274-2000x1333-1-160x107.jpg",
"width": 160,
"height": 107,
"mimeType": "image/jpeg"
},
"xsmall": {
"file": "https://cdn.kqed.org/wp-content/uploads/2024/12/KQED-Default-Image-816638274-2000x1333-1-672x372.jpg",
"width": 672,
"height": 372,
"mimeType": "image/jpeg"
},
"small": {
"file": "https://cdn.kqed.org/wp-content/uploads/2024/12/KQED-Default-Image-816638274-2000x1333-1-672x372.jpg",
"width": 672,
"height": 372,
"mimeType": "image/jpeg"
},
"xlarge": {
"file": "https://cdn.kqed.org/wp-content/uploads/2024/12/KQED-Default-Image-816638274-2000x1333-1-1020x680.jpg",
"width": 1020,
"height": 680,
"mimeType": "image/jpeg"
},
"full-width": {
"file": "https://cdn.kqed.org/wp-content/uploads/2024/12/KQED-Default-Image-816638274-2000x1333-1-1920x1280.jpg",
"width": 1920,
"height": 1280,
"mimeType": "image/jpeg"
},
"guest-author-32": {
"file": "https://cdn.kqed.org/wp-content/uploads/2025/01/KQED-Default-Image-816638274-1333x1333-1-160x160.jpg",
"width": 32,
"height": 32,
"mimeType": "image/jpeg"
},
"guest-author-50": {
"file": "https://cdn.kqed.org/wp-content/uploads/2025/01/KQED-Default-Image-816638274-1333x1333-1-160x160.jpg",
"width": 50,
"height": 50,
"mimeType": "image/jpeg"
},
"guest-author-64": {
"file": "https://cdn.kqed.org/wp-content/uploads/2025/01/KQED-Default-Image-816638274-1333x1333-1-160x160.jpg",
"width": 64,
"height": 64,
"mimeType": "image/jpeg"
},
"guest-author-96": {
"file": "https://cdn.kqed.org/wp-content/uploads/2025/01/KQED-Default-Image-816638274-1333x1333-1-160x160.jpg",
"width": 96,
"height": 96,
"mimeType": "image/jpeg"
},
"guest-author-128": {
"file": "https://cdn.kqed.org/wp-content/uploads/2025/01/KQED-Default-Image-816638274-1333x1333-1-160x160.jpg",
"width": 128,
"height": 128,
"mimeType": "image/jpeg"
},
"detail": {
"file": "https://cdn.kqed.org/wp-content/uploads/2025/01/KQED-Default-Image-816638274-1333x1333-1-160x160.jpg",
"width": 160,
"height": 160,
"mimeType": "image/jpeg"
},
"kqedFullSize": {
"file": "https://cdn.kqed.org/wp-content/uploads/2024/12/KQED-Default-Image-816638274-2000x1333-1.jpg",
"width": 2000,
"height": 1333
}
}
},
"science_30781": {
"type": "attachments",
"id": "science_30781",
"meta": {
"index": "attachments_1716263798",
"site": "science",
"id": "30781",
"found": true
},
"parent": 0,
"imgSizes": {
"thumbnail": {
"file": "https://ww2.kqed.org/app/uploads/sites/35/2015/06/transverse-range-400x225.jpg",
"width": 400,
"mimeType": "image/jpeg",
"height": 225
},
"post-thumbnail": {
"file": "https://ww2.kqed.org/app/uploads/sites/35/2015/06/transverse-range-672x372.jpg",
"width": 672,
"mimeType": "image/jpeg",
"height": 372
},
"kqedFullSize": {
"file": "https://ww2.kqed.org/app/uploads/sites/35/2015/06/transverse-range.jpg",
"width": 800,
"height": 450
},
"guest-author-96": {
"file": "https://ww2.kqed.org/app/uploads/sites/35/2015/06/transverse-range-96x96.jpg",
"width": 96,
"mimeType": "image/jpeg",
"height": 96
},
"medium": {
"file": "https://ww2.kqed.org/app/uploads/sites/35/2015/06/transverse-range-800x450.jpg",
"width": 800,
"mimeType": "image/jpeg",
"height": 450
},
"guest-author-64": {
"file": "https://ww2.kqed.org/app/uploads/sites/35/2015/06/transverse-range-64x64.jpg",
"width": 64,
"mimeType": "image/jpeg",
"height": 64
},
"detail": {
"file": "https://ww2.kqed.org/app/uploads/sites/35/2015/06/transverse-range-75x75.jpg",
"width": 75,
"mimeType": "image/jpeg",
"height": 75
},
"guest-author-32": {
"file": "https://ww2.kqed.org/app/uploads/sites/35/2015/06/transverse-range-32x32.jpg",
"width": 32,
"mimeType": "image/jpeg",
"height": 32
},
"guest-author-128": {
"file": "https://ww2.kqed.org/app/uploads/sites/35/2015/06/transverse-range-128x128.jpg",
"width": 128,
"mimeType": "image/jpeg",
"height": 128
}
},
"publishDate": 1433449574,
"modified": 1433449887,
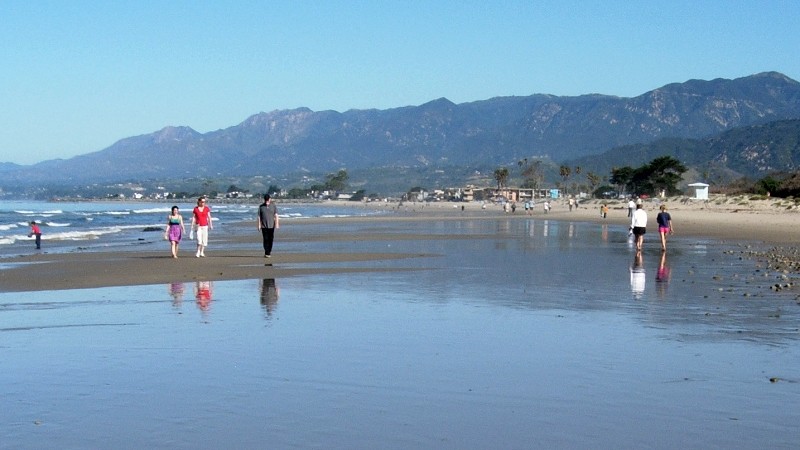
"caption": "The coastal mountains near Santa Barbara are being raised by tectonic forces that put the area at risk of tsunamis caused by earthquake faults offshore. (Alden/KQED)",
"description": "The coastal mountains near Santa Barbara are being raised by tectonic forces that put the area at risk of tsunamis caused by earthquake faults offshore. (Alden/KQED)",
"title": "earthquake tsunami",
"credit": null,
"status": "inherit",
"isLoading": false,
"fetchFailed": false
},
"science_30559": {
"type": "attachments",
"id": "science_30559",
"meta": {
"index": "attachments_1716263798",
"site": "science",
"id": "30559",
"found": true
},
"parent": 30558,
"imgSizes": {
"kqedFullSize": {
"file": "https://ww2.kqed.org/app/uploads/sites/35/2015/05/HF-CF-GE-map.png",
"width": 800,
"height": 450
}
},
"publishDate": 1432746859,
"modified": 1432746880,
"caption": "TK",
"description": null,
"title": "HF-CF-GE-map",
"credit": null,
"status": "inherit",
"isLoading": false,
"fetchFailed": false
},
"science_30234": {
"type": "attachments",
"id": "science_30234",
"meta": {
"index": "attachments_1716263798",
"site": "science",
"id": "30234",
"found": true
},
"parent": 30233,
"imgSizes": {
"kqedFullSize": {
"file": "https://ww2.kqed.org/app/uploads/sites/35/2015/05/luzon-waves.jpg",
"width": 800,
"height": 450
}
},
"publishDate": 1431542113,
"modified": 1431565769,
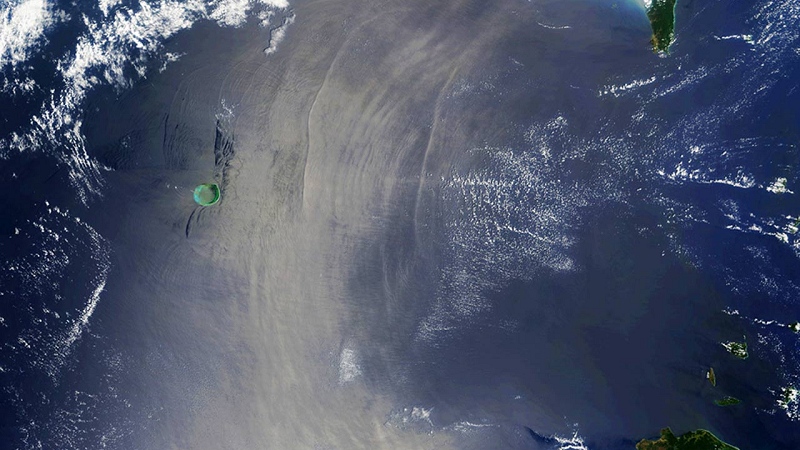
"caption": "Powerful internal waves, made visible by their effects on surface roughness, spread westward into the South China Sea through Luzon Strait, the 200-mile-wide waterway between the southern tip of Taiwan (top right) and the northern tip of the Philippines (bottom right). At left is Dongsha Atoll, a Taiwan national park. (NASA/Global Ocean Associates)",
"description": null,
"title": "internal waves",
"credit": null,
"status": "inherit",
"isLoading": false,
"fetchFailed": false
},
"science_29853": {
"type": "attachments",
"id": "science_29853",
"meta": {
"index": "attachments_1716263798",
"site": "science",
"id": "29853",
"found": true
},
"parent": 29852,
"imgSizes": {
"kqedFullSize": {
"file": "https://ww2.kqed.org/app/uploads/sites/35/2015/04/Daisy-parrotfish-wikimedia.jpg",
"width": 800,
"height": 450
}
},
"publishDate": 1430344926,
"modified": 1450895257,
"caption": "Species like the daisy parrotfish \u003ci>Chlorurus sordidus\u003c/i>, are a crucial link in the natural chain that builds dry land in the Maldives archipelago.",
"description": null,
"title": "Daisy-parrotfish-wikimedia",
"credit": "Julien Bidet/Wikimedia",
"status": "inherit",
"isLoading": false,
"fetchFailed": false
},
"science_29557": {
"type": "attachments",
"id": "science_29557",
"meta": {
"index": "attachments_1716263798",
"site": "science",
"id": "29557",
"found": true
},
"parent": 29537,
"imgSizes": {
"kqedFullSize": {
"file": "https://ww2.kqed.org/app/uploads/sites/35/2015/04/steg-profiles.png",
"width": 800,
"height": 450
}
},
"publishDate": 1429748610,
"modified": 1429748632,
"caption": "A stylized picture of how the spinal plates differed in male and female Stegosaurus mjosi. A new paper argues that sexual dimorphism is the most likely explanation for these two distinct types within the same species. (Saitta/PLOS One)",
"description": null,
"title": "steg-profiles",
"credit": null,
"status": "inherit",
"isLoading": false,
"fetchFailed": false
},
"science_29263": {
"type": "attachments",
"id": "science_29263",
"meta": {
"index": "attachments_1716263798",
"site": "science",
"id": "29263",
"found": true
},
"parent": 29262,
"imgSizes": {
"kqedFullSize": {
"file": "https://ww2.kqed.org/app/uploads/sites/35/2015/04/spitsbergen-permian.jpg",
"width": 800,
"height": 450
}
},
"publishDate": 1429139458,
"modified": 1429139477,
"caption": "Fossils in these three orange beds of ancient limestone record a great extinction event about 262 million years ago during the late Permian Period. Then, as now, Spitsbergen was located in cold waters. (Dierk Blomeier/GSA)",
"description": null,
"title": "spitsbergen-permian",
"credit": null,
"status": "inherit",
"isLoading": false,
"fetchFailed": false
},
"science_29081": {
"type": "attachments",
"id": "science_29081",
"meta": {
"index": "attachments_1716263798",
"site": "science",
"id": "29081",
"found": true
},
"parent": 29080,
"imgSizes": {
"kqedFullSize": {
"file": "https://ww2.kqed.org/app/uploads/sites/35/2015/04/tambora.jpg",
"width": 800,
"height": 449
}
},
"publishDate": 1428533722,
"modified": 1428533740,
"caption": "When Tambora blew its top, 200 years ago this week, it left a smoking caldera behind that measures 6 kilometers across. (Jialiang Gao/Wikimedia)",
"description": null,
"title": "tambora",
"credit": null,
"status": "inherit",
"isLoading": false,
"fetchFailed": false
},
"science_28905": {
"type": "attachments",
"id": "science_28905",
"meta": {
"index": "attachments_1716263798",
"site": "science",
"id": "28905",
"found": true
},
"parent": 28904,
"imgSizes": {
"kqedFullSize": {
"file": "https://ww2.kqed.org/app/uploads/sites/35/2015/04/anthropocene.jpg",
"width": 800,
"height": 450
}
},
"publishDate": 1427926144,
"modified": 1427926169,
"caption": "The Albany Bulb, which consists entirely of concrete \"rocks\" and other human artifacts, is a local emblem of the Anthropocene age—the time in geologic history when the human imprint is paramount. Should it appear as such on geologic maps? (Andrew Alden)",
"description": null,
"title": "anthropocene",
"credit": null,
"status": "inherit",
"isLoading": false,
"fetchFailed": false
},
"science_28579": {
"type": "attachments",
"id": "science_28579",
"meta": {
"index": "attachments_1716263798",
"site": "science",
"id": "28579",
"found": true
},
"parent": 28578,
"imgSizes": {
"kqedFullSize": {
"file": "https://ww2.kqed.org/app/uploads/sites/35/2015/03/tsunami-sign.jpg",
"width": 800,
"height": 450
}
},
"publishDate": 1427314057,
"modified": 1427314089,
"caption": "Warning signs, like this one on 17-Mile Drive at Pebble Beach, have become routine up and down the west coast. They remind us to keep our eyes on more than just the view. (\u003ca href=\"https://www.flickr.com/photos/afagen/\">Adam Fagen\u003c/a>/\u003ca href=\"https://creativecommons.org/licenses/by-nc-sa/2.0/\">Creative Commons\u003c/a>)",
"description": null,
"title": "tsunami-sign",
"credit": null,
"status": "inherit",
"isLoading": false,
"fetchFailed": false
},
"science_28388": {
"type": "attachments",
"id": "science_28388",
"meta": {
"index": "attachments_1716263798",
"site": "science",
"id": "28388",
"found": true
},
"parent": 28387,
"imgSizes": {
"kqedFullSize": {
"file": "https://ww2.kqed.org/app/uploads/sites/35/2015/03/napa-quake-field.jpg",
"width": 800,
"height": 450
}
},
"publishDate": 1426711973,
"modified": 1426712014,
"caption": "Movement on the West Napa Fault raised this \"moletrack\" during the 2014 South Napa earthquake. Ordinary people can document earthquake phenomena in ways that help science. (Dan Ponti/USGS)",
"description": null,
"title": "napa-quake-field",
"credit": null,
"status": "inherit",
"isLoading": false,
"fetchFailed": false
},
"science_28105": {
"type": "attachments",
"id": "science_28105",
"meta": {
"index": "attachments_1716263798",
"site": "science",
"id": "28105",
"found": true
},
"parent": 28104,
"imgSizes": {
"kqedFullSize": {
"file": "https://ww2.kqed.org/app/uploads/sites/35/2015/03/Illimani_La_Paz_April_2014.jpg",
"width": 800,
"height": 450
}
},
"publishDate": 1426107963,
"modified": 1426107983,
"caption": "Nevado Illimani, southeast of La Paz, has collected snow for tens of thousands of years. Samples of its ancient ice tell us the state of the atmosphere since Ice Age times. A recent paper reports the history of emissions of toxic lead near Illimani since the time of Christ. Bolivia, a hotbed of metal mining, got its worst loads of airborne lead during the 20th-century decades of leaded gasoline. (Wikimedia)",
"description": null,
"title": "Illimani_La_Paz_April_2014",
"credit": null,
"status": "inherit",
"isLoading": false,
"fetchFailed": false
},
"science_27931": {
"type": "attachments",
"id": "science_27931",
"meta": {
"index": "attachments_1716263798",
"site": "science",
"id": "27931",
"found": true
},
"parent": 27911,
"imgSizes": {
"kqedFullSize": {
"file": "https://ww2.kqed.org/app/uploads/sites/35/2015/03/Makauwahi_2344-e1425689842640.jpg",
"width": 640,
"height": 360
}
},
"publishDate": 1425609187,
"modified": 1425609277,
"caption": "Makauwahi sinkhole, seen from the caves on the south side. (Craig Miller/KQED)",
"description": "Makauwahi sinkhole, seen from the caves on the south side. (Craig Miller/KQED)",
"title": "Makauwahi_2344",
"credit": null,
"status": "inherit",
"isLoading": false,
"fetchFailed": false
}
},
"audioPlayerReducer": {
"postId": "stream_live",
"isPaused": true,
"isPlaying": false,
"pfsActive": false,
"pledgeModalIsOpen": true,
"playerDrawerIsOpen": false,
"liveAudioPlayStartedAt": 0,
"liveAudioPlayContext": ""
},
"authorsReducer": {
"cmiller": {
"type": "authors",
"id": "221",
"meta": {
"index": "authors_1716337520",
"id": "221",
"found": true
},
"name": "Craig Miller",
"firstName": "Craig",
"lastName": "Miller",
"slug": "cmiller",
"email": "craig@voxterra.net",
"display_author_email": false,
"staff_mastheads": [
"science"
],
"title": "Editor Emeritus, Science",
"bio": "Craig is a former KQED Science editor, specializing in weather, climate, water & energy issues, with a little seismology thrown in just to shake things up. Prior to that, he launched and led the station's award-winning multimedia project, Climate Watch. Craig is also an accomplished writer/producer of television documentaries, with a focus on natural resource issues.",
"avatar": "https://secure.gravatar.com/avatar/b91661df645e001a9cafe0861fa685f9?s=600&d=blank&r=g",
"twitter": "voxterra",
"facebook": null,
"instagram": null,
"linkedin": null,
"sites": [
{
"site": "news",
"roles": [
"author"
]
},
{
"site": "futureofyou",
"roles": [
"editor"
]
},
{
"site": "stateofhealth",
"roles": [
"author"
]
},
{
"site": "science",
"roles": [
"editor"
]
},
{
"site": "quest",
"roles": [
"editor"
]
}
],
"headData": {
"title": "Craig Miller | KQED",
"description": "Editor Emeritus, Science",
"ogImgSrc": "https://secure.gravatar.com/avatar/b91661df645e001a9cafe0861fa685f9?s=600&d=blank&r=g",
"twImgSrc": "https://secure.gravatar.com/avatar/b91661df645e001a9cafe0861fa685f9?s=600&d=blank&r=g"
},
"isLoading": false,
"link": "/author/cmiller"
},
"andrew-alden": {
"type": "authors",
"id": "6228",
"meta": {
"index": "authors_1716337520",
"id": "6228",
"found": true
},
"name": "Andrew Alden",
"firstName": "Andrew",
"lastName": "Alden",
"slug": "andrew-alden",
"email": "alden@andrew-alden.com",
"display_author_email": false,
"staff_mastheads": [],
"title": null,
"bio": "Andrew Alden earned his geology degree at the University of New Hampshire and moved back to the Bay Area to work at the U.S. Geological Survey for six years. He has \u003ca href=\"http://geology.about.com/\">written on geology for About.com\u003c/a> since its founding in 1997. In 2007, he started the Oakland Geology blog, which won recognition as \"Best of the East Bay\" from the \u003ci>East Bay Express\u003c/i> in 2010. In writing about geology in the Bay Area and surroundings, he hopes to share some of the useful and pleasurable insights that geologists give us—not just facts about the deep past, but an attitude that might be called the \u003ci>deep present\u003c/i>.\r\n\r\nRead his \u003ca href=\"http://science.kqed.org/quest/author/andrew-alden/\">previous contributions\u003c/a> to \u003ca href=\"http://http://science.kqed.org/quest/\">QUEST\u003c/a>, a project dedicated to exploring the Science of Sustainability.",
"avatar": "https://secure.gravatar.com/avatar/9eaa0afc32f98c5fc7ce634437334a64?s=600&d=blank&r=g",
"twitter": null,
"facebook": null,
"instagram": null,
"linkedin": null,
"sites": [
{
"site": "science",
"roles": [
"author"
]
},
{
"site": "quest",
"roles": [
"subscriber"
]
}
],
"headData": {
"title": "Andrew Alden | KQED",
"description": null,
"ogImgSrc": "https://secure.gravatar.com/avatar/9eaa0afc32f98c5fc7ce634437334a64?s=600&d=blank&r=g",
"twImgSrc": "https://secure.gravatar.com/avatar/9eaa0afc32f98c5fc7ce634437334a64?s=600&d=blank&r=g"
},
"isLoading": false,
"link": "/author/andrew-alden"
}
},
"pagesReducer": {
"science_category_geology": {
"type": "terms",
"id": "science_38",
"meta": {
"index": "terms_1716263798",
"site": "science",
"id": "38",
"score": 13.559036
},
"featImg": null,
"name": "Geology",
"description": null,
"taxonomy": "category",
"headData": {
"twImgId": null,
"twTitle": null,
"ogTitle": null,
"ogImgId": null,
"twDescription": null,
"description": null,
"title": "Geology Archives | KQED Science",
"ogDescription": null
},
"ttid": 40,
"slug": "geology",
"isLoading": false,
"title": "Geology",
"pageMeta": {
"site": "science",
"WpPageTemplate": "page-topic-editorial",
"currentPage": 9
},
"blocks": [
{
"blockName": "kqed/post-list",
"attrs": {
"layout": "cardArticle2",
"query": "posts/science?category=geology",
"seeMore": false,
"paginated": true,
"page": 9
}
},
{
"blockName": "kqed/ad"
}
]
}
},
"pfsSessionReducer": {},
"postsReducer": {
"stream_live": {
"type": "live",
"id": "stream_live",
"audioUrl": "https://hls.kqed.org/hls/kqed_app/playlist.m3u8",
"title": "Live Stream",
"excerpt": "Live Stream information currently unavailable.",
"link": "/radio",
"featImg": "",
"label": {
"name": "KQED Live",
"link": "/"
}
},
"stream_kqedNewscast": {
"type": "posts",
"id": "stream_kqedNewscast",
"audioUrl": "https://www.kqed.org/.stream/anon/radio/RDnews/newscast.mp3?_=1",
"title": "KQED Newscast",
"featImg": "",
"label": {
"name": "88.5 FM",
"link": "/"
}
},
"science_30783": {
"type": "posts",
"id": "science_30783",
"meta": {
"index": "posts_1716263798",
"site": "science",
"id": "30783",
"score": null,
"sort": [
1433454161000
]
},
"parent": 0,
"labelTerm": {
"site": "science"
},
"blocks": [],
"publishDate": 1433454161,
"format": "standard",
"title": "New Maps Reveal Tsunami Risk for Los Angeles",
"headTitle": "New Maps Reveal Tsunami Risk for Los Angeles | KQED",
"content": "\u003cp>A new study argues that at least two large earthquake faults off the coast of Southern California can spawn damaging tsunamis that would wash over San Diego, Long Beach, Santa Barbara and other coastal cities. The study’s findings could force changes in the disaster plans for these places.\u003cbr>\n\u003ca href=\"http://onlinelibrary.wiley.com/doi/10.1002/2014JF003322/full\">\u003c/a>\u003c/p>\n\u003cp>In the study, published by the Journal of Geophysical Research, a team led by Mark Legg scrounged years of data from different undersea surveys to analyze the offshore lands of Southern California in unprecedented detail. Looking both on and underneath the deep sea floor, Legg’s team found some of the earthquake faults off California are longer and more threatening than previously thought – capable not only of generating large earthquakes, but of launching dangerous tsunamis toward the nearby coast.\u003c/p>\n\u003cfigure id=\"attachment_30786\" class=\"wp-caption alignright\" style=\"max-width: 499px\">\u003ca href=\"http://ww2.kqed.org/science/wp-content/uploads/sites/35/2015/06/borderland.png\">\u003cimg loading=\"lazy\" decoding=\"async\" src=\"http://ww2.kqed.org/science/wp-content/uploads/sites/35/2015/06/borderland.png\" alt=\"The California Continental Borderland in its larger plate-tectonic setting. (Alden/USGS)\" width=\"499\" height=\"500\" class=\"size-full wp-image-30786\" srcset=\"https://cdn.kqed.org/wp-content/uploads/sites/35/2015/06/borderland.png 499w, https://cdn.kqed.org/wp-content/uploads/sites/35/2015/06/borderland-400x401.png 400w, https://cdn.kqed.org/wp-content/uploads/sites/35/2015/06/borderland-32x32.png 32w, https://cdn.kqed.org/wp-content/uploads/sites/35/2015/06/borderland-64x64.png 64w, https://cdn.kqed.org/wp-content/uploads/sites/35/2015/06/borderland-96x96.png 96w, https://cdn.kqed.org/wp-content/uploads/sites/35/2015/06/borderland-128x128.png 128w, https://cdn.kqed.org/wp-content/uploads/sites/35/2015/06/borderland-75x75.png 75w\" sizes=\"(max-width: 499px) 100vw, 499px\">\u003c/a>\u003cfigcaption class=\"wp-caption-text\">The California Continental Borderland in its larger plate-tectonic setting. (Alden/USGS)\u003c/figcaption>\u003c/figure>\n\u003cp>Legg’s study makes two main contributions. First, it builds a more accurate picture of fault activity where the Pacific and North America plates intersect, in the enigmatic region known as the California Continental Borderland. Second, it considers an underappreciated aspect of California’s faults that geologists call transpression.\u003c/p>\n\u003cp>\u003cstrong>A Fractured Borderland\u003cbr>\n\u003c/strong>\u003cbr>\nThe California Continental Borderland extends from Santa Barbara down to Baja California, all submerged except for the Channel Islands. It’s a peculiar piece of Earth’s crust. It started out as part of the North America tectonic plate: a thick pile of rocks and mud on the continent’s edge. Things changed about 28 million years ago as the Pacific plate took over offshore and the San Andreas fault was born. The Borderland splintered off the continent, and it’s been moving northwestward on the Pacific plate ever since. \u003c/p>\n\u003cp>That process is tearing the Borderland apart. \u003ca href=\"http://emvc.geol.ucsb.edu/2_infopgs/IP4WNACal/cCalifornia.html\">Plate tectonic animations\u003c/a> resemble the kind of mess you might see as tree trunks float down a river into an obstruction – a tectonic logjam. Today the Borderland is a badly cracked region. \u003c/p>\n\u003cfigure id=\"attachment_30789\" class=\"wp-caption alignleft\" style=\"max-width: 698px\">\u003ca href=\"http://ww2.kqed.org/science/wp-content/uploads/sites/35/2015/06/CCB-tectonicmap.png\">\u003cimg loading=\"lazy\" decoding=\"async\" src=\"http://ww2.kqed.org/science/wp-content/uploads/sites/35/2015/06/CCB-tectonicmap.png\" alt=\"This figure from Legg's paper shows the tectonic action going on in the Borderland today. The "beachball" symbols represent historic shear earthquakes (black) and thrust earthquakes (red), the type that cause tsunamis. The red arrows mark locations of transpression, discussed below. (Legg/American Geophysical Union)\" width=\"698\" height=\"557\" class=\"size-full wp-image-30789\" srcset=\"https://cdn.kqed.org/wp-content/uploads/sites/35/2015/06/CCB-tectonicmap.png 698w, https://cdn.kqed.org/wp-content/uploads/sites/35/2015/06/CCB-tectonicmap-400x319.png 400w\" sizes=\"(max-width: 698px) 100vw, 698px\">\u003c/a>\u003cfigcaption class=\"wp-caption-text\">This figure from Legg’s paper shows the tectonic action going on in the Borderland today. The “beachball” symbols represent historic shear earthquakes (black) and thrust earthquakes (red), the type that cause tsunamis. The red arrows mark locations of transpression, discussed below. (Legg/American Geophysical Union)\u003c/figcaption>\u003c/figure>\n\u003cp>Legg’s paper is a detailed description of two large faults in the seafloor of the Borderland: the 110-mile Santa Cruz-Catalina Ridge fault (“SCCR” on the map), and the 220-mile Ferrelo fault zone, extending from Santa Rosa Island to the deep Velero Basin, in Mexican waters. \u003c/p>\n\u003cp>[ad fullwidth]\u003c/p>\n\u003cp>These faults are jagged lines built of many different segments. Seismologists know from recent research that disjointed-looking faults like these \u003ca href=\"http://blogs.kqed.org/science/2015/05/28/two-faults-could-make-one-big-earthquake/\">can rupture along several segments at once\u003c/a>, adding up to a very large wallop, approaching magnitude 8. And Legg’s study shows these faults are currently active.\u003c/p>\n\u003cp>\u003cstrong>Moving in Two Directions At Once\u003cbr>\n\u003c/strong>\u003cbr>\nWhen the two sides of the fault slip past each other like traffic on a two-way street, we call that motion shear. (Actually, physicists call it shear; geologists call it transcurrent motion.) When the quake moves the land up and down, we call it compression. Transpression refers to that combination of shear and compression. \u003c/p>\n\u003cp>For instance, Legg notes that the 1989 Loma Prieta earthquake directed part of its energy into uplifting the ground—and because some of that ground was offshore, it produced a tiny tsunami an inch or so high. \u003c/p>\n\u003cfigure id=\"attachment_30790\" class=\"wp-caption alignright\" style=\"max-width: 600px\">\u003ca href=\"http://ww2.kqed.org/science/wp-content/uploads/sites/35/2015/06/transverses.png\">\u003cimg loading=\"lazy\" decoding=\"async\" src=\"http://ww2.kqed.org/science/wp-content/uploads/sites/35/2015/06/transverses.png\" alt=\"The Transverse Ranges are raised by transpression across the San Andreas fault (heavy red line). Offshore faults in the Borderland have the same tangled relationships as the faults seen onshore.\" width=\"600\" height=\"400\" class=\"size-full wp-image-30790\" srcset=\"https://cdn.kqed.org/wp-content/uploads/sites/35/2015/06/transverses.png 600w, https://cdn.kqed.org/wp-content/uploads/sites/35/2015/06/transverses-400x267.png 400w\" sizes=\"(max-width: 600px) 100vw, 600px\">\u003c/a>\u003cfigcaption class=\"wp-caption-text\">The Transverse Ranges are raised by transpression across the San Andreas fault (heavy red line). Offshore faults in the Borderland have the same tangled relationships as the faults seen onshore. (Alden/USGS)\u003c/figcaption>\u003c/figure>\n\u003cp>Vertical changes in the land are always part of transpression, and its effects are especially strong in the Borderland. The Channel Islands, for instance, have been tilted and lifted above the sea as one consequence. Many more undersea mountains and basins show its effects. \u003c/p>\n\u003cp>It is the thrust part of transpression in the Borderland that threatens to make tsunamis. Thrust-heavy fault segments, or separate thrust earthquakes, are what raise or lower the seafloor and push the overlying seawater into tsunami waves. And they do so over large areas at once.\u003c/p>\n\u003cp>Legg thinks the magnitude-7 Lompoc earthquake of November 4, 1927, may have been such an event. “The actual location and causative fault is still controversial and may never be completely resolved. The important point is that seafloor deformation of the shallow continental shelf produced a 6-foot tsunami on the adjacent coast.”\u003c/p>\n\u003cp>Legg’s work suggests that, while the Borderland would not unleash a tsunami like the wave from the magnitude-9 monster quake in Japan, it still poses a significant risk of quakes that would cause large tsunamis several meters high. \u003c/p>\n\u003cp>\u003c/p>\n\u003cp>“I worry that the area between San Clemente, Santa Catalina, and Santa Barbara Islands is a seismic gap,” Legg says, “loaded, locked, and ready for a Big One offshore.”\u003c/p>\n\n",
"stats": {
"hasVideo": false,
"hasChartOrMap": false,
"hasAudio": false,
"hasPolis": false,
"wordCount": 834,
"hasGoogleForm": false,
"hasGallery": false,
"hasHearkenModule": false,
"iframeSrcs": [],
"paragraphCount": 16
},
"modified": 1704931723,
"excerpt": "A new study of earthquake faults shows tsunamis could happen more often than previously thought.\r\n",
"headData": {
"twImgId": "",
"twTitle": "",
"ogTitle": "",
"ogImgId": "",
"twDescription": "",
"description": "A new study of earthquake faults shows tsunamis could happen more often than previously thought.\r\n",
"title": "New Maps Reveal Tsunami Risk for Los Angeles | KQED",
"ogDescription": "",
"schema": {
"@context": "https://schema.org",
"@type": "Article",
"headline": "New Maps Reveal Tsunami Risk for Los Angeles",
"datePublished": "2015-06-04T14:42:41-07:00",
"dateModified": "2024-01-10T16:08:43-08:00",
"image": "https://cdn.kqed.org/wp-content/uploads/2020/02/KQED-OG-Image@1x.png"
}
},
"guestAuthors": [],
"slug": "new-maps-reveal-tsunami-risk-for-los-angeles-2",
"status": "publish",
"sticky": false,
"path": "/science/30783/new-maps-reveal-tsunami-risk-for-los-angeles-2",
"audioTrackLength": null,
"parsedContent": [
{
"type": "contentString",
"content": "\u003cdiv class=\"post-body\">\u003cp>\u003cp>A new study argues that at least two large earthquake faults off the coast of Southern California can spawn damaging tsunamis that would wash over San Diego, Long Beach, Santa Barbara and other coastal cities. The study’s findings could force changes in the disaster plans for these places.\u003cbr>\n\u003ca href=\"http://onlinelibrary.wiley.com/doi/10.1002/2014JF003322/full\">\u003c/a>\u003c/p>\n\u003cp>In the study, published by the Journal of Geophysical Research, a team led by Mark Legg scrounged years of data from different undersea surveys to analyze the offshore lands of Southern California in unprecedented detail. Looking both on and underneath the deep sea floor, Legg’s team found some of the earthquake faults off California are longer and more threatening than previously thought – capable not only of generating large earthquakes, but of launching dangerous tsunamis toward the nearby coast.\u003c/p>\n\u003cfigure id=\"attachment_30786\" class=\"wp-caption alignright\" style=\"max-width: 499px\">\u003ca href=\"http://ww2.kqed.org/science/wp-content/uploads/sites/35/2015/06/borderland.png\">\u003cimg loading=\"lazy\" decoding=\"async\" src=\"http://ww2.kqed.org/science/wp-content/uploads/sites/35/2015/06/borderland.png\" alt=\"The California Continental Borderland in its larger plate-tectonic setting. (Alden/USGS)\" width=\"499\" height=\"500\" class=\"size-full wp-image-30786\" srcset=\"https://cdn.kqed.org/wp-content/uploads/sites/35/2015/06/borderland.png 499w, https://cdn.kqed.org/wp-content/uploads/sites/35/2015/06/borderland-400x401.png 400w, https://cdn.kqed.org/wp-content/uploads/sites/35/2015/06/borderland-32x32.png 32w, https://cdn.kqed.org/wp-content/uploads/sites/35/2015/06/borderland-64x64.png 64w, https://cdn.kqed.org/wp-content/uploads/sites/35/2015/06/borderland-96x96.png 96w, https://cdn.kqed.org/wp-content/uploads/sites/35/2015/06/borderland-128x128.png 128w, https://cdn.kqed.org/wp-content/uploads/sites/35/2015/06/borderland-75x75.png 75w\" sizes=\"(max-width: 499px) 100vw, 499px\">\u003c/a>\u003cfigcaption class=\"wp-caption-text\">The California Continental Borderland in its larger plate-tectonic setting. (Alden/USGS)\u003c/figcaption>\u003c/figure>\n\u003cp>Legg’s study makes two main contributions. First, it builds a more accurate picture of fault activity where the Pacific and North America plates intersect, in the enigmatic region known as the California Continental Borderland. Second, it considers an underappreciated aspect of California’s faults that geologists call transpression.\u003c/p>\n\u003cp>\u003cstrong>A Fractured Borderland\u003cbr>\n\u003c/strong>\u003cbr>\nThe California Continental Borderland extends from Santa Barbara down to Baja California, all submerged except for the Channel Islands. It’s a peculiar piece of Earth’s crust. It started out as part of the North America tectonic plate: a thick pile of rocks and mud on the continent’s edge. Things changed about 28 million years ago as the Pacific plate took over offshore and the San Andreas fault was born. The Borderland splintered off the continent, and it’s been moving northwestward on the Pacific plate ever since. \u003c/p>\n\u003cp>That process is tearing the Borderland apart. \u003ca href=\"http://emvc.geol.ucsb.edu/2_infopgs/IP4WNACal/cCalifornia.html\">Plate tectonic animations\u003c/a> resemble the kind of mess you might see as tree trunks float down a river into an obstruction – a tectonic logjam. Today the Borderland is a badly cracked region. \u003c/p>\n\u003cfigure id=\"attachment_30789\" class=\"wp-caption alignleft\" style=\"max-width: 698px\">\u003ca href=\"http://ww2.kqed.org/science/wp-content/uploads/sites/35/2015/06/CCB-tectonicmap.png\">\u003cimg loading=\"lazy\" decoding=\"async\" src=\"http://ww2.kqed.org/science/wp-content/uploads/sites/35/2015/06/CCB-tectonicmap.png\" alt=\"This figure from Legg's paper shows the tectonic action going on in the Borderland today. The "beachball" symbols represent historic shear earthquakes (black) and thrust earthquakes (red), the type that cause tsunamis. The red arrows mark locations of transpression, discussed below. (Legg/American Geophysical Union)\" width=\"698\" height=\"557\" class=\"size-full wp-image-30789\" srcset=\"https://cdn.kqed.org/wp-content/uploads/sites/35/2015/06/CCB-tectonicmap.png 698w, https://cdn.kqed.org/wp-content/uploads/sites/35/2015/06/CCB-tectonicmap-400x319.png 400w\" sizes=\"(max-width: 698px) 100vw, 698px\">\u003c/a>\u003cfigcaption class=\"wp-caption-text\">This figure from Legg’s paper shows the tectonic action going on in the Borderland today. The “beachball” symbols represent historic shear earthquakes (black) and thrust earthquakes (red), the type that cause tsunamis. The red arrows mark locations of transpression, discussed below. (Legg/American Geophysical Union)\u003c/figcaption>\u003c/figure>\n\u003cp>Legg’s paper is a detailed description of two large faults in the seafloor of the Borderland: the 110-mile Santa Cruz-Catalina Ridge fault (“SCCR” on the map), and the 220-mile Ferrelo fault zone, extending from Santa Rosa Island to the deep Velero Basin, in Mexican waters. \u003c/p>\n\u003cp>\u003c/p>\u003c/div>",
"attributes": {
"named": {},
"numeric": []
}
},
{
"type": "component",
"content": "",
"name": "ad",
"attributes": {
"named": {
"label": "fullwidth"
},
"numeric": [
"fullwidth"
]
}
},
{
"type": "contentString",
"content": "\u003cdiv class=\"post-body\">\u003cp>\u003c/p>\n\u003cp>These faults are jagged lines built of many different segments. Seismologists know from recent research that disjointed-looking faults like these \u003ca href=\"http://blogs.kqed.org/science/2015/05/28/two-faults-could-make-one-big-earthquake/\">can rupture along several segments at once\u003c/a>, adding up to a very large wallop, approaching magnitude 8. And Legg’s study shows these faults are currently active.\u003c/p>\n\u003cp>\u003cstrong>Moving in Two Directions At Once\u003cbr>\n\u003c/strong>\u003cbr>\nWhen the two sides of the fault slip past each other like traffic on a two-way street, we call that motion shear. (Actually, physicists call it shear; geologists call it transcurrent motion.) When the quake moves the land up and down, we call it compression. Transpression refers to that combination of shear and compression. \u003c/p>\n\u003cp>For instance, Legg notes that the 1989 Loma Prieta earthquake directed part of its energy into uplifting the ground—and because some of that ground was offshore, it produced a tiny tsunami an inch or so high. \u003c/p>\n\u003cfigure id=\"attachment_30790\" class=\"wp-caption alignright\" style=\"max-width: 600px\">\u003ca href=\"http://ww2.kqed.org/science/wp-content/uploads/sites/35/2015/06/transverses.png\">\u003cimg loading=\"lazy\" decoding=\"async\" src=\"http://ww2.kqed.org/science/wp-content/uploads/sites/35/2015/06/transverses.png\" alt=\"The Transverse Ranges are raised by transpression across the San Andreas fault (heavy red line). Offshore faults in the Borderland have the same tangled relationships as the faults seen onshore.\" width=\"600\" height=\"400\" class=\"size-full wp-image-30790\" srcset=\"https://cdn.kqed.org/wp-content/uploads/sites/35/2015/06/transverses.png 600w, https://cdn.kqed.org/wp-content/uploads/sites/35/2015/06/transverses-400x267.png 400w\" sizes=\"(max-width: 600px) 100vw, 600px\">\u003c/a>\u003cfigcaption class=\"wp-caption-text\">The Transverse Ranges are raised by transpression across the San Andreas fault (heavy red line). Offshore faults in the Borderland have the same tangled relationships as the faults seen onshore. (Alden/USGS)\u003c/figcaption>\u003c/figure>\n\u003cp>Vertical changes in the land are always part of transpression, and its effects are especially strong in the Borderland. The Channel Islands, for instance, have been tilted and lifted above the sea as one consequence. Many more undersea mountains and basins show its effects. \u003c/p>\n\u003cp>It is the thrust part of transpression in the Borderland that threatens to make tsunamis. Thrust-heavy fault segments, or separate thrust earthquakes, are what raise or lower the seafloor and push the overlying seawater into tsunami waves. And they do so over large areas at once.\u003c/p>\n\u003cp>Legg thinks the magnitude-7 Lompoc earthquake of November 4, 1927, may have been such an event. “The actual location and causative fault is still controversial and may never be completely resolved. The important point is that seafloor deformation of the shallow continental shelf produced a 6-foot tsunami on the adjacent coast.”\u003c/p>\n\u003cp>Legg’s work suggests that, while the Borderland would not unleash a tsunami like the wave from the magnitude-9 monster quake in Japan, it still poses a significant risk of quakes that would cause large tsunamis several meters high. \u003c/p>\n\u003cp>\u003c/p>\n\u003cp>“I worry that the area between San Clemente, Santa Catalina, and Santa Barbara Islands is a seismic gap,” Legg says, “loaded, locked, and ready for a Big One offshore.”\u003c/p>\n\n\u003c/div>\u003c/p>",
"attributes": {
"named": {},
"numeric": []
}
}
],
"link": "/science/30783/new-maps-reveal-tsunami-risk-for-los-angeles-2",
"authors": [
"6228"
],
"categories": [
"science_38",
"science_40"
],
"tags": [
"science_257",
"science_5190",
"science_258"
],
"featImg": "science_30781",
"label": "science"
},
"science_30558": {
"type": "posts",
"id": "science_30558",
"meta": {
"index": "posts_1716263798",
"site": "science",
"id": "30558",
"score": null,
"sort": [
1432818010000
]
},
"parent": 0,
"labelTerm": {
"site": "science"
},
"blocks": [],
"publishDate": 1432818010,
"format": "aside",
"title": "Two Faults Could Make One Big Earthquake",
"headTitle": "Two Faults Could Make One Big Earthquake | KQED",
"content": "\u003cfigure id=\"attachment_30559\" class=\"wp-caption aligncenter\" style=\"max-width: 800px\">\u003ca href=\"http://ww2.kqed.org/science/wp-content/uploads/sites/35/2015/05/HF-CF-GE-map.png\">\u003cimg loading=\"lazy\" decoding=\"async\" src=\"http://ww2.kqed.org/science/wp-content/uploads/sites/35/2015/05/HF-CF-GE-map.png\" alt=\"Where the Hayward and Calaveras faults join\" width=\"800\" height=\"450\" class=\"size-full wp-image-30559\">\u003c/a>\u003cfigcaption class=\"wp-caption-text\">A new study has traced the connection between the Hayward and Calaveras faults at the surface (dashed line) and deep underground (dotted line). (Alden/Google Earth)\u003c/figcaption>\u003c/figure>\n\u003cp>Ask Bay Area seismologists their most worrisome earthquake scenario, and many will say it’s not a repeat of the great San Francisco quake of 1906. They don’t think that’s likely. Instead, it’s a possibility considered unthinkable not long ago. That would be a rupture that tears the full length of the Hayward fault, between Pinole and Fremont, then jumps past the end to the next fault. \u003c/p>\n\u003cp>The next fault to the north is the Rodgers Creek fault, running from San Pablo Bay into Sonoma County. Scientists have made scenarios for big quakes on the combined Hayward-Rodgers Creek. The damage from shaking, fires and landslides would exceed $200 billion.\u003c/p>\n\u003cp>The next fault to the south is the Calaveras fault, running from east of San Jose past Hollister. But that combination hasn’t been modeled. Until a few years ago nobody thought this deadly combo was likely. \u003c/p>\n\u003cp>Where the two faults merge, geologists have mapped a complex snarl of ground fractures. The faults don’t appear to line up together well, which means they would prevent any rupture from pushing through. But our maps have been too imprecise to be certain.\u003c/p>\n\u003cp>Now UC Berkeley seismologist Estelle Chaussard has assembled the clearest picture yet of the Hayward-Calaveras merge. Her model, \u003ca href=\"http://onlinelibrary.wiley.com/doi/10.1002/2015GL063575/abstract\">just published\u003c/a> in the journal \u003ca href=\"http://agupubs.onlinelibrary.wiley.com/agu/journal/10.1002/%28ISSN%291944-8007/\">Geophysical Research Letters\u003c/a>, simplifies the intersection while showing that deep underground, the two faults line up dangerously straight together. But the same model helps us to simulate and plan for the hazard of a combined fault rupture. \u003c/p>\n\u003caside class=\"pullquote alignleft\">The deep part of this combined fault is storing energy for very large earthquakes. \u003c/aside>\n\u003cp>Deep underground where earthquakes actually take place, the two faults join in a smooth line. But when geologists map the fault traces in this area – if they can even see them in the underbrush and landslide scars – the maps look as untidy as the edges of a torn-up newspaper. Moreover, they can’t tell which of the various fault traces is currently active. \u003c/p>\n\u003cp>[ad fullwidth]\u003c/p>\n\u003cp>Both the Hayward and Calaveras faults are known for exhibiting \u003ca href=\"http://ww2.kqed.org/science/2014/10/16/new-paper-outlines-updated-look-hazards-on-san-andreas-fault-system/\">creep\u003c/a> – slow, quiet motion measured in millimeters per year – but no creep measurements have been done in this rugged and remote area. (\u003ca href=\"http://geomaps.wr.usgs.gov/gump/people/jwatt/haycal_3d.html\">See another scientist’s earlier effort to deal with this uncertainty.\u003c/a>)\u003c/p>\n\u003cp>Chaussard built the new model using two advanced techniques that sidestep the limits of what geologists on the ground can see. With these she could use the faults’ day-to-day activity, instead of their cryptic cracks on the ground, to draw their portrait.\u003c/p>\n\u003cp>First, she found a way to measure and map creep using InSAR (\u003ca href=\"http://en.wikipedia.org/wiki/Interferometric_synthetic_aperture_radar\">interferometric synthetic aperture radar\u003c/a>), a satellite-based technique that’s been surveying the ground with centimeter accuracy since the early 1990s. \u003c/p>\n\u003cp>Selecting high-quality images from 1992 to 2011, she detected the exact zones where the ground has been creeping on both the Hayward and Calaveras faults. These curving traces mark, for the first time, the direct surface connection between the two faults. She also compared slip estimates across the merge area to show that the motions on the two faults are in balance.\u003c/p>\n\u003cp>Second, Chaussard selected a set of repeating small earthquakes to map the exact underground contours of the fault. She employed \u003ca href=\"http://www.ldeo.columbia.edu/~felixw/DD.html\">double-difference earthquake location\u003c/a>, first used in 2000 on the Hayward fault, to sharpen the picture painted by these pinpricks of seismic activity.\u003c/p>\n\u003cp>She found that shallow quakes (less than 3 kilometers deep) lined up with the curving surface connection, the last bit of the Hayward fault. Deeper ones lined up instead with a straight plane that joins the Hayward and Calaveras faults in a single mega-fault. \u003c/p>\n\u003cfigure id=\"attachment_30577\" class=\"wp-caption aligncenter\" style=\"max-width: 775px\">\u003ca href=\"http://ww2.kqed.org/science/wp-content/uploads/sites/35/2015/05/Image2.png\">\u003cimg loading=\"lazy\" decoding=\"async\" src=\"http://ww2.kqed.org/science/wp-content/uploads/sites/35/2015/05/Image2.png\" alt=\"New model of the Hayward-Calaveras fault junction\" width=\"775\" height=\"500\" class=\"size-full wp-image-30577\">\u003c/a>\u003cfigcaption class=\"wp-caption-text\">This figure from Chaussard’s paper shows on the left-hand map where repeating earthquakes (circles) and surface creep (lines) trace the southernmost Hayward fault both at the surface and at depth. On the right, her new model of the fault juncture (small square) fills in the key part of the full-size model used to simulate large earthquakes. (Chaussard/GRL)\u003c/figcaption>\u003c/figure>\n\u003cp>The deep part of this combined fault is storing energy for very large earthquakes. With her new, clean images of both surface and deep activity, Chaussard built a geometric model of this crucial piece of California. \u003c/p>\n\u003cp>What does that mean? The U.S. Geological Survey says that an end-to-end rupture of the Hayward fault would cause an earthquake of magnitude 7.5. Adding the Calaveras to that would raise the magnitude to roughly the same size as the 1906 earthquake on the San Andreas fault. Damages from such a quake might reach $300 billion. \u003c/p>\n\u003cp>\u003c/p>\n\u003cp>Until now, scientists have not been able to run realistic earthquake simulations for a Hayward-Calaveras megafault. Chaussard’s new model of their juncture will help in modeling this threatening possibility. “We hope our paper will trigger the necessary interest so that other groups start working on it,” Chaussard says.\u003c/p>\n\n",
"stats": {
"hasVideo": false,
"hasChartOrMap": false,
"hasAudio": false,
"hasPolis": false,
"wordCount": 857,
"hasGoogleForm": false,
"hasGallery": false,
"hasHearkenModule": false,
"iframeSrcs": [],
"paragraphCount": 17
},
"modified": 1704931750,
"excerpt": "A new model of the deep earth east of San Jose will help earthquake scientists investigate a fearsome possibility: a major quake caused by a combined rupture of the Hayward and Calaveras faults.",
"headData": {
"twImgId": "",
"twTitle": "",
"ogTitle": "",
"ogImgId": "",
"twDescription": "",
"description": "A new model of the deep earth east of San Jose will help earthquake scientists investigate a fearsome possibility: a major quake caused by a combined rupture of the Hayward and Calaveras faults.",
"title": "Two Faults Could Make One Big Earthquake | KQED",
"ogDescription": "",
"schema": {
"@context": "https://schema.org",
"@type": "Article",
"headline": "Two Faults Could Make One Big Earthquake",
"datePublished": "2015-05-28T06:00:10-07:00",
"dateModified": "2024-01-10T16:09:10-08:00",
"image": "https://cdn.kqed.org/wp-content/uploads/2020/02/KQED-OG-Image@1x.png"
}
},
"guestAuthors": [],
"slug": "two-faults-could-make-one-big-earthquake",
"status": "publish",
"sticky": false,
"path": "/science/30558/two-faults-could-make-one-big-earthquake",
"audioTrackLength": null,
"parsedContent": [
{
"type": "contentString",
"content": "\u003cdiv class=\"post-body\">\u003cp>\u003cfigure id=\"attachment_30559\" class=\"wp-caption aligncenter\" style=\"max-width: 800px\">\u003ca href=\"http://ww2.kqed.org/science/wp-content/uploads/sites/35/2015/05/HF-CF-GE-map.png\">\u003cimg loading=\"lazy\" decoding=\"async\" src=\"http://ww2.kqed.org/science/wp-content/uploads/sites/35/2015/05/HF-CF-GE-map.png\" alt=\"Where the Hayward and Calaveras faults join\" width=\"800\" height=\"450\" class=\"size-full wp-image-30559\">\u003c/a>\u003cfigcaption class=\"wp-caption-text\">A new study has traced the connection between the Hayward and Calaveras faults at the surface (dashed line) and deep underground (dotted line). (Alden/Google Earth)\u003c/figcaption>\u003c/figure>\n\u003cp>Ask Bay Area seismologists their most worrisome earthquake scenario, and many will say it’s not a repeat of the great San Francisco quake of 1906. They don’t think that’s likely. Instead, it’s a possibility considered unthinkable not long ago. That would be a rupture that tears the full length of the Hayward fault, between Pinole and Fremont, then jumps past the end to the next fault. \u003c/p>\n\u003cp>The next fault to the north is the Rodgers Creek fault, running from San Pablo Bay into Sonoma County. Scientists have made scenarios for big quakes on the combined Hayward-Rodgers Creek. The damage from shaking, fires and landslides would exceed $200 billion.\u003c/p>\n\u003cp>The next fault to the south is the Calaveras fault, running from east of San Jose past Hollister. But that combination hasn’t been modeled. Until a few years ago nobody thought this deadly combo was likely. \u003c/p>\n\u003cp>Where the two faults merge, geologists have mapped a complex snarl of ground fractures. The faults don’t appear to line up together well, which means they would prevent any rupture from pushing through. But our maps have been too imprecise to be certain.\u003c/p>\n\u003cp>Now UC Berkeley seismologist Estelle Chaussard has assembled the clearest picture yet of the Hayward-Calaveras merge. Her model, \u003ca href=\"http://onlinelibrary.wiley.com/doi/10.1002/2015GL063575/abstract\">just published\u003c/a> in the journal \u003ca href=\"http://agupubs.onlinelibrary.wiley.com/agu/journal/10.1002/%28ISSN%291944-8007/\">Geophysical Research Letters\u003c/a>, simplifies the intersection while showing that deep underground, the two faults line up dangerously straight together. But the same model helps us to simulate and plan for the hazard of a combined fault rupture. \u003c/p>\n\u003caside class=\"pullquote alignleft\">The deep part of this combined fault is storing energy for very large earthquakes. \u003c/aside>\n\u003cp>Deep underground where earthquakes actually take place, the two faults join in a smooth line. But when geologists map the fault traces in this area – if they can even see them in the underbrush and landslide scars – the maps look as untidy as the edges of a torn-up newspaper. Moreover, they can’t tell which of the various fault traces is currently active. \u003c/p>\n\u003cp>\u003c/p>\u003c/div>",
"attributes": {
"named": {},
"numeric": []
}
},
{
"type": "component",
"content": "",
"name": "ad",
"attributes": {
"named": {
"label": "fullwidth"
},
"numeric": [
"fullwidth"
]
}
},
{
"type": "contentString",
"content": "\u003cdiv class=\"post-body\">\u003cp>\u003c/p>\n\u003cp>Both the Hayward and Calaveras faults are known for exhibiting \u003ca href=\"http://ww2.kqed.org/science/2014/10/16/new-paper-outlines-updated-look-hazards-on-san-andreas-fault-system/\">creep\u003c/a> – slow, quiet motion measured in millimeters per year – but no creep measurements have been done in this rugged and remote area. (\u003ca href=\"http://geomaps.wr.usgs.gov/gump/people/jwatt/haycal_3d.html\">See another scientist’s earlier effort to deal with this uncertainty.\u003c/a>)\u003c/p>\n\u003cp>Chaussard built the new model using two advanced techniques that sidestep the limits of what geologists on the ground can see. With these she could use the faults’ day-to-day activity, instead of their cryptic cracks on the ground, to draw their portrait.\u003c/p>\n\u003cp>First, she found a way to measure and map creep using InSAR (\u003ca href=\"http://en.wikipedia.org/wiki/Interferometric_synthetic_aperture_radar\">interferometric synthetic aperture radar\u003c/a>), a satellite-based technique that’s been surveying the ground with centimeter accuracy since the early 1990s. \u003c/p>\n\u003cp>Selecting high-quality images from 1992 to 2011, she detected the exact zones where the ground has been creeping on both the Hayward and Calaveras faults. These curving traces mark, for the first time, the direct surface connection between the two faults. She also compared slip estimates across the merge area to show that the motions on the two faults are in balance.\u003c/p>\n\u003cp>Second, Chaussard selected a set of repeating small earthquakes to map the exact underground contours of the fault. She employed \u003ca href=\"http://www.ldeo.columbia.edu/~felixw/DD.html\">double-difference earthquake location\u003c/a>, first used in 2000 on the Hayward fault, to sharpen the picture painted by these pinpricks of seismic activity.\u003c/p>\n\u003cp>She found that shallow quakes (less than 3 kilometers deep) lined up with the curving surface connection, the last bit of the Hayward fault. Deeper ones lined up instead with a straight plane that joins the Hayward and Calaveras faults in a single mega-fault. \u003c/p>\n\u003cfigure id=\"attachment_30577\" class=\"wp-caption aligncenter\" style=\"max-width: 775px\">\u003ca href=\"http://ww2.kqed.org/science/wp-content/uploads/sites/35/2015/05/Image2.png\">\u003cimg loading=\"lazy\" decoding=\"async\" src=\"http://ww2.kqed.org/science/wp-content/uploads/sites/35/2015/05/Image2.png\" alt=\"New model of the Hayward-Calaveras fault junction\" width=\"775\" height=\"500\" class=\"size-full wp-image-30577\">\u003c/a>\u003cfigcaption class=\"wp-caption-text\">This figure from Chaussard’s paper shows on the left-hand map where repeating earthquakes (circles) and surface creep (lines) trace the southernmost Hayward fault both at the surface and at depth. On the right, her new model of the fault juncture (small square) fills in the key part of the full-size model used to simulate large earthquakes. (Chaussard/GRL)\u003c/figcaption>\u003c/figure>\n\u003cp>The deep part of this combined fault is storing energy for very large earthquakes. With her new, clean images of both surface and deep activity, Chaussard built a geometric model of this crucial piece of California. \u003c/p>\n\u003cp>What does that mean? The U.S. Geological Survey says that an end-to-end rupture of the Hayward fault would cause an earthquake of magnitude 7.5. Adding the Calaveras to that would raise the magnitude to roughly the same size as the 1906 earthquake on the San Andreas fault. Damages from such a quake might reach $300 billion. \u003c/p>\n\u003cp>\u003c/p>\n\u003cp>Until now, scientists have not been able to run realistic earthquake simulations for a Hayward-Calaveras megafault. Chaussard’s new model of their juncture will help in modeling this threatening possibility. “We hope our paper will trigger the necessary interest so that other groups start working on it,” Chaussard says.\u003c/p>\n\n\u003c/div>\u003c/p>",
"attributes": {
"named": {},
"numeric": []
}
}
],
"link": "/science/30558/two-faults-could-make-one-big-earthquake",
"authors": [
"6228"
],
"categories": [
"science_38"
],
"tags": [
"science_427",
"science_654"
],
"featImg": "science_30559",
"label": "science"
},
"science_30233": {
"type": "posts",
"id": "science_30233",
"meta": {
"index": "posts_1716263798",
"site": "science",
"id": "30233",
"score": null,
"sort": [
1431608457000
]
},
"parent": 0,
"labelTerm": {
"site": "science"
},
"blocks": [],
"publishDate": 1431608457,
"format": "aside",
"title": "The Biggest Waves in the World Yield Their Secrets",
"headTitle": "The Biggest Waves in the World Yield Their Secrets | KQED",
"content": "\u003cfigure id=\"attachment_30234\" class=\"wp-caption aligncenter\" style=\"max-width: 800px\">\u003ca href=\"http://ww2.kqed.org/science/wp-content/uploads/sites/35/2015/05/luzon-waves.jpg\">\u003cimg loading=\"lazy\" decoding=\"async\" src=\"http://ww2.kqed.org/science/wp-content/uploads/sites/35/2015/05/luzon-waves.jpg\" alt=\"Internal waves in the South China Sea\" width=\"800\" height=\"450\" class=\"size-full wp-image-30234\">\u003c/a>\u003cfigcaption class=\"wp-caption-text\">Powerful waves below the ocean’s surface, made visible as curving silver traces by their effects on surface roughness, spread westward into the South China Sea through Luzon Strait, the 200-mile-wide waterway between the southern tip of Taiwan (top right) and the northern tip of the Philippines (bottom right). At left is Dongsha Atoll, a Taiwan national park. (NASA/Global Ocean Associates)\u003c/figcaption>\u003c/figure>\n\u003cp>Slow, enormous waves that move beneath the ocean surface have intrigued researchers for a century. These “internal waves” affect the world’s deep seas in many ways, but they’re hard to observe. \u003c/p>\n\u003cp>Internal waves play a major role in mixing the ocean’s water. Global climate models need to account for this mixing because it warms the deep sea and cools the ocean surface. Internal waves also move seafloor sediment and nutrients, affecting fisheries and coral reefs. And underwater operations, from oil drilling to submarine missions, need data on the deep-sea “weather” of turbulence and disturbances that internal waves produce. \u003c/p>\n\u003cp>A new paper giving the first “cradle-to-grave” explanation of the world’s strongest internal waves was \u003ca href=\"http://www.nature.com/nature/journal/v521/n7550/full/nature14399.html\">published this week\u003c/a> in the journal \u003ca href=\"http://www.nature.com/nature/index.html\">Nature\u003c/a>. It’s a major step forward in ocean science.\u003c/p>\n\u003cp>Physics explains how ordinary waves, known as gravity waves, behave in water. The same physics permits gravity waves to form \u003ci>inside\u003c/i> the sea wherever two layers of different water density meet. To see an everyday example, take a bottle of salad dressing, with oil on top and vinegar underneath. Instead of shaking the bottle, tilt it gently and watch the internal waves between the oil and vinegar.\u003c/p>\n\u003cp>The ocean has many places where internal waves happen. All that’s needed is two layers of water with different density. For instance, where rivers pour fresh water on top of denser seawater, internal waves can form on the hidden surface of the seawater. In the Arctic Ocean, melting ice can spread a calm layer of fresh water as the salty sea continues to roil beneath it.\u003c/p>\n\u003cp>[ad fullwidth]\u003c/p>\n\u003cp>The world’s strongest internal waves are found in the South China Sea. There, the daily motion of the tides through Luzon Strait creates internal waves hundreds of meters high within the dense layer of cold deep water under the warmer surface water. As the tides wash over a pair of large underwater ridges in Luzon Strait and slosh between them, the activity sends huge, slow-motion internal waves westward into the South China Sea. They’re so slow that they barely disturb the sea surface, but satellites can observe their effects. The video below (from MIT) shows the basic mechanism.\u003c/p>\n\u003cp>http://www.youtube.com/watch?v=WYmRnSRsS7Y\u003cbr>\n\u003c/p>\n\u003cp>\u003ca href=\"http://onlinelibrary.wiley.com/doi/10.1002/2013GL058064/abstract\">One study last year\u003c/a> created a miniature model of Luzon Strait in a large tank at a lab in Switzerland. Ocean currents and internal waves were reproduced in the \u003ca href=\"http://www.legi.grenoble-inp.fr/web/spip.php?rubrique10&lang=en\">Coriolis Platform\u003c/a>, a round pool four feet deep and 40 feet across, mounted on the world’s largest turntable. \u003c/p>\n\u003cp>The new paper in Nature added to that information with hard-won data collected in the South China Sea in 2010 and 2011. The IWISE project (Internal Waves in Straits Experiment) used research ships, subsea instrument stations and underwater gliders to collect data under challenging conditions of strong currents and treacherous seas. Instruments recorded levels of turbulence in Luzon Strait more than 10,000 times stronger than the oceanic average. \u003c/p>\n\u003cp>This data yielded a detailed picture of how the internal waves are generated, why they only move west from Luzon Strait instead of both ways, and how they break upon the undersea slopes of the South China Sea. The researchers also learned how the internal waves interact with the powerful \u003ca href=\"http://www.pmel.noaa.gov/np/pages/subregions/kroy.html\">Kuroshio ocean current\u003c/a>.\u003c/p>\n\u003cp>\u003c/p>\n\u003cp>Scientists can make good use of this new analysis. Internal waves form all over the ocean — particularly in island chains like Hawaii — just as strong winds create internal waves in the atmosphere near mountain ranges like the Sierra Nevada. And these subsurface waves break along shorelines that have wide, shallow offshore shelves, like the U.S. east coast. NASA Visible Earth collection has \u003ca href=\"http://visibleearth.nasa.gov/search.php?hq=&q=internal+waves&sa=search\">many examples of atmospheric and oceanic internal waves\u003c/a> seen from space. \u003ca href=\"http://www.tos.org/oceanography/archive/25-2_st_laurent.pdf\">A brief tutorial\u003c/a> in the journal Oceanography gives more detail for those who’ve studied introductory physics. And a site called \u003ca href=\"http://www.internalwaveatlas.com/\">Internal Wave Atlas\u003c/a> presents 86 case studies from around the world.\u003c/p>\n\n",
"stats": {
"hasVideo": false,
"hasChartOrMap": false,
"hasAudio": false,
"hasPolis": false,
"wordCount": 740,
"hasGoogleForm": false,
"hasGallery": false,
"hasHearkenModule": false,
"iframeSrcs": [],
"paragraphCount": 12
},
"modified": 1704931797,
"excerpt": "Intensive research has laid bare the workings of gigantic \"internal waves\" that roil the deep seas. The results will advance climate models and make a wide range of marine activities more reliable.",
"headData": {
"twImgId": "",
"twTitle": "",
"ogTitle": "",
"ogImgId": "",
"twDescription": "",
"description": "Intensive research has laid bare the workings of gigantic "internal waves" that roil the deep seas. The results will advance climate models and make a wide range of marine activities more reliable.",
"title": "The Biggest Waves in the World Yield Their Secrets | KQED",
"ogDescription": "",
"schema": {
"@context": "https://schema.org",
"@type": "Article",
"headline": "The Biggest Waves in the World Yield Their Secrets",
"datePublished": "2015-05-14T06:00:57-07:00",
"dateModified": "2024-01-10T16:09:57-08:00",
"image": "https://cdn.kqed.org/wp-content/uploads/2020/02/KQED-OG-Image@1x.png"
}
},
"guestAuthors": [],
"slug": "the-biggest-waves-in-the-world-yield-their-secrets",
"status": "publish",
"sticky": false,
"path": "/science/30233/the-biggest-waves-in-the-world-yield-their-secrets",
"audioTrackLength": null,
"parsedContent": [
{
"type": "contentString",
"content": "\u003cdiv class=\"post-body\">\u003cp>\u003cfigure id=\"attachment_30234\" class=\"wp-caption aligncenter\" style=\"max-width: 800px\">\u003ca href=\"http://ww2.kqed.org/science/wp-content/uploads/sites/35/2015/05/luzon-waves.jpg\">\u003cimg loading=\"lazy\" decoding=\"async\" src=\"http://ww2.kqed.org/science/wp-content/uploads/sites/35/2015/05/luzon-waves.jpg\" alt=\"Internal waves in the South China Sea\" width=\"800\" height=\"450\" class=\"size-full wp-image-30234\">\u003c/a>\u003cfigcaption class=\"wp-caption-text\">Powerful waves below the ocean’s surface, made visible as curving silver traces by their effects on surface roughness, spread westward into the South China Sea through Luzon Strait, the 200-mile-wide waterway between the southern tip of Taiwan (top right) and the northern tip of the Philippines (bottom right). At left is Dongsha Atoll, a Taiwan national park. (NASA/Global Ocean Associates)\u003c/figcaption>\u003c/figure>\n\u003cp>Slow, enormous waves that move beneath the ocean surface have intrigued researchers for a century. These “internal waves” affect the world’s deep seas in many ways, but they’re hard to observe. \u003c/p>\n\u003cp>Internal waves play a major role in mixing the ocean’s water. Global climate models need to account for this mixing because it warms the deep sea and cools the ocean surface. Internal waves also move seafloor sediment and nutrients, affecting fisheries and coral reefs. And underwater operations, from oil drilling to submarine missions, need data on the deep-sea “weather” of turbulence and disturbances that internal waves produce. \u003c/p>\n\u003cp>A new paper giving the first “cradle-to-grave” explanation of the world’s strongest internal waves was \u003ca href=\"http://www.nature.com/nature/journal/v521/n7550/full/nature14399.html\">published this week\u003c/a> in the journal \u003ca href=\"http://www.nature.com/nature/index.html\">Nature\u003c/a>. It’s a major step forward in ocean science.\u003c/p>\n\u003cp>Physics explains how ordinary waves, known as gravity waves, behave in water. The same physics permits gravity waves to form \u003ci>inside\u003c/i> the sea wherever two layers of different water density meet. To see an everyday example, take a bottle of salad dressing, with oil on top and vinegar underneath. Instead of shaking the bottle, tilt it gently and watch the internal waves between the oil and vinegar.\u003c/p>\n\u003cp>The ocean has many places where internal waves happen. All that’s needed is two layers of water with different density. For instance, where rivers pour fresh water on top of denser seawater, internal waves can form on the hidden surface of the seawater. In the Arctic Ocean, melting ice can spread a calm layer of fresh water as the salty sea continues to roil beneath it.\u003c/p>\n\u003cp>\u003c/p>\u003c/div>",
"attributes": {
"named": {},
"numeric": []
}
},
{
"type": "component",
"content": "",
"name": "ad",
"attributes": {
"named": {
"label": "fullwidth"
},
"numeric": [
"fullwidth"
]
}
},
{
"type": "contentString",
"content": "\u003cdiv class=\"post-body\">\u003cp>\u003c/p>\n\u003cp>The world’s strongest internal waves are found in the South China Sea. There, the daily motion of the tides through Luzon Strait creates internal waves hundreds of meters high within the dense layer of cold deep water under the warmer surface water. As the tides wash over a pair of large underwater ridges in Luzon Strait and slosh between them, the activity sends huge, slow-motion internal waves westward into the South China Sea. They’re so slow that they barely disturb the sea surface, but satellites can observe their effects. The video below (from MIT) shows the basic mechanism.\u003c/p>\n\u003cp>http://www.youtube.com/watch?v=WYmRnSRsS7Y\u003cbr>\n\u003c/p>\n\u003cp>\u003ca href=\"http://onlinelibrary.wiley.com/doi/10.1002/2013GL058064/abstract\">One study last year\u003c/a> created a miniature model of Luzon Strait in a large tank at a lab in Switzerland. Ocean currents and internal waves were reproduced in the \u003ca href=\"http://www.legi.grenoble-inp.fr/web/spip.php?rubrique10&lang=en\">Coriolis Platform\u003c/a>, a round pool four feet deep and 40 feet across, mounted on the world’s largest turntable. \u003c/p>\n\u003cp>The new paper in Nature added to that information with hard-won data collected in the South China Sea in 2010 and 2011. The IWISE project (Internal Waves in Straits Experiment) used research ships, subsea instrument stations and underwater gliders to collect data under challenging conditions of strong currents and treacherous seas. Instruments recorded levels of turbulence in Luzon Strait more than 10,000 times stronger than the oceanic average. \u003c/p>\n\u003cp>This data yielded a detailed picture of how the internal waves are generated, why they only move west from Luzon Strait instead of both ways, and how they break upon the undersea slopes of the South China Sea. The researchers also learned how the internal waves interact with the powerful \u003ca href=\"http://www.pmel.noaa.gov/np/pages/subregions/kroy.html\">Kuroshio ocean current\u003c/a>.\u003c/p>\n\u003cp>\u003c/p>\n\u003cp>Scientists can make good use of this new analysis. Internal waves form all over the ocean — particularly in island chains like Hawaii — just as strong winds create internal waves in the atmosphere near mountain ranges like the Sierra Nevada. And these subsurface waves break along shorelines that have wide, shallow offshore shelves, like the U.S. east coast. NASA Visible Earth collection has \u003ca href=\"http://visibleearth.nasa.gov/search.php?hq=&q=internal+waves&sa=search\">many examples of atmospheric and oceanic internal waves\u003c/a> seen from space. \u003ca href=\"http://www.tos.org/oceanography/archive/25-2_st_laurent.pdf\">A brief tutorial\u003c/a> in the journal Oceanography gives more detail for those who’ve studied introductory physics. And a site called \u003ca href=\"http://www.internalwaveatlas.com/\">Internal Wave Atlas\u003c/a> presents 86 case studies from around the world.\u003c/p>\n\n\u003c/div>\u003c/p>",
"attributes": {
"named": {},
"numeric": []
}
}
],
"link": "/science/30233/the-biggest-waves-in-the-world-yield-their-secrets",
"authors": [
"6228"
],
"categories": [
"science_31",
"science_38"
],
"tags": [
"science_1000"
],
"featImg": "science_30234",
"label": "science"
},
"science_29852": {
"type": "posts",
"id": "science_29852",
"meta": {
"index": "posts_1716263798",
"site": "science",
"id": "29852",
"score": null,
"sort": [
1430514487000
]
},
"parent": 0,
"labelTerm": {
"site": "science"
},
"blocks": [],
"publishDate": 1430514487,
"format": "aside",
"title": "Fish Help Build Coral-Reef Islands",
"headTitle": "Fish Help Build Coral-Reef Islands | KQED",
"content": "\u003cfigure id=\"attachment_29853\" class=\"wp-caption aligncenter\" style=\"max-width: 800px\">\u003ca href=\"http://ww2.kqed.org/science/wp-content/uploads/sites/35/2015/04/Daisy-parrotfish-wikimedia.jpg\">\u003cimg loading=\"lazy\" decoding=\"async\" src=\"http://ww2.kqed.org/science/wp-content/uploads/sites/35/2015/04/Daisy-parrotfish-wikimedia.jpg\" alt=\"Daisy Parrotfish in the Maldives\" width=\"800\" height=\"450\" class=\"size-full wp-image-29853\">\u003c/a>\u003cfigcaption class=\"wp-caption-text\">Species like the daisy parrotfish, \u003ci>Chlorurus sordidus\u003c/i>, are a crucial link in the natural chain that builds dry land in the Maldives archipelago. The job they do is to grind big corals into sand with their toothy beaks. (Julien Bidet/Wikimedia) \u003ccite>(Julien Bidet/Wikimedia)\u003c/cite>\u003c/figcaption>\u003c/figure>\n\u003cp>Coral-reef islands, those sandy staples of tropical travel brochures, are also a geological puzzle of long standing. How can they remain above the sea in the face of tropical storms or rising sea level? A new study in the Indian Ocean singles out coral-crunching fish as a key player.\u003c/p>\n\u003cp>The Maldives are a group of more than a thousand cays, or low-lying sandy islands, within a large coral reef in the tropical Indian Ocean. These islands stabilize as storm waves throw sand up onto the beach, where the wind can move it around and pile it up into dunes. From there it’s just a matter of vegetation setting root to hold the sand in place as dry land.\u003c/p>\n\u003cp>The question that follows, then, is how does a reef make sand? The answer varies. The geologist knows that ordinary beach sand is made as erosion breaks rocks into tiny bits. But reef sand or \u003ca href=\"http://www.sandatlas.org/coral-sand/\">coral sand\u003c/a>, instead, is almost entirely made of bits of seashells and other carbonate-mineral stuff. This is material that living things have chemically extracted from the dissolved minerals in seawater.\u003c/p>\n\u003cp>Reefs, then, owe their sand to various living organisms. In some reefs, one-celled organisms (benthic foraminifera) secrete tiny mineral shells around themselves that become ready-made sand. Other reefs have their sand supplied by algae of various kinds, either green \u003ca href=\"http://www.reefkeeping.com/issues/2004-04/nftt/index.php\">calcareous algae of the \u003ci>Halimeda\u003c/i> group\u003c/a> or red \u003ca href=\"http://ww2.kqed.org/science/2013/11/21/arctic-algae-offer-new-insights-on-prehistoric-climate-data/\">coralline algae\u003c/a>. The reefs of the Maldives are forests of big, stony corals, but these don’t make much sand, even when large waves break them up. \u003c/p>\n\u003cp>\u003ca href=\"https://geography.exeter.ac.uk/staff/index.php?web_id=Chris_Perry\">Chris Perry\u003c/a>, of the University of Exeter, is a leading researcher in this field. For his new study, \u003ca href=\"http://geology.gsapubs.org/content/early/2015/04/27/G36623.1.abstract\">just published in the journal \u003ci>Geology\u003c/i>\u003c/a>, he and a team of researchers visited a little reef island in the Maldives named Vakkaru.\u003c/p>\n\u003cfigure id=\"attachment_29854\" class=\"wp-caption aligncenter\" style=\"max-width: 600px\">\u003ca href=\"http://ww2.kqed.org/science/wp-content/uploads/sites/35/2015/04/vakkaru.jpg\">\u003cimg loading=\"lazy\" decoding=\"async\" src=\"http://ww2.kqed.org/science/wp-content/uploads/sites/35/2015/04/vakkaru.jpg\" alt=\"Vakkaru island, Maldives\" width=\"600\" height=\"339\" class=\"size-full wp-image-29854\">\u003c/a>\u003cfigcaption class=\"wp-caption-text\">Vakkaru is about 1500 feet long. Find it at 5.492°N, 72.938°E, where Google Earth calls it Filaidhoo Island. (Google Earth)\u003c/figcaption>\u003c/figure>\n\u003cp>Perry’s research team mapped the ecosystem and the sediments around Vakkaru, taking care to sample each zone of the reef, from the outer flat to the pristine white beach.\u003c/p>\n\u003cp>[ad fullwidth]\u003c/p>\n\u003cp>They found that almost all of the sand around Vakkaru is created by parrotfish. These are a group of fish species with teeth on their lips; they make their living by chomping on corals, swallowing everything, digesting everything digestable and excreting the grit. The mixture of sizes of sand grains at Vakkaru is a close match for parrotfish poop, along with a dash of \u003ci>Halimeda\u003c/i> gravel.\u003c/p>\n\u003cp>Based on that finding, Perry drew up a neat and simple “geoecological” model for how Vakkaru and its fellow islands in the Maldives are maintained.\u003c/p>\n\u003cfigure id=\"attachment_29856\" class=\"wp-caption aligncenter\" style=\"max-width: 600px\">\u003ca href=\"http://ww2.kqed.org/science/wp-content/uploads/sites/35/2015/04/vakkaru-model.png\">\u003cimg loading=\"lazy\" decoding=\"async\" src=\"http://ww2.kqed.org/science/wp-content/uploads/sites/35/2015/04/vakkaru-model.png\" alt=\"Geoecological model of Vakkaru\" width=\"600\" height=\"425\" class=\"size-full wp-image-29856\">\u003c/a>\u003cfigcaption class=\"wp-caption-text\">(Perry/Geological Society of America)\u003c/figcaption>\u003c/figure>\n\u003cp>Perry’s model identifies five zones where fish and tidal activity contribute to the reef sand of Vakkaru. In the outermost zone, coral trees grow and are nibbled into sand by parrotfish. Waves then carry the sand toward the shore, where, eventually, the fine- and medium-grained bits get tossed up onto the beach. \u003c/p>\n\u003cp>\u003c/p>\n\u003cp>As the world’s lowest-elevation country, the Maldives faces the greatest threat from rising sea level. Clearly, as Perry concluded, parrotfish are a “key biogeoengineering species.” They do a lot more than look pretty for snorkelers. The continued good health of coral-crunching parrotfish will need to be safeguarded by the other key biogeoengineering species in the Maldives—human beings.\u003c/p>\n\n",
"stats": {
"hasVideo": false,
"hasChartOrMap": false,
"hasAudio": false,
"hasPolis": false,
"wordCount": 627,
"hasGoogleForm": false,
"hasGallery": false,
"hasHearkenModule": false,
"iframeSrcs": [],
"paragraphCount": 12
},
"modified": 1704931861,
"excerpt": "A research project in the Indian Ocean shows that coral-crunching fish are good not just for the coral reef habitat--they're actually crucial for maintaining dry land there.",
"headData": {
"twImgId": "",
"twTitle": "",
"ogTitle": "",
"ogImgId": "",
"twDescription": "",
"description": "A research project in the Indian Ocean shows that coral-crunching fish are good not just for the coral reef habitat--they're actually crucial for maintaining dry land there.",
"title": "Fish Help Build Coral-Reef Islands | KQED",
"ogDescription": "",
"schema": {
"@context": "https://schema.org",
"@type": "Article",
"headline": "Fish Help Build Coral-Reef Islands",
"datePublished": "2015-05-01T14:08:07-07:00",
"dateModified": "2024-01-10T16:11:01-08:00",
"image": "https://cdn.kqed.org/wp-content/uploads/2020/02/KQED-OG-Image@1x.png"
}
},
"guestAuthors": [],
"slug": "fish-help-build-coral-reef-islands",
"status": "publish",
"sticky": false,
"path": "/science/29852/fish-help-build-coral-reef-islands",
"audioTrackLength": null,
"parsedContent": [
{
"type": "contentString",
"content": "\u003cdiv class=\"post-body\">\u003cp>\u003cfigure id=\"attachment_29853\" class=\"wp-caption aligncenter\" style=\"max-width: 800px\">\u003ca href=\"http://ww2.kqed.org/science/wp-content/uploads/sites/35/2015/04/Daisy-parrotfish-wikimedia.jpg\">\u003cimg loading=\"lazy\" decoding=\"async\" src=\"http://ww2.kqed.org/science/wp-content/uploads/sites/35/2015/04/Daisy-parrotfish-wikimedia.jpg\" alt=\"Daisy Parrotfish in the Maldives\" width=\"800\" height=\"450\" class=\"size-full wp-image-29853\">\u003c/a>\u003cfigcaption class=\"wp-caption-text\">Species like the daisy parrotfish, \u003ci>Chlorurus sordidus\u003c/i>, are a crucial link in the natural chain that builds dry land in the Maldives archipelago. The job they do is to grind big corals into sand with their toothy beaks. (Julien Bidet/Wikimedia) \u003ccite>(Julien Bidet/Wikimedia)\u003c/cite>\u003c/figcaption>\u003c/figure>\n\u003cp>Coral-reef islands, those sandy staples of tropical travel brochures, are also a geological puzzle of long standing. How can they remain above the sea in the face of tropical storms or rising sea level? A new study in the Indian Ocean singles out coral-crunching fish as a key player.\u003c/p>\n\u003cp>The Maldives are a group of more than a thousand cays, or low-lying sandy islands, within a large coral reef in the tropical Indian Ocean. These islands stabilize as storm waves throw sand up onto the beach, where the wind can move it around and pile it up into dunes. From there it’s just a matter of vegetation setting root to hold the sand in place as dry land.\u003c/p>\n\u003cp>The question that follows, then, is how does a reef make sand? The answer varies. The geologist knows that ordinary beach sand is made as erosion breaks rocks into tiny bits. But reef sand or \u003ca href=\"http://www.sandatlas.org/coral-sand/\">coral sand\u003c/a>, instead, is almost entirely made of bits of seashells and other carbonate-mineral stuff. This is material that living things have chemically extracted from the dissolved minerals in seawater.\u003c/p>\n\u003cp>Reefs, then, owe their sand to various living organisms. In some reefs, one-celled organisms (benthic foraminifera) secrete tiny mineral shells around themselves that become ready-made sand. Other reefs have their sand supplied by algae of various kinds, either green \u003ca href=\"http://www.reefkeeping.com/issues/2004-04/nftt/index.php\">calcareous algae of the \u003ci>Halimeda\u003c/i> group\u003c/a> or red \u003ca href=\"http://ww2.kqed.org/science/2013/11/21/arctic-algae-offer-new-insights-on-prehistoric-climate-data/\">coralline algae\u003c/a>. The reefs of the Maldives are forests of big, stony corals, but these don’t make much sand, even when large waves break them up. \u003c/p>\n\u003cp>\u003ca href=\"https://geography.exeter.ac.uk/staff/index.php?web_id=Chris_Perry\">Chris Perry\u003c/a>, of the University of Exeter, is a leading researcher in this field. For his new study, \u003ca href=\"http://geology.gsapubs.org/content/early/2015/04/27/G36623.1.abstract\">just published in the journal \u003ci>Geology\u003c/i>\u003c/a>, he and a team of researchers visited a little reef island in the Maldives named Vakkaru.\u003c/p>\n\u003cfigure id=\"attachment_29854\" class=\"wp-caption aligncenter\" style=\"max-width: 600px\">\u003ca href=\"http://ww2.kqed.org/science/wp-content/uploads/sites/35/2015/04/vakkaru.jpg\">\u003cimg loading=\"lazy\" decoding=\"async\" src=\"http://ww2.kqed.org/science/wp-content/uploads/sites/35/2015/04/vakkaru.jpg\" alt=\"Vakkaru island, Maldives\" width=\"600\" height=\"339\" class=\"size-full wp-image-29854\">\u003c/a>\u003cfigcaption class=\"wp-caption-text\">Vakkaru is about 1500 feet long. Find it at 5.492°N, 72.938°E, where Google Earth calls it Filaidhoo Island. (Google Earth)\u003c/figcaption>\u003c/figure>\n\u003cp>Perry’s research team mapped the ecosystem and the sediments around Vakkaru, taking care to sample each zone of the reef, from the outer flat to the pristine white beach.\u003c/p>\n\u003cp>\u003c/p>\u003c/div>",
"attributes": {
"named": {},
"numeric": []
}
},
{
"type": "component",
"content": "",
"name": "ad",
"attributes": {
"named": {
"label": "fullwidth"
},
"numeric": [
"fullwidth"
]
}
},
{
"type": "contentString",
"content": "\u003cdiv class=\"post-body\">\u003cp>\u003c/p>\n\u003cp>They found that almost all of the sand around Vakkaru is created by parrotfish. These are a group of fish species with teeth on their lips; they make their living by chomping on corals, swallowing everything, digesting everything digestable and excreting the grit. The mixture of sizes of sand grains at Vakkaru is a close match for parrotfish poop, along with a dash of \u003ci>Halimeda\u003c/i> gravel.\u003c/p>\n\u003cp>Based on that finding, Perry drew up a neat and simple “geoecological” model for how Vakkaru and its fellow islands in the Maldives are maintained.\u003c/p>\n\u003cfigure id=\"attachment_29856\" class=\"wp-caption aligncenter\" style=\"max-width: 600px\">\u003ca href=\"http://ww2.kqed.org/science/wp-content/uploads/sites/35/2015/04/vakkaru-model.png\">\u003cimg loading=\"lazy\" decoding=\"async\" src=\"http://ww2.kqed.org/science/wp-content/uploads/sites/35/2015/04/vakkaru-model.png\" alt=\"Geoecological model of Vakkaru\" width=\"600\" height=\"425\" class=\"size-full wp-image-29856\">\u003c/a>\u003cfigcaption class=\"wp-caption-text\">(Perry/Geological Society of America)\u003c/figcaption>\u003c/figure>\n\u003cp>Perry’s model identifies five zones where fish and tidal activity contribute to the reef sand of Vakkaru. In the outermost zone, coral trees grow and are nibbled into sand by parrotfish. Waves then carry the sand toward the shore, where, eventually, the fine- and medium-grained bits get tossed up onto the beach. \u003c/p>\n\u003cp>\u003c/p>\n\u003cp>As the world’s lowest-elevation country, the Maldives faces the greatest threat from rising sea level. Clearly, as Perry concluded, parrotfish are a “key biogeoengineering species.” They do a lot more than look pretty for snorkelers. The continued good health of coral-crunching parrotfish will need to be safeguarded by the other key biogeoengineering species in the Maldives—human beings.\u003c/p>\n\n\u003c/div>\u003c/p>",
"attributes": {
"named": {},
"numeric": []
}
}
],
"link": "/science/29852/fish-help-build-coral-reef-islands",
"authors": [
"6228"
],
"categories": [
"science_30",
"science_35",
"science_38"
],
"featImg": "science_29853",
"label": "science"
},
"science_29537": {
"type": "posts",
"id": "science_29537",
"meta": {
"index": "posts_1716263798",
"site": "science",
"id": "29537",
"score": null,
"sort": [
1429802392000
]
},
"parent": 0,
"labelTerm": {
"site": "science"
},
"blocks": [],
"publishDate": 1429802392,
"format": "aside",
"title": "Stegosaurus, Male or Female? The Answer Is in the Plates",
"headTitle": "Stegosaurus, Male or Female? The Answer Is in the Plates | KQED",
"content": "\u003cfigure id=\"attachment_29557\" class=\"wp-caption aligncenter\" style=\"max-width: 800px\">\u003ca href=\"http://ww2.kqed.org/science/wp-content/uploads/sites/35/2015/04/steg-profiles.png\">\u003cimg loading=\"lazy\" decoding=\"async\" src=\"http://ww2.kqed.org/science/wp-content/uploads/sites/35/2015/04/steg-profiles.png\" alt=\"Male and female Stegosaurus\" width=\"800\" height=\"450\" class=\"size-full wp-image-29557\">\u003c/a>\u003cfigcaption class=\"wp-caption-text\">A stylized picture of how the spinal plates differed in male and female \u003cem>Stegosaurus mjosi\u003c/em>. A new paper argues that sexual dimorphism is the most likely explanation for these two distinct types within the same species. (Saitta/PLOS One)\u003c/figcaption>\u003c/figure>\n\u003cp>We all know and love \u003ci>Stegosaurus\u003c/i>, the big dinosaurs with the spiked tails and the wonderful double-row of big bony plates on their spines. But when a child asks “Which is a boy and which is a girl?” the experts have no answer. For a long time they’ve said that dinosaurs probably didn’t differ by sex. But a young paleontologist has found that those plates are the key to \u003ci>Stegosaurus\u003c/i> sex.\u003c/p>\n\u003cp>Dinosaurs have been an enduring puzzle \u003ca href=\"http://en.wikipedia.org/wiki/Dinosaur#History_of_study\">since scientists described the first one\u003c/a> nearly 200 years ago. Since the 1970s, dinosaur science has been in a vigorous ferment. We’re learning that dinosaurs were not the slow, stupid reptilian animals we used to picture. Now we’re told that dinosaurs were nimble, colorful, plumage-bearing, possibly warm-blooded creatures that are reminiscent of birds, their living descendents. \u003c/p>\n\u003cp>Living creatures very commonly differ between male and female, a property called sexual dimorphism. But it hasn’t been easy to tell whether dinosaurs were the same way. \u003ca href=\"http://journals.plos.org/plosone/article?id=10.1371/journal.pone.0123503\">In a study just published\u003c/a> in the open-access journal \u003ca href=\"http://www.plosone.org/\">PLOS One\u003c/a>, Evan Saitta used a computerized shape-testing technique to distinguish two types of \u003cem>Stegosaurus\u003c/em> and argued that they represent the two sexes.\u003c/p>\n\u003cp>Saitta took advantage of an unusual opportunity, the discovery of a \u003cem>Stegosaurus\u003c/em> “graveyard” in central Montana. Having numerous examples of the same species, \u003ci>Stegosaurus mjosi\u003c/i>, allowed him to apply geometric morphometrics, a computer-based method of comparing shapes, to the bony plates along the spine that make these dinosaurs so recognizable.\u003c/p>\n\u003cp>Geometric morphometrics is a more objective way to compare shapes than having experts eyeball them and then argue about them. Here’s an example from the La Brea tar pits, where hundreds of prehistoric jawbones have been collected from three very similar canine species: coyotes, gray wolves, and the extinct dire wolf, \u003ci>Canis dirus\u003c/i>. UC Berkeley researcher Eric Holt took a standard set of measurements from each fossil, as shown below, and put them all in a database.\u003c/p>\n\u003cfigure id=\"attachment_29558\" class=\"wp-caption aligncenter\" style=\"max-width: 600px\">\u003ca href=\"http://ww2.kqed.org/science/wp-content/uploads/sites/35/2015/04/C-dirus-template.jpg\">\u003cimg loading=\"lazy\" decoding=\"async\" src=\"http://ww2.kqed.org/science/wp-content/uploads/sites/35/2015/04/C-dirus-template.jpg\" alt=\"Dire wolf jawbone\" width=\"600\" height=\"303\" class=\"size-full wp-image-29558\">\u003c/a>\u003cfigcaption class=\"wp-caption-text\">Dire wolf jaw and standard geometric measurements. (Holt/UCMP)\u003c/figcaption>\u003c/figure>\n\u003cp>He then had a computer perform a \u003ca href=\"http://setosa.io/ev/principal-component-analysis/\">principal component analysis\u003c/a> (PCA), which figures out the most efficient way to sort out a mess of complicated data. The technique generalizes something we do intuitively when, for instance, we sort out a bushel of mixed oranges, tangerines and mandarins even though each type of fruit may vary a lot in appearance. The PCA operation shows that the three dog species are easily separated by just two sets of numerical relationships—principal components—labeled 1 and 2.\u003c/p>\n\u003cfigure id=\"attachment_29559\" class=\"wp-caption aligncenter\" style=\"max-width: 600px\">\u003ca href=\"http://ww2.kqed.org/science/wp-content/uploads/sites/35/2015/04/3-dog-PCA.png\">\u003cimg loading=\"lazy\" decoding=\"async\" src=\"http://ww2.kqed.org/science/wp-content/uploads/sites/35/2015/04/3-dog-PCA.png\" alt=\"Jaws of three canids\" width=\"600\" height=\"409\" class=\"size-full wp-image-29559\">\u003c/a>\u003cfigcaption class=\"wp-caption-text\">The results of PCA distinguish the jawbones of gray wolf (\u003ci>Canis lupus\u003c/i>), coyote (\u003ci>Canis latrans\u003c/i>) and dire wolf (\u003ci>Canis dirus\u003c/i>) on the basis of just two numerical factors. (Holt/UCMP)\u003c/figcaption>\u003c/figure>\n\u003cp>When Saitta went through this exercise with 40 \u003ci>Stegosaurus\u003c/i> plates, their shapes neatly fell into a Mutt-and-Jeff pattern of two groups. One is wide and rounded, the other is narrow and tall.\u003c/p>\n\u003cfigure id=\"attachment_29560\" class=\"wp-caption aligncenter\" style=\"max-width: 600px\">\u003ca href=\"http://ww2.kqed.org/science/wp-content/uploads/sites/35/2015/04/steg-boy-girl-plates.jpg\">\u003cimg loading=\"lazy\" decoding=\"async\" src=\"http://ww2.kqed.org/science/wp-content/uploads/sites/35/2015/04/steg-boy-girl-plates.jpg\" alt=\"Male and female stegosaur plates\" width=\"600\" height=\"305\" class=\"size-full wp-image-29560\">\u003c/a>\u003cfigcaption class=\"wp-caption-text\">The largest examples of the rounded (“wide morph”) and pointed (“tall morph”) \u003ci>Stegosaur\u003c/i> plate types. (Saitta/PLOS One)\u003c/figcaption>\u003c/figure>\n\u003cp>The next question is whether this difference is sex-related or due to something else: (1) maybe individuals varied a lot; (2) maybe both types occurred on the same animal; (3) maybe they represent different species; and (4) maybe one is a juvenile form of the other. \u003c/p>\n\u003cp>[ad fullwidth]\u003c/p>\n\u003cp>\u003ca href=\"http://journals.plos.org/plosone/article?id=10.1371/journal.pone.0123503\">In the PLOS One paper\u003c/a>, Saitta considers and eliminates these alternatives using evidence from inside the bones, from other bones and from the quarry where the fossils were found. He concludes, “With all alternate hypotheses apparently ruled out, sexual dimorphism is the most likely explanation for the observed variation in the plates.”\u003c/p>\n\u003cp>Which is the boy \u003ci>Stegosaurus\u003c/i> and which is the girl? Without the evidence of dinosaur eggs or the marrow of leg bones, we can’t yet tell. Saitta speculates that if the large, herbivorous \u003ci>Stegosaurus\u003c/i> was like modern bovid species like cows and bison, the males would have the wide plates for display purposes, and the females would have the tall ones for defensive purposes. But unlike these modern bovids, in which the males compete with each other to choose females, Saitta argues that it was the females who selected mates, otherwise the males would have evolved bigger spikes on their tails.\u003c/p>\n\u003cp>\u003c/p>\n\u003cp>Remarkably, Saitta did this study \u003ca href=\"http://www.princeton.edu/main/news/archive/S39/82/82K53/index.xml\">as an undergraduate at Princeton University\u003c/a>. Today he’s earning a master’s in paleobiology at the University of Bristol, and I look forward to more from this promising young scientist as he brings these ancient creatures closer to life.\u003c/p>\n\n",
"stats": {
"hasVideo": false,
"hasChartOrMap": false,
"hasAudio": false,
"hasPolis": false,
"wordCount": 814,
"hasGoogleForm": false,
"hasGallery": false,
"hasHearkenModule": false,
"iframeSrcs": [],
"paragraphCount": 13
},
"modified": 1704931935,
"excerpt": "A young paleontologist has figured out how to tell male and female stegosaurs apart from the rows of plates upon their backs.",
"headData": {
"twImgId": "",
"twTitle": "",
"ogTitle": "",
"ogImgId": "",
"twDescription": "",
"description": "A young paleontologist has figured out how to tell male and female stegosaurs apart from the rows of plates upon their backs.",
"title": "Stegosaurus, Male or Female? The Answer Is in the Plates | KQED",
"ogDescription": "",
"schema": {
"@context": "https://schema.org",
"@type": "Article",
"headline": "Stegosaurus, Male or Female? The Answer Is in the Plates",
"datePublished": "2015-04-23T08:19:52-07:00",
"dateModified": "2024-01-10T16:12:15-08:00",
"image": "https://cdn.kqed.org/wp-content/uploads/2020/02/KQED-OG-Image@1x.png"
}
},
"guestAuthors": [],
"slug": "stegosaurus-male-or-female-the-answer-is-in-the-plates",
"status": "publish",
"sticky": false,
"path": "/science/29537/stegosaurus-male-or-female-the-answer-is-in-the-plates",
"audioTrackLength": null,
"parsedContent": [
{
"type": "contentString",
"content": "\u003cdiv class=\"post-body\">\u003cp>\u003cfigure id=\"attachment_29557\" class=\"wp-caption aligncenter\" style=\"max-width: 800px\">\u003ca href=\"http://ww2.kqed.org/science/wp-content/uploads/sites/35/2015/04/steg-profiles.png\">\u003cimg loading=\"lazy\" decoding=\"async\" src=\"http://ww2.kqed.org/science/wp-content/uploads/sites/35/2015/04/steg-profiles.png\" alt=\"Male and female Stegosaurus\" width=\"800\" height=\"450\" class=\"size-full wp-image-29557\">\u003c/a>\u003cfigcaption class=\"wp-caption-text\">A stylized picture of how the spinal plates differed in male and female \u003cem>Stegosaurus mjosi\u003c/em>. A new paper argues that sexual dimorphism is the most likely explanation for these two distinct types within the same species. (Saitta/PLOS One)\u003c/figcaption>\u003c/figure>\n\u003cp>We all know and love \u003ci>Stegosaurus\u003c/i>, the big dinosaurs with the spiked tails and the wonderful double-row of big bony plates on their spines. But when a child asks “Which is a boy and which is a girl?” the experts have no answer. For a long time they’ve said that dinosaurs probably didn’t differ by sex. But a young paleontologist has found that those plates are the key to \u003ci>Stegosaurus\u003c/i> sex.\u003c/p>\n\u003cp>Dinosaurs have been an enduring puzzle \u003ca href=\"http://en.wikipedia.org/wiki/Dinosaur#History_of_study\">since scientists described the first one\u003c/a> nearly 200 years ago. Since the 1970s, dinosaur science has been in a vigorous ferment. We’re learning that dinosaurs were not the slow, stupid reptilian animals we used to picture. Now we’re told that dinosaurs were nimble, colorful, plumage-bearing, possibly warm-blooded creatures that are reminiscent of birds, their living descendents. \u003c/p>\n\u003cp>Living creatures very commonly differ between male and female, a property called sexual dimorphism. But it hasn’t been easy to tell whether dinosaurs were the same way. \u003ca href=\"http://journals.plos.org/plosone/article?id=10.1371/journal.pone.0123503\">In a study just published\u003c/a> in the open-access journal \u003ca href=\"http://www.plosone.org/\">PLOS One\u003c/a>, Evan Saitta used a computerized shape-testing technique to distinguish two types of \u003cem>Stegosaurus\u003c/em> and argued that they represent the two sexes.\u003c/p>\n\u003cp>Saitta took advantage of an unusual opportunity, the discovery of a \u003cem>Stegosaurus\u003c/em> “graveyard” in central Montana. Having numerous examples of the same species, \u003ci>Stegosaurus mjosi\u003c/i>, allowed him to apply geometric morphometrics, a computer-based method of comparing shapes, to the bony plates along the spine that make these dinosaurs so recognizable.\u003c/p>\n\u003cp>Geometric morphometrics is a more objective way to compare shapes than having experts eyeball them and then argue about them. Here’s an example from the La Brea tar pits, where hundreds of prehistoric jawbones have been collected from three very similar canine species: coyotes, gray wolves, and the extinct dire wolf, \u003ci>Canis dirus\u003c/i>. UC Berkeley researcher Eric Holt took a standard set of measurements from each fossil, as shown below, and put them all in a database.\u003c/p>\n\u003cfigure id=\"attachment_29558\" class=\"wp-caption aligncenter\" style=\"max-width: 600px\">\u003ca href=\"http://ww2.kqed.org/science/wp-content/uploads/sites/35/2015/04/C-dirus-template.jpg\">\u003cimg loading=\"lazy\" decoding=\"async\" src=\"http://ww2.kqed.org/science/wp-content/uploads/sites/35/2015/04/C-dirus-template.jpg\" alt=\"Dire wolf jawbone\" width=\"600\" height=\"303\" class=\"size-full wp-image-29558\">\u003c/a>\u003cfigcaption class=\"wp-caption-text\">Dire wolf jaw and standard geometric measurements. (Holt/UCMP)\u003c/figcaption>\u003c/figure>\n\u003cp>He then had a computer perform a \u003ca href=\"http://setosa.io/ev/principal-component-analysis/\">principal component analysis\u003c/a> (PCA), which figures out the most efficient way to sort out a mess of complicated data. The technique generalizes something we do intuitively when, for instance, we sort out a bushel of mixed oranges, tangerines and mandarins even though each type of fruit may vary a lot in appearance. The PCA operation shows that the three dog species are easily separated by just two sets of numerical relationships—principal components—labeled 1 and 2.\u003c/p>\n\u003cfigure id=\"attachment_29559\" class=\"wp-caption aligncenter\" style=\"max-width: 600px\">\u003ca href=\"http://ww2.kqed.org/science/wp-content/uploads/sites/35/2015/04/3-dog-PCA.png\">\u003cimg loading=\"lazy\" decoding=\"async\" src=\"http://ww2.kqed.org/science/wp-content/uploads/sites/35/2015/04/3-dog-PCA.png\" alt=\"Jaws of three canids\" width=\"600\" height=\"409\" class=\"size-full wp-image-29559\">\u003c/a>\u003cfigcaption class=\"wp-caption-text\">The results of PCA distinguish the jawbones of gray wolf (\u003ci>Canis lupus\u003c/i>), coyote (\u003ci>Canis latrans\u003c/i>) and dire wolf (\u003ci>Canis dirus\u003c/i>) on the basis of just two numerical factors. (Holt/UCMP)\u003c/figcaption>\u003c/figure>\n\u003cp>When Saitta went through this exercise with 40 \u003ci>Stegosaurus\u003c/i> plates, their shapes neatly fell into a Mutt-and-Jeff pattern of two groups. One is wide and rounded, the other is narrow and tall.\u003c/p>\n\u003cfigure id=\"attachment_29560\" class=\"wp-caption aligncenter\" style=\"max-width: 600px\">\u003ca href=\"http://ww2.kqed.org/science/wp-content/uploads/sites/35/2015/04/steg-boy-girl-plates.jpg\">\u003cimg loading=\"lazy\" decoding=\"async\" src=\"http://ww2.kqed.org/science/wp-content/uploads/sites/35/2015/04/steg-boy-girl-plates.jpg\" alt=\"Male and female stegosaur plates\" width=\"600\" height=\"305\" class=\"size-full wp-image-29560\">\u003c/a>\u003cfigcaption class=\"wp-caption-text\">The largest examples of the rounded (“wide morph”) and pointed (“tall morph”) \u003ci>Stegosaur\u003c/i> plate types. (Saitta/PLOS One)\u003c/figcaption>\u003c/figure>\n\u003cp>The next question is whether this difference is sex-related or due to something else: (1) maybe individuals varied a lot; (2) maybe both types occurred on the same animal; (3) maybe they represent different species; and (4) maybe one is a juvenile form of the other. \u003c/p>\n\u003cp>\u003c/p>\u003c/div>",
"attributes": {
"named": {},
"numeric": []
}
},
{
"type": "component",
"content": "",
"name": "ad",
"attributes": {
"named": {
"label": "fullwidth"
},
"numeric": [
"fullwidth"
]
}
},
{
"type": "contentString",
"content": "\u003cdiv class=\"post-body\">\u003cp>\u003c/p>\n\u003cp>\u003ca href=\"http://journals.plos.org/plosone/article?id=10.1371/journal.pone.0123503\">In the PLOS One paper\u003c/a>, Saitta considers and eliminates these alternatives using evidence from inside the bones, from other bones and from the quarry where the fossils were found. He concludes, “With all alternate hypotheses apparently ruled out, sexual dimorphism is the most likely explanation for the observed variation in the plates.”\u003c/p>\n\u003cp>Which is the boy \u003ci>Stegosaurus\u003c/i> and which is the girl? Without the evidence of dinosaur eggs or the marrow of leg bones, we can’t yet tell. Saitta speculates that if the large, herbivorous \u003ci>Stegosaurus\u003c/i> was like modern bovid species like cows and bison, the males would have the wide plates for display purposes, and the females would have the tall ones for defensive purposes. But unlike these modern bovids, in which the males compete with each other to choose females, Saitta argues that it was the females who selected mates, otherwise the males would have evolved bigger spikes on their tails.\u003c/p>\n\u003cp>\u003c/p>\n\u003cp>Remarkably, Saitta did this study \u003ca href=\"http://www.princeton.edu/main/news/archive/S39/82/82K53/index.xml\">as an undergraduate at Princeton University\u003c/a>. Today he’s earning a master’s in paleobiology at the University of Bristol, and I look forward to more from this promising young scientist as he brings these ancient creatures closer to life.\u003c/p>\n\n\u003c/div>\u003c/p>",
"attributes": {
"named": {},
"numeric": []
}
}
],
"link": "/science/29537/stegosaurus-male-or-female-the-answer-is-in-the-plates",
"authors": [
"6228"
],
"categories": [
"science_38"
],
"tags": [
"science_2145",
"science_116",
"science_349"
],
"featImg": "science_29557",
"label": "science"
},
"science_29262": {
"type": "posts",
"id": "science_29262",
"meta": {
"index": "posts_1716263798",
"site": "science",
"id": "29262",
"score": null,
"sort": [
1429216617000
]
},
"parent": 0,
"labelTerm": {
"site": "science"
},
"blocks": [],
"publishDate": 1429216617,
"format": "aside",
"title": "Fossil Study Detects Another Mass Extinction in the Deep Past",
"headTitle": "Fossil Study Detects Another Mass Extinction in the Deep Past | KQED",
"content": "\u003cfigure id=\"attachment_29263\" class=\"wp-caption aligncenter\" style=\"max-width: 800px\">\u003ca href=\"http://ww2.kqed.org/science/wp-content/uploads/sites/35/2015/04/spitsbergen-permian.jpg\">\u003cimg loading=\"lazy\" decoding=\"async\" src=\"http://ww2.kqed.org/science/wp-content/uploads/sites/35/2015/04/spitsbergen-permian.jpg\" alt=\"Capitanian rocks in Spitsbergen\" width=\"800\" height=\"450\" class=\"size-full wp-image-29263\">\u003c/a>\u003cfigcaption class=\"wp-caption-text\">Fossils in these three orange beds of ancient limestone in the Arctic islands of Spitsbergen record a great extinction event about 262 million years ago, during the late Permian Period. (Dierk Blomeier/Geological Society of America)\u003c/figcaption>\u003c/figure>\n\u003cp>Fossil specialists tell us that waves of extinction, hundreds of them, interrupted the story of life on Earth during the last billion years. Only five of these are what paleontologists have considered mass extinctions—extreme episodes that covered the whole world and killed off at least half of all known animal species. \u003c/p>\n\u003cp>A new study of rocks in the frozen land of Spitsbergen, a Norwegian island in the Arctic Ocean, points to a sixth mass extinction. It happened about 262 million years ago during the \u003ca href=\"http://palaeos.com/paleozoic/permian/capitanian.html\">Capitanian Age\u003c/a> of the Permian Period.\u003c/p>\n\u003cp>The Earth looked very different in those days. Most of the dry land was in the \u003ca href=\"http://www.scotese.com/newpage5.htm\">supercontinent Pangea\u003c/a>. \u003c/p>\n\u003cp>Geologists already knew there had been an extinction event during the Capitanian Age, but didn’t know how widespread it had been. Researchers first documented it about 20 years ago, in rocks of southern China that formed in a tropical ocean. There, it was clearly an awful catastrophe. For instance, it killed seven-eighths of all species of \u003ca href=\"http://www.ucmp.berkeley.edu/brachiopoda/brachiopoda.html\">brachiopod\u003c/a>, a family of shellfish that once dominated the seafloor. But was it a truly global, mass extinction, or a regional one, restricted to the tropics?\u003c/p>\n\u003cp>A team of researchers, led by David Bond of the University of Hull, took up this question by looking for extinction evidence elsewhere. They knew limestone of Capitanian age exists in Spitsbergen, a glacier-swept set of Arctic islands administered by Norway. During Capitanian time, this area was a cold-water coastal sea around the latitude of Maine, part of the Boreal Ocean. \u003c/p>\n\u003cp>[ad fullwidth]\u003c/p>\n\u003cp>Bond’s group combed the Spitsbergen limestones for fossils of brachiopods and bivalves (the shellfish family that includes clams and oysters), while also taking hundreds of rock samples for lab tests. They \u003ca href=\"http://gsabulletin.gsapubs.org/content/early/2015/04/15/B31216.1.full.pdf+html\">published their results\u003c/a> in the \u003ca href=\"http://gsabulletin.gsapubs.org/\">Geological Society of America Bulletin\u003c/a> this week. \u003c/p>\n\u003cp>The researchers were lucky that the extinction coincided with a widespread set of three distinctive beds of orange limestone. Recognizing this triplet in several different spots helped them compile a high-quality record showing a major, geologically sudden extinction in the fossils. At one point they counted 32 different brachiopod species. Just 30 centimeters higher in the rock outcrops, they found only four.\u003c/p>\n\u003cp>It took more work to correlate this evidence with the Chinese record, because the Spitsbergen limestones have none of the volcanic minerals that were used in China to determine an exact age. Nor do they have any of the \u003ca href=\"http://www.nhm.ac.uk/research-curation/earth-sciences/micropalaeontology/microfossils/conodonts/\">conodont fossils\u003c/a> that were used to assign a fossil age to the Chinese rocks.\u003c/p>\n\u003cp>However, the lab tests on the rock samples established an intricate “fingerprint” of environmental changes during Capitanian time in Spitsbergen based on: carbon isotopes (indicating atmospheric conditions), strontium isotopes (a sign of continental influence on seawater), magnetic tests (recording reversals of the Earth’s magnetic field) and trace metals and pyrite crystals (representing ocean chemistry). \u003c/p>\n\u003cp>Much of this evidence did match the record from China. And Bond’s group found similar patterns in rocks from Greenland and Arctic Canada, some of which contained conodonts matching those in tropical China. The connection isn’t straightforward, but it’s strong enough to earn publication.\u003c/p>\n\u003cp>Combining their new results with earlier data about the Capitanian extinction, Bond’s group argues that the cause may have been ocean acidification, resulting from massive volcanic eruptions near China. They conclude that “the Capitanian crisis did not, as previously thought, simply affect tropical marine biota: It was a truly global mass extinction.”\u003c/p>\n\u003cp>\u003ca href=\"http://www.nature.com/nature/journal/v471/n7336/fig_tab/nature09678_T1.html\">The “Big 5” mass extinction events\u003c/a> are the end-Ordovician, late Devonian (Frasnian-Famennian), end-Permian, end-Triassic and end-Cretaceous (or “K-T”). They are so profound that even before we recognized their scope, they defined the ends of their respective geologic time periods. \u003c/p>\n\u003cp>\u003c/p>\n\u003cp>Many people argue that today, human influences are causing a Sixth Mass Extinction. But if there’ve been six already, we need to change that number—or stop the total so it never goes beyond six.\u003c/p>\n\n",
"stats": {
"hasVideo": false,
"hasChartOrMap": false,
"hasAudio": false,
"hasPolis": false,
"wordCount": 708,
"hasGoogleForm": false,
"hasGallery": false,
"hasHearkenModule": false,
"iframeSrcs": [],
"paragraphCount": 15
},
"modified": 1704931981,
"excerpt": "A new study of fossils on an island in the Arctic Ocean show a major episode of extinction that qualifies as a new \"great dying.\"",
"headData": {
"twImgId": "",
"twTitle": "",
"ogTitle": "",
"ogImgId": "",
"twDescription": "",
"description": "A new study of fossils on an island in the Arctic Ocean show a major episode of extinction that qualifies as a new "great dying."",
"title": "Fossil Study Detects Another Mass Extinction in the Deep Past | KQED",
"ogDescription": "",
"schema": {
"@context": "https://schema.org",
"@type": "Article",
"headline": "Fossil Study Detects Another Mass Extinction in the Deep Past",
"datePublished": "2015-04-16T13:36:57-07:00",
"dateModified": "2024-01-10T16:13:01-08:00",
"image": "https://cdn.kqed.org/wp-content/uploads/2020/02/KQED-OG-Image@1x.png"
}
},
"guestAuthors": [],
"slug": "fossil-study-detects-another-mass-extinction-in-the-deep-past",
"status": "publish",
"sticky": false,
"path": "/science/29262/fossil-study-detects-another-mass-extinction-in-the-deep-past",
"audioTrackLength": null,
"parsedContent": [
{
"type": "contentString",
"content": "\u003cdiv class=\"post-body\">\u003cp>\u003cfigure id=\"attachment_29263\" class=\"wp-caption aligncenter\" style=\"max-width: 800px\">\u003ca href=\"http://ww2.kqed.org/science/wp-content/uploads/sites/35/2015/04/spitsbergen-permian.jpg\">\u003cimg loading=\"lazy\" decoding=\"async\" src=\"http://ww2.kqed.org/science/wp-content/uploads/sites/35/2015/04/spitsbergen-permian.jpg\" alt=\"Capitanian rocks in Spitsbergen\" width=\"800\" height=\"450\" class=\"size-full wp-image-29263\">\u003c/a>\u003cfigcaption class=\"wp-caption-text\">Fossils in these three orange beds of ancient limestone in the Arctic islands of Spitsbergen record a great extinction event about 262 million years ago, during the late Permian Period. (Dierk Blomeier/Geological Society of America)\u003c/figcaption>\u003c/figure>\n\u003cp>Fossil specialists tell us that waves of extinction, hundreds of them, interrupted the story of life on Earth during the last billion years. Only five of these are what paleontologists have considered mass extinctions—extreme episodes that covered the whole world and killed off at least half of all known animal species. \u003c/p>\n\u003cp>A new study of rocks in the frozen land of Spitsbergen, a Norwegian island in the Arctic Ocean, points to a sixth mass extinction. It happened about 262 million years ago during the \u003ca href=\"http://palaeos.com/paleozoic/permian/capitanian.html\">Capitanian Age\u003c/a> of the Permian Period.\u003c/p>\n\u003cp>The Earth looked very different in those days. Most of the dry land was in the \u003ca href=\"http://www.scotese.com/newpage5.htm\">supercontinent Pangea\u003c/a>. \u003c/p>\n\u003cp>Geologists already knew there had been an extinction event during the Capitanian Age, but didn’t know how widespread it had been. Researchers first documented it about 20 years ago, in rocks of southern China that formed in a tropical ocean. There, it was clearly an awful catastrophe. For instance, it killed seven-eighths of all species of \u003ca href=\"http://www.ucmp.berkeley.edu/brachiopoda/brachiopoda.html\">brachiopod\u003c/a>, a family of shellfish that once dominated the seafloor. But was it a truly global, mass extinction, or a regional one, restricted to the tropics?\u003c/p>\n\u003cp>A team of researchers, led by David Bond of the University of Hull, took up this question by looking for extinction evidence elsewhere. They knew limestone of Capitanian age exists in Spitsbergen, a glacier-swept set of Arctic islands administered by Norway. During Capitanian time, this area was a cold-water coastal sea around the latitude of Maine, part of the Boreal Ocean. \u003c/p>\n\u003cp>\u003c/p>\u003c/div>",
"attributes": {
"named": {},
"numeric": []
}
},
{
"type": "component",
"content": "",
"name": "ad",
"attributes": {
"named": {
"label": "fullwidth"
},
"numeric": [
"fullwidth"
]
}
},
{
"type": "contentString",
"content": "\u003cdiv class=\"post-body\">\u003cp>\u003c/p>\n\u003cp>Bond’s group combed the Spitsbergen limestones for fossils of brachiopods and bivalves (the shellfish family that includes clams and oysters), while also taking hundreds of rock samples for lab tests. They \u003ca href=\"http://gsabulletin.gsapubs.org/content/early/2015/04/15/B31216.1.full.pdf+html\">published their results\u003c/a> in the \u003ca href=\"http://gsabulletin.gsapubs.org/\">Geological Society of America Bulletin\u003c/a> this week. \u003c/p>\n\u003cp>The researchers were lucky that the extinction coincided with a widespread set of three distinctive beds of orange limestone. Recognizing this triplet in several different spots helped them compile a high-quality record showing a major, geologically sudden extinction in the fossils. At one point they counted 32 different brachiopod species. Just 30 centimeters higher in the rock outcrops, they found only four.\u003c/p>\n\u003cp>It took more work to correlate this evidence with the Chinese record, because the Spitsbergen limestones have none of the volcanic minerals that were used in China to determine an exact age. Nor do they have any of the \u003ca href=\"http://www.nhm.ac.uk/research-curation/earth-sciences/micropalaeontology/microfossils/conodonts/\">conodont fossils\u003c/a> that were used to assign a fossil age to the Chinese rocks.\u003c/p>\n\u003cp>However, the lab tests on the rock samples established an intricate “fingerprint” of environmental changes during Capitanian time in Spitsbergen based on: carbon isotopes (indicating atmospheric conditions), strontium isotopes (a sign of continental influence on seawater), magnetic tests (recording reversals of the Earth’s magnetic field) and trace metals and pyrite crystals (representing ocean chemistry). \u003c/p>\n\u003cp>Much of this evidence did match the record from China. And Bond’s group found similar patterns in rocks from Greenland and Arctic Canada, some of which contained conodonts matching those in tropical China. The connection isn’t straightforward, but it’s strong enough to earn publication.\u003c/p>\n\u003cp>Combining their new results with earlier data about the Capitanian extinction, Bond’s group argues that the cause may have been ocean acidification, resulting from massive volcanic eruptions near China. They conclude that “the Capitanian crisis did not, as previously thought, simply affect tropical marine biota: It was a truly global mass extinction.”\u003c/p>\n\u003cp>\u003ca href=\"http://www.nature.com/nature/journal/v471/n7336/fig_tab/nature09678_T1.html\">The “Big 5” mass extinction events\u003c/a> are the end-Ordovician, late Devonian (Frasnian-Famennian), end-Permian, end-Triassic and end-Cretaceous (or “K-T”). They are so profound that even before we recognized their scope, they defined the ends of their respective geologic time periods. \u003c/p>\n\u003cp>\u003c/p>\n\u003cp>Many people argue that today, human influences are causing a Sixth Mass Extinction. But if there’ve been six already, we need to change that number—or stop the total so it never goes beyond six.\u003c/p>\n\n\u003c/div>\u003c/p>",
"attributes": {
"named": {},
"numeric": []
}
}
],
"link": "/science/29262/fossil-study-detects-another-mass-extinction-in-the-deep-past",
"authors": [
"6228"
],
"categories": [
"science_38"
],
"tags": [
"science_349"
],
"featImg": "science_29263",
"label": "science"
},
"science_29080": {
"type": "posts",
"id": "science_29080",
"meta": {
"index": "posts_1716263798",
"site": "science",
"id": "29080",
"score": null,
"sort": [
1428591622000
]
},
"parent": 0,
"labelTerm": {
"site": "science"
},
"blocks": [],
"publishDate": 1428591622,
"format": "aside",
"title": "The Great 1815 Tambora Eruption: What if This Volcano Blew Today?",
"headTitle": "The Great 1815 Tambora Eruption: What if This Volcano Blew Today? | KQED",
"content": "\u003cfigure id=\"attachment_29081\" class=\"wp-caption aligncenter\" style=\"max-width: 800px\">\u003ca href=\"http://ww2.kqed.org/science/wp-content/uploads/sites/35/2015/04/tambora.jpg\">\u003cimg loading=\"lazy\" decoding=\"async\" src=\"http://ww2.kqed.org/science/wp-content/uploads/sites/35/2015/04/tambora.jpg\" alt=\"Tambora today\" width=\"800\" height=\"449\" class=\"size-full wp-image-29081\">\u003c/a>\u003cfigcaption class=\"wp-caption-text\">When Tambora blew its top, 200 years ago this week, it left a smoking caldera behind that measures 6 kilometers across. (Jialiang Gao/Wikimedia)\u003c/figcaption>\u003c/figure>\n\u003cp>Tambora was once a tall and graceful mountain, as high as Hawaii’s great volcanoes, with a shape as classic as Fujiyama’s. Then, in \u003ca href=\"http://en.wikipedia.org/wiki/1815_eruption_of_Mount_Tambora\">a series of great eruptions\u003c/a> 200 years ago this week, it lost more than one-third of its height and covered a wide swath of today’s Indonesia in choking, toxic ash. It was the most powerful eruption of the last 1000 years, as far as we can tell—our knowledge is far from complete.\u003c/p>\n\u003cp>At the time, no one in the world was called a scientist. Electricity was a laboratory curiosity. The steam engine was bleeding-edge technology. Indonesia did not have a volcano agency, and it took months before ships brought word from the colonial Dutch East Indies to the rest of the world.\u003c/p>\n\u003cp>The news that emerged was apocalyptic. The eruption’s roar was heard a thousand miles away. The sun was entirely blotted out for days within about 400 miles of the volcano. Acid rain and layers of fine ash killed the crops, causing widespread famine and disease. Tens of thousands of people were sickened by caustic ash and sulfuric gases. Great sea waves had flooded harbors and coastlines across the East Indies.\u003c/p>\n\u003cp>Fine ash particles and clouds of sulfuric acid droplets were injected nearly 30 miles up into the stratosphere and carried around the world. The summer of 1815 was marked by persistent red skies and cold days in Europe, North America and China. The weather was even worse in 1816, recorded by history as the year without a summer. Famine in Europe continued for several years more. The decade of the 1810s, as a result, is the coldest on record.\u003c/p>\n\u003cp>Volcanologists rank Tambora’s eruption as a category 7 in their \u003ca href=\"http://volcanoes.usgs.gov/images/pglossary/vei.php\">Volcanic Eruptivity Index scale\u003c/a>. It’s the only clear-cut example on the books—so far. \u003c/p>\n\u003cp>[ad fullwidth]\u003c/p>\n\u003cp>Americans might picture this eruption happening in, say, the Pacific Northwest states among the Cascades volcanoes. Imagine the Mount St. Helens eruption of 1980, multiplied by 100 times. We have a fairly good idea of what happened, because \u003ca href=\"http://volcanoes.usgs.gov/volcanoes/crater_lake/crater_lake_geo_hist_135.html\">it really did happen about 7700 years ago\u003c/a> to a volcano in southern Oregon called Mount Mazama. The remains of that peak are now the center of \u003ca href=\"http://www.nps.gov/crla/index.htm\">Crater Lake National Park\u003c/a>.\u003c/p>\n\u003cp>Another Tambora will happen one day, as surely as Earth is an active planet. Eruptions that size are estimated to occur roughly every thousand years, on average. The next one could happen to some other lovely large volcano tomorrow. What will be different the next time?\u003c/p>\n\u003cul>\n\u003cli>We’ll have a better idea of the coming eruption in advance. The eruption of Bardarbunga last year, in Iceland, was a good example. In the weeks beforehand, scientists followed the magma as it moved underground and shared their data online. One by one, major volcanoes like Fujiyama are being studied with \u003ca href=\"http://ww2.kqed.org/science/2015/02/06/scientists-tune-in-to-the-earths-ambient-hum/\">ambient seismic techniques\u003c/a>. As volcano scientists learn more about their subject, our foresight will increase.\u003c/li>\n\u003cli>We’ll have a better idea of the eruption’s effects. \u003ca href=\"https://eos.org/project-updates/fire-in-the-hole-recreating-volcanic-eruptions-with-cannon-blasts\">Ingenious experiments\u003c/a> are helping us define fast ways to predict things like ashfall and plug the information into robust weather models. With sound methods in place, for instance, airlines can safely avoid \u003ca href=\"http://en.wikipedia.org/wiki/British_Airways_Flight_9\">engine-killing ash clouds\u003c/a>.\u003c/li>\n\u003cli>Word will get out fast. Today satellites, seismic networks and \u003ca href=\"http://science.kqed.org/quest/2013/02/21/infrasound-takes-a-bow/\">infrasound observatories\u003c/a> will help us characterize the eruption within hours. Even before live video links are re-established from the scene, we’ll have a good idea of what’s happened.\u003c/li>\n\u003cli>\nThe world will help with rescue, relief and recovery. The United Nations, the Red Cross/Red Crescent, \u003ca href=\"http://www.directrelief.org/tag/volcano/\">Direct Relief\u003c/a> and many more agencies like them did not exist in 1815.\u003c/li>\n\u003c/ul>\n\u003cp>\u003c/p>\n\u003cp>What will be the same?\u003c/p>\n\u003cul>\n\u003cli>Many thousands of people will die. The local inhabitants, whoever they are, will take the brunt of the disaster. Nearly all of the world’s large volcanoes are in populated areas, and the world population has grown tenfold since 1815. No nation will ever be able to weather such an eruption with impunity. Total evacuation is impossible.\u003c/li>\n\u003cli>Effects will be felt for years and around the world. Neighboring nations will suffer as displaced people pour over their borders. (Consider how Mexico City being wiped out by Popocatépetl would affect the U.S.) Climate disturbance will combine with economic disruption to cause misery and political instability of global extent. It will hurt all of us.\u003c/li>\n\u003c/ul>\n\n",
"stats": {
"hasVideo": false,
"hasChartOrMap": false,
"hasAudio": false,
"hasPolis": false,
"wordCount": 769,
"hasGoogleForm": false,
"hasGallery": false,
"hasHearkenModule": false,
"iframeSrcs": [],
"paragraphCount": 10
},
"modified": 1704932020,
"excerpt": "Tambora brought the world a taste of apocalypse 200 years ago. Today we have better tools to monitor volcanoes like it, but the next eruption of its size will still challenge civilization.",
"headData": {
"twImgId": "",
"twTitle": "",
"ogTitle": "",
"ogImgId": "",
"twDescription": "",
"description": "Tambora brought the world a taste of apocalypse 200 years ago. Today we have better tools to monitor volcanoes like it, but the next eruption of its size will still challenge civilization.",
"title": "The Great 1815 Tambora Eruption: What if This Volcano Blew Today? | KQED",
"ogDescription": "",
"schema": {
"@context": "https://schema.org",
"@type": "Article",
"headline": "The Great 1815 Tambora Eruption: What if This Volcano Blew Today?",
"datePublished": "2015-04-09T08:00:22-07:00",
"dateModified": "2024-01-10T16:13:40-08:00",
"image": "https://cdn.kqed.org/wp-content/uploads/2020/02/KQED-OG-Image@1x.png"
}
},
"guestAuthors": [],
"slug": "the-great-1815-tambora-eruption-what-if-this-volcano-blew-today",
"status": "publish",
"sticky": false,
"path": "/science/29080/the-great-1815-tambora-eruption-what-if-this-volcano-blew-today",
"audioTrackLength": null,
"parsedContent": [
{
"type": "contentString",
"content": "\u003cdiv class=\"post-body\">\u003cp>\u003cfigure id=\"attachment_29081\" class=\"wp-caption aligncenter\" style=\"max-width: 800px\">\u003ca href=\"http://ww2.kqed.org/science/wp-content/uploads/sites/35/2015/04/tambora.jpg\">\u003cimg loading=\"lazy\" decoding=\"async\" src=\"http://ww2.kqed.org/science/wp-content/uploads/sites/35/2015/04/tambora.jpg\" alt=\"Tambora today\" width=\"800\" height=\"449\" class=\"size-full wp-image-29081\">\u003c/a>\u003cfigcaption class=\"wp-caption-text\">When Tambora blew its top, 200 years ago this week, it left a smoking caldera behind that measures 6 kilometers across. (Jialiang Gao/Wikimedia)\u003c/figcaption>\u003c/figure>\n\u003cp>Tambora was once a tall and graceful mountain, as high as Hawaii’s great volcanoes, with a shape as classic as Fujiyama’s. Then, in \u003ca href=\"http://en.wikipedia.org/wiki/1815_eruption_of_Mount_Tambora\">a series of great eruptions\u003c/a> 200 years ago this week, it lost more than one-third of its height and covered a wide swath of today’s Indonesia in choking, toxic ash. It was the most powerful eruption of the last 1000 years, as far as we can tell—our knowledge is far from complete.\u003c/p>\n\u003cp>At the time, no one in the world was called a scientist. Electricity was a laboratory curiosity. The steam engine was bleeding-edge technology. Indonesia did not have a volcano agency, and it took months before ships brought word from the colonial Dutch East Indies to the rest of the world.\u003c/p>\n\u003cp>The news that emerged was apocalyptic. The eruption’s roar was heard a thousand miles away. The sun was entirely blotted out for days within about 400 miles of the volcano. Acid rain and layers of fine ash killed the crops, causing widespread famine and disease. Tens of thousands of people were sickened by caustic ash and sulfuric gases. Great sea waves had flooded harbors and coastlines across the East Indies.\u003c/p>\n\u003cp>Fine ash particles and clouds of sulfuric acid droplets were injected nearly 30 miles up into the stratosphere and carried around the world. The summer of 1815 was marked by persistent red skies and cold days in Europe, North America and China. The weather was even worse in 1816, recorded by history as the year without a summer. Famine in Europe continued for several years more. The decade of the 1810s, as a result, is the coldest on record.\u003c/p>\n\u003cp>Volcanologists rank Tambora’s eruption as a category 7 in their \u003ca href=\"http://volcanoes.usgs.gov/images/pglossary/vei.php\">Volcanic Eruptivity Index scale\u003c/a>. It’s the only clear-cut example on the books—so far. \u003c/p>\n\u003cp>\u003c/p>\u003c/div>",
"attributes": {
"named": {},
"numeric": []
}
},
{
"type": "component",
"content": "",
"name": "ad",
"attributes": {
"named": {
"label": "fullwidth"
},
"numeric": [
"fullwidth"
]
}
},
{
"type": "contentString",
"content": "\u003cdiv class=\"post-body\">\u003cp>\u003c/p>\n\u003cp>Americans might picture this eruption happening in, say, the Pacific Northwest states among the Cascades volcanoes. Imagine the Mount St. Helens eruption of 1980, multiplied by 100 times. We have a fairly good idea of what happened, because \u003ca href=\"http://volcanoes.usgs.gov/volcanoes/crater_lake/crater_lake_geo_hist_135.html\">it really did happen about 7700 years ago\u003c/a> to a volcano in southern Oregon called Mount Mazama. The remains of that peak are now the center of \u003ca href=\"http://www.nps.gov/crla/index.htm\">Crater Lake National Park\u003c/a>.\u003c/p>\n\u003cp>Another Tambora will happen one day, as surely as Earth is an active planet. Eruptions that size are estimated to occur roughly every thousand years, on average. The next one could happen to some other lovely large volcano tomorrow. What will be different the next time?\u003c/p>\n\u003cul>\n\u003cli>We’ll have a better idea of the coming eruption in advance. The eruption of Bardarbunga last year, in Iceland, was a good example. In the weeks beforehand, scientists followed the magma as it moved underground and shared their data online. One by one, major volcanoes like Fujiyama are being studied with \u003ca href=\"http://ww2.kqed.org/science/2015/02/06/scientists-tune-in-to-the-earths-ambient-hum/\">ambient seismic techniques\u003c/a>. As volcano scientists learn more about their subject, our foresight will increase.\u003c/li>\n\u003cli>We’ll have a better idea of the eruption’s effects. \u003ca href=\"https://eos.org/project-updates/fire-in-the-hole-recreating-volcanic-eruptions-with-cannon-blasts\">Ingenious experiments\u003c/a> are helping us define fast ways to predict things like ashfall and plug the information into robust weather models. With sound methods in place, for instance, airlines can safely avoid \u003ca href=\"http://en.wikipedia.org/wiki/British_Airways_Flight_9\">engine-killing ash clouds\u003c/a>.\u003c/li>\n\u003cli>Word will get out fast. Today satellites, seismic networks and \u003ca href=\"http://science.kqed.org/quest/2013/02/21/infrasound-takes-a-bow/\">infrasound observatories\u003c/a> will help us characterize the eruption within hours. Even before live video links are re-established from the scene, we’ll have a good idea of what’s happened.\u003c/li>\n\u003cli>\nThe world will help with rescue, relief and recovery. The United Nations, the Red Cross/Red Crescent, \u003ca href=\"http://www.directrelief.org/tag/volcano/\">Direct Relief\u003c/a> and many more agencies like them did not exist in 1815.\u003c/li>\n\u003c/ul>\n\u003cp>\u003c/p>\n\u003cp>What will be the same?\u003c/p>\n\u003cul>\n\u003cli>Many thousands of people will die. The local inhabitants, whoever they are, will take the brunt of the disaster. Nearly all of the world’s large volcanoes are in populated areas, and the world population has grown tenfold since 1815. No nation will ever be able to weather such an eruption with impunity. Total evacuation is impossible.\u003c/li>\n\u003cli>Effects will be felt for years and around the world. Neighboring nations will suffer as displaced people pour over their borders. (Consider how Mexico City being wiped out by Popocatépetl would affect the U.S.) Climate disturbance will combine with economic disruption to cause misery and political instability of global extent. It will hurt all of us.\u003c/li>\n\u003c/ul>\n\n\u003c/div>\u003c/p>",
"attributes": {
"named": {},
"numeric": []
}
}
],
"link": "/science/29080/the-great-1815-tambora-eruption-what-if-this-volcano-blew-today",
"authors": [
"6228"
],
"categories": [
"science_35",
"science_38"
],
"tags": [
"science_1490",
"science_1999",
"science_944"
],
"featImg": "science_29081",
"label": "science"
},
"science_28904": {
"type": "posts",
"id": "science_28904",
"meta": {
"index": "posts_1716263798",
"site": "science",
"id": "28904",
"score": null,
"sort": [
1427997680000
]
},
"parent": 0,
"labelTerm": {
"site": "science"
},
"blocks": [],
"publishDate": 1427997680,
"format": "aside",
"title": "The Anthropocene: An Epoch Mistake?",
"headTitle": "The Anthropocene: An Epoch Mistake? | KQED",
"content": "\u003cfigure id=\"attachment_28905\" class=\"wp-caption aligncenter\" style=\"max-width: 800px\">\u003ca href=\"http://ww2.kqed.org/science/wp-content/uploads/sites/35/2015/04/anthropocene.jpg\">\u003cimg loading=\"lazy\" decoding=\"async\" src=\"http://ww2.kqed.org/science/wp-content/uploads/sites/35/2015/04/anthropocene.jpg\" alt=\"An Anthropocene outcrop\" width=\"800\" height=\"450\" class=\"size-full wp-image-28905\">\u003c/a>\u003cfigcaption class=\"wp-caption-text\">The Albany Bulb, which consists entirely of concrete “rocks” and other human artifacts, is a local emblem of the Anthropocene age—the time in geologic history when the human imprint is paramount. Should it appear as such on geologic maps? (Andrew Alden)\u003c/figcaption>\u003c/figure>\n\u003cp>Every now and then, some bit of knowledge from geology becomes widespread in the public mind: Plate tectonics, for instance, or the fact that birds are dinosaurs. The latest example is the “Anthropocene” concept. Based on the fact that many human activities are now more powerful than their natural equivalents, geologists are formally studying whether to give the name Anthropocene to the new period of geologic time we’re living in.\u003c/p>\n\u003cp>That may seem like a factoid, but it’s true. The International Commission on Stratigraphy, the scientific agency in charge of the geologic time scale, \u003ca href=\"http://quaternary.stratigraphy.org/workinggroups/anthropocene/\">has a committee evaluating this question\u003c/a>. The Working Group on the Anthropocene started in 2009 and will send its recommendation to the ICS next year. Seven years of bureacracy may seem like a geologic pace, but many geologists think the Working Group is moving too fast.\u003c/p>\n\u003cp>No one disputes that humans now rival nature itself in many different ways. Most of the world’s rivers are dammed. Large areas of the continents are artificially managed as farms or forests. Humans move more rock and soil than erosion does. Large numbers of animal and plant species are going extinct under the influence of human activities, from hunting to habitat destruction. And of course we’re affecting global climate as we change the chemical balance of the atmosphere and oceans.\u003c/p>\n\u003cp>We really are in a new world today, and it’s fair to say that most geologists working today have known this for their whole careers. The role of geology is central as we all work out the consequences in shaping civilization for the future—where we get our minerals and energy, where we put our wastes, how we manage our disruptions of natural processes.\u003c/p>\n\u003cp>That’s all about the future. But do geologists need the “Anthropocene Epoch” in their time scale to do geology, that is, to research the Earth’s past?\u003c/p>\n\u003cp>[ad fullwidth]\u003c/p>\n\u003cp>The term was coined in 2000 by a non-geologist, the Nobel Prize-winning chemist Paul Crutzen, to drive home the idea that the global cycle of air, water and rock has come under human domination. He was standing in the front of a press conference, and it was a quip. As he wrote more about the topic, others took up the term including some geologists. Just a few years later, the ICS Working Group was formed.\u003c/p>\n\u003cp>As the Working Group has explored the possibilities, a healthy skepticism has arisen. The essence of a geologic time unit is that it can be marked somewhere in the rocks, preferably by \u003ca href=\"http://ww2.kqed.org/science/2013/10/31/a-new-golden-spike-monument-in-colorado-marks-geologic-time/\">marking the boundary with a “golden spike” monument\u003c/a> in a spot that everyone agrees is useful and correct.\u003c/p>\n\u003cp>How would we do that, and where would it go? And \u003ci>when\u003c/i>? Some proposals for the boundary are based on human dates, not natural signs. The researcher William Ruddiman has long argued that the “human era” began thousands of years ago, with widespread deforestation and the extinction of many large animal species like the mammoths. Crutzen thought that 1800, marking the Industrial Revolution, would be best. Another proposal is for 1950, when the “Great Acceleration” of post-World War II economic globalization began. \u003c/p>\n\u003cp>And there’s a strong appeal to 1945—specifically July 16 at 11:29:21 a.m. Universal Time, when the first atomic bomb was exploded in New Mexico, marking an abrupt change in atmospheric radioactivity. That’s what the Working Group \u003ca href=\"http://ib.berkeley.edu/labs/barnosky/Zalasiewicz%20et%20al%20QI2015.pdf\">picked earlier this year as a preliminary recommendation\u003c/a>.\u003c/p>\n\u003cp>But if we start a new period of geologic time during the lives of living people, what geologic materials are geologists studying? The rocks and soil deposits of that age are infinitesimally thin and fragile; even layers of ice in the polar ice caps could be gone in a few centuries if climate change causes them to melt. There are no fossils. How would we show Anthropocene deposits on \u003ca href=\"http://science.kqed.org/quest/2011/08/04/access-to-geologic-maps-the-landscapes-hidden-rooms/\">geologic maps\u003c/a>? It would be like writing a thick book on the history of Earth—which is what the geologic time scale represents—in which the last chapter is one sentence, “To be continued.”\u003c/p>\n\u003cp>Another strong argument against the Anthropocene is that we already have a formal time unit that includes the human era: \u003ca href=\"http://en.wikipedia.org/wiki/Holocene\">the Holocene Epoch\u003c/a>. The Holocene began 11,700 years ago, at the beginning of the latest of dozens of interglacials—warm periods between ice ages—like dozens before it in the Pleistocene epoch, but this specific interglacial is marked by the rise of civilization. So, \u003ca href=\"https://books.google.com/books?id=Vt6kAwAAQBAJ&pg=PA29&source=gbs_toc_r&cad=3#v=onepage&q&f=false\">geologists Phil Gibbard and Mike Walker have argued\u003c/a>, if we’re already living in the time of “the evolution of the human environment,” why should we end that era and start another one using the same criterion?\u003c/p>\n\u003cp>The trouble is that the Anthropocene proposal does not arise out of evidence from the rocks and sediments of the world’s past. It arises out of our awareness of the geologic processes that run the world now. In that sense the Anthropocene proposal, unlike all previous tinkerings with the time scale, is backwards.\u003c/p>\n\u003cp>\u003ca href=\"http://www.sciencemag.org/lookup/doi/10.1126/science.aaa7297\">Today in the journal \u003ci>Science\u003c/i>\u003c/a>, Ruddiman and three coauthors suggest, in effect, that we call the whole thing off. They argue that we’ve already changed Earth so much during the last several thousand years that setting a bright line in 1945 would be missing the boat. “Despite differing views, the term ‘Anthropocene’ is here to stay,” they say. “One way forward would be to use the term informally (with a small ‘a’). . . . In this way, we could avoid the confinement imposed by a single formal designation, yet acknowledge the long and rich history of humanity’s environmental transformation of this planet, both for better and for worse.”\u003c/p>\n\u003cp>By coining a name with a geological sound, Crutzen did a bit of memecrafting worthy of Shakespeare. One reason it caught on so well was that news stories and commentators could say, “Geologists are considering this radical step.” But if geologists reject the Anthropocene, the concept will lose some of the power Crutzen gave it. \u003c/p>\n\u003cp>[ad floatright]\u003c/p>\n\u003cp>It’s nice, especially for underappreciated geologists, to hold the world’s attention. But some of them resent that this notion, and the effort of making a decision about it, was foisted on them when they’re already quite in step with anthropocene matters on their own terms. In short, their argument goes, we didn’t ask for the change and we don’t need to own it. Let’s have everyone feel free to use the term instead, the way Crutzen hoped we would, for the time being.\u003c/p>\n\n",
"stats": {
"hasVideo": false,
"hasChartOrMap": false,
"hasAudio": false,
"hasPolis": false,
"wordCount": 1186,
"hasGoogleForm": false,
"hasGallery": false,
"hasHearkenModule": false,
"iframeSrcs": [],
"paragraphCount": 17
},
"modified": 1704932046,
"excerpt": "The \"Anthropocene,\" a geology-style name for the present human-dominated era of Earth history, has gotten lots of exposure. But geologists themselves have mixed feelings about actually using it.",
"headData": {
"twImgId": "",
"twTitle": "",
"ogTitle": "",
"ogImgId": "",
"twDescription": "",
"description": "The "Anthropocene," a geology-style name for the present human-dominated era of Earth history, has gotten lots of exposure. But geologists themselves have mixed feelings about actually using it.",
"title": "The Anthropocene: An Epoch Mistake? | KQED",
"ogDescription": "",
"schema": {
"@context": "https://schema.org",
"@type": "Article",
"headline": "The Anthropocene: An Epoch Mistake?",
"datePublished": "2015-04-02T11:01:20-07:00",
"dateModified": "2024-01-10T16:14:06-08:00",
"image": "https://cdn.kqed.org/wp-content/uploads/2020/02/KQED-OG-Image@1x.png"
}
},
"guestAuthors": [],
"slug": "the-anthropocene-should-we-call-the-whole-thing-off",
"status": "publish",
"sticky": false,
"path": "/science/28904/the-anthropocene-should-we-call-the-whole-thing-off",
"audioTrackLength": null,
"parsedContent": [
{
"type": "contentString",
"content": "\u003cdiv class=\"post-body\">\u003cp>\u003cfigure id=\"attachment_28905\" class=\"wp-caption aligncenter\" style=\"max-width: 800px\">\u003ca href=\"http://ww2.kqed.org/science/wp-content/uploads/sites/35/2015/04/anthropocene.jpg\">\u003cimg loading=\"lazy\" decoding=\"async\" src=\"http://ww2.kqed.org/science/wp-content/uploads/sites/35/2015/04/anthropocene.jpg\" alt=\"An Anthropocene outcrop\" width=\"800\" height=\"450\" class=\"size-full wp-image-28905\">\u003c/a>\u003cfigcaption class=\"wp-caption-text\">The Albany Bulb, which consists entirely of concrete “rocks” and other human artifacts, is a local emblem of the Anthropocene age—the time in geologic history when the human imprint is paramount. Should it appear as such on geologic maps? (Andrew Alden)\u003c/figcaption>\u003c/figure>\n\u003cp>Every now and then, some bit of knowledge from geology becomes widespread in the public mind: Plate tectonics, for instance, or the fact that birds are dinosaurs. The latest example is the “Anthropocene” concept. Based on the fact that many human activities are now more powerful than their natural equivalents, geologists are formally studying whether to give the name Anthropocene to the new period of geologic time we’re living in.\u003c/p>\n\u003cp>That may seem like a factoid, but it’s true. The International Commission on Stratigraphy, the scientific agency in charge of the geologic time scale, \u003ca href=\"http://quaternary.stratigraphy.org/workinggroups/anthropocene/\">has a committee evaluating this question\u003c/a>. The Working Group on the Anthropocene started in 2009 and will send its recommendation to the ICS next year. Seven years of bureacracy may seem like a geologic pace, but many geologists think the Working Group is moving too fast.\u003c/p>\n\u003cp>No one disputes that humans now rival nature itself in many different ways. Most of the world’s rivers are dammed. Large areas of the continents are artificially managed as farms or forests. Humans move more rock and soil than erosion does. Large numbers of animal and plant species are going extinct under the influence of human activities, from hunting to habitat destruction. And of course we’re affecting global climate as we change the chemical balance of the atmosphere and oceans.\u003c/p>\n\u003cp>We really are in a new world today, and it’s fair to say that most geologists working today have known this for their whole careers. The role of geology is central as we all work out the consequences in shaping civilization for the future—where we get our minerals and energy, where we put our wastes, how we manage our disruptions of natural processes.\u003c/p>\n\u003cp>That’s all about the future. But do geologists need the “Anthropocene Epoch” in their time scale to do geology, that is, to research the Earth’s past?\u003c/p>\n\u003cp>\u003c/p>\u003c/div>",
"attributes": {
"named": {},
"numeric": []
}
},
{
"type": "component",
"content": "",
"name": "ad",
"attributes": {
"named": {
"label": "fullwidth"
},
"numeric": [
"fullwidth"
]
}
},
{
"type": "contentString",
"content": "\u003cdiv class=\"post-body\">\u003cp>\u003c/p>\n\u003cp>The term was coined in 2000 by a non-geologist, the Nobel Prize-winning chemist Paul Crutzen, to drive home the idea that the global cycle of air, water and rock has come under human domination. He was standing in the front of a press conference, and it was a quip. As he wrote more about the topic, others took up the term including some geologists. Just a few years later, the ICS Working Group was formed.\u003c/p>\n\u003cp>As the Working Group has explored the possibilities, a healthy skepticism has arisen. The essence of a geologic time unit is that it can be marked somewhere in the rocks, preferably by \u003ca href=\"http://ww2.kqed.org/science/2013/10/31/a-new-golden-spike-monument-in-colorado-marks-geologic-time/\">marking the boundary with a “golden spike” monument\u003c/a> in a spot that everyone agrees is useful and correct.\u003c/p>\n\u003cp>How would we do that, and where would it go? And \u003ci>when\u003c/i>? Some proposals for the boundary are based on human dates, not natural signs. The researcher William Ruddiman has long argued that the “human era” began thousands of years ago, with widespread deforestation and the extinction of many large animal species like the mammoths. Crutzen thought that 1800, marking the Industrial Revolution, would be best. Another proposal is for 1950, when the “Great Acceleration” of post-World War II economic globalization began. \u003c/p>\n\u003cp>And there’s a strong appeal to 1945—specifically July 16 at 11:29:21 a.m. Universal Time, when the first atomic bomb was exploded in New Mexico, marking an abrupt change in atmospheric radioactivity. That’s what the Working Group \u003ca href=\"http://ib.berkeley.edu/labs/barnosky/Zalasiewicz%20et%20al%20QI2015.pdf\">picked earlier this year as a preliminary recommendation\u003c/a>.\u003c/p>\n\u003cp>But if we start a new period of geologic time during the lives of living people, what geologic materials are geologists studying? The rocks and soil deposits of that age are infinitesimally thin and fragile; even layers of ice in the polar ice caps could be gone in a few centuries if climate change causes them to melt. There are no fossils. How would we show Anthropocene deposits on \u003ca href=\"http://science.kqed.org/quest/2011/08/04/access-to-geologic-maps-the-landscapes-hidden-rooms/\">geologic maps\u003c/a>? It would be like writing a thick book on the history of Earth—which is what the geologic time scale represents—in which the last chapter is one sentence, “To be continued.”\u003c/p>\n\u003cp>Another strong argument against the Anthropocene is that we already have a formal time unit that includes the human era: \u003ca href=\"http://en.wikipedia.org/wiki/Holocene\">the Holocene Epoch\u003c/a>. The Holocene began 11,700 years ago, at the beginning of the latest of dozens of interglacials—warm periods between ice ages—like dozens before it in the Pleistocene epoch, but this specific interglacial is marked by the rise of civilization. So, \u003ca href=\"https://books.google.com/books?id=Vt6kAwAAQBAJ&pg=PA29&source=gbs_toc_r&cad=3#v=onepage&q&f=false\">geologists Phil Gibbard and Mike Walker have argued\u003c/a>, if we’re already living in the time of “the evolution of the human environment,” why should we end that era and start another one using the same criterion?\u003c/p>\n\u003cp>The trouble is that the Anthropocene proposal does not arise out of evidence from the rocks and sediments of the world’s past. It arises out of our awareness of the geologic processes that run the world now. In that sense the Anthropocene proposal, unlike all previous tinkerings with the time scale, is backwards.\u003c/p>\n\u003cp>\u003ca href=\"http://www.sciencemag.org/lookup/doi/10.1126/science.aaa7297\">Today in the journal \u003ci>Science\u003c/i>\u003c/a>, Ruddiman and three coauthors suggest, in effect, that we call the whole thing off. They argue that we’ve already changed Earth so much during the last several thousand years that setting a bright line in 1945 would be missing the boat. “Despite differing views, the term ‘Anthropocene’ is here to stay,” they say. “One way forward would be to use the term informally (with a small ‘a’). . . . In this way, we could avoid the confinement imposed by a single formal designation, yet acknowledge the long and rich history of humanity’s environmental transformation of this planet, both for better and for worse.”\u003c/p>\n\u003cp>By coining a name with a geological sound, Crutzen did a bit of memecrafting worthy of Shakespeare. One reason it caught on so well was that news stories and commentators could say, “Geologists are considering this radical step.” But if geologists reject the Anthropocene, the concept will lose some of the power Crutzen gave it. \u003c/p>\n\u003cp>\u003c/p>\u003c/div>",
"attributes": {
"named": {},
"numeric": []
}
},
{
"type": "component",
"content": "",
"name": "ad",
"attributes": {
"named": {
"label": "floatright"
},
"numeric": [
"floatright"
]
}
},
{
"type": "contentString",
"content": "\u003cdiv class=\"post-body\">\u003cp>\u003c/p>\n\u003cp>It’s nice, especially for underappreciated geologists, to hold the world’s attention. But some of them resent that this notion, and the effort of making a decision about it, was foisted on them when they’re already quite in step with anthropocene matters on their own terms. In short, their argument goes, we didn’t ask for the change and we don’t need to own it. Let’s have everyone feel free to use the term instead, the way Crutzen hoped we would, for the time being.\u003c/p>\n\n\u003c/div>\u003c/p>",
"attributes": {
"named": {},
"numeric": []
}
}
],
"link": "/science/28904/the-anthropocene-should-we-call-the-whole-thing-off",
"authors": [
"6228"
],
"categories": [
"science_38"
],
"featImg": "science_28905",
"label": "science"
},
"science_28578": {
"type": "posts",
"id": "science_28578",
"meta": {
"index": "posts_1716263798",
"site": "science",
"id": "28578",
"score": null,
"sort": [
1427378424000
]
},
"parent": 0,
"labelTerm": {
"site": "science"
},
"blocks": [],
"publishDate": 1427378424,
"format": "aside",
"title": "Tsunami Preparedness Week: Building a Network of Awareness",
"headTitle": "Tsunami Preparedness Week: Building a Network of Awareness | KQED",
"content": "\u003cfigure id=\"attachment_28579\" class=\"wp-caption aligncenter\" style=\"max-width: 800px\">\u003ca href=\"http://ww2.kqed.org/science/wp-content/uploads/sites/35/2015/03/tsunami-sign.jpg\">\u003cimg loading=\"lazy\" decoding=\"async\" class=\"size-full wp-image-28579\" src=\"http://ww2.kqed.org/science/wp-content/uploads/sites/35/2015/03/tsunami-sign.jpg\" alt=\"Tsunami hazard zone sign, Pebble Beach\" width=\"800\" height=\"450\">\u003c/a>\u003cfigcaption class=\"wp-caption-text\">Warning signs, like this one on 17-Mile Drive at Pebble Beach, have become routine up and down the west coast. They remind us to keep our eyes on more than just the view. (\u003ca href=\"https://www.flickr.com/photos/afagen/\">Adam Fagen\u003c/a>/\u003ca href=\"https://creativecommons.org/licenses/by-nc-sa/2.0/\">Creative Commons\u003c/a>)\u003c/figcaption>\u003c/figure>\n\u003cp>This week, March 22 – 28, is \u003ca href=\"http://www.caloes.ca.gov/NewsandMedia/Pages/Current%20News%20and%20Events/Tsunami%20Preparedness%20Week.aspx\">Tsunami Preparedness Week\u003c/a>, a concerted national effort to bring together everyone—from emergency responders to the general public—to prepare for tsunamis, the seismic sea waves which can threaten our Bay Area beaches and coastlines around the world.\u003c/p>\n\u003cp>The great earthquake tsunamis in Sumatra (2004) and Japan (2011) awakened an awareness of tsunamis that had faded in this country since the great Alaska earthquake of 1964. It has been heartening to watch this program spread through internet campaigns and social media.\u003c/p>\n\u003cp>The basic message for beach goers is as simple as it gets:\u003c/p>\n\u003col>\n\u003cli>Tsunamis can happen at any time.\u003c/li>\n\u003cli>Watch the sea for sudden changes.\u003c/li>\n\u003cli>Listen for sirens.\u003c/li>\n\u003c/ol>\n\u003cp>If one of these happens, get away from the water and stay away. Follow the signs to shelter. If you feel a long, strong earthquake, do the same. Big quakes, sudden sea changes, sirens—one of those three is enough. Don’t wait for the others, just get to safe ground.\u003c/p>\n\u003cp>Longtime locals know about tsunamis. So do science geeks like you and me. But we need to maintain, cultivate and spread that knowledge. Bring it up every now and then with neighbors, friends, coworkers and acquaintances. If you have house guests from out of the area, assign them some advance reading. If you’re traveling to other shores, assign yourself the same research—and share it with those you meet. This is what people in hurricane country, tornado country and blizzard country do.\u003c/p>\n\u003cp>[ad fullwidth]\u003c/p>\n\u003cp>Tsunami alerts on social media are a message multiplier. Wednesday morning at 10:15, this message came up on Twitter. I saw it directly because I’m one of the 15,600-plus followers of the National Weather Service’s @NWSBayArea account. \u003ca href=\"https://twitter.com/NWSBayArea/status/580779937516249089\">I immediately retweeted it\u003c/a> to my own 4400-plus followers.\u003c/p>\n\u003cfigure id=\"attachment_28580\" class=\"wp-caption aligncenter\" style=\"max-width: 600px\">\u003ca href=\"http://ww2.kqed.org/science/wp-content/uploads/sites/35/2015/03/twitter-tsu.jpg\">\u003cimg loading=\"lazy\" decoding=\"async\" class=\"size-full wp-image-28580\" src=\"http://ww2.kqed.org/science/wp-content/uploads/sites/35/2015/03/twitter-tsu.jpg\" alt=\"Twitter tsunami drill message\" width=\"600\" height=\"451\">\u003c/a>\u003cfigcaption class=\"wp-caption-text\">Tsunami drill message that was broadcast on Twitter March 25. It came with the text “TWITTER TSUNAMI DRILL: Please RT this message to test warning communications!” (NWS)\u003c/figcaption>\u003c/figure>\n\u003cp>What good did that do? It served as a drill for an alert system that could save lives. For instance, if I’d had friends or relatives visiting the beach yesterday, I could have followed up by phoning or texting them—after checking out the alert and making sure I understood it. Maybe they would have missed the tsunami sirens otherwise, or not grasped their meaning. Maybe they would recall seeing the signs on their way to the water.\u003c/p>\n\u003cp>\u003c/p>\n\u003cp>Ready to help spread the word? Adopt some of these sites as your own go-to places for tsunami awareness information and social media links:\u003c/p>\n\u003cul>\n\u003cli>\u003ca href=\"http://www.tsunamizone.org/\">The TsunamiZone\u003c/a> is a public home page guided by authorities in the field; beyond presenting the basics it hopes you’ll enlist in activities like the \u003ca href=\"http://www.tsunamiready.noaa.gov/\">TsunamiReady Program\u003c/a> for communities.\u003c/li>\n\u003cli>California’s central tsunami site \u003ca href=\"http://www.conservation.ca.gov/cgs/geologic_hazards/Tsunami/Inundation_Maps/Pages/Index.aspx\">www.tsunami.ca.gov\u003c/a> is run by the California Geological Survey. It presents inundation maps, specialized information for people like boat owners, and more.\u003c/li>\n\u003cli>The National Weather Service \u003ca href=\"http://www.weather.gov/socialmedia\">offers a wide choice of Twitter feeds and Facebook pages\u003c/a> to suit your preferences. The agency can plug you in to weather bulletins and news as well as tsunami alerts.\u003c/li>\n\u003cli>The U.S. Geological Survey covers tsunamis along with volcanoes, earthquakes, landslides and many other natural hazards. \u003ca href=\"http://www.usgs.gov/natural_hazards/\">Start on its Natural Hazards home page\u003c/a> to explore the scientific side of this field.\u003c/li>\n\u003cli>Finally, the National Weather Service runs the \u003ca href=\"http://wcatwc.arh.noaa.gov/\">National Tsunami Warning Center\u003c/a> for the U.S. and Canada and the \u003ca href=\"http://ptwc.weather.gov/\">Pacific Tsunami Warning Center\u003c/a> for the Pacific, Hawaii and the Caribbean. When the news media announce a tsunami message, this is where it comes from.\u003c/li>\n\u003c/ul>\n\n",
"stats": {
"hasVideo": false,
"hasChartOrMap": false,
"hasAudio": false,
"hasPolis": false,
"wordCount": 655,
"hasGoogleForm": false,
"hasGallery": false,
"hasHearkenModule": false,
"iframeSrcs": [],
"paragraphCount": 10
},
"modified": 1704932084,
"excerpt": "Tsunamis are a worldwide menace with specific local threats. It pays to learn your local situation and keep the knowledge fresh in your community.",
"headData": {
"twImgId": "",
"twTitle": "",
"ogTitle": "",
"ogImgId": "",
"twDescription": "",
"description": "Tsunamis are a worldwide menace with specific local threats. It pays to learn your local situation and keep the knowledge fresh in your community.",
"title": "Tsunami Preparedness Week: Building a Network of Awareness | KQED",
"ogDescription": "",
"schema": {
"@context": "https://schema.org",
"@type": "Article",
"headline": "Tsunami Preparedness Week: Building a Network of Awareness",
"datePublished": "2015-03-26T07:00:24-07:00",
"dateModified": "2024-01-10T16:14:44-08:00",
"image": "https://cdn.kqed.org/wp-content/uploads/2020/02/KQED-OG-Image@1x.png"
}
},
"guestAuthors": [],
"slug": "tsunami-preparedness-week-building-a-network-of-awareness",
"status": "publish",
"sticky": false,
"path": "/science/28578/tsunami-preparedness-week-building-a-network-of-awareness",
"audioTrackLength": null,
"parsedContent": [
{
"type": "contentString",
"content": "\u003cdiv class=\"post-body\">\u003cp>\u003cfigure id=\"attachment_28579\" class=\"wp-caption aligncenter\" style=\"max-width: 800px\">\u003ca href=\"http://ww2.kqed.org/science/wp-content/uploads/sites/35/2015/03/tsunami-sign.jpg\">\u003cimg loading=\"lazy\" decoding=\"async\" class=\"size-full wp-image-28579\" src=\"http://ww2.kqed.org/science/wp-content/uploads/sites/35/2015/03/tsunami-sign.jpg\" alt=\"Tsunami hazard zone sign, Pebble Beach\" width=\"800\" height=\"450\">\u003c/a>\u003cfigcaption class=\"wp-caption-text\">Warning signs, like this one on 17-Mile Drive at Pebble Beach, have become routine up and down the west coast. They remind us to keep our eyes on more than just the view. (\u003ca href=\"https://www.flickr.com/photos/afagen/\">Adam Fagen\u003c/a>/\u003ca href=\"https://creativecommons.org/licenses/by-nc-sa/2.0/\">Creative Commons\u003c/a>)\u003c/figcaption>\u003c/figure>\n\u003cp>This week, March 22 – 28, is \u003ca href=\"http://www.caloes.ca.gov/NewsandMedia/Pages/Current%20News%20and%20Events/Tsunami%20Preparedness%20Week.aspx\">Tsunami Preparedness Week\u003c/a>, a concerted national effort to bring together everyone—from emergency responders to the general public—to prepare for tsunamis, the seismic sea waves which can threaten our Bay Area beaches and coastlines around the world.\u003c/p>\n\u003cp>The great earthquake tsunamis in Sumatra (2004) and Japan (2011) awakened an awareness of tsunamis that had faded in this country since the great Alaska earthquake of 1964. It has been heartening to watch this program spread through internet campaigns and social media.\u003c/p>\n\u003cp>The basic message for beach goers is as simple as it gets:\u003c/p>\n\u003col>\n\u003cli>Tsunamis can happen at any time.\u003c/li>\n\u003cli>Watch the sea for sudden changes.\u003c/li>\n\u003cli>Listen for sirens.\u003c/li>\n\u003c/ol>\n\u003cp>If one of these happens, get away from the water and stay away. Follow the signs to shelter. If you feel a long, strong earthquake, do the same. Big quakes, sudden sea changes, sirens—one of those three is enough. Don’t wait for the others, just get to safe ground.\u003c/p>\n\u003cp>Longtime locals know about tsunamis. So do science geeks like you and me. But we need to maintain, cultivate and spread that knowledge. Bring it up every now and then with neighbors, friends, coworkers and acquaintances. If you have house guests from out of the area, assign them some advance reading. If you’re traveling to other shores, assign yourself the same research—and share it with those you meet. This is what people in hurricane country, tornado country and blizzard country do.\u003c/p>\n\u003cp>\u003c/p>\u003c/div>",
"attributes": {
"named": {},
"numeric": []
}
},
{
"type": "component",
"content": "",
"name": "ad",
"attributes": {
"named": {
"label": "fullwidth"
},
"numeric": [
"fullwidth"
]
}
},
{
"type": "contentString",
"content": "\u003cdiv class=\"post-body\">\u003cp>\u003c/p>\n\u003cp>Tsunami alerts on social media are a message multiplier. Wednesday morning at 10:15, this message came up on Twitter. I saw it directly because I’m one of the 15,600-plus followers of the National Weather Service’s @NWSBayArea account. \u003ca href=\"https://twitter.com/NWSBayArea/status/580779937516249089\">I immediately retweeted it\u003c/a> to my own 4400-plus followers.\u003c/p>\n\u003cfigure id=\"attachment_28580\" class=\"wp-caption aligncenter\" style=\"max-width: 600px\">\u003ca href=\"http://ww2.kqed.org/science/wp-content/uploads/sites/35/2015/03/twitter-tsu.jpg\">\u003cimg loading=\"lazy\" decoding=\"async\" class=\"size-full wp-image-28580\" src=\"http://ww2.kqed.org/science/wp-content/uploads/sites/35/2015/03/twitter-tsu.jpg\" alt=\"Twitter tsunami drill message\" width=\"600\" height=\"451\">\u003c/a>\u003cfigcaption class=\"wp-caption-text\">Tsunami drill message that was broadcast on Twitter March 25. It came with the text “TWITTER TSUNAMI DRILL: Please RT this message to test warning communications!” (NWS)\u003c/figcaption>\u003c/figure>\n\u003cp>What good did that do? It served as a drill for an alert system that could save lives. For instance, if I’d had friends or relatives visiting the beach yesterday, I could have followed up by phoning or texting them—after checking out the alert and making sure I understood it. Maybe they would have missed the tsunami sirens otherwise, or not grasped their meaning. Maybe they would recall seeing the signs on their way to the water.\u003c/p>\n\u003cp>\u003c/p>\n\u003cp>Ready to help spread the word? Adopt some of these sites as your own go-to places for tsunami awareness information and social media links:\u003c/p>\n\u003cul>\n\u003cli>\u003ca href=\"http://www.tsunamizone.org/\">The TsunamiZone\u003c/a> is a public home page guided by authorities in the field; beyond presenting the basics it hopes you’ll enlist in activities like the \u003ca href=\"http://www.tsunamiready.noaa.gov/\">TsunamiReady Program\u003c/a> for communities.\u003c/li>\n\u003cli>California’s central tsunami site \u003ca href=\"http://www.conservation.ca.gov/cgs/geologic_hazards/Tsunami/Inundation_Maps/Pages/Index.aspx\">www.tsunami.ca.gov\u003c/a> is run by the California Geological Survey. It presents inundation maps, specialized information for people like boat owners, and more.\u003c/li>\n\u003cli>The National Weather Service \u003ca href=\"http://www.weather.gov/socialmedia\">offers a wide choice of Twitter feeds and Facebook pages\u003c/a> to suit your preferences. The agency can plug you in to weather bulletins and news as well as tsunami alerts.\u003c/li>\n\u003cli>The U.S. Geological Survey covers tsunamis along with volcanoes, earthquakes, landslides and many other natural hazards. \u003ca href=\"http://www.usgs.gov/natural_hazards/\">Start on its Natural Hazards home page\u003c/a> to explore the scientific side of this field.\u003c/li>\n\u003cli>Finally, the National Weather Service runs the \u003ca href=\"http://wcatwc.arh.noaa.gov/\">National Tsunami Warning Center\u003c/a> for the U.S. and Canada and the \u003ca href=\"http://ptwc.weather.gov/\">Pacific Tsunami Warning Center\u003c/a> for the Pacific, Hawaii and the Caribbean. When the news media announce a tsunami message, this is where it comes from.\u003c/li>\n\u003c/ul>\n\n\u003c/div>\u003c/p>",
"attributes": {
"named": {},
"numeric": []
}
}
],
"link": "/science/28578/tsunami-preparedness-week-building-a-network-of-awareness",
"authors": [
"6228"
],
"categories": [
"science_38"
],
"tags": [
"science_1888",
"science_838"
],
"featImg": "science_28579",
"label": "science"
},
"science_28387": {
"type": "posts",
"id": "science_28387",
"meta": {
"index": "posts_1716263798",
"site": "science",
"id": "28387",
"score": null,
"sort": [
1426770036000
]
},
"parent": 0,
"labelTerm": {
"site": "science"
},
"blocks": [],
"publishDate": 1426770036,
"format": "aside",
"title": "After an Earthquake, Use Your Phone Camera - For Science",
"headTitle": "After an Earthquake, Use Your Phone Camera – For Science | KQED",
"content": "\u003cfigure id=\"attachment_28388\" class=\"wp-caption aligncenter\" style=\"max-width: 800px\">\u003ca href=\"http://ww2.kqed.org/science/wp-content/uploads/sites/35/2015/03/napa-quake-field.jpg\">\u003cimg loading=\"lazy\" decoding=\"async\" src=\"http://ww2.kqed.org/science/wp-content/uploads/sites/35/2015/03/napa-quake-field.jpg\" alt=\"Moletrack from fault motion during the Napa earthquake\" width=\"800\" height=\"450\" class=\"size-full wp-image-28388\">\u003c/a>\u003cfigcaption class=\"wp-caption-text\">Movement on the West Napa Fault raised this “moletrack” during the 2014 South Napa earthquake. Ordinary people can document earthquake phenomena in ways that help science. (Dan Ponti/USGS)\u003c/figcaption>\u003c/figure>\n\u003cp>If you live in the Bay area long enough, you’ll experience a large earthquake. When that happens, of course the first priority is to save yourself and check on your neighbors. But new imaging techniques give you ways of using your phone to help scientists learn from the event.\u003c/p>\n\u003cp>The South Napa earthquake of August 24, 2014 was documented by thousands of people around the epicenter, each in their own ways. Images from that day show that most people, naturally, turned their cameras toward broken buildings, fires, injuries and ambulances. \u003c/p>\n\u003cp>But when earthquake scientists entered the epicentral area, their eyes were on the ground. Time is crucial in quake investigations, and much can happen during the hours and days before scientists get around to every interesting spot. Residents have the advantage of being there already.\u003c/p>\n\u003cp>Geologists pour into town after a large earthquake. Some are there to assess damages and help plan repairs. Others will be researchers from state and federal agencies. Earth science teachers will bring their classes to the scene, first to help out and second to give students a taste of meaningful fieldwork. Mike Oskin, a UC Davis researcher, was one of those who raced in with his students to study the quake zone after the Napa quake. He says that phone cameras recorded scientifically useful data.\u003c/p>\n\u003cp>If you happen to be near evidence of the quake, here’s what to document:\u003c/p>\n\u003cp>[ad fullwidth]\u003c/p>\n\u003cp>\u003cstrong>Ground offsets:\u003c/strong> Fresh cracks with evidence of motion—up, down or sideways—are valuable clues. Take these photos early and often, Oskin says: “The phenomenon of afterslip, where slow deformation continues after the earthquake, means that getting an observation as soon as possible is desirable, along with additional observations later.” \u003c/p>\n\u003cfigure id=\"attachment_28389\" class=\"wp-caption aligncenter\" style=\"max-width: 600px\">\u003ca href=\"http://ww2.kqed.org/science/wp-content/uploads/sites/35/2015/03/napa-road-buckle.jpg\">\u003cimg loading=\"lazy\" decoding=\"async\" src=\"http://ww2.kqed.org/science/wp-content/uploads/sites/35/2015/03/napa-road-buckle.jpg\" alt=\"Fault disturbance on a Napa street\" width=\"600\" height=\"400\" class=\"size-full wp-image-28389\">\u003c/a>\u003cfigcaption class=\"wp-caption-text\">Fault-related displacement in a Napa street was captured before repair crews wiped it out. (\u003ca href=\"https://www.flickr.com/photos/matthewkeycs/\">Matthew Keys\u003c/a>/\u003ca href=\"https://creativecommons.org/licenses/by-nd/2.0/\">CC BY-ND\u003c/a>)\u003c/figcaption>\u003c/figure>\n\u003cp>\u003cstrong>Upheaval and subsidence:\u003c/strong> Sloping ground, or land near a riverbank, may sink as the ground compacts or moves sideways. Other areas may rise from compressive forces, like the “moletrack” shown at the top of this post. Again, repeated photos can document a history of progressive motion.\u003c/p>\n\u003cp>\u003cstrong>Landslides:\u003c/strong> These can happen from minutes to months after an earthquake, depending on the degree of shaking, recent rainfall and aftershocks. A series of images taken from the same spot can document imperceptible shifts in the land before a slide.\u003c/p>\n\u003cp>\u003cstrong>Sand boils and similar disturbances:\u003c/strong> Eruptions of mud and sand are common after many earthquakes. Recording short videos of these as well as still images may be useful.\u003c/p>\n\u003cp>\u003cstrong>Streamflow:\u003c/strong> A well-known aftereffect of earthquakes is a short-lived surge in water flowing through streams. If you live near a stream, even one that’s dry most of the year, check it often and record any changes in its behavior. Short videos may help in gauging the volume of flow.\u003c/p>\n\u003cp>When taking photos, put a familiar object in the shot for a sense of scale. Coins or keys are handy scale objects, but almost anything will do. (Geologists on vacation often use their spouses and children.)\u003c/p>\n\u003cp>Once you’ve gathered photographic data, it’s important to find a scientist to share it with, the sooner the better. Oskin says, “Early on scientists don’t know where to find the surface rupture, so citizen-scientists can contribute a lot to figuring out what happened. As far as I’m concerned, broadcasting information via social media (Twitter) is perfect for sharing information about surface rupture.”\u003c/p>\n\u003cp>Scientists themselves were well served after the Napa quake by the \u003ca href=\"http://www.californiaeqclearinghouse.org/\">California Earthquake Clearinghouse\u003c/a>, a temporary field center where all sorts of responders could coordinate and share information. So if you give a scientist a tip to something interesting, they will know where to pass it on.\u003c/p>\n\u003cp>The most promising advance in this field is that scientists can stitch sets of photos—even your phone-cam shots—into three-dimensional models. This technique is called “structure from motion,” or SfM. Tim Dawson of the California Geological Survey, who coordinated the state’s data collection campaign after the Napa quake, says of SfM that “if people were more aware of it, it would be useful for quick data collection.”\u003c/p>\n\u003cp>\u003ca href=\"http://www.sciencedirect.com/science/article/pii/S0169555X12004217\">SfM was introduced to Earth scientists just a few years ago\u003c/a>. It’s like the familiar process of making stereoscopic images, but on steroids. \u003c/p>\n\u003cfigure id=\"attachment_28390\" class=\"wp-caption aligncenter\" style=\"max-width: 600px\">\u003ca href=\"http://ww2.kqed.org/science/wp-content/uploads/sites/35/2015/03/vofstereo.jpg\">\u003cimg loading=\"lazy\" decoding=\"async\" src=\"http://ww2.kqed.org/science/wp-content/uploads/sites/35/2015/03/vofstereo.jpg\" alt=\"Stereo image from Valley of Fire, Nevada\" width=\"600\" height=\"400\" class=\"size-full wp-image-28390\">\u003c/a>\u003cfigcaption class=\"wp-caption-text\">Stereo image of a scene from Nevada’s Valley of Fire State Park. To view it, carefully cross your eyes until the two images fuse in a 3D picture. (Andrew Alden) \u003ccite>(Andrew Alden/KQED)\u003c/cite>\u003c/figcaption>\u003c/figure>\n\u003cp>In stereoscopy, the brain matches corresponding features in the two images and automatically translates them into a 3D picture. In SfM, a computer matches small details between multiple images and uses them as a framework to assemble the data into a 3D model.\u003c/p>\n\u003cp>To make a set of photos for SfM, walk around the feature and take at least a dozen shots. Ensure lots of overlap, be sure to add a scale object, and don’t change the zoom or the camera orientation. The geolocation and EXIF data that most smartphones and cameras attach to photos is very helpful for scientific purposes. Oskin says that his students are refining the technique: “One of our goals is in fact to make this accessible for the public.” \u003c/p>\n\u003cp>\u003c/p>\n\u003cp>Anyone with the presence of mind to look around in the wake of a major quake can contribute to earthquake science. In your hands, a smartphone can become a scientific tool. If this appeals to you, put a portable charger on your emergency preparedness shopping list.\u003c/p>\n\n",
"stats": {
"hasVideo": false,
"hasChartOrMap": false,
"hasAudio": false,
"hasPolis": false,
"wordCount": 982,
"hasGoogleForm": false,
"hasGallery": false,
"hasHearkenModule": false,
"iframeSrcs": [],
"paragraphCount": 20
},
"modified": 1704932115,
"excerpt": "Large earthquakes are in our future. When one strikes, there are ways you can help scientists study the event using your phone.",
"headData": {
"twImgId": "",
"twTitle": "",
"ogTitle": "",
"ogImgId": "",
"twDescription": "",
"description": "Large earthquakes are in our future. When one strikes, there are ways you can help scientists study the event using your phone.",
"title": "After an Earthquake, Use Your Phone Camera - For Science | KQED",
"ogDescription": "",
"schema": {
"@context": "https://schema.org",
"@type": "Article",
"headline": "After an Earthquake, Use Your Phone Camera - For Science",
"datePublished": "2015-03-19T06:00:36-07:00",
"dateModified": "2024-01-10T16:15:15-08:00",
"image": "https://cdn.kqed.org/wp-content/uploads/2020/02/KQED-OG-Image@1x.png"
}
},
"guestAuthors": [],
"slug": "after-an-earthquake-use-your-phone-camera-for-science",
"status": "publish",
"sticky": false,
"path": "/science/28387/after-an-earthquake-use-your-phone-camera-for-science",
"audioTrackLength": null,
"parsedContent": [
{
"type": "contentString",
"content": "\u003cdiv class=\"post-body\">\u003cp>\u003cfigure id=\"attachment_28388\" class=\"wp-caption aligncenter\" style=\"max-width: 800px\">\u003ca href=\"http://ww2.kqed.org/science/wp-content/uploads/sites/35/2015/03/napa-quake-field.jpg\">\u003cimg loading=\"lazy\" decoding=\"async\" src=\"http://ww2.kqed.org/science/wp-content/uploads/sites/35/2015/03/napa-quake-field.jpg\" alt=\"Moletrack from fault motion during the Napa earthquake\" width=\"800\" height=\"450\" class=\"size-full wp-image-28388\">\u003c/a>\u003cfigcaption class=\"wp-caption-text\">Movement on the West Napa Fault raised this “moletrack” during the 2014 South Napa earthquake. Ordinary people can document earthquake phenomena in ways that help science. (Dan Ponti/USGS)\u003c/figcaption>\u003c/figure>\n\u003cp>If you live in the Bay area long enough, you’ll experience a large earthquake. When that happens, of course the first priority is to save yourself and check on your neighbors. But new imaging techniques give you ways of using your phone to help scientists learn from the event.\u003c/p>\n\u003cp>The South Napa earthquake of August 24, 2014 was documented by thousands of people around the epicenter, each in their own ways. Images from that day show that most people, naturally, turned their cameras toward broken buildings, fires, injuries and ambulances. \u003c/p>\n\u003cp>But when earthquake scientists entered the epicentral area, their eyes were on the ground. Time is crucial in quake investigations, and much can happen during the hours and days before scientists get around to every interesting spot. Residents have the advantage of being there already.\u003c/p>\n\u003cp>Geologists pour into town after a large earthquake. Some are there to assess damages and help plan repairs. Others will be researchers from state and federal agencies. Earth science teachers will bring their classes to the scene, first to help out and second to give students a taste of meaningful fieldwork. Mike Oskin, a UC Davis researcher, was one of those who raced in with his students to study the quake zone after the Napa quake. He says that phone cameras recorded scientifically useful data.\u003c/p>\n\u003cp>If you happen to be near evidence of the quake, here’s what to document:\u003c/p>\n\u003cp>\u003c/p>\u003c/div>",
"attributes": {
"named": {},
"numeric": []
}
},
{
"type": "component",
"content": "",
"name": "ad",
"attributes": {
"named": {
"label": "fullwidth"
},
"numeric": [
"fullwidth"
]
}
},
{
"type": "contentString",
"content": "\u003cdiv class=\"post-body\">\u003cp>\u003c/p>\n\u003cp>\u003cstrong>Ground offsets:\u003c/strong> Fresh cracks with evidence of motion—up, down or sideways—are valuable clues. Take these photos early and often, Oskin says: “The phenomenon of afterslip, where slow deformation continues after the earthquake, means that getting an observation as soon as possible is desirable, along with additional observations later.” \u003c/p>\n\u003cfigure id=\"attachment_28389\" class=\"wp-caption aligncenter\" style=\"max-width: 600px\">\u003ca href=\"http://ww2.kqed.org/science/wp-content/uploads/sites/35/2015/03/napa-road-buckle.jpg\">\u003cimg loading=\"lazy\" decoding=\"async\" src=\"http://ww2.kqed.org/science/wp-content/uploads/sites/35/2015/03/napa-road-buckle.jpg\" alt=\"Fault disturbance on a Napa street\" width=\"600\" height=\"400\" class=\"size-full wp-image-28389\">\u003c/a>\u003cfigcaption class=\"wp-caption-text\">Fault-related displacement in a Napa street was captured before repair crews wiped it out. (\u003ca href=\"https://www.flickr.com/photos/matthewkeycs/\">Matthew Keys\u003c/a>/\u003ca href=\"https://creativecommons.org/licenses/by-nd/2.0/\">CC BY-ND\u003c/a>)\u003c/figcaption>\u003c/figure>\n\u003cp>\u003cstrong>Upheaval and subsidence:\u003c/strong> Sloping ground, or land near a riverbank, may sink as the ground compacts or moves sideways. Other areas may rise from compressive forces, like the “moletrack” shown at the top of this post. Again, repeated photos can document a history of progressive motion.\u003c/p>\n\u003cp>\u003cstrong>Landslides:\u003c/strong> These can happen from minutes to months after an earthquake, depending on the degree of shaking, recent rainfall and aftershocks. A series of images taken from the same spot can document imperceptible shifts in the land before a slide.\u003c/p>\n\u003cp>\u003cstrong>Sand boils and similar disturbances:\u003c/strong> Eruptions of mud and sand are common after many earthquakes. Recording short videos of these as well as still images may be useful.\u003c/p>\n\u003cp>\u003cstrong>Streamflow:\u003c/strong> A well-known aftereffect of earthquakes is a short-lived surge in water flowing through streams. If you live near a stream, even one that’s dry most of the year, check it often and record any changes in its behavior. Short videos may help in gauging the volume of flow.\u003c/p>\n\u003cp>When taking photos, put a familiar object in the shot for a sense of scale. Coins or keys are handy scale objects, but almost anything will do. (Geologists on vacation often use their spouses and children.)\u003c/p>\n\u003cp>Once you’ve gathered photographic data, it’s important to find a scientist to share it with, the sooner the better. Oskin says, “Early on scientists don’t know where to find the surface rupture, so citizen-scientists can contribute a lot to figuring out what happened. As far as I’m concerned, broadcasting information via social media (Twitter) is perfect for sharing information about surface rupture.”\u003c/p>\n\u003cp>Scientists themselves were well served after the Napa quake by the \u003ca href=\"http://www.californiaeqclearinghouse.org/\">California Earthquake Clearinghouse\u003c/a>, a temporary field center where all sorts of responders could coordinate and share information. So if you give a scientist a tip to something interesting, they will know where to pass it on.\u003c/p>\n\u003cp>The most promising advance in this field is that scientists can stitch sets of photos—even your phone-cam shots—into three-dimensional models. This technique is called “structure from motion,” or SfM. Tim Dawson of the California Geological Survey, who coordinated the state’s data collection campaign after the Napa quake, says of SfM that “if people were more aware of it, it would be useful for quick data collection.”\u003c/p>\n\u003cp>\u003ca href=\"http://www.sciencedirect.com/science/article/pii/S0169555X12004217\">SfM was introduced to Earth scientists just a few years ago\u003c/a>. It’s like the familiar process of making stereoscopic images, but on steroids. \u003c/p>\n\u003cfigure id=\"attachment_28390\" class=\"wp-caption aligncenter\" style=\"max-width: 600px\">\u003ca href=\"http://ww2.kqed.org/science/wp-content/uploads/sites/35/2015/03/vofstereo.jpg\">\u003cimg loading=\"lazy\" decoding=\"async\" src=\"http://ww2.kqed.org/science/wp-content/uploads/sites/35/2015/03/vofstereo.jpg\" alt=\"Stereo image from Valley of Fire, Nevada\" width=\"600\" height=\"400\" class=\"size-full wp-image-28390\">\u003c/a>\u003cfigcaption class=\"wp-caption-text\">Stereo image of a scene from Nevada’s Valley of Fire State Park. To view it, carefully cross your eyes until the two images fuse in a 3D picture. (Andrew Alden) \u003ccite>(Andrew Alden/KQED)\u003c/cite>\u003c/figcaption>\u003c/figure>\n\u003cp>In stereoscopy, the brain matches corresponding features in the two images and automatically translates them into a 3D picture. In SfM, a computer matches small details between multiple images and uses them as a framework to assemble the data into a 3D model.\u003c/p>\n\u003cp>To make a set of photos for SfM, walk around the feature and take at least a dozen shots. Ensure lots of overlap, be sure to add a scale object, and don’t change the zoom or the camera orientation. The geolocation and EXIF data that most smartphones and cameras attach to photos is very helpful for scientific purposes. Oskin says that his students are refining the technique: “One of our goals is in fact to make this accessible for the public.” \u003c/p>\n\u003cp>\u003c/p>\n\u003cp>Anyone with the presence of mind to look around in the wake of a major quake can contribute to earthquake science. In your hands, a smartphone can become a scientific tool. If this appeals to you, put a portable charger on your emergency preparedness shopping list.\u003c/p>\n\n\u003c/div>\u003c/p>",
"attributes": {
"named": {},
"numeric": []
}
}
],
"link": "/science/28387/after-an-earthquake-use-your-phone-camera-for-science",
"authors": [
"6228"
],
"categories": [
"science_38"
],
"tags": [
"science_123",
"science_1888",
"science_427",
"science_1841"
],
"featImg": "science_28388",
"label": "science"
},
"science_28104": {
"type": "posts",
"id": "science_28104",
"meta": {
"index": "posts_1716263798",
"site": "science",
"id": "28104",
"score": null,
"sort": [
1426212742000
]
},
"parent": 0,
"labelTerm": {
"site": "science"
},
"blocks": [],
"publishDate": 1426212742,
"format": "aside",
"title": "South American Peaks Contain 2000-Year Record of Lead in the Air",
"headTitle": "South American Peaks Contain 2000-Year Record of Lead in the Air | KQED",
"content": "\u003cfigure id=\"attachment_28105\" class=\"wp-caption aligncenter\" style=\"max-width: 800px\">\u003ca href=\"http://ww2.kqed.org/science/wp-content/uploads/sites/35/2015/03/Illimani_La_Paz_April_2014.jpg\">\u003cimg loading=\"lazy\" decoding=\"async\" class=\"size-full wp-image-28105\" src=\"http://ww2.kqed.org/science/wp-content/uploads/sites/35/2015/03/Illimani_La_Paz_April_2014.jpg\" alt=\"Nevado Illimani, Bolivia\" width=\"800\" height=\"450\">\u003c/a>\u003cfigcaption class=\"wp-caption-text\">Nevado Illimani, in Bolivia, contains ancient ice that records the state of the atmosphere since Ice Age times. (Hernan Payrumani/Wikimedia)\u003c/figcaption>\u003c/figure>\n\u003cp>New data from the ancient ice of a Bolivian glacier show that this region’s worst exposure to airborne lead in the last 2000 years came not from metal smelting by the Incas or the Spaniards, but from leaded gasoline just 50 years ago. Our ill-fated experiment putting lead in gasoline appears to have tainted Earth with the toxic metal far more than any other source. Thus the 20th-century political battle over leaded gas, which put America generations behind in lowering greenhouse gases, left its mark across the whole world.\u003c/p>\n\u003cp>Climate scientists are interested in glaciers because every year they trap samples of water, dust and gases in layers of snow and ice. Some glaciers preserve these samples for many thousands of years. The great ice caps of Antarctica and Greenland have the longest records. They yield information on volcanic eruptions near and far, ancient air temperatures and the human output over recent centuries of industrial wastes.\u003c/p>\n\u003cp>Ice records from outside the polar regions are precious and endangered, especially in the tropics. One of these records is preserved in glaciers on the 21,000-foot peak of Nevado Illimani, in Bolivia. \u003ca href=\"http://advances.sciencemag.org/content/1/2/e1400196\">An open-access paper just published in the journal Science Advances\u003c/a> reports on 2000 years of atmospheric lead, in an ice core that was collected in 1999. The data shed light on the history of technology before and after Columbus opened the New World to Europe around 1500.\u003c/p>\n\u003cp>Bolivia has always been an exceptional producer of metals—at first, silver, and later other metals like copper and nickel. Most metal ores contain lead as an impurity, so smelting releases lead-bearing dust into the air. Tiny lead-bearing particles are preserved not only in Illimani’s ice, but also in lake-bottom sediments around the region. The top 127.5 meters of Illimani ice is a record of 20 centuries of metallurgical history.\u003c/p>\n\u003cfigure id=\"attachment_28106\" class=\"wp-caption aligncenter\" style=\"max-width: 500px\">\u003ca href=\"http://ww2.kqed.org/science/wp-content/uploads/sites/35/2015/03/Illimani-lead-graph.png\">\u003cimg loading=\"lazy\" decoding=\"async\" class=\"size-full wp-image-28106\" src=\"http://ww2.kqed.org/science/wp-content/uploads/sites/35/2015/03/Illimani-lead-graph.png\" alt=\"2000 years of lead deposition on Nevado Illimani\" width=\"500\" height=\"380\">\u003c/a>\u003cfigcaption class=\"wp-caption-text\">2000-year record of lead levels in the Illimani ice core. Lead concentration is expressed as an emission factor (EF Pb), where 1 signifies the level of natural emissions. Note that EF’s between 14 and 20 are cut out to save space. The change in emissions around 1600 resulted when the Spaniards replaced the Inca smelters, called \u003ci>huayras\u003c/i>, with mercury-based techniques. (\u003ca href=\"http://advances.sciencemag.org/content/1/2/e1400196\">Science Advances\u003c/a>/CC BY-NC)\u003c/figcaption>\u003c/figure>\n\u003cp>First came the wealthy Tiwanaku and Wari cultures, which smelted silver between the years 450 and 950. Lead levels rose to double the natural average at this time. A three-century-long drought replaced these empires with “decentralized polities,” and lead levels fell until the Incas took up silver mining again, starting around 1450. When the Spanish conquistadors toppled the Incas in 1532, Bolivia became the Saudi Arabia of silver, with lead emissions rising to four times background.\u003c/p>\n\u003cp>[ad fullwidth]\u003c/p>\n\u003cp>The long silver boom ended with the 1700s. Then came the tin boom of the 1900s, when Bolivia was consistently among the top three producers of that important metal. Tin ores, like silver ores, contain lead as a contaminant, and the ice bore witness to lead pollution as much as six times background, well above any previous extreme since the year zero.\u003c/p>\n\u003cp>As tin faded, copper and nickel mining kept lead levels well above background in the Illimani ice record. But lead pollution rose three times over even these unprecedented levels when lead was deliberately added to gasoline, peaking in the 1960s and finally ending in the early 2000s. Excess lead is recorded in the Greenland and Antarctic ice caps too.\u003c/p>\n\u003cp>You could argue that mining of tin, copper and nickel helps civilization far more than the harm it may cause from lead emissions. But how did we come to think it was a good idea to spray poisonous lead out of every tailpipe in the world?\u003c/p>\n\u003cp>\u003ca href=\"http://www.environmentalhistory.org/billkovarik/about-bk/research/henry-ford-charles-kettering-and-the-fuel-of-the-future/\">A meticulous history of leaded fuel\u003c/a> by Professor Bill Kovarik, of Unity College, shows that in a pitched battle between American oil drillers and grain farmers in the 1920s, tetra-ethyl lead (“ethyl”) was a key weapon. Gasoline engines were prone to “knock” and the fuel supply came increasingly from foreign oil wells. Ethanol had domestic sources and was immune to knock. But ethyl enabled gasoline engines to avoid knock, if you didn’t mind putting toxic lead in the exhaust.\u003c/p>\n\u003cp>Kovaric shows that major actors like General Motors and the American Petroleum Institute won the day in the lobbies of Congress and federal agencies. Under attack from lobbyists and Congress, agencies suppressed scientific research on ethyl’s toxicity and ethanol’s performance. The contest between gasoline and ethanol was not a fair one. “In essence,” Kovarik concluded, “political conditions shaped the marketplace and the new competition [ethanol] faced a difficult economic playing field heavily tilted toward established industries.”\u003c/p>\n\u003cp>Ethanol lost out to oil in the 1930s. Today it’s mounting a comeback aided by a new political factor, greenhouse gas emissions. \u003ca href=\"http://pubs.acs.org/doi/abs/10.1021/es5052588\">A recent study in the journal \u003ci>Environmental Science and Technology\u003c/i>\u003c/a> compared three ethanol-producing crops—cornstalks, switchgrass and \u003ca href=\"http://www.extension.org/pages/26625/miscanthus-miscanthus-x-giganteus-for-biofuel-production\">a hybrid form of miscanthus grass\u003c/a>—and found that miscanthus, a relative of sugarcane, offers as much as three times the climate benefit of corn. This kind of analysis can influence climate policy—but only if it can win a place at the policymaking table.\u003c/p>\n\u003cp>\u003c/p>\n\u003cp>The battle for the transportation fuel market goes on. Ethanol remains handicapped by eight decades of opposition, but at least toxic lead is out of the picture.\u003c/p>\n\n",
"stats": {
"hasVideo": false,
"hasChartOrMap": false,
"hasAudio": false,
"hasPolis": false,
"wordCount": 945,
"hasGoogleForm": false,
"hasGallery": false,
"hasHearkenModule": false,
"iframeSrcs": [],
"paragraphCount": 14
},
"modified": 1704932146,
"excerpt": "New data from the ancient ice of a tropical glacier shows that lead in gasoline tainted the Earth with the toxic metal far more than any other source, past or present, human or natural.",
"headData": {
"twImgId": "",
"twTitle": "",
"ogTitle": "",
"ogImgId": "",
"twDescription": "",
"description": "New data from the ancient ice of a tropical glacier shows that lead in gasoline tainted the Earth with the toxic metal far more than any other source, past or present, human or natural.",
"title": "South American Peaks Contain 2000-Year Record of Lead in the Air | KQED",
"ogDescription": "",
"schema": {
"@context": "https://schema.org",
"@type": "Article",
"headline": "South American Peaks Contain 2000-Year Record of Lead in the Air",
"datePublished": "2015-03-12T19:12:22-07:00",
"dateModified": "2024-01-10T16:15:46-08:00",
"image": "https://cdn.kqed.org/wp-content/uploads/2020/02/KQED-OG-Image@1x.png"
}
},
"guestAuthors": [],
"slug": "south-american-peaks-contain-2000-year-record-of-lead-in-the-air",
"status": "publish",
"sticky": false,
"path": "/science/28104/south-american-peaks-contain-2000-year-record-of-lead-in-the-air",
"audioTrackLength": null,
"parsedContent": [
{
"type": "contentString",
"content": "\u003cdiv class=\"post-body\">\u003cp>\u003cfigure id=\"attachment_28105\" class=\"wp-caption aligncenter\" style=\"max-width: 800px\">\u003ca href=\"http://ww2.kqed.org/science/wp-content/uploads/sites/35/2015/03/Illimani_La_Paz_April_2014.jpg\">\u003cimg loading=\"lazy\" decoding=\"async\" class=\"size-full wp-image-28105\" src=\"http://ww2.kqed.org/science/wp-content/uploads/sites/35/2015/03/Illimani_La_Paz_April_2014.jpg\" alt=\"Nevado Illimani, Bolivia\" width=\"800\" height=\"450\">\u003c/a>\u003cfigcaption class=\"wp-caption-text\">Nevado Illimani, in Bolivia, contains ancient ice that records the state of the atmosphere since Ice Age times. (Hernan Payrumani/Wikimedia)\u003c/figcaption>\u003c/figure>\n\u003cp>New data from the ancient ice of a Bolivian glacier show that this region’s worst exposure to airborne lead in the last 2000 years came not from metal smelting by the Incas or the Spaniards, but from leaded gasoline just 50 years ago. Our ill-fated experiment putting lead in gasoline appears to have tainted Earth with the toxic metal far more than any other source. Thus the 20th-century political battle over leaded gas, which put America generations behind in lowering greenhouse gases, left its mark across the whole world.\u003c/p>\n\u003cp>Climate scientists are interested in glaciers because every year they trap samples of water, dust and gases in layers of snow and ice. Some glaciers preserve these samples for many thousands of years. The great ice caps of Antarctica and Greenland have the longest records. They yield information on volcanic eruptions near and far, ancient air temperatures and the human output over recent centuries of industrial wastes.\u003c/p>\n\u003cp>Ice records from outside the polar regions are precious and endangered, especially in the tropics. One of these records is preserved in glaciers on the 21,000-foot peak of Nevado Illimani, in Bolivia. \u003ca href=\"http://advances.sciencemag.org/content/1/2/e1400196\">An open-access paper just published in the journal Science Advances\u003c/a> reports on 2000 years of atmospheric lead, in an ice core that was collected in 1999. The data shed light on the history of technology before and after Columbus opened the New World to Europe around 1500.\u003c/p>\n\u003cp>Bolivia has always been an exceptional producer of metals—at first, silver, and later other metals like copper and nickel. Most metal ores contain lead as an impurity, so smelting releases lead-bearing dust into the air. Tiny lead-bearing particles are preserved not only in Illimani’s ice, but also in lake-bottom sediments around the region. The top 127.5 meters of Illimani ice is a record of 20 centuries of metallurgical history.\u003c/p>\n\u003cfigure id=\"attachment_28106\" class=\"wp-caption aligncenter\" style=\"max-width: 500px\">\u003ca href=\"http://ww2.kqed.org/science/wp-content/uploads/sites/35/2015/03/Illimani-lead-graph.png\">\u003cimg loading=\"lazy\" decoding=\"async\" class=\"size-full wp-image-28106\" src=\"http://ww2.kqed.org/science/wp-content/uploads/sites/35/2015/03/Illimani-lead-graph.png\" alt=\"2000 years of lead deposition on Nevado Illimani\" width=\"500\" height=\"380\">\u003c/a>\u003cfigcaption class=\"wp-caption-text\">2000-year record of lead levels in the Illimani ice core. Lead concentration is expressed as an emission factor (EF Pb), where 1 signifies the level of natural emissions. Note that EF’s between 14 and 20 are cut out to save space. The change in emissions around 1600 resulted when the Spaniards replaced the Inca smelters, called \u003ci>huayras\u003c/i>, with mercury-based techniques. (\u003ca href=\"http://advances.sciencemag.org/content/1/2/e1400196\">Science Advances\u003c/a>/CC BY-NC)\u003c/figcaption>\u003c/figure>\n\u003cp>First came the wealthy Tiwanaku and Wari cultures, which smelted silver between the years 450 and 950. Lead levels rose to double the natural average at this time. A three-century-long drought replaced these empires with “decentralized polities,” and lead levels fell until the Incas took up silver mining again, starting around 1450. When the Spanish conquistadors toppled the Incas in 1532, Bolivia became the Saudi Arabia of silver, with lead emissions rising to four times background.\u003c/p>\n\u003cp>\u003c/p>\u003c/div>",
"attributes": {
"named": {},
"numeric": []
}
},
{
"type": "component",
"content": "",
"name": "ad",
"attributes": {
"named": {
"label": "fullwidth"
},
"numeric": [
"fullwidth"
]
}
},
{
"type": "contentString",
"content": "\u003cdiv class=\"post-body\">\u003cp>\u003c/p>\n\u003cp>The long silver boom ended with the 1700s. Then came the tin boom of the 1900s, when Bolivia was consistently among the top three producers of that important metal. Tin ores, like silver ores, contain lead as a contaminant, and the ice bore witness to lead pollution as much as six times background, well above any previous extreme since the year zero.\u003c/p>\n\u003cp>As tin faded, copper and nickel mining kept lead levels well above background in the Illimani ice record. But lead pollution rose three times over even these unprecedented levels when lead was deliberately added to gasoline, peaking in the 1960s and finally ending in the early 2000s. Excess lead is recorded in the Greenland and Antarctic ice caps too.\u003c/p>\n\u003cp>You could argue that mining of tin, copper and nickel helps civilization far more than the harm it may cause from lead emissions. But how did we come to think it was a good idea to spray poisonous lead out of every tailpipe in the world?\u003c/p>\n\u003cp>\u003ca href=\"http://www.environmentalhistory.org/billkovarik/about-bk/research/henry-ford-charles-kettering-and-the-fuel-of-the-future/\">A meticulous history of leaded fuel\u003c/a> by Professor Bill Kovarik, of Unity College, shows that in a pitched battle between American oil drillers and grain farmers in the 1920s, tetra-ethyl lead (“ethyl”) was a key weapon. Gasoline engines were prone to “knock” and the fuel supply came increasingly from foreign oil wells. Ethanol had domestic sources and was immune to knock. But ethyl enabled gasoline engines to avoid knock, if you didn’t mind putting toxic lead in the exhaust.\u003c/p>\n\u003cp>Kovaric shows that major actors like General Motors and the American Petroleum Institute won the day in the lobbies of Congress and federal agencies. Under attack from lobbyists and Congress, agencies suppressed scientific research on ethyl’s toxicity and ethanol’s performance. The contest between gasoline and ethanol was not a fair one. “In essence,” Kovarik concluded, “political conditions shaped the marketplace and the new competition [ethanol] faced a difficult economic playing field heavily tilted toward established industries.”\u003c/p>\n\u003cp>Ethanol lost out to oil in the 1930s. Today it’s mounting a comeback aided by a new political factor, greenhouse gas emissions. \u003ca href=\"http://pubs.acs.org/doi/abs/10.1021/es5052588\">A recent study in the journal \u003ci>Environmental Science and Technology\u003c/i>\u003c/a> compared three ethanol-producing crops—cornstalks, switchgrass and \u003ca href=\"http://www.extension.org/pages/26625/miscanthus-miscanthus-x-giganteus-for-biofuel-production\">a hybrid form of miscanthus grass\u003c/a>—and found that miscanthus, a relative of sugarcane, offers as much as three times the climate benefit of corn. This kind of analysis can influence climate policy—but only if it can win a place at the policymaking table.\u003c/p>\n\u003cp>\u003c/p>\n\u003cp>The battle for the transportation fuel market goes on. Ethanol remains handicapped by eight decades of opposition, but at least toxic lead is out of the picture.\u003c/p>\n\n\u003c/div>\u003c/p>",
"attributes": {
"named": {},
"numeric": []
}
}
],
"link": "/science/28104/south-american-peaks-contain-2000-year-record-of-lead-in-the-air",
"authors": [
"6228"
],
"categories": [
"science_31",
"science_38"
],
"tags": [
"science_452",
"science_819"
],
"featImg": "science_28105",
"label": "science"
},
"science_27911": {
"type": "posts",
"id": "science_27911",
"meta": {
"index": "posts_1716263798",
"site": "science",
"id": "27911",
"score": null,
"sort": [
1425906057000
]
},
"parent": 0,
"labelTerm": {
"site": "science"
},
"blocks": [],
"publishDate": 1425906057,
"format": "aside",
"title": "Ancient Sinkhole Could Presage Mega-Tsunami for Hawaii",
"headTitle": "Ancient Sinkhole Could Presage Mega-Tsunami for Hawaii | KQED",
"content": "\u003cdiv class=\"audio-wrap\">\n\u003ch2>Listen:\u003c/h2>\n\u003cp>http://www.kqed.org/.stream/anon/radio/science/2015/03/20150309TsunamiCave.mp3\u003c/p>\n\u003c/div>\n\u003cfigure id=\"attachment_27931\" class=\"wp-caption alignleft\" style=\"max-width: 1024px\">\u003ca href=\"http://ww2.kqed.org/science/wp-content/uploads/sites/35/2015/03/Makauwahi_2344-e1425689804216-1024x576.jpg\">\u003cimg loading=\"lazy\" decoding=\"async\" class=\"size-large wp-image-27931\" src=\"http://ww2.kqed.org/science/wp-content/uploads/sites/35/2015/03/Makauwahi_2344-e1425689804216-1024x576.jpg\" alt=\"Makauwahi sinkhole, seen from the caves on the south side. (Craig Miller/KQED)\" width=\"1024\" height=\"576\">\u003c/a>\u003cfigcaption class=\"wp-caption-text\">The Makauwahi sinkhole on Kauai, as seen from the caves on the south side of this hidden bowl. (Craig Miller/KQED)\u003c/figcaption>\u003c/figure>\n\u003cp>Four years ago this week, an earthquake off the Japan coast unleashed a wall of water that devastated coastal cities there — and caused more than $50 million in damages along the California coast from Santa Cruz \u003ca title=\"Q - CW - post\" href=\"http://blogs.kqed.org/climatewatch/2011/03/13/crescent-city-its-a-mess-all-right/\">to Crescent City\u003c/a>.\u003c/p>\n\u003cp>The \u003ca title=\"LiveSci - Tohoku\" href=\"http://www.livescience.com/39110-japan-2011-earthquake-tsunami-facts.html\">Tohoku Earthquake and its aftermath\u003c/a> are a reminder that the threat of tsunamis is always with us.\u003c/p>\n\u003cp>Especially vulnerable is the \u003ca title=\"NOAA - PTWC\" href=\"http://ptwc.weather.gov/ptwc/?region=2\">state of Hawaii\u003c/a>, where scientists have been calculating just how big that threat might be, using evidence that could’ve gone completely unnoticed.\u003c/p>\n\u003cp>\u003ca href=\"http://ww2.kqed.org/science/wp-content/uploads/sites/35/2015/03/Tsunimi-Map.jpg\">\u003cimg loading=\"lazy\" decoding=\"async\" class=\"alignright wp-image-27965\" src=\"http://ww2.kqed.org/science/wp-content/uploads/sites/35/2015/03/Tsunimi-Map-593x1024.jpg\" alt=\"Print\" width=\"204\" height=\"352\">\u003c/a>Hidden away on the south shore of Kauai, Hawaii’s geologically oldest island, is \u003ca title=\"Makauwahi - main\" href=\"http://cavereserve.org/\">Makauwahi sinkhole\u003c/a>, a small wonder amid the dense coastal vegetation. It also contains buried treasure for scientists who study \u003ca title=\"Ready.gov - tsunamis\" href=\"http://www.ready.gov/tsunamis\">Pacific tsunamis\u003c/a>.\u003c/p>\n\u003cp>“It’s just a massive old sand dune that has — scientists will say ‘lithified’ — it’s become rock,” explains Chris Landreau, an archaeologist who’s worked on digs at the sinkhole. Emerging through a small cave on the north side of the bowl, it presents as its own tiny world, open to the sky, surrounded by sheer walls. Palm trees sprout from the floor of the crater.\u003c/p>\n\u003cp>[ad fullwidth]\u003c/p>\n\u003cp>When biologists entered this world in the 1990s, they soon realized that it was \u003ca title=\"Honolulu Ad - post\" href=\"http://the.honoluluadvertiser.com/article/2005/Sep/28/ln/FP509280357.html\">an open time capsule\u003c/a> for unmasking the island’s biologic and geologic history.\u003c/p>\n\u003cp>Paleoecologists starting digging down, sifting from the layers of sediments the comings and goings of plants and animals through time.\u003c/p>\n\u003cp>\u003cstrong>Seismic Paydirt\u003c/strong>\u003c/p>\n\u003cp>“The idea is to identify those things that are extinct,” Landreau says, “and to identify those things that we can still find somewhere locally, and try to revive them.”\u003c/p>\n\u003cp>That was the idea. But as they were digging, they struck seismic paydirt: a layer about a yard thick that clearly didn’t belong there. What was there — basalt cobbles, corals, shells and other ocean debris — eventually caught the eye of a geophysicist at the University of Hawaii named, yes, \u003ca title=\"U of HI - Butler\" href=\"http://www.higp.hawaii.edu/cgi-bin/higp/directory.cgi?func=disp&searchname=RhettButler\">Rhett Butler\u003c/a> (not to be confused with \u003ca title=\"Wiki - post\" href=\"http://en.wikipedia.org/wiki/Rhett_Butler\">this Rhett Butler\u003c/a>). He noticed that this was obviously stuff that came from the ocean, not the residue of plants and animals that would’ve lived on the island. And there was a lot of it.\u003c/p>\n\u003cp>\u003ca href=\"http://ww2.kqed.org/science/wp-content/uploads/sites/35/2015/03/Tsunami-cave-layers.png\">\u003cimg loading=\"lazy\" decoding=\"async\" class=\"aligncenter size-large wp-image-27969\" src=\"http://ww2.kqed.org/science/wp-content/uploads/sites/35/2015/03/Tsunami-cave-layers-1024x547.png\" alt=\"Tsunami cave layers\" width=\"1024\" height=\"547\">\u003c/a>“It’s a huge volume,” Butler says. He calculates about 600 cubic yards, or enough debris to fill nine ocean containers, the kind you see stacked up on cargo ships.\u003c/p>\n\u003cp>“It takes a heck of a lot to move that much material, move it from the beach, move it up the hill,” reasons Butler. “So the most likely scenario, quite frankly, is that it’s a tsunami.”\u003c/p>\n\u003cp>It would have to have been huge — big enough to hurl 200-pound boulders into a hole that’s two to three stories above sea level and set back from the shoreline about the length of a football field. Butler reckons that it hit Kauai sometime between 350 and 575 years ago.\u003c/p>\n\u003caside class=\"pullquote alignleft\">‘We only have, literally, 4 ½ hours. Imagine you snap your fingers and 4 ½ hours later, there’s a wave coming on shore that’s massive.’\u003ccite>— Rhett Butler,\u003cbr>\nUniversity of Hawaii Geophysicist\u003c/cite>\u003c/aside>\n\u003cp>Butler \u003ca title=\"GRL - Butler\" href=\"http://onlinelibrary.wiley.com/doi/10.1002/2014GL061232/epdf\">began using computer models\u003c/a> to trace such a tsunami back to its probable origins. That led him to a seismically active zone nearly 2,000 miles north, in the eastern Aleutian Islands, off Alaska.\u003c/p>\n\u003cp>“And the shape of the subduction zone,” he notes, “in other words where the Pacific and North America converge together — if you look at that geometry, it basically focuses energy directly toward Hawaii.”\u003c/p>\n\u003cp>His modeling work points to a quake bigger than magnitude-9 — that’s 100 times more powerful than San Francisco’s Big One in 1906, or at least as powerful as the 2011 Tohoku event that savaged coastal Japan.\u003c/p>\n\u003cp>“It’s a similar sized event to Tohoku, maybe slightly bigger,” Butler estimates.\u003c/p>\n\u003cp>In fact, he thinks it might’ve been the Pacific’s biggest quake in the past 7,000 years. At the rate that tectonic plates near the Aleutians have been moving since the Kauai tsunami, he calculates that the region is capable of producing a similar quake, at any time.\u003c/p>\n\u003cfigure id=\"attachment_27932\" class=\"wp-caption alignleft\" style=\"max-width: 334px\">\u003ca href=\"http://ww2.kqed.org/science/wp-content/uploads/sites/35/2015/03/Makauwahi_2355-1024x768.jpg\">\u003cimg loading=\"lazy\" decoding=\"async\" class=\"wp-image-27932\" src=\"http://ww2.kqed.org/science/wp-content/uploads/sites/35/2015/03/Makauwahi_2355-1024x768.jpg\" alt=\"Makauwahi_2355\" width=\"334\" height=\"251\">\u003c/a>\u003cfigcaption class=\"wp-caption-text\">Archaeologist Chris Landreau points out some of the tsunami deposits at the edge of caves on the south side of the sinkhole. (Craig Miller/KQED)\u003c/figcaption>\u003c/figure>\n\u003cp>“Once you start modeling it and looking at the possibilities,” Butler says, “you realize it’s not unreasonable that we could get a magnitude-9 in the worst possible spot that would make all the other events look rather small in comparison.”\u003c/p>\n\u003cp>While a tsunami of that size 500 years ago would have been devastating to Hawaii’s primitive coastal culture, today civil defense authorities estimate that 370,000 people and $40 billion worth of infrastructure stand in harm’s way in the islands’ existing tsunami zones.\u003c/p>\n\u003cp>“For California, a tsunami is a nasty event but it happens within a mile of the coast,” Butler says. “The rest of the state is not affected. One of these things in Hawaii devastates the whole state.”\u003c/p>\n\u003cp>Partly as a result of Butler’s work, Hawaii officials are in the process of \u003ca title=\"HI tsunami maps\" href=\"http://tsunami.csc.noaa.gov/map.html?mapname=KAUA_I-POIPU&submit1=Search+Island+Area\">redrawing tsunami maps\u003c/a> to take into account the possibility of something much bigger than is in the historical record.\u003c/p>\n\u003cp>“Basically letting the people know where the safe zone is, which is the essence of the whole thing,” he says. “It’s to save people’s lives.”\u003c/p>\n\u003cfigure id=\"attachment_27977\" class=\"wp-caption alignright\" style=\"max-width: 390px\">\u003ca href=\"http://ww2.kqed.org/science/wp-content/uploads/sites/35/2015/03/Tsunami-Cave-Simulation-ft-1024x889.jpg\">\u003cimg loading=\"lazy\" decoding=\"async\" class=\" wp-image-27977\" src=\"http://ww2.kqed.org/science/wp-content/uploads/sites/35/2015/03/Tsunami-Cave-Simulation-ft-1024x889.jpg\" alt=\"Computer modeling shows how an earthquake in the eastern Aleutians would focus tsunami energy toward Hawaii. The green band above Kauai, in particular, shows how the contours of the ocean floor focus even more of the energy directly on the state¹s northernmost island. Actual wave heights at landfall could be greater than colors indicate.\" width=\"390\" height=\"340\">\u003c/a>\u003cfigcaption class=\"wp-caption-text\">Computer modeling shows how an earthquake in the eastern Aleutian Islands would focus tsunami energy toward Hawaii. The green band above Kauai, in particular, shows how the contours of the ocean floor focus even more of the energy directly on the state’s northernmost island. Actual wave heights at landfall could be greater than colors indicate.\u003c/figcaption>\u003c/figure>\n\u003cp>\u003cstrong>Technology to the Rescue?\u003c/strong>\u003c/p>\n\u003cp>A lot of progress has been made toward that end in the last 10 years or so. \u003ca title=\"NOAA - DART\" href=\"http://www.ndbc.noaa.gov/dart.shtml\">A network of ocean buoys\u003c/a> and other sensors keep watch for tsunamis. The U.S. maintains 39 buoys and other nations have added about 20 more to the network, known as \u003ca href=\"http://www.ndbc.noaa.gov/dart/dart.shtml\">DART\u003c/a>. But keeping them working in harsh ocean environments is a challenge. And currently about a quarter of the U.S. network is out of service.\u003c/p>\n\u003cp>Butler has suggested adding two more buoys to the Aleutian chain. \u003ca href=\"http://nctr.pmel.noaa.gov/tsu400/faculty/whitmore.html\">Paul Whitmore\u003c/a>, who directs the \u003ca title=\"NOAA - NTWC AK\" href=\"http://wcatwc.arh.noaa.gov/\">National Tsunami Warning Center\u003c/a> in Palmer, Alaska, says there are no plans to do so, citing the costs involved. Butler has also suggested adding sensors to transoceanic cables that traverse the north Pacific. Whitmore says while officials have talked about that “for years,” deployment costs have been a barrier.\u003c/p>\n\u003cp>Meanwhile, Butler says were a similar event to happen today, “We only have, literally, 4 ½ hours. Imagine you snap your fingers and 4 ½ hours later, there’s a wave coming on shore that’s massive. So we’re very concerned about improving tsunami warning capabilities.”\u003c/p>\n\u003cp>Butler is seeking funding from the \u003ca href=\"http://www.fema.gov/\">Federal Emergency Management Agency\u003c/a> to search for other sites in the islands that would tell us more about this and other tsunamis in the distant past that might portend future events. Right now, Makauwahi sinkhole is the only evidence found of the mega-tsunami of 500 years ago.\u003c/p>\n\u003cp>[ad floatright]\u003c/p>\n\u003cp>By comparison, Butler muses that one small town in Oregon — Seaside — has “over 300 paleotsunami measurements of a former Cascadia event, whereas in all of the Hawaiian islands, we have precisely one.”\u003c/p>\n\n",
"stats": {
"hasVideo": false,
"hasChartOrMap": false,
"hasAudio": true,
"hasPolis": false,
"wordCount": 1342,
"hasGoogleForm": false,
"hasGallery": false,
"hasHearkenModule": false,
"iframeSrcs": [],
"paragraphCount": 31
},
"modified": 1704932177,
"excerpt": "There's buried treasure here for tsunami hunters, but scarce funding may mean Hawaii remains vulnerable.",
"headData": {
"twImgId": "",
"twTitle": "",
"ogTitle": "",
"ogImgId": "",
"twDescription": "",
"description": "There's buried treasure here for tsunami hunters, but scarce funding may mean Hawaii remains vulnerable.",
"title": "Ancient Sinkhole Could Presage Mega-Tsunami for Hawaii | KQED",
"ogDescription": "",
"schema": {
"@context": "https://schema.org",
"@type": "Article",
"headline": "Ancient Sinkhole Could Presage Mega-Tsunami for Hawaii",
"datePublished": "2015-03-09T06:00:57-07:00",
"dateModified": "2024-01-10T16:16:17-08:00",
"image": "https://cdn.kqed.org/wp-content/uploads/2020/02/KQED-OG-Image@1x.png"
}
},
"guestAuthors": [],
"slug": "ancient-sinkhole-could-presage-mega-tsunami-for-hawaii",
"status": "publish",
"audioUrl": "http://www.kqed.org/.stream/anon/radio/science/2015/03/20150309TsunamiCave.mp3",
"sticky": false,
"path": "/science/27911/ancient-sinkhole-could-presage-mega-tsunami-for-hawaii",
"audioTrackLength": null,
"parsedContent": [
{
"type": "contentString",
"content": "\u003cdiv class=\"post-body\">\u003cp>\u003cdiv class=\"audio-wrap\">\n\u003ch2>Listen:\u003c/h2>\u003c/p>\u003c/div>",
"attributes": {
"named": {},
"numeric": []
}
},
{
"type": "component",
"content": "",
"name": "audioLink",
"attributes": {
"named": {
"src": "http://www.kqed.org/.stream/anon/radio/science/2015/03/20150309TsunamiCave.mp3"
},
"numeric": []
}
},
{
"type": "contentString",
"content": "\u003cdiv class=\"post-body\">\u003cp>\u003c/div>\n\u003cfigure id=\"attachment_27931\" class=\"wp-caption alignleft\" style=\"max-width: 1024px\">\u003ca href=\"http://ww2.kqed.org/science/wp-content/uploads/sites/35/2015/03/Makauwahi_2344-e1425689804216-1024x576.jpg\">\u003cimg loading=\"lazy\" decoding=\"async\" class=\"size-large wp-image-27931\" src=\"http://ww2.kqed.org/science/wp-content/uploads/sites/35/2015/03/Makauwahi_2344-e1425689804216-1024x576.jpg\" alt=\"Makauwahi sinkhole, seen from the caves on the south side. (Craig Miller/KQED)\" width=\"1024\" height=\"576\">\u003c/a>\u003cfigcaption class=\"wp-caption-text\">The Makauwahi sinkhole on Kauai, as seen from the caves on the south side of this hidden bowl. (Craig Miller/KQED)\u003c/figcaption>\u003c/figure>\n\u003cp>Four years ago this week, an earthquake off the Japan coast unleashed a wall of water that devastated coastal cities there — and caused more than $50 million in damages along the California coast from Santa Cruz \u003ca title=\"Q - CW - post\" href=\"http://blogs.kqed.org/climatewatch/2011/03/13/crescent-city-its-a-mess-all-right/\">to Crescent City\u003c/a>.\u003c/p>\n\u003cp>The \u003ca title=\"LiveSci - Tohoku\" href=\"http://www.livescience.com/39110-japan-2011-earthquake-tsunami-facts.html\">Tohoku Earthquake and its aftermath\u003c/a> are a reminder that the threat of tsunamis is always with us.\u003c/p>\n\u003cp>Especially vulnerable is the \u003ca title=\"NOAA - PTWC\" href=\"http://ptwc.weather.gov/ptwc/?region=2\">state of Hawaii\u003c/a>, where scientists have been calculating just how big that threat might be, using evidence that could’ve gone completely unnoticed.\u003c/p>\n\u003cp>\u003ca href=\"http://ww2.kqed.org/science/wp-content/uploads/sites/35/2015/03/Tsunimi-Map.jpg\">\u003cimg loading=\"lazy\" decoding=\"async\" class=\"alignright wp-image-27965\" src=\"http://ww2.kqed.org/science/wp-content/uploads/sites/35/2015/03/Tsunimi-Map-593x1024.jpg\" alt=\"Print\" width=\"204\" height=\"352\">\u003c/a>Hidden away on the south shore of Kauai, Hawaii’s geologically oldest island, is \u003ca title=\"Makauwahi - main\" href=\"http://cavereserve.org/\">Makauwahi sinkhole\u003c/a>, a small wonder amid the dense coastal vegetation. It also contains buried treasure for scientists who study \u003ca title=\"Ready.gov - tsunamis\" href=\"http://www.ready.gov/tsunamis\">Pacific tsunamis\u003c/a>.\u003c/p>\n\u003cp>“It’s just a massive old sand dune that has — scientists will say ‘lithified’ — it’s become rock,” explains Chris Landreau, an archaeologist who’s worked on digs at the sinkhole. Emerging through a small cave on the north side of the bowl, it presents as its own tiny world, open to the sky, surrounded by sheer walls. Palm trees sprout from the floor of the crater.\u003c/p>\n\u003cp>\u003c/p>\u003c/div>",
"attributes": {
"named": {},
"numeric": []
}
},
{
"type": "component",
"content": "",
"name": "ad",
"attributes": {
"named": {
"label": "fullwidth"
},
"numeric": [
"fullwidth"
]
}
},
{
"type": "contentString",
"content": "\u003cdiv class=\"post-body\">\u003cp>\u003c/p>\n\u003cp>When biologists entered this world in the 1990s, they soon realized that it was \u003ca title=\"Honolulu Ad - post\" href=\"http://the.honoluluadvertiser.com/article/2005/Sep/28/ln/FP509280357.html\">an open time capsule\u003c/a> for unmasking the island’s biologic and geologic history.\u003c/p>\n\u003cp>Paleoecologists starting digging down, sifting from the layers of sediments the comings and goings of plants and animals through time.\u003c/p>\n\u003cp>\u003cstrong>Seismic Paydirt\u003c/strong>\u003c/p>\n\u003cp>“The idea is to identify those things that are extinct,” Landreau says, “and to identify those things that we can still find somewhere locally, and try to revive them.”\u003c/p>\n\u003cp>That was the idea. But as they were digging, they struck seismic paydirt: a layer about a yard thick that clearly didn’t belong there. What was there — basalt cobbles, corals, shells and other ocean debris — eventually caught the eye of a geophysicist at the University of Hawaii named, yes, \u003ca title=\"U of HI - Butler\" href=\"http://www.higp.hawaii.edu/cgi-bin/higp/directory.cgi?func=disp&searchname=RhettButler\">Rhett Butler\u003c/a> (not to be confused with \u003ca title=\"Wiki - post\" href=\"http://en.wikipedia.org/wiki/Rhett_Butler\">this Rhett Butler\u003c/a>). He noticed that this was obviously stuff that came from the ocean, not the residue of plants and animals that would’ve lived on the island. And there was a lot of it.\u003c/p>\n\u003cp>\u003ca href=\"http://ww2.kqed.org/science/wp-content/uploads/sites/35/2015/03/Tsunami-cave-layers.png\">\u003cimg loading=\"lazy\" decoding=\"async\" class=\"aligncenter size-large wp-image-27969\" src=\"http://ww2.kqed.org/science/wp-content/uploads/sites/35/2015/03/Tsunami-cave-layers-1024x547.png\" alt=\"Tsunami cave layers\" width=\"1024\" height=\"547\">\u003c/a>“It’s a huge volume,” Butler says. He calculates about 600 cubic yards, or enough debris to fill nine ocean containers, the kind you see stacked up on cargo ships.\u003c/p>\n\u003cp>“It takes a heck of a lot to move that much material, move it from the beach, move it up the hill,” reasons Butler. “So the most likely scenario, quite frankly, is that it’s a tsunami.”\u003c/p>\n\u003cp>It would have to have been huge — big enough to hurl 200-pound boulders into a hole that’s two to three stories above sea level and set back from the shoreline about the length of a football field. Butler reckons that it hit Kauai sometime between 350 and 575 years ago.\u003c/p>\n\u003caside class=\"pullquote alignleft\">‘We only have, literally, 4 ½ hours. Imagine you snap your fingers and 4 ½ hours later, there’s a wave coming on shore that’s massive.’\u003ccite>— Rhett Butler,\u003cbr>\nUniversity of Hawaii Geophysicist\u003c/cite>\u003c/aside>\n\u003cp>Butler \u003ca title=\"GRL - Butler\" href=\"http://onlinelibrary.wiley.com/doi/10.1002/2014GL061232/epdf\">began using computer models\u003c/a> to trace such a tsunami back to its probable origins. That led him to a seismically active zone nearly 2,000 miles north, in the eastern Aleutian Islands, off Alaska.\u003c/p>\n\u003cp>“And the shape of the subduction zone,” he notes, “in other words where the Pacific and North America converge together — if you look at that geometry, it basically focuses energy directly toward Hawaii.”\u003c/p>\n\u003cp>His modeling work points to a quake bigger than magnitude-9 — that’s 100 times more powerful than San Francisco’s Big One in 1906, or at least as powerful as the 2011 Tohoku event that savaged coastal Japan.\u003c/p>\n\u003cp>“It’s a similar sized event to Tohoku, maybe slightly bigger,” Butler estimates.\u003c/p>\n\u003cp>In fact, he thinks it might’ve been the Pacific’s biggest quake in the past 7,000 years. At the rate that tectonic plates near the Aleutians have been moving since the Kauai tsunami, he calculates that the region is capable of producing a similar quake, at any time.\u003c/p>\n\u003cfigure id=\"attachment_27932\" class=\"wp-caption alignleft\" style=\"max-width: 334px\">\u003ca href=\"http://ww2.kqed.org/science/wp-content/uploads/sites/35/2015/03/Makauwahi_2355-1024x768.jpg\">\u003cimg loading=\"lazy\" decoding=\"async\" class=\"wp-image-27932\" src=\"http://ww2.kqed.org/science/wp-content/uploads/sites/35/2015/03/Makauwahi_2355-1024x768.jpg\" alt=\"Makauwahi_2355\" width=\"334\" height=\"251\">\u003c/a>\u003cfigcaption class=\"wp-caption-text\">Archaeologist Chris Landreau points out some of the tsunami deposits at the edge of caves on the south side of the sinkhole. (Craig Miller/KQED)\u003c/figcaption>\u003c/figure>\n\u003cp>“Once you start modeling it and looking at the possibilities,” Butler says, “you realize it’s not unreasonable that we could get a magnitude-9 in the worst possible spot that would make all the other events look rather small in comparison.”\u003c/p>\n\u003cp>While a tsunami of that size 500 years ago would have been devastating to Hawaii’s primitive coastal culture, today civil defense authorities estimate that 370,000 people and $40 billion worth of infrastructure stand in harm’s way in the islands’ existing tsunami zones.\u003c/p>\n\u003cp>“For California, a tsunami is a nasty event but it happens within a mile of the coast,” Butler says. “The rest of the state is not affected. One of these things in Hawaii devastates the whole state.”\u003c/p>\n\u003cp>Partly as a result of Butler’s work, Hawaii officials are in the process of \u003ca title=\"HI tsunami maps\" href=\"http://tsunami.csc.noaa.gov/map.html?mapname=KAUA_I-POIPU&submit1=Search+Island+Area\">redrawing tsunami maps\u003c/a> to take into account the possibility of something much bigger than is in the historical record.\u003c/p>\n\u003cp>“Basically letting the people know where the safe zone is, which is the essence of the whole thing,” he says. “It’s to save people’s lives.”\u003c/p>\n\u003cfigure id=\"attachment_27977\" class=\"wp-caption alignright\" style=\"max-width: 390px\">\u003ca href=\"http://ww2.kqed.org/science/wp-content/uploads/sites/35/2015/03/Tsunami-Cave-Simulation-ft-1024x889.jpg\">\u003cimg loading=\"lazy\" decoding=\"async\" class=\" wp-image-27977\" src=\"http://ww2.kqed.org/science/wp-content/uploads/sites/35/2015/03/Tsunami-Cave-Simulation-ft-1024x889.jpg\" alt=\"Computer modeling shows how an earthquake in the eastern Aleutians would focus tsunami energy toward Hawaii. The green band above Kauai, in particular, shows how the contours of the ocean floor focus even more of the energy directly on the state¹s northernmost island. Actual wave heights at landfall could be greater than colors indicate.\" width=\"390\" height=\"340\">\u003c/a>\u003cfigcaption class=\"wp-caption-text\">Computer modeling shows how an earthquake in the eastern Aleutian Islands would focus tsunami energy toward Hawaii. The green band above Kauai, in particular, shows how the contours of the ocean floor focus even more of the energy directly on the state’s northernmost island. Actual wave heights at landfall could be greater than colors indicate.\u003c/figcaption>\u003c/figure>\n\u003cp>\u003cstrong>Technology to the Rescue?\u003c/strong>\u003c/p>\n\u003cp>A lot of progress has been made toward that end in the last 10 years or so. \u003ca title=\"NOAA - DART\" href=\"http://www.ndbc.noaa.gov/dart.shtml\">A network of ocean buoys\u003c/a> and other sensors keep watch for tsunamis. The U.S. maintains 39 buoys and other nations have added about 20 more to the network, known as \u003ca href=\"http://www.ndbc.noaa.gov/dart/dart.shtml\">DART\u003c/a>. But keeping them working in harsh ocean environments is a challenge. And currently about a quarter of the U.S. network is out of service.\u003c/p>\n\u003cp>Butler has suggested adding two more buoys to the Aleutian chain. \u003ca href=\"http://nctr.pmel.noaa.gov/tsu400/faculty/whitmore.html\">Paul Whitmore\u003c/a>, who directs the \u003ca title=\"NOAA - NTWC AK\" href=\"http://wcatwc.arh.noaa.gov/\">National Tsunami Warning Center\u003c/a> in Palmer, Alaska, says there are no plans to do so, citing the costs involved. Butler has also suggested adding sensors to transoceanic cables that traverse the north Pacific. Whitmore says while officials have talked about that “for years,” deployment costs have been a barrier.\u003c/p>\n\u003cp>Meanwhile, Butler says were a similar event to happen today, “We only have, literally, 4 ½ hours. Imagine you snap your fingers and 4 ½ hours later, there’s a wave coming on shore that’s massive. So we’re very concerned about improving tsunami warning capabilities.”\u003c/p>\n\u003cp>Butler is seeking funding from the \u003ca href=\"http://www.fema.gov/\">Federal Emergency Management Agency\u003c/a> to search for other sites in the islands that would tell us more about this and other tsunamis in the distant past that might portend future events. Right now, Makauwahi sinkhole is the only evidence found of the mega-tsunami of 500 years ago.\u003c/p>\n\u003cp>\u003c/p>\u003c/div>",
"attributes": {
"named": {},
"numeric": []
}
},
{
"type": "component",
"content": "",
"name": "ad",
"attributes": {
"named": {
"label": "floatright"
},
"numeric": [
"floatright"
]
}
},
{
"type": "contentString",
"content": "\u003cdiv class=\"post-body\">\u003cp>\u003c/p>\n\u003cp>By comparison, Butler muses that one small town in Oregon — Seaside — has “over 300 paleotsunami measurements of a former Cascadia event, whereas in all of the Hawaiian islands, we have precisely one.”\u003c/p>\n\n\u003c/div>\u003c/p>",
"attributes": {
"named": {},
"numeric": []
}
}
],
"link": "/science/27911/ancient-sinkhole-could-presage-mega-tsunami-for-hawaii",
"authors": [
"221"
],
"categories": [
"science_46",
"science_38",
"science_40",
"science_43"
],
"tags": [
"science_64",
"science_258"
],
"featImg": "science_27931",
"label": "science"
}
},
"podcastsReducer": {
"isFetching": false,
"fetchFailed": false,
"hasFetched": false,
"podcasts": {}
},
"radioProgramsReducer": {
"isFetching": false,
"fetchFailed": false,
"hasFetched": false,
"radioPrograms": {}
},
"radioSearchSegmentsReducer": {},
"programsReducer": {
"all-things-considered": {
"id": "all-things-considered",
"title": "All Things Considered",
"info": "Every weekday, \u003cem>All Things Considered\u003c/em> hosts Robert Siegel, Audie Cornish, Ari Shapiro, and Kelly McEvers present the program's trademark mix of news, interviews, commentaries, reviews, and offbeat features. Michel Martin hosts on the weekends.",
"airtime": "MON-FRI 1pm-2pm, 4:30pm-6:30pm\u003cbr />SAT-SUN 5pm-6pm",
"imageSrc": "https://cdn.kqed.org/wp-content/uploads/2024/04/All-Things-Considered-Podcast-Tile-360x360-1.jpg",
"officialWebsiteLink": "https://www.npr.org/programs/all-things-considered/",
"meta": {
"site": "news",
"source": "npr"
},
"link": "/radio/program/all-things-considered"
},
"american-suburb-podcast": {
"id": "american-suburb-podcast",
"title": "American Suburb: The Podcast",
"tagline": "The flip side of gentrification, told through one town",
"info": "Gentrification is changing cities across America, forcing people from neighborhoods they have long called home. Call them the displaced. Now those priced out of the Bay Area are looking for a better life in an unlikely place. American Suburb follows this migration to one California town along the Delta, 45 miles from San Francisco. But is this once sleepy suburb ready for them?",
"imageSrc": "https://cdn.kqed.org/wp-content/uploads/2024/04/American-Suburb-Podcast-Tile-703x703-1.jpg",
"officialWebsiteLink": "/news/series/american-suburb-podcast",
"meta": {
"site": "news",
"source": "kqed",
"order": 19
},
"link": "/news/series/american-suburb-podcast/",
"subscribe": {
"npr": "https://rpb3r.app.goo.gl/RBrW",
"apple": "https://itunes.apple.com/WebObjects/MZStore.woa/wa/viewPodcast?mt=2&id=1287748328",
"tuneIn": "https://tunein.com/radio/American-Suburb-p1086805/",
"rss": "https://ww2.kqed.org/news/series/american-suburb-podcast/feed/podcast",
"google": "https://podcasts.google.com/feed/aHR0cHM6Ly9mZWVkcy5tZWdhcGhvbmUuZm0vS1FJTkMzMDExODgxNjA5"
}
},
"baycurious": {
"id": "baycurious",
"title": "Bay Curious",
"tagline": "Exploring the Bay Area, one question at a time",
"info": "KQED’s new podcast, Bay Curious, gets to the bottom of the mysteries — both profound and peculiar — that give the Bay Area its unique identity. And we’ll do it with your help! You ask the questions. You decide what Bay Curious investigates. And you join us on the journey to find the answers.",
"imageSrc": "https://cdn.kqed.org/wp-content/uploads/2024/04/Bay-Curious-Podcast-Tile-703x703-1.jpg",
"imageAlt": "KQED Bay Curious",
"officialWebsiteLink": "/news/series/baycurious",
"meta": {
"site": "news",
"source": "kqed",
"order": 3
},
"link": "/podcasts/baycurious",
"subscribe": {
"apple": "https://podcasts.apple.com/us/podcast/bay-curious/id1172473406",
"npr": "https://www.npr.org/podcasts/500557090/bay-curious",
"rss": "https://ww2.kqed.org/news/category/bay-curious-podcast/feed/podcast",
"amazon": "https://music.amazon.com/podcasts/9a90d476-aa04-455d-9a4c-0871ed6216d4/bay-curious",
"stitcher": "https://www.stitcher.com/podcast/kqed/bay-curious",
"spotify": "https://open.spotify.com/show/6O76IdmhixfijmhTZLIJ8k"
}
},
"bbc-world-service": {
"id": "bbc-world-service",
"title": "BBC World Service",
"info": "The day's top stories from BBC News compiled twice daily in the week, once at weekends.",
"airtime": "MON-FRI 9pm-10pm, TUE-FRI 1am-2am",
"imageSrc": "https://cdn.kqed.org/wp-content/uploads/2024/04/BBC-World-Service-Podcast-Tile-360x360-1.jpg",
"officialWebsiteLink": "https://www.bbc.co.uk/sounds/play/live:bbc_world_service",
"meta": {
"site": "news",
"source": "BBC World Service"
},
"link": "/radio/program/bbc-world-service",
"subscribe": {
"apple": "https://itunes.apple.com/us/podcast/global-news-podcast/id135067274?mt=2",
"tuneIn": "https://tunein.com/radio/BBC-World-Service-p455581/",
"rss": "https://podcasts.files.bbci.co.uk/p02nq0gn.rss"
}
},
"californiareport": {
"id": "californiareport",
"title": "The California Report",
"tagline": "California, day by day",
"info": "KQED’s statewide radio news program providing daily coverage of issues, trends and public policy decisions.",
"imageSrc": "https://cdn.kqed.org/wp-content/uploads/2024/04/The-California-Report-Podcast-Tile-703x703-1.jpg",
"imageAlt": "KQED The California Report",
"officialWebsiteLink": "/californiareport",
"meta": {
"site": "news",
"source": "kqed",
"order": 8
},
"link": "/californiareport",
"subscribe": {
"apple": "https://podcasts.apple.com/us/podcast/kqeds-the-california-report/id79681292",
"amazon": "https://music.amazon.com/podcasts/26099305-72af-4542-9dde-ac1807fe36d5/kqed-s-the-california-report",
"npr": "https://www.npr.org/podcasts/432285393/the-california-report",
"stitcher": "https://www.stitcher.com/podcast/kqedfm-kqeds-the-california-report-podcast-8838",
"rss": "https://ww2.kqed.org/news/tag/tcram/feed/podcast"
}
},
"californiareportmagazine": {
"id": "californiareportmagazine",
"title": "The California Report Magazine",
"tagline": "Your state, your stories",
"info": "Every week, The California Report Magazine takes you on a road trip for the ears: to visit the places and meet the people who make California unique. The in-depth storytelling podcast from the California Report.",
"airtime": "FRI 4:30pm-5pm, 6:30pm-7pm, 11pm-11:30pm",
"imageSrc": "https://cdn.kqed.org/wp-content/uploads/2024/04/The-California-Report-Magazine-Podcast-Tile-703x703-1.jpg",
"imageAlt": "KQED The California Report Magazine",
"officialWebsiteLink": "/californiareportmagazine",
"meta": {
"site": "news",
"source": "kqed",
"order": 10
},
"link": "/californiareportmagazine",
"subscribe": {
"apple": "https://podcasts.apple.com/us/podcast/the-california-report-magazine/id1314750545",
"google": "https://podcasts.google.com/feed/aHR0cHM6Ly9mZWVkcy5tZWdhcGhvbmUuZm0vS1FJTkM3NjkwNjk1OTAz",
"npr": "https://www.npr.org/podcasts/564733126/the-california-report-magazine",
"stitcher": "https://www.stitcher.com/podcast/kqed/the-california-report-magazine",
"rss": "https://ww2.kqed.org/news/tag/tcrmag/feed/podcast"
}
},
"city-arts": {
"id": "city-arts",
"title": "City Arts & Lectures",
"info": "A one-hour radio program to hear celebrated writers, artists and thinkers address contemporary ideas and values, often discussing the creative process. Please note: tapes or transcripts are not available",
"imageSrc": "https://ww2.kqed.org/radio/wp-content/uploads/sites/50/2018/05/cityartsandlecture-300x300.jpg",
"officialWebsiteLink": "https://www.cityarts.net/",
"airtime": "SUN 1pm-2pm, TUE 10pm, WED 1am",
"meta": {
"site": "news",
"source": "City Arts & Lectures"
},
"link": "https://www.cityarts.net",
"subscribe": {
"tuneIn": "https://tunein.com/radio/City-Arts-and-Lectures-p692/",
"rss": "https://www.cityarts.net/feed/"
}
},
"closealltabs": {
"id": "closealltabs",
"title": "Close All Tabs",
"tagline": "Your irreverent guide to the trends redefining our world",
"info": "Close All Tabs breaks down how digital culture shapes our world through thoughtful insights and irreverent humor.",
"imageSrc": "https://cdn.kqed.org/wp-content/uploads/2025/02/CAT_2_Tile-scaled.jpg",
"imageAlt": "KQED Close All Tabs",
"officialWebsiteLink": "/podcasts/closealltabs",
"meta": {
"site": "news",
"source": "kqed",
"order": 1
},
"link": "/podcasts/closealltabs",
"subscribe": {
"apple": "https://podcasts.apple.com/us/podcast/close-all-tabs/id214663465",
"rss": "https://feeds.megaphone.fm/KQINC6993880386",
"amazon": "https://music.amazon.com/podcasts/92d9d4ac-67a3-4eed-b10a-fb45d45b1ef2/close-all-tabs",
"spotify": "https://open.spotify.com/show/6LAJFHnGK1pYXYzv6SIol6?si=deb0cae19813417c"
}
},
"code-switch-life-kit": {
"id": "code-switch-life-kit",
"title": "Code Switch / Life Kit",
"info": "\u003cem>Code Switch\u003c/em>, which listeners will hear in the first part of the hour, has fearless and much-needed conversations about race. Hosted by journalists of color, the show tackles the subject of race head-on, exploring how it impacts every part of society — from politics and pop culture to history, sports and more.\u003cbr />\u003cbr />\u003cem>Life Kit\u003c/em>, which will be in the second part of the hour, guides you through spaces and feelings no one prepares you for — from finances to mental health, from workplace microaggressions to imposter syndrome, from relationships to parenting. The show features experts with real world experience and shares their knowledge. Because everyone needs a little help being human.\u003cbr />\u003cbr />\u003ca href=\"https://www.npr.org/podcasts/510312/codeswitch\">\u003cem>Code Switch\u003c/em> offical site and podcast\u003c/a>\u003cbr />\u003ca href=\"https://www.npr.org/lifekit\">\u003cem>Life Kit\u003c/em> offical site and podcast\u003c/a>\u003cbr />",
"airtime": "SUN 9pm-10pm",
"imageSrc": "https://cdn.kqed.org/wp-content/uploads/2024/04/Code-Switch-Life-Kit-Podcast-Tile-360x360-1.jpg",
"meta": {
"site": "radio",
"source": "npr"
},
"link": "/radio/program/code-switch-life-kit",
"subscribe": {
"apple": "https://podcasts.apple.com/podcast/1112190608?mt=2&at=11l79Y&ct=nprdirectory",
"google": "https://podcasts.google.com/feed/aHR0cHM6Ly93d3cubnByLm9yZy9yc3MvcG9kY2FzdC5waHA_aWQ9NTEwMzEy",
"spotify": "https://open.spotify.com/show/3bExJ9JQpkwNhoHvaIIuyV",
"rss": "https://feeds.npr.org/510312/podcast.xml"
}
},
"commonwealth-club": {
"id": "commonwealth-club",
"title": "Commonwealth Club of California Podcast",
"info": "The Commonwealth Club of California is the nation's oldest and largest public affairs forum. As a non-partisan forum, The Club brings to the public airwaves diverse viewpoints on important topics. The Club's weekly radio broadcast - the oldest in the U.S., dating back to 1924 - is carried across the nation on public radio stations and is now podcasting. Our website archive features audio of our recent programs, as well as selected speeches from our long and distinguished history. This podcast feed is usually updated twice a week and is always un-edited.",
"airtime": "THU 10pm, FRI 1am",
"imageSrc": "https://cdn.kqed.org/wp-content/uploads/2024/04/Commonwealth-Club-Podcast-Tile-360x360-1.jpg",
"officialWebsiteLink": "https://www.commonwealthclub.org/podcasts",
"meta": {
"site": "news",
"source": "Commonwealth Club of California"
},
"link": "/radio/program/commonwealth-club",
"subscribe": {
"apple": "https://itunes.apple.com/us/podcast/commonwealth-club-of-california-podcast/id976334034?mt=2",
"google": "https://podcasts.google.com/feed/aHR0cDovL3d3dy5jb21tb253ZWFsdGhjbHViLm9yZy9hdWRpby9wb2RjYXN0L3dlZWtseS54bWw",
"tuneIn": "https://tunein.com/radio/Commonwealth-Club-of-California-p1060/"
}
},
"forum": {
"id": "forum",
"title": "Forum",
"tagline": "The conversation starts here",
"info": "KQED’s live call-in program discussing local, state, national and international issues, as well as in-depth interviews.",
"airtime": "MON-FRI 9am-11am, 10pm-11pm",
"imageSrc": "https://cdn.kqed.org/wp-content/uploads/2024/04/Forum-Podcast-Tile-703x703-1.jpg",
"imageAlt": "KQED Forum with Mina Kim and Alexis Madrigal",
"officialWebsiteLink": "/forum",
"meta": {
"site": "news",
"source": "kqed",
"order": 9
},
"link": "/forum",
"subscribe": {
"apple": "https://podcasts.apple.com/us/podcast/kqeds-forum/id73329719",
"google": "https://podcasts.google.com/feed/aHR0cHM6Ly9mZWVkcy5tZWdhcGhvbmUuZm0vS1FJTkM5NTU3MzgxNjMz",
"npr": "https://www.npr.org/podcasts/432307980/forum",
"stitcher": "https://www.stitcher.com/podcast/kqedfm-kqeds-forum-podcast",
"rss": "https://feeds.megaphone.fm/KQINC9557381633"
}
},
"freakonomics-radio": {
"id": "freakonomics-radio",
"title": "Freakonomics Radio",
"info": "Freakonomics Radio is a one-hour award-winning podcast and public-radio project hosted by Stephen Dubner, with co-author Steve Levitt as a regular guest. It is produced in partnership with WNYC.",
"imageSrc": "https://ww2.kqed.org/news/wp-content/uploads/sites/10/2018/05/freakonomicsRadio.png",
"officialWebsiteLink": "http://freakonomics.com/",
"airtime": "SUN 1am-2am, SAT 3pm-4pm",
"meta": {
"site": "radio",
"source": "WNYC"
},
"link": "/radio/program/freakonomics-radio",
"subscribe": {
"npr": "https://rpb3r.app.goo.gl/4s8b",
"apple": "https://itunes.apple.com/us/podcast/freakonomics-radio/id354668519",
"tuneIn": "https://tunein.com/podcasts/WNYC-Podcasts/Freakonomics-Radio-p272293/",
"rss": "https://feeds.feedburner.com/freakonomicsradio"
}
},
"fresh-air": {
"id": "fresh-air",
"title": "Fresh Air",
"info": "Hosted by Terry Gross, \u003cem>Fresh Air from WHYY\u003c/em> is the Peabody Award-winning weekday magazine of contemporary arts and issues. One of public radio's most popular programs, Fresh Air features intimate conversations with today's biggest luminaries.",
"airtime": "MON-FRI 7pm-8pm",
"imageSrc": "https://cdn.kqed.org/wp-content/uploads/2024/04/Fresh-Air-Podcast-Tile-360x360-1.jpg",
"officialWebsiteLink": "https://www.npr.org/programs/fresh-air/",
"meta": {
"site": "radio",
"source": "npr"
},
"link": "/radio/program/fresh-air",
"subscribe": {
"npr": "https://rpb3r.app.goo.gl/4s8b",
"apple": "https://itunes.apple.com/WebObjects/MZStore.woa/wa/viewPodcast?s=143441&mt=2&id=214089682&at=11l79Y&ct=nprdirectory",
"tuneIn": "https://tunein.com/radio/Fresh-Air-p17/",
"rss": "https://feeds.npr.org/381444908/podcast.xml"
}
},
"here-and-now": {
"id": "here-and-now",
"title": "Here & Now",
"info": "A live production of NPR and WBUR Boston, in collaboration with stations across the country, Here & Now reflects the fluid world of news as it's happening in the middle of the day, with timely, in-depth news, interviews and conversation. Hosted by Robin Young, Jeremy Hobson and Tonya Mosley.",
"airtime": "MON-THU 11am-12pm",
"imageSrc": "https://cdn.kqed.org/wp-content/uploads/2024/04/Here-And-Now-Podcast-Tile-360x360-1.jpg",
"officialWebsiteLink": "http://www.wbur.org/hereandnow",
"meta": {
"site": "news",
"source": "npr"
},
"link": "/radio/program/here-and-now",
"subsdcribe": {
"apple": "https://itunes.apple.com/WebObjects/MZStore.woa/wa/viewPodcast?mt=2&id=426698661",
"tuneIn": "https://tunein.com/radio/Here--Now-p211/",
"rss": "https://feeds.npr.org/510051/podcast.xml"
}
},
"hidden-brain": {
"id": "hidden-brain",
"title": "Hidden Brain",
"info": "Shankar Vedantam uses science and storytelling to reveal the unconscious patterns that drive human behavior, shape our choices and direct our relationships.",
"imageSrc": "https://ww2.kqed.org/radio/wp-content/uploads/sites/50/2018/05/hiddenbrain.jpg",
"officialWebsiteLink": "https://www.npr.org/series/423302056/hidden-brain",
"airtime": "SUN 7pm-8pm",
"meta": {
"site": "news",
"source": "NPR"
},
"link": "/radio/program/hidden-brain",
"subscribe": {
"apple": "https://itunes.apple.com/us/podcast/hidden-brain/id1028908750?mt=2",
"tuneIn": "https://tunein.com/podcasts/Science-Podcasts/Hidden-Brain-p787503/",
"rss": "https://feeds.npr.org/510308/podcast.xml"
}
},
"how-i-built-this": {
"id": "how-i-built-this",
"title": "How I Built This with Guy Raz",
"info": "Guy Raz dives into the stories behind some of the world's best known companies. How I Built This weaves a narrative journey about innovators, entrepreneurs and idealists—and the movements they built.",
"imageSrc": "https://ww2.kqed.org/news/wp-content/uploads/sites/10/2018/05/howIBuiltThis.png",
"officialWebsiteLink": "https://www.npr.org/podcasts/510313/how-i-built-this",
"airtime": "SUN 7:30pm-8pm",
"meta": {
"site": "news",
"source": "npr"
},
"link": "/radio/program/how-i-built-this",
"subscribe": {
"npr": "https://rpb3r.app.goo.gl/3zxy",
"apple": "https://itunes.apple.com/us/podcast/how-i-built-this-with-guy-raz/id1150510297?mt=2",
"tuneIn": "https://tunein.com/podcasts/Arts--Culture-Podcasts/How-I-Built-This-p910896/",
"rss": "https://feeds.npr.org/510313/podcast.xml"
}
},
"hyphenacion": {
"id": "hyphenacion",
"title": "Hyphenación",
"tagline": "Where conversation and cultura meet",
"info": "What kind of no sabo word is Hyphenación? For us, it’s about living within a hyphenation. Like being a third-gen Mexican-American from the Texas border now living that Bay Area Chicano life. Like Xorje! Each week we bring together a couple of hyphenated Latinos to talk all about personal life choices: family, careers, relationships, belonging … everything is on the table. ",
"imageSrc": "https://cdn.kqed.org/wp-content/uploads/2025/03/Hyphenacion_FinalAssets_PodcastTile.png",
"imageAlt": "KQED Hyphenación",
"officialWebsiteLink": "/podcasts/hyphenacion",
"meta": {
"site": "news",
"source": "kqed",
"order": 15
},
"link": "/podcasts/hyphenacion",
"subscribe": {
"apple": "https://podcasts.apple.com/us/podcast/hyphenaci%C3%B3n/id1191591838",
"spotify": "https://open.spotify.com/show/2p3Fifq96nw9BPcmFdIq0o?si=39209f7b25774f38",
"youtube": "https://www.youtube.com/c/kqedarts",
"amazon": "https://music.amazon.com/podcasts/6c3dd23c-93fb-4aab-97ba-1725fa6315f1/hyphenaci%C3%B3n",
"rss": "https://feeds.megaphone.fm/KQINC2275451163"
}
},
"jerrybrown": {
"id": "jerrybrown",
"title": "The Political Mind of Jerry Brown",
"tagline": "Lessons from a lifetime in politics",
"info": "The Political Mind of Jerry Brown brings listeners the wisdom of the former Governor, Mayor, and presidential candidate. Scott Shafer interviewed Brown for more than 40 hours, covering the former governor's life and half-century in the political game – and Brown has some lessons he'd like to share. ",
"imageSrc": "https://cdn.kqed.org/wp-content/uploads/2024/04/The-Political-Mind-of-Jerry-Brown-Podcast-Tile-703x703-1.jpg",
"imageAlt": "KQED The Political Mind of Jerry Brown",
"officialWebsiteLink": "/podcasts/jerrybrown",
"meta": {
"site": "news",
"source": "kqed",
"order": 18
},
"link": "/podcasts/jerrybrown",
"subscribe": {
"npr": "https://www.npr.org/podcasts/790253322/the-political-mind-of-jerry-brown",
"apple": "https://itunes.apple.com/us/podcast/id1492194549",
"rss": "https://ww2.kqed.org/news/series/jerrybrown/feed/podcast/",
"tuneIn": "http://tun.in/pjGcK",
"stitcher": "https://www.stitcher.com/podcast/kqed/the-political-mind-of-jerry-brown",
"spotify": "https://open.spotify.com/show/54C1dmuyFyKMFttY6X2j6r?si=K8SgRCoISNK6ZbjpXrX5-w",
"amazon": "https://music.amazon.com/podcasts/44420f75-3b0e-4301-ab3b-16da6b09e543/the-political-mind-of-jerry-brown"
}
},
"latino-usa": {
"id": "latino-usa",
"title": "Latino USA",
"airtime": "MON 1am-2am, SUN 6pm-7pm",
"info": "Latino USA, the radio journal of news and culture, is the only national, English-language radio program produced from a Latino perspective.",
"imageSrc": "https://ww2.kqed.org/radio/wp-content/uploads/sites/50/2018/04/latinoUsa.jpg",
"officialWebsiteLink": "http://latinousa.org/",
"meta": {
"site": "news",
"source": "npr"
},
"link": "/radio/program/latino-usa",
"subscribe": {
"npr": "https://rpb3r.app.goo.gl/xtTd",
"apple": "https://itunes.apple.com/WebObjects/MZStore.woa/wa/viewPodcast?s=143441&mt=2&id=79681317&at=11l79Y&ct=nprdirectory",
"tuneIn": "https://tunein.com/radio/Latino-USA-p621/",
"rss": "https://feeds.npr.org/510016/podcast.xml"
}
},
"marketplace": {
"id": "marketplace",
"title": "Marketplace",
"info": "Our flagship program, helmed by Kai Ryssdal, examines what the day in money delivered, through stories, conversations, newsworthy numbers and more. Updated Monday through Friday at about 3:30 p.m. PT.",
"airtime": "MON-FRI 4pm-4:30pm, MON-WED 6:30pm-7pm",
"imageSrc": "https://cdn.kqed.org/wp-content/uploads/2024/04/Marketplace-Podcast-Tile-360x360-1.jpg",
"officialWebsiteLink": "https://www.marketplace.org/",
"meta": {
"site": "news",
"source": "American Public Media"
},
"link": "/radio/program/marketplace",
"subscribe": {
"apple": "https://itunes.apple.com/WebObjects/MZStore.woa/wa/viewPodcast?s=143441&mt=2&id=201853034&at=11l79Y&ct=nprdirectory",
"tuneIn": "https://tunein.com/radio/APM-Marketplace-p88/",
"rss": "https://feeds.publicradio.org/public_feeds/marketplace-pm/rss/rss"
}
},
"masters-of-scale": {
"id": "masters-of-scale",
"title": "Masters of Scale",
"info": "Masters of Scale is an original podcast in which LinkedIn co-founder and Greylock Partner Reid Hoffman sets out to describe and prove theories that explain how great entrepreneurs take their companies from zero to a gazillion in ingenious fashion.",
"airtime": "Every other Wednesday June 12 through October 16 at 8pm (repeats Thursdays at 2am)",
"imageSrc": "https://cdn.kqed.org/wp-content/uploads/2024/04/Masters-of-Scale-Podcast-Tile-360x360-1.jpg",
"officialWebsiteLink": "https://mastersofscale.com/",
"meta": {
"site": "radio",
"source": "WaitWhat"
},
"link": "/radio/program/masters-of-scale",
"subscribe": {
"apple": "http://mastersofscale.app.link/",
"rss": "https://rss.art19.com/masters-of-scale"
}
},
"mindshift": {
"id": "mindshift",
"title": "MindShift",
"tagline": "A podcast about the future of learning and how we raise our kids",
"info": "The MindShift podcast explores the innovations in education that are shaping how kids learn. Hosts Ki Sung and Katrina Schwartz introduce listeners to educators, researchers, parents and students who are developing effective ways to improve how kids learn. We cover topics like how fed-up administrators are developing surprising tactics to deal with classroom disruptions; how listening to podcasts are helping kids develop reading skills; the consequences of overparenting; and why interdisciplinary learning can engage students on all ends of the traditional achievement spectrum. This podcast is part of the MindShift education site, a division of KQED News. KQED is an NPR/PBS member station based in San Francisco. You can also visit the MindShift website for episodes and supplemental blog posts or tweet us \u003ca href=\"https://twitter.com/MindShiftKQED\">@MindShiftKQED\u003c/a> or visit us at \u003ca href=\"/mindshift\">MindShift.KQED.org\u003c/a>",
"imageSrc": "https://cdn.kqed.org/wp-content/uploads/2024/04/Mindshift-Podcast-Tile-703x703-1.jpg",
"imageAlt": "KQED MindShift: How We Will Learn",
"officialWebsiteLink": "/mindshift/",
"meta": {
"site": "news",
"source": "kqed",
"order": 12
},
"link": "/podcasts/mindshift",
"subscribe": {
"apple": "https://podcasts.apple.com/us/podcast/mindshift-podcast/id1078765985",
"google": "https://podcasts.google.com/feed/aHR0cHM6Ly9mZWVkcy5tZWdhcGhvbmUuZm0vS1FJTkM1NzY0NjAwNDI5",
"npr": "https://www.npr.org/podcasts/464615685/mind-shift-podcast",
"stitcher": "https://www.stitcher.com/podcast/kqed/stories-teachers-share",
"spotify": "https://open.spotify.com/show/0MxSpNYZKNprFLCl7eEtyx"
}
},
"morning-edition": {
"id": "morning-edition",
"title": "Morning Edition",
"info": "\u003cem>Morning Edition\u003c/em> takes listeners around the country and the world with multi-faceted stories and commentaries every weekday. Hosts Steve Inskeep, David Greene and Rachel Martin bring you the latest breaking news and features to prepare you for the day.",
"airtime": "MON-FRI 3am-9am",
"imageSrc": "https://cdn.kqed.org/wp-content/uploads/2024/04/Morning-Edition-Podcast-Tile-360x360-1.jpg",
"officialWebsiteLink": "https://www.npr.org/programs/morning-edition/",
"meta": {
"site": "news",
"source": "npr"
},
"link": "/radio/program/morning-edition"
},
"onourwatch": {
"id": "onourwatch",
"title": "On Our Watch",
"tagline": "Deeply-reported investigative journalism",
"info": "For decades, the process for how police police themselves has been inconsistent – if not opaque. In some states, like California, these proceedings were completely hidden. After a new police transparency law unsealed scores of internal affairs files, our reporters set out to examine these cases and the shadow world of police discipline. On Our Watch brings listeners into the rooms where officers are questioned and witnesses are interrogated to find out who this system is really protecting. Is it the officers, or the public they've sworn to serve?",
"imageSrc": "https://cdn.kqed.org/wp-content/uploads/2024/04/On-Our-Watch-Podcast-Tile-703x703-1.jpg",
"imageAlt": "On Our Watch from NPR and KQED",
"officialWebsiteLink": "/podcasts/onourwatch",
"meta": {
"site": "news",
"source": "kqed",
"order": 11
},
"link": "/podcasts/onourwatch",
"subscribe": {
"apple": "https://podcasts.apple.com/podcast/id1567098962",
"google": "https://podcasts.google.com/feed/aHR0cHM6Ly9mZWVkcy5ucHIub3JnLzUxMDM2MC9wb2RjYXN0LnhtbD9zYz1nb29nbGVwb2RjYXN0cw",
"npr": "https://rpb3r.app.goo.gl/onourwatch",
"spotify": "https://open.spotify.com/show/0OLWoyizopu6tY1XiuX70x",
"tuneIn": "https://tunein.com/radio/On-Our-Watch-p1436229/",
"stitcher": "https://www.stitcher.com/show/on-our-watch",
"rss": "https://feeds.npr.org/510360/podcast.xml"
}
},
"on-the-media": {
"id": "on-the-media",
"title": "On The Media",
"info": "Our weekly podcast explores how the media 'sausage' is made, casts an incisive eye on fluctuations in the marketplace of ideas, and examines threats to the freedom of information and expression in America and abroad. For one hour a week, the show tries to lift the veil from the process of \"making media,\" especially news media, because it's through that lens that we see the world and the world sees us",
"airtime": "SUN 2pm-3pm, MON 12am-1am",
"imageSrc": "https://ww2.kqed.org/radio/wp-content/uploads/sites/50/2018/04/onTheMedia.png",
"officialWebsiteLink": "https://www.wnycstudios.org/shows/otm",
"meta": {
"site": "news",
"source": "wnyc"
},
"link": "/radio/program/on-the-media",
"subscribe": {
"apple": "https://itunes.apple.com/us/podcast/on-the-media/id73330715?mt=2",
"tuneIn": "https://tunein.com/radio/On-the-Media-p69/",
"rss": "http://feeds.wnyc.org/onthemedia"
}
},
"pbs-newshour": {
"id": "pbs-newshour",
"title": "PBS NewsHour",
"info": "Analysis, background reports and updates from the PBS NewsHour putting today's news in context.",
"airtime": "MON-FRI 3pm-4pm",
"imageSrc": "https://cdn.kqed.org/wp-content/uploads/2024/04/PBS-News-Hour-Podcast-Tile-360x360-1.jpg",
"officialWebsiteLink": "https://www.pbs.org/newshour/",
"meta": {
"site": "news",
"source": "pbs"
},
"link": "/radio/program/pbs-newshour",
"subscribe": {
"apple": "https://itunes.apple.com/us/podcast/pbs-newshour-full-show/id394432287?mt=2",
"tuneIn": "https://tunein.com/radio/PBS-NewsHour---Full-Show-p425698/",
"rss": "https://www.pbs.org/newshour/feeds/rss/podcasts/show"
}
},
"perspectives": {
"id": "perspectives",
"title": "Perspectives",
"tagline": "KQED's series of daily listener commentaries since 1991",
"info": "KQED's series of daily listener commentaries since 1991.",
"imageSrc": "https://cdn.kqed.org/wp-content/uploads/2025/01/Perspectives_Tile_Final.jpg",
"imageAlt": "KQED Perspectives",
"officialWebsiteLink": "/perspectives/",
"meta": {
"site": "radio",
"source": "kqed",
"order": 14
},
"link": "/perspectives",
"subscribe": {
"apple": "https://podcasts.apple.com/us/podcast/id73801135",
"npr": "https://www.npr.org/podcasts/432309616/perspectives",
"rss": "https://ww2.kqed.org/perspectives/category/perspectives/feed/",
"google": "https://podcasts.google.com/feed/aHR0cHM6Ly93dzIua3FlZC5vcmcvcGVyc3BlY3RpdmVzL2NhdGVnb3J5L3BlcnNwZWN0aXZlcy9mZWVkLw"
}
},
"planet-money": {
"id": "planet-money",
"title": "Planet Money",
"info": "The economy explained. Imagine you could call up a friend and say, Meet me at the bar and tell me what's going on with the economy. Now imagine that's actually a fun evening.",
"airtime": "SUN 3pm-4pm",
"imageSrc": "https://ww2.kqed.org/radio/wp-content/uploads/sites/50/2018/04/planetmoney.jpg",
"officialWebsiteLink": "https://www.npr.org/sections/money/",
"meta": {
"site": "news",
"source": "npr"
},
"link": "/radio/program/planet-money",
"subscribe": {
"npr": "https://rpb3r.app.goo.gl/M4f5",
"apple": "https://itunes.apple.com/us/podcast/planet-money/id290783428?mt=2",
"tuneIn": "https://tunein.com/podcasts/Business--Economics-Podcasts/Planet-Money-p164680/",
"rss": "https://feeds.npr.org/510289/podcast.xml"
}
},
"politicalbreakdown": {
"id": "politicalbreakdown",
"title": "Political Breakdown",
"tagline": "Politics from a personal perspective",
"info": "Political Breakdown is a new series that explores the political intersection of California and the nation. Each week hosts Scott Shafer and Marisa Lagos are joined with a new special guest to unpack politics -- with personality — and offer an insider’s glimpse at how politics happens.",
"airtime": "THU 6:30pm-7pm",
"imageSrc": "https://cdn.kqed.org/wp-content/uploads/2024/04/Political-Breakdown-2024-Podcast-Tile-703x703-1.jpg",
"imageAlt": "KQED Political Breakdown",
"officialWebsiteLink": "/podcasts/politicalbreakdown",
"meta": {
"site": "radio",
"source": "kqed",
"order": 5
},
"link": "/podcasts/politicalbreakdown",
"subscribe": {
"apple": "https://podcasts.apple.com/us/podcast/political-breakdown/id1327641087",
"amazon": "https://music.amazon.com/podcasts/e0c2d153-ad36-4c8d-901d-f1da6a724824/political-breakdown",
"npr": "https://www.npr.org/podcasts/572155894/political-breakdown",
"stitcher": "https://www.stitcher.com/podcast/kqed/political-breakdown",
"spotify": "https://open.spotify.com/show/07RVyIjIdk2WDuVehvBMoN",
"rss": "https://ww2.kqed.org/news/tag/political-breakdown/feed/podcast"
}
},
"possible": {
"id": "possible",
"title": "Possible",
"info": "Possible is hosted by entrepreneur Reid Hoffman and writer Aria Finger. Together in Possible, Hoffman and Finger lead enlightening discussions about building a brighter collective future. The show features interviews with visionary guests like Trevor Noah, Sam Altman and Janette Sadik-Khan. Possible paints an optimistic portrait of the world we can create through science, policy, business, art and our shared humanity. It asks: What if everything goes right for once? How can we get there? Each episode also includes a short fiction story generated by advanced AI GPT-4, serving as a thought-provoking springboard to speculate how humanity could leverage technology for good.",
"airtime": "SUN 2pm",
"imageSrc": "https://cdn.kqed.org/wp-content/uploads/2024/04/Possible-Podcast-Tile-360x360-1.jpg",
"officialWebsiteLink": "https://www.possible.fm/",
"meta": {
"site": "news",
"source": "Possible"
},
"link": "/radio/program/possible",
"subscribe": {
"apple": "https://podcasts.apple.com/us/podcast/possible/id1677184070",
"spotify": "https://open.spotify.com/show/730YpdUSNlMyPQwNnyjp4k"
}
},
"pri-the-world": {
"id": "pri-the-world",
"title": "PRI's The World: Latest Edition",
"info": "Each weekday, host Marco Werman and his team of producers bring you the world's most interesting stories in an hour of radio that reminds us just how small our planet really is.",
"airtime": "MON-FRI 2pm-3pm",
"imageSrc": "https://cdn.kqed.org/wp-content/uploads/2024/04/The-World-Podcast-Tile-360x360-1.jpg",
"officialWebsiteLink": "https://www.pri.org/programs/the-world",
"meta": {
"site": "news",
"source": "PRI"
},
"link": "/radio/program/pri-the-world",
"subscribe": {
"apple": "https://itunes.apple.com/us/podcast/pris-the-world-latest-edition/id278196007?mt=2",
"tuneIn": "https://tunein.com/podcasts/News--Politics-Podcasts/PRIs-The-World-p24/",
"rss": "http://feeds.feedburner.com/pri/theworld"
}
},
"radiolab": {
"id": "radiolab",
"title": "Radiolab",
"info": "A two-time Peabody Award-winner, Radiolab is an investigation told through sounds and stories, and centered around one big idea. In the Radiolab world, information sounds like music and science and culture collide. Hosted by Jad Abumrad and Robert Krulwich, the show is designed for listeners who demand skepticism, but appreciate wonder. WNYC Studios is the producer of other leading podcasts including Freakonomics Radio, Death, Sex & Money, On the Media and many more.",
"airtime": "SUN 12am-1am, SAT 2pm-3pm",
"imageSrc": "https://ww2.kqed.org/radio/wp-content/uploads/sites/50/2018/04/radiolab1400.png",
"officialWebsiteLink": "https://www.wnycstudios.org/shows/radiolab/",
"meta": {
"site": "science",
"source": "WNYC"
},
"link": "/radio/program/radiolab",
"subscribe": {
"apple": "https://itunes.apple.com/us/podcast/radiolab/id152249110?mt=2",
"tuneIn": "https://tunein.com/radio/RadioLab-p68032/",
"rss": "https://feeds.wnyc.org/radiolab"
}
},
"reveal": {
"id": "reveal",
"title": "Reveal",
"info": "Created by The Center for Investigative Reporting and PRX, Reveal is public radios first one-hour weekly radio show and podcast dedicated to investigative reporting. Credible, fact based and without a partisan agenda, Reveal combines the power and artistry of driveway moment storytelling with data-rich reporting on critically important issues. The result is stories that inform and inspire, arming our listeners with information to right injustices, hold the powerful accountable and improve lives.Reveal is hosted by Al Letson and showcases the award-winning work of CIR and newsrooms large and small across the nation. In a radio and podcast market crowded with choices, Reveal focuses on important and often surprising stories that illuminate the world for our listeners.",
"airtime": "SAT 4pm-5pm",
"imageSrc": "https://ww2.kqed.org/radio/wp-content/uploads/sites/50/2018/04/reveal300px.png",
"officialWebsiteLink": "https://www.revealnews.org/episodes/",
"meta": {
"site": "news",
"source": "npr"
},
"link": "/radio/program/reveal",
"subscribe": {
"apple": "https://itunes.apple.com/us/podcast/reveal/id886009669",
"tuneIn": "https://tunein.com/radio/Reveal-p679597/",
"rss": "http://feeds.revealradio.org/revealpodcast"
}
},
"rightnowish": {
"id": "rightnowish",
"title": "Rightnowish",
"tagline": "Art is where you find it",
"info": "Rightnowish digs into life in the Bay Area right now… ish. Journalist Pendarvis Harshaw takes us to galleries painted on the sides of liquor stores in West Oakland. We'll dance in warehouses in the Bayview, make smoothies with kids in South Berkeley, and listen to classical music in a 1984 Cutlass Supreme in Richmond. Every week, Pen talks to movers and shakers about how the Bay Area shapes what they create, and how they shape the place we call home.",
"imageSrc": "https://cdn.kqed.org/wp-content/uploads/2024/04/Rightnowish-Podcast-Tile-500x500-1.jpg",
"imageAlt": "KQED Rightnowish with Pendarvis Harshaw",
"officialWebsiteLink": "/podcasts/rightnowish",
"meta": {
"site": "arts",
"source": "kqed",
"order": 16
},
"link": "/podcasts/rightnowish",
"subscribe": {
"npr": "https://www.npr.org/podcasts/721590300/rightnowish",
"rss": "https://ww2.kqed.org/arts/programs/rightnowish/feed/podcast",
"apple": "https://podcasts.apple.com/us/podcast/rightnowish/id1482187648",
"stitcher": "https://www.stitcher.com/podcast/kqed/rightnowish",
"google": "https://podcasts.google.com/feed/aHR0cHM6Ly9mZWVkcy5tZWdhcGhvbmUuZm0vS1FJTkMxMjU5MTY3NDc4",
"spotify": "https://open.spotify.com/show/7kEJuafTzTVan7B78ttz1I"
}
},
"science-friday": {
"id": "science-friday",
"title": "Science Friday",
"info": "Science Friday is a weekly science talk show, broadcast live over public radio stations nationwide. Each week, the show focuses on science topics that are in the news and tries to bring an educated, balanced discussion to bear on the scientific issues at hand. Panels of expert guests join host Ira Flatow, a veteran science journalist, to discuss science and to take questions from listeners during the call-in portion of the program.",
"airtime": "FRI 11am-1pm",
"imageSrc": "https://cdn.kqed.org/wp-content/uploads/2024/04/Science-Friday-Podcast-Tile-360x360-1.jpg",
"officialWebsiteLink": "https://www.wnycstudios.org/shows/science-friday",
"meta": {
"site": "news",
"source": "npr"
},
"link": "/radio/program/science-friday",
"subscribe": {
"apple": "https://itunes.apple.com/WebObjects/MZStore.woa/wa/viewPodcast?s=143441&mt=2&id=73329284&at=11l79Y&ct=nprdirectory",
"tuneIn": "https://tunein.com/radio/Science-Friday-p394/",
"rss": "http://feeds.wnyc.org/science-friday"
}
},
"snap-judgment": {
"id": "snap-judgment",
"title": "Snap Judgment",
"tagline": "Real stories with killer beats",
"info": "The Snap Judgment radio show and podcast mixes real stories with killer beats to produce cinematic, dramatic radio. Snap's musical brand of storytelling dares listeners to see the world through the eyes of another. This is storytelling... with a BEAT!! Snap first aired on public radio stations nationwide in July 2010. Today, Snap Judgment airs on over 450 public radio stations and is brought to the airwaves by KQED & PRX.",
"airtime": "SAT 1pm-2pm, 9pm-10pm",
"imageSrc": "https://cdn.kqed.org/wp-content/uploads/2024/05/Snap-Judgment-Podcast-Tile-703x703-1.jpg",
"imageAlt": "KQED Snap Judgment",
"officialWebsiteLink": "https://snapjudgment.org",
"meta": {
"site": "arts",
"source": "kqed",
"order": 4
},
"link": "https://snapjudgment.org",
"subscribe": {
"apple": "https://podcasts.apple.com/us/podcast/snap-judgment/id283657561",
"npr": "https://www.npr.org/podcasts/449018144/snap-judgment",
"stitcher": "https://www.pandora.com/podcast/snap-judgment/PC:241?source=stitcher-sunset",
"spotify": "https://open.spotify.com/show/3Cct7ZWmxHNAtLgBTqjC5v",
"rss": "https://snap.feed.snapjudgment.org/"
}
},
"soldout": {
"id": "soldout",
"title": "SOLD OUT: Rethinking Housing in America",
"tagline": "A new future for housing",
"info": "Sold Out: Rethinking Housing in America",
"imageSrc": "https://cdn.kqed.org/wp-content/uploads/2024/04/Sold-Out-Podcast-Tile-703x703-1.jpg",
"imageAlt": "KQED Sold Out: Rethinking Housing in America",
"officialWebsiteLink": "/podcasts/soldout",
"meta": {
"site": "news",
"source": "kqed",
"order": 13
},
"link": "/podcasts/soldout",
"subscribe": {
"npr": "https://www.npr.org/podcasts/911586047/s-o-l-d-o-u-t-a-new-future-for-housing",
"apple": "https://podcasts.apple.com/us/podcast/introducing-sold-out-rethinking-housing-in-america/id1531354937",
"rss": "https://feeds.megaphone.fm/soldout",
"spotify": "https://open.spotify.com/show/38dTBSk2ISFoPiyYNoKn1X",
"stitcher": "https://www.stitcher.com/podcast/kqed/sold-out-rethinking-housing-in-america",
"tunein": "https://tunein.com/radio/SOLD-OUT-Rethinking-Housing-in-America-p1365871/"
}
},
"spooked": {
"id": "spooked",
"title": "Spooked",
"tagline": "True-life supernatural stories",
"info": "",
"imageSrc": "https://cdn.kqed.org/wp-content/uploads/2024/10/Spooked-Podcast-Tile-703x703-1.jpg",
"imageAlt": "KQED Spooked",
"officialWebsiteLink": "https://spookedpodcast.org/",
"meta": {
"site": "news",
"source": "kqed",
"order": 7
},
"link": "https://spookedpodcast.org/",
"subscribe": {
"apple": "https://podcasts.apple.com/us/podcast/spooked/id1279361017",
"npr": "https://www.npr.org/podcasts/549547848/snap-judgment-presents-spooked",
"spotify": "https://open.spotify.com/show/76571Rfl3m7PLJQZKQIGCT",
"rss": "https://feeds.simplecast.com/TBotaapn"
}
},
"tech-nation": {
"id": "tech-nation",
"title": "Tech Nation Radio Podcast",
"info": "Tech Nation is a weekly public radio program, hosted by Dr. Moira Gunn. Founded in 1993, it has grown from a simple interview show to a multi-faceted production, featuring conversations with noted technology and science leaders, and a weekly science and technology-related commentary.",
"airtime": "FRI 10pm",
"imageSrc": "https://cdn.kqed.org/wp-content/uploads/2024/04/Tech-Nation-Radio-Podcast-Tile-360x360-1.jpg",
"officialWebsiteLink": "http://technation.podomatic.com/",
"meta": {
"site": "science",
"source": "Tech Nation Media"
},
"link": "/radio/program/tech-nation",
"subscribe": {
"rss": "https://technation.podomatic.com/rss2.xml"
}
},
"ted-radio-hour": {
"id": "ted-radio-hour",
"title": "TED Radio Hour",
"info": "The TED Radio Hour is a journey through fascinating ideas, astonishing inventions, fresh approaches to old problems, and new ways to think and create.",
"airtime": "SUN 3pm-4pm, SAT 10pm-11pm",
"imageSrc": "https://ww2.kqed.org/radio/wp-content/uploads/sites/50/2018/04/tedRadioHour.jpg",
"officialWebsiteLink": "https://www.npr.org/programs/ted-radio-hour/?showDate=2018-06-22",
"meta": {
"site": "news",
"source": "npr"
},
"link": "/radio/program/ted-radio-hour",
"subscribe": {
"npr": "https://rpb3r.app.goo.gl/8vsS",
"apple": "https://itunes.apple.com/WebObjects/MZStore.woa/wa/viewPodcast?s=143441&mt=2&id=523121474&at=11l79Y&ct=nprdirectory",
"tuneIn": "https://tunein.com/radio/TED-Radio-Hour-p418021/",
"rss": "https://feeds.npr.org/510298/podcast.xml"
}
},
"thebay": {
"id": "thebay",
"title": "The Bay",
"tagline": "Local news to keep you rooted",
"info": "Host Devin Katayama walks you through the biggest story of the day with reporters and newsmakers.",
"imageSrc": "https://cdn.kqed.org/wp-content/uploads/2024/04/The-Bay-Podcast-Tile-703x703-1.jpg",
"imageAlt": "KQED The Bay",
"officialWebsiteLink": "/podcasts/thebay",
"meta": {
"site": "radio",
"source": "kqed",
"order": 2
},
"link": "/podcasts/thebay",
"subscribe": {
"apple": "https://podcasts.apple.com/us/podcast/the-bay/id1350043452",
"amazon": "https://music.amazon.com/podcasts/d800ea4c-7a2c-42f2-b861-edaf78a5db0b/the-bay",
"npr": "https://www.npr.org/podcasts/586725995/the-bay",
"stitcher": "https://www.stitcher.com/podcast/kqed/the-bay",
"spotify": "https://open.spotify.com/show/4BIKBKIujizLHlIlBNaAqQ",
"rss": "https://feeds.megaphone.fm/KQINC8259786327"
}
},
"thelatest": {
"id": "thelatest",
"title": "The Latest",
"tagline": "Trusted local news in real time",
"info": "",
"imageSrc": "https://cdn.kqed.org/wp-content/uploads/2025/05/The-Latest-2025-Podcast-Tile-703x703-1.jpg",
"imageAlt": "KQED The Latest",
"officialWebsiteLink": "/thelatest",
"meta": {
"site": "news",
"source": "kqed",
"order": 6
},
"link": "/thelatest",
"subscribe": {
"apple": "https://podcasts.apple.com/us/podcast/the-latest-from-kqed/id1197721799",
"npr": "https://www.npr.org/podcasts/1257949365/the-latest-from-k-q-e-d",
"spotify": "https://open.spotify.com/show/5KIIXMgM9GTi5AepwOYvIZ?si=bd3053fec7244dba",
"rss": "https://feeds.megaphone.fm/KQINC9137121918"
}
},
"theleap": {
"id": "theleap",
"title": "The Leap",
"tagline": "What if you closed your eyes, and jumped?",
"info": "Stories about people making dramatic, risky changes, told by award-winning public radio reporter Judy Campbell.",
"imageSrc": "https://cdn.kqed.org/wp-content/uploads/2024/04/The-Leap-Podcast-Tile-703x703-1.jpg",
"imageAlt": "KQED The Leap",
"officialWebsiteLink": "/podcasts/theleap",
"meta": {
"site": "news",
"source": "kqed",
"order": 17
},
"link": "/podcasts/theleap",
"subscribe": {
"apple": "https://podcasts.apple.com/us/podcast/the-leap/id1046668171",
"npr": "https://www.npr.org/podcasts/447248267/the-leap",
"stitcher": "https://www.stitcher.com/podcast/kqed/the-leap",
"spotify": "https://open.spotify.com/show/3sSlVHHzU0ytLwuGs1SD1U",
"rss": "https://ww2.kqed.org/news/programs/the-leap/feed/podcast"
}
},
"the-moth-radio-hour": {
"id": "the-moth-radio-hour",
"title": "The Moth Radio Hour",
"info": "Since its launch in 1997, The Moth has presented thousands of true stories, told live and without notes, to standing-room-only crowds worldwide. Moth storytellers stand alone, under a spotlight, with only a microphone and a roomful of strangers. The storyteller and the audience embark on a high-wire act of shared experience which is both terrifying and exhilarating. Since 2008, The Moth podcast has featured many of our favorite stories told live on Moth stages around the country. For information on all of our programs and live events, visit themoth.org.",
"airtime": "SAT 8pm-9pm and SUN 11am-12pm",
"imageSrc": "https://ww2.kqed.org/radio/wp-content/uploads/sites/50/2018/04/theMoth.jpg",
"officialWebsiteLink": "https://themoth.org/",
"meta": {
"site": "arts",
"source": "prx"
},
"link": "/radio/program/the-moth-radio-hour",
"subscribe": {
"apple": "https://itunes.apple.com/us/podcast/the-moth-podcast/id275699983?mt=2",
"tuneIn": "https://tunein.com/radio/The-Moth-p273888/",
"rss": "http://feeds.themoth.org/themothpodcast"
}
},
"the-new-yorker-radio-hour": {
"id": "the-new-yorker-radio-hour",
"title": "The New Yorker Radio Hour",
"info": "The New Yorker Radio Hour is a weekly program presented by the magazine's editor, David Remnick, and produced by WNYC Studios and The New Yorker. Each episode features a diverse mix of interviews, profiles, storytelling, and an occasional burst of humor inspired by the magazine, and shaped by its writers, artists, and editors. This isn't a radio version of a magazine, but something all its own, reflecting the rich possibilities of audio storytelling and conversation. Theme music for the show was composed and performed by Merrill Garbus of tUnE-YArDs.",
"airtime": "SAT 10am-11am",
"imageSrc": "https://cdn.kqed.org/wp-content/uploads/2024/04/The-New-Yorker-Podcast-Tile-360x360-1.jpg",
"officialWebsiteLink": "https://www.wnycstudios.org/shows/tnyradiohour",
"meta": {
"site": "arts",
"source": "WNYC"
},
"link": "/radio/program/the-new-yorker-radio-hour",
"subscribe": {
"apple": "https://itunes.apple.com/us/podcast/id1050430296",
"tuneIn": "https://tunein.com/podcasts/WNYC-Podcasts/New-Yorker-Radio-Hour-p803804/",
"rss": "https://feeds.feedburner.com/newyorkerradiohour"
}
},
"the-sam-sanders-show": {
"id": "the-sam-sanders-show",
"title": "The Sam Sanders Show",
"info": "One of public radio's most dynamic voices, Sam Sanders helped launch The NPR Politics Podcast and hosted NPR's hit show It's Been A Minute. Now, the award-winning host returns with something brand new, The Sam Sanders Show. Every week, Sam Sanders and friends dig into the culture that shapes our lives: what's driving the biggest trends, how artists really think, and even the memes you can't stop scrolling past. Sam is beloved for his way of unpacking the world and bringing you up close to fresh currents and engaging conversations. The Sam Sanders Show is smart, funny and always a good time.",
"airtime": "FRI 12-1pm AND SAT 11am-12pm",
"imageSrc": "https://cdn.kqed.org/wp-content/uploads/2025/11/The-Sam-Sanders-Show-Podcast-Tile-400x400-1.jpg",
"officialWebsiteLink": "https://www.kcrw.com/shows/the-sam-sanders-show/latest",
"meta": {
"site": "arts",
"source": "KCRW"
},
"link": "https://www.kcrw.com/shows/the-sam-sanders-show/latest",
"subscribe": {
"rss": "https://feed.cdnstream1.com/zjb/feed/download/ac/28/59/ac28594c-e1d0-4231-8728-61865cdc80e8.xml"
}
},
"the-splendid-table": {
"id": "the-splendid-table",
"title": "The Splendid Table",
"info": "\u003cem>The Splendid Table\u003c/em> hosts our nation's conversations about cooking, sustainability and food culture.",
"imageSrc": "https://cdn.kqed.org/wp-content/uploads/2024/04/The-Splendid-Table-Podcast-Tile-360x360-1.jpg",
"officialWebsiteLink": "https://www.splendidtable.org/",
"airtime": "SUN 10-11 pm",
"meta": {
"site": "radio",
"source": "npr"
},
"link": "/radio/program/the-splendid-table"
},
"this-american-life": {
"id": "this-american-life",
"title": "This American Life",
"info": "This American Life is a weekly public radio show, heard by 2.2 million people on more than 500 stations. Another 2.5 million people download the weekly podcast. It is hosted by Ira Glass, produced in collaboration with Chicago Public Media, delivered to stations by PRX The Public Radio Exchange, and has won all of the major broadcasting awards.",
"airtime": "SAT 12pm-1pm, 7pm-8pm",
"imageSrc": "https://ww2.kqed.org/radio/wp-content/uploads/sites/50/2018/04/thisAmericanLife.png",
"officialWebsiteLink": "https://www.thisamericanlife.org/",
"meta": {
"site": "news",
"source": "wbez"
},
"link": "/radio/program/this-american-life",
"subscribe": {
"apple": "https://itunes.apple.com/WebObjects/MZStore.woa/wa/viewPodcast?s=143441&mt=2&id=201671138&at=11l79Y&ct=nprdirectory",
"rss": "https://www.thisamericanlife.org/podcast/rss.xml"
}
},
"tinydeskradio": {
"id": "tinydeskradio",
"title": "Tiny Desk Radio",
"info": "We're bringing the best of Tiny Desk to the airwaves, only on public radio.",
"airtime": "SUN 8pm and SAT 9pm",
"imageSrc": "https://cdn.kqed.org/wp-content/uploads/2025/04/300x300-For-Member-Station-Logo-Tiny-Desk-Radio-@2x.png",
"officialWebsiteLink": "https://www.npr.org/series/g-s1-52030/tiny-desk-radio",
"meta": {
"site": "news",
"source": "npr"
},
"link": "/radio/program/tinydeskradio",
"subscribe": {
"rss": "https://feeds.npr.org/g-s1-52030/rss.xml"
}
},
"wait-wait-dont-tell-me": {
"id": "wait-wait-dont-tell-me",
"title": "Wait Wait... Don't Tell Me!",
"info": "Peter Sagal and Bill Kurtis host the weekly NPR News quiz show alongside some of the best and brightest news and entertainment personalities.",
"airtime": "SUN 10am-11am, SAT 11am-12pm, SAT 6pm-7pm",
"imageSrc": "https://cdn.kqed.org/wp-content/uploads/2024/04/Wait-Wait-Podcast-Tile-300x300-1.jpg",
"officialWebsiteLink": "https://www.npr.org/programs/wait-wait-dont-tell-me/",
"meta": {
"site": "news",
"source": "npr"
},
"link": "/radio/program/wait-wait-dont-tell-me",
"subscribe": {
"npr": "https://rpb3r.app.goo.gl/Xogv",
"apple": "https://itunes.apple.com/WebObjects/MZStore.woa/wa/viewPodcast?s=143441&mt=2&id=121493804&at=11l79Y&ct=nprdirectory",
"tuneIn": "https://tunein.com/radio/Wait-Wait-Dont-Tell-Me-p46/",
"rss": "https://feeds.npr.org/344098539/podcast.xml"
}
},
"weekend-edition-saturday": {
"id": "weekend-edition-saturday",
"title": "Weekend Edition Saturday",
"info": "Weekend Edition Saturday wraps up the week's news and offers a mix of analysis and features on a wide range of topics, including arts, sports, entertainment, and human interest stories. The two-hour program is hosted by NPR's Peabody Award-winning Scott Simon.",
"airtime": "SAT 5am-10am",
"imageSrc": "https://cdn.kqed.org/wp-content/uploads/2024/04/Weekend-Edition-Podcast-Tile-360x360-1.jpg",
"officialWebsiteLink": "https://www.npr.org/programs/weekend-edition-saturday/",
"meta": {
"site": "news",
"source": "npr"
},
"link": "/radio/program/weekend-edition-saturday"
},
"weekend-edition-sunday": {
"id": "weekend-edition-sunday",
"title": "Weekend Edition Sunday",
"info": "Weekend Edition Sunday features interviews with newsmakers, artists, scientists, politicians, musicians, writers, theologians and historians. The program has covered news events from Nelson Mandela's 1990 release from a South African prison to the capture of Saddam Hussein.",
"airtime": "SUN 5am-10am",
"imageSrc": "https://cdn.kqed.org/wp-content/uploads/2024/04/Weekend-Edition-Podcast-Tile-360x360-1.jpg",
"officialWebsiteLink": "https://www.npr.org/programs/weekend-edition-sunday/",
"meta": {
"site": "news",
"source": "npr"
},
"link": "/radio/program/weekend-edition-sunday"
}
},
"racesReducer": {},
"racesGenElectionReducer": {},
"racesGenElection2026Reducer": {},
"racesGeneralEl2026Reducer": {},
"radioSchedulesReducer": {},
"listsReducer": {
"posts/science?category=geology": {
"isFetching": false,
"latestQuery": {
"from": 96,
"size": 12
},
"vitalsOnly": false,
"totalRequested": 12,
"isLoading": false,
"isLoadingMore": true,
"total": {
"value": 311,
"relation": "eq"
},
"items": [
"science_30783",
"science_30558",
"science_30233",
"science_29852",
"science_29537",
"science_29262",
"science_29080",
"science_28904",
"science_28578",
"science_28387",
"science_28104",
"science_27911"
],
"complete": true
}
},
"recallGuideReducer": {
"intros": {},
"policy": {},
"candidates": {}
},
"savedArticleReducer": {
"articles": [],
"status": {}
},
"newslettersReducer": {
"isFetching": false,
"fetchFailed": false,
"hasFetched": false,
"newsletters": {},
"isSubscribing": false,
"isUnsubscribing": false,
"subscribedNewsletters": {}
},
"termsReducer": {
"about": {
"name": "About",
"type": "terms",
"id": "about",
"slug": "about",
"link": "/about",
"taxonomy": "site"
},
"arts": {
"name": "Arts & Culture",
"grouping": [
"arts",
"pop",
"trulyca"
],
"description": "KQED Arts provides daily in-depth coverage of the Bay Area's music, art, film, performing arts, literature and arts news, as well as cultural commentary and criticism.",
"type": "terms",
"id": "arts",
"slug": "arts",
"link": "/arts",
"taxonomy": "site"
},
"artschool": {
"name": "Art School",
"parent": "arts",
"type": "terms",
"id": "artschool",
"slug": "artschool",
"link": "/artschool",
"taxonomy": "site"
},
"bayareabites": {
"name": "KQED food",
"grouping": [
"food",
"bayareabites",
"checkplease"
],
"parent": "food",
"type": "terms",
"id": "bayareabites",
"slug": "bayareabites",
"link": "/food",
"taxonomy": "site"
},
"bayareahiphop": {
"name": "Bay Area Hiphop",
"type": "terms",
"id": "bayareahiphop",
"slug": "bayareahiphop",
"link": "/bayareahiphop",
"taxonomy": "site"
},
"campaign21": {
"name": "Campaign 21",
"type": "terms",
"id": "campaign21",
"slug": "campaign21",
"link": "/campaign21",
"taxonomy": "site"
},
"careers": {
"name": "Careers",
"type": "terms",
"id": "careers",
"slug": "careers",
"link": "/careers",
"taxonomy": "site"
},
"checkplease": {
"name": "KQED food",
"grouping": [
"food",
"bayareabites",
"checkplease"
],
"parent": "food",
"type": "terms",
"id": "checkplease",
"slug": "checkplease",
"link": "/food",
"taxonomy": "site"
},
"education": {
"name": "Education",
"grouping": [
"education"
],
"type": "terms",
"id": "education",
"slug": "education",
"link": "/education",
"taxonomy": "site"
},
"elections": {
"name": "Elections",
"type": "terms",
"id": "elections",
"slug": "elections",
"link": "/elections",
"taxonomy": "site"
},
"events": {
"name": "Events",
"type": "terms",
"id": "events",
"slug": "events",
"link": "/events",
"taxonomy": "site"
},
"event": {
"name": "Event",
"alias": "events",
"type": "terms",
"id": "event",
"slug": "event",
"link": "/event",
"taxonomy": "site"
},
"filmschoolshorts": {
"name": "Film School Shorts",
"type": "terms",
"id": "filmschoolshorts",
"slug": "filmschoolshorts",
"link": "/filmschoolshorts",
"taxonomy": "site"
},
"food": {
"name": "KQED food",
"grouping": [
"food",
"bayareabites",
"checkplease"
],
"type": "terms",
"id": "food",
"slug": "food",
"link": "/food",
"taxonomy": "site"
},
"forum": {
"name": "Forum",
"relatedContentQuery": "posts/forum?",
"parent": "news",
"type": "terms",
"id": "forum",
"slug": "forum",
"link": "/forum",
"taxonomy": "site"
},
"futureofyou": {
"name": "Future of You",
"grouping": [
"science",
"futureofyou"
],
"parent": "science",
"type": "terms",
"id": "futureofyou",
"slug": "futureofyou",
"link": "/futureofyou",
"taxonomy": "site"
},
"jpepinheart": {
"name": "KQED food",
"relatedContentQuery": "posts/food,bayareabites,checkplease",
"parent": "food",
"type": "terms",
"id": "jpepinheart",
"slug": "jpepinheart",
"link": "/food",
"taxonomy": "site"
},
"liveblog": {
"name": "Live Blog",
"type": "terms",
"id": "liveblog",
"slug": "liveblog",
"link": "/liveblog",
"taxonomy": "site"
},
"livetv": {
"name": "Live TV",
"parent": "tv",
"type": "terms",
"id": "livetv",
"slug": "livetv",
"link": "/livetv",
"taxonomy": "site"
},
"lowdown": {
"name": "The Lowdown",
"relatedContentQuery": "posts/lowdown?",
"parent": "news",
"type": "terms",
"id": "lowdown",
"slug": "lowdown",
"link": "/lowdown",
"taxonomy": "site"
},
"mindshift": {
"name": "Mindshift",
"parent": "news",
"description": "MindShift explores the future of education by highlighting the innovative – and sometimes counterintuitive – ways educators and parents are helping all children succeed.",
"type": "terms",
"id": "mindshift",
"slug": "mindshift",
"link": "/mindshift",
"taxonomy": "site"
},
"news": {
"name": "News",
"grouping": [
"news",
"forum"
],
"type": "terms",
"id": "news",
"slug": "news",
"link": "/news",
"taxonomy": "site"
},
"newsletters": {
"name": "newsletters",
"type": "terms",
"id": "newsletters",
"slug": "newsletters",
"link": "/newsletters",
"taxonomy": "site"
},
"perspectives": {
"name": "Perspectives",
"parent": "radio",
"type": "terms",
"id": "perspectives",
"slug": "perspectives",
"link": "/perspectives",
"taxonomy": "site"
},
"podcasts": {
"name": "Podcasts",
"type": "terms",
"id": "podcasts",
"slug": "podcasts",
"link": "/podcasts",
"taxonomy": "site"
},
"pop": {
"name": "Pop",
"parent": "arts",
"type": "terms",
"id": "pop",
"slug": "pop",
"link": "/pop",
"taxonomy": "site"
},
"pressroom": {
"name": "Pressroom",
"type": "terms",
"id": "pressroom",
"slug": "pressroom",
"link": "/pressroom",
"taxonomy": "site"
},
"quest": {
"name": "Quest",
"parent": "science",
"type": "terms",
"id": "quest",
"slug": "quest",
"link": "/quest",
"taxonomy": "site"
},
"radio": {
"name": "Radio",
"grouping": [
"forum",
"perspectives"
],
"description": "Listen to KQED Public Radio – home of Forum and The California Report – on 88.5 FM in San Francisco, 89.3 FM in Sacramento, 88.3 FM in Santa Rosa and 88.1 FM in Martinez.",
"type": "terms",
"id": "radio",
"slug": "radio",
"link": "/radio",
"taxonomy": "site"
},
"root": {
"name": "KQED",
"image": "https://ww2.kqed.org/app/uploads/2020/02/KQED-OG-Image@1x.png",
"imageWidth": 1200,
"imageHeight": 630,
"headData": {
"title": "KQED | News, Radio, Podcasts, TV | Public Media for Northern California",
"description": "KQED provides public radio, television, and independent reporting on issues that matter to the Bay Area. We’re the NPR and PBS member station for Northern California."
},
"type": "terms",
"id": "root",
"slug": "root",
"link": "/root",
"taxonomy": "site"
},
"science": {
"name": "Science",
"grouping": [
"science",
"futureofyou"
],
"description": "KQED Science brings you award-winning science and environment coverage from the Bay Area and beyond.",
"type": "terms",
"id": "science",
"slug": "science",
"link": "/science",
"taxonomy": "site"
},
"stateofhealth": {
"name": "State of Health",
"parent": "science",
"type": "terms",
"id": "stateofhealth",
"slug": "stateofhealth",
"link": "/stateofhealth",
"taxonomy": "site"
},
"support": {
"name": "Support",
"type": "terms",
"id": "support",
"slug": "support",
"link": "/support",
"taxonomy": "site"
},
"thedolist": {
"name": "The Do List",
"parent": "arts",
"type": "terms",
"id": "thedolist",
"slug": "thedolist",
"link": "/thedolist",
"taxonomy": "site"
},
"trulyca": {
"name": "Truly CA",
"grouping": [
"arts",
"pop",
"trulyca"
],
"parent": "arts",
"type": "terms",
"id": "trulyca",
"slug": "trulyca",
"link": "/trulyca",
"taxonomy": "site"
},
"tv": {
"name": "TV",
"type": "terms",
"id": "tv",
"slug": "tv",
"link": "/tv",
"taxonomy": "site"
},
"voterguide": {
"name": "Voter Guide",
"parent": "elections",
"alias": "elections",
"type": "terms",
"id": "voterguide",
"slug": "voterguide",
"link": "/voterguide",
"taxonomy": "site"
},
"guiaelectoral": {
"name": "Guia Electoral",
"parent": "elections",
"alias": "elections",
"type": "terms",
"id": "guiaelectoral",
"slug": "guiaelectoral",
"link": "/guiaelectoral",
"taxonomy": "site"
},
"science_category_geology": {
"isLoading": true
},
"science_38": {
"type": "terms",
"id": "science_38",
"meta": {
"index": "terms_1716263798",
"site": "science",
"id": "38",
"found": true
},
"relationships": {},
"featImg": null,
"name": "Geology",
"description": null,
"taxonomy": "category",
"headData": {
"twImgId": null,
"twTitle": null,
"ogTitle": null,
"ogImgId": null,
"twDescription": null,
"description": null,
"title": "Geology Archives | KQED Science",
"ogDescription": null
},
"ttid": 40,
"slug": "geology",
"isLoading": false,
"link": "/science/category/geology"
},
"science_40": {
"type": "terms",
"id": "science_40",
"meta": {
"index": "terms_1716263798",
"site": "science",
"id": "40",
"found": true
},
"relationships": {},
"featImg": null,
"name": "News",
"description": null,
"taxonomy": "category",
"headData": {
"twImgId": null,
"twTitle": null,
"ogTitle": null,
"ogImgId": null,
"twDescription": null,
"description": null,
"title": "News Archives | KQED Science",
"ogDescription": null
},
"ttid": 42,
"slug": "news",
"isLoading": false,
"link": "/science/category/news"
},
"science_257": {
"type": "terms",
"id": "science_257",
"meta": {
"index": "terms_1716263798",
"site": "science",
"id": "257",
"found": true
},
"relationships": {},
"featImg": null,
"name": "earthquake",
"description": null,
"taxonomy": "tag",
"headData": {
"twImgId": null,
"twTitle": null,
"ogTitle": null,
"ogImgId": null,
"twDescription": null,
"description": null,
"title": "earthquake Archives | KQED Science",
"ogDescription": null
},
"ttid": 261,
"slug": "earthquake",
"isLoading": false,
"link": "/science/tag/earthquake"
},
"science_5190": {
"type": "terms",
"id": "science_5190",
"meta": {
"index": "terms_1716263798",
"site": "science",
"id": "5190",
"found": true
},
"relationships": {},
"featImg": null,
"name": "Los Angeles",
"description": null,
"taxonomy": "tag",
"headData": {
"twImgId": null,
"twTitle": null,
"ogTitle": null,
"ogImgId": null,
"twDescription": null,
"description": null,
"title": "Los Angeles Archives | KQED Science",
"ogDescription": null
},
"ttid": 5190,
"slug": "los-angeles",
"isLoading": false,
"link": "/science/tag/los-angeles"
},
"science_258": {
"type": "terms",
"id": "science_258",
"meta": {
"index": "terms_1716263798",
"site": "science",
"id": "258",
"found": true
},
"relationships": {},
"featImg": null,
"name": "tsunami",
"description": null,
"taxonomy": "tag",
"headData": {
"twImgId": null,
"twTitle": null,
"ogTitle": null,
"ogImgId": null,
"twDescription": null,
"description": null,
"title": "tsunami Archives | KQED Science",
"ogDescription": null
},
"ttid": 262,
"slug": "tsunami",
"isLoading": false,
"link": "/science/tag/tsunami"
},
"science_427": {
"type": "terms",
"id": "science_427",
"meta": {
"index": "terms_1716263798",
"site": "science",
"id": "427",
"found": true
},
"relationships": {},
"featImg": null,
"name": "earthquakes",
"description": null,
"taxonomy": "tag",
"headData": {
"twImgId": null,
"twTitle": null,
"ogTitle": null,
"ogImgId": null,
"twDescription": null,
"description": null,
"title": "earthquakes Archives | KQED Science",
"ogDescription": null
},
"ttid": 433,
"slug": "earthquakes",
"isLoading": false,
"link": "/science/tag/earthquakes"
},
"science_654": {
"type": "terms",
"id": "science_654",
"meta": {
"index": "terms_1716263798",
"site": "science",
"id": "654",
"found": true
},
"relationships": {},
"featImg": null,
"name": "hayward fault",
"description": null,
"taxonomy": "tag",
"headData": {
"twImgId": null,
"twTitle": null,
"ogTitle": null,
"ogImgId": null,
"twDescription": null,
"description": null,
"title": "hayward fault Archives | KQED Science",
"ogDescription": null
},
"ttid": 660,
"slug": "hayward-fault",
"isLoading": false,
"link": "/science/tag/hayward-fault"
},
"science_31": {
"type": "terms",
"id": "science_31",
"meta": {
"index": "terms_1716263798",
"site": "science",
"id": "31",
"found": true
},
"relationships": {},
"featImg": null,
"name": "Climate",
"description": null,
"taxonomy": "category",
"headData": {
"twImgId": null,
"twTitle": null,
"ogTitle": null,
"ogImgId": null,
"twDescription": null,
"description": null,
"title": "Climate Archives | KQED Science",
"ogDescription": null
},
"ttid": 33,
"slug": "climate",
"isLoading": false,
"link": "/science/category/climate"
},
"science_1000": {
"type": "terms",
"id": "science_1000",
"meta": {
"index": "terms_1716263798",
"site": "science",
"id": "1000",
"found": true
},
"relationships": {},
"featImg": null,
"name": "climate modeling",
"description": null,
"taxonomy": "tag",
"headData": {
"twImgId": null,
"twTitle": null,
"ogTitle": null,
"ogImgId": null,
"twDescription": null,
"description": null,
"title": "climate modeling Archives | KQED Science",
"ogDescription": null
},
"ttid": 1008,
"slug": "climate-modeling",
"isLoading": false,
"link": "/science/tag/climate-modeling"
},
"science_30": {
"type": "terms",
"id": "science_30",
"meta": {
"index": "terms_1716263798",
"site": "science",
"id": "30",
"found": true
},
"relationships": {},
"featImg": null,
"name": "Biology",
"description": null,
"taxonomy": "category",
"headData": {
"twImgId": null,
"twTitle": null,
"ogTitle": null,
"ogImgId": null,
"twDescription": null,
"description": null,
"title": "Biology Archives | KQED Science",
"ogDescription": null
},
"ttid": 32,
"slug": "biology",
"isLoading": false,
"link": "/science/category/biology"
},
"science_35": {
"type": "terms",
"id": "science_35",
"meta": {
"index": "terms_1716263798",
"site": "science",
"id": "35",
"found": true
},
"relationships": {},
"featImg": null,
"name": "Environment",
"description": null,
"taxonomy": "category",
"headData": {
"twImgId": null,
"twTitle": null,
"ogTitle": null,
"ogImgId": null,
"twDescription": null,
"description": null,
"title": "Environment Archives | KQED Science",
"ogDescription": null
},
"ttid": 37,
"slug": "environment",
"isLoading": false,
"link": "/science/category/environment"
},
"science_2145": {
"type": "terms",
"id": "science_2145",
"meta": {
"index": "terms_1716263798",
"site": "science",
"id": "2145",
"found": true
},
"relationships": {},
"featImg": null,
"name": "dinosaurs",
"description": null,
"taxonomy": "tag",
"headData": {
"twImgId": null,
"twTitle": null,
"ogTitle": null,
"ogImgId": null,
"twDescription": null,
"description": null,
"title": "dinosaurs Archives | KQED Science",
"ogDescription": null
},
"ttid": 2156,
"slug": "dinosaurs",
"isLoading": false,
"link": "/science/tag/dinosaurs"
},
"science_116": {
"type": "terms",
"id": "science_116",
"meta": {
"index": "terms_1716263798",
"site": "science",
"id": "116",
"found": true
},
"relationships": {},
"featImg": null,
"name": "evolution",
"description": null,
"taxonomy": "tag",
"headData": {
"twImgId": null,
"twTitle": null,
"ogTitle": null,
"ogImgId": null,
"twDescription": null,
"description": null,
"title": "evolution Archives | KQED Science",
"ogDescription": null
},
"ttid": 120,
"slug": "evolution",
"isLoading": false,
"link": "/science/tag/evolution"
},
"science_349": {
"type": "terms",
"id": "science_349",
"meta": {
"index": "terms_1716263798",
"site": "science",
"id": "349",
"found": true
},
"relationships": {},
"featImg": null,
"name": "fossils",
"description": null,
"taxonomy": "tag",
"headData": {
"twImgId": null,
"twTitle": null,
"ogTitle": null,
"ogImgId": null,
"twDescription": null,
"description": null,
"title": "fossils Archives | KQED Science",
"ogDescription": null
},
"ttid": 355,
"slug": "fossils",
"isLoading": false,
"link": "/science/tag/fossils"
},
"science_1490": {
"type": "terms",
"id": "science_1490",
"meta": {
"index": "terms_1716263798",
"site": "science",
"id": "1490",
"found": true
},
"relationships": {},
"featImg": null,
"name": "global climate change",
"description": null,
"taxonomy": "tag",
"headData": {
"twImgId": null,
"twTitle": null,
"ogTitle": null,
"ogImgId": null,
"twDescription": null,
"description": null,
"title": "global climate change Archives | KQED Science",
"ogDescription": null
},
"ttid": 1499,
"slug": "global-climate-change",
"isLoading": false,
"link": "/science/tag/global-climate-change"
},
"science_1999": {
"type": "terms",
"id": "science_1999",
"meta": {
"index": "terms_1716263798",
"site": "science",
"id": "1999",
"found": true
},
"relationships": {},
"featImg": null,
"name": "volcano",
"description": null,
"taxonomy": "tag",
"headData": {
"twImgId": null,
"twTitle": null,
"ogTitle": null,
"ogImgId": null,
"twDescription": null,
"description": null,
"title": "volcano Archives | KQED Science",
"ogDescription": null
},
"ttid": 2010,
"slug": "volcano",
"isLoading": false,
"link": "/science/tag/volcano"
},
"science_944": {
"type": "terms",
"id": "science_944",
"meta": {
"index": "terms_1716263798",
"site": "science",
"id": "944",
"found": true
},
"relationships": {},
"featImg": null,
"name": "volcanoes",
"description": null,
"taxonomy": "tag",
"headData": {
"twImgId": null,
"twTitle": null,
"ogTitle": null,
"ogImgId": null,
"twDescription": null,
"description": null,
"title": "volcanoes Archives | KQED Science",
"ogDescription": null
},
"ttid": 951,
"slug": "volcanoes",
"isLoading": false,
"link": "/science/tag/volcanoes"
},
"science_1888": {
"type": "terms",
"id": "science_1888",
"meta": {
"index": "terms_1716263798",
"site": "science",
"id": "1888",
"found": true
},
"relationships": {},
"featImg": null,
"name": "disaster preparedness",
"description": null,
"taxonomy": "tag",
"headData": {
"twImgId": null,
"twTitle": null,
"ogTitle": null,
"ogImgId": null,
"twDescription": null,
"description": null,
"title": "disaster preparedness Archives | KQED Science",
"ogDescription": null
},
"ttid": 1899,
"slug": "disaster-preparedness",
"isLoading": false,
"link": "/science/tag/disaster-preparedness"
},
"science_838": {
"type": "terms",
"id": "science_838",
"meta": {
"index": "terms_1716263798",
"site": "science",
"id": "838",
"found": true
},
"relationships": {},
"featImg": null,
"name": "USGS",
"description": null,
"taxonomy": "tag",
"headData": {
"twImgId": null,
"twTitle": null,
"ogTitle": null,
"ogImgId": null,
"twDescription": null,
"description": null,
"title": "USGS Archives | KQED Science",
"ogDescription": null
},
"ttid": 844,
"slug": "usgs-2",
"isLoading": false,
"link": "/science/tag/usgs-2"
},
"science_123": {
"type": "terms",
"id": "science_123",
"meta": {
"index": "terms_1716263798",
"site": "science",
"id": "123",
"found": true
},
"relationships": {},
"featImg": null,
"name": "citizen science",
"description": null,
"taxonomy": "tag",
"headData": {
"twImgId": null,
"twTitle": null,
"ogTitle": null,
"ogImgId": null,
"twDescription": null,
"description": null,
"title": "citizen science Archives | KQED Science",
"ogDescription": null
},
"ttid": 127,
"slug": "citizen-science",
"isLoading": false,
"link": "/science/tag/citizen-science"
},
"science_1841": {
"type": "terms",
"id": "science_1841",
"meta": {
"index": "terms_1716263798",
"site": "science",
"id": "1841",
"found": true
},
"relationships": {},
"featImg": null,
"name": "south napa earthquake",
"description": null,
"taxonomy": "tag",
"headData": {
"twImgId": null,
"twTitle": null,
"ogTitle": null,
"ogImgId": null,
"twDescription": null,
"description": null,
"title": "south napa earthquake Archives | KQED Science",
"ogDescription": null
},
"ttid": 1852,
"slug": "south-napa-earthquake",
"isLoading": false,
"link": "/science/tag/south-napa-earthquake"
},
"science_452": {
"type": "terms",
"id": "science_452",
"meta": {
"index": "terms_1716263798",
"site": "science",
"id": "452",
"found": true
},
"relationships": {},
"featImg": null,
"name": "greenhouse gas",
"description": null,
"taxonomy": "tag",
"headData": {
"twImgId": null,
"twTitle": null,
"ogTitle": null,
"ogImgId": null,
"twDescription": null,
"description": null,
"title": "greenhouse gas Archives | KQED Science",
"ogDescription": null
},
"ttid": 458,
"slug": "greenhouse-gas",
"isLoading": false,
"link": "/science/tag/greenhouse-gas"
},
"science_819": {
"type": "terms",
"id": "science_819",
"meta": {
"index": "terms_1716263798",
"site": "science",
"id": "819",
"found": true
},
"relationships": {},
"featImg": null,
"name": "lead",
"description": null,
"taxonomy": "tag",
"headData": {
"twImgId": null,
"twTitle": null,
"ogTitle": null,
"ogImgId": null,
"twDescription": null,
"description": null,
"title": "lead Archives | KQED Science",
"ogDescription": null
},
"ttid": 826,
"slug": "lead",
"isLoading": false,
"link": "/science/tag/lead"
},
"science_46": {
"type": "terms",
"id": "science_46",
"meta": {
"index": "terms_1716263798",
"site": "science",
"id": "46",
"found": true
},
"relationships": {},
"featImg": null,
"name": "Audio",
"description": null,
"taxonomy": "category",
"headData": {
"twImgId": null,
"twTitle": null,
"ogTitle": null,
"ogImgId": null,
"twDescription": null,
"description": null,
"title": "Audio Archives | KQED Science",
"ogDescription": null
},
"ttid": 48,
"slug": "audio",
"isLoading": false,
"link": "/science/category/audio"
},
"science_43": {
"type": "terms",
"id": "science_43",
"meta": {
"index": "terms_1716263798",
"site": "science",
"id": "43",
"found": true
},
"relationships": {},
"featImg": null,
"name": "Radio",
"description": null,
"taxonomy": "category",
"headData": {
"twImgId": null,
"twTitle": null,
"ogTitle": null,
"ogImgId": null,
"twDescription": null,
"description": null,
"title": "Radio Archives | KQED Science",
"ogDescription": null
},
"ttid": 45,
"slug": "radio",
"isLoading": false,
"link": "/science/category/radio"
},
"science_64": {
"type": "terms",
"id": "science_64",
"meta": {
"index": "terms_1716263798",
"site": "science",
"id": "64",
"found": true
},
"relationships": {},
"featImg": null,
"name": "full-image",
"description": null,
"taxonomy": "tag",
"headData": {
"twImgId": null,
"twTitle": null,
"ogTitle": null,
"ogImgId": null,
"twDescription": null,
"description": null,
"title": "full-image Archives | KQED Science",
"ogDescription": null
},
"ttid": 67,
"slug": "full-image",
"isLoading": false,
"link": "/science/tag/full-image"
}
},
"userPermissionsReducer": {
"wpLoggedIn": false
},
"eventsReducer": {},
"fssReducer": {},
"tvDailyScheduleReducer": {},
"tvWeeklyScheduleReducer": {},
"tvPrimetimeScheduleReducer": {},
"tvMonthlyScheduleReducer": {},
"userAccountReducer": {
"user": {
"email": null,
"emailStatus": "EMAIL_UNVALIDATED",
"loggedStatus": "LOGGED_OUT",
"loggingChecked": false,
"articles": [],
"firstName": null,
"lastName": null,
"phoneNumber": null,
"fetchingMembership": false,
"membershipError": false,
"memberships": [
{
"id": null,
"startDate": null,
"firstName": null,
"lastName": null,
"familyNumber": null,
"memberNumber": null,
"memberSince": null,
"expirationDate": null,
"pfsEligible": false,
"isSustaining": false,
"membershipLevel": "Prospect",
"membershipStatus": "Non Member",
"lastGiftDate": null,
"renewalDate": null,
"lastDonationAmount": null
}
]
},
"authModal": {
"isOpen": false,
"view": "LANDING_VIEW"
},
"error": null
},
"youthMediaReducer": {},
"checkPleaseReducer": {
"filterData": {
"region": {
"key": "Restaurant Region",
"filters": [
"Any Region"
]
},
"cuisine": {
"key": "Restaurant Cuisine",
"filters": [
"Any Cuisine"
]
}
},
"restaurantDataById": {},
"restaurantIdsSorted": [],
"error": null
},
"userAgentReducer": {
"userAgent": "Mozilla/5.0 AppleWebKit/537.36 (KHTML, like Gecko; compatible; ClaudeBot/1.0; +claudebot@anthropic.com)",
"isBot": true
},
"requestOutcomesReducer": {
"notFound": []
},
"navPromosReducer": {
"isFetching": false,
"fetchFailed": false,
"hasFetched": true,
"promos": {
"news": {
"name": "2026 Voter Guide",
"link": "/voterguide",
"imageURL": "https://cdn.kqed.org/wp-content/uploads/2026/10/Nav-News-Nov2026ElectionCoverage@2x-7bd4aad4.png",
"description": "Get informed in minutes with our Voter Guide for California’s November 3 election."
},
"podcasts-radio": {},
"video-tv": {},
"events": {},
"support": {}
}
}
}