window.__IS_SSR__=true
window.__INITIAL_STATE__={
"attachmentsReducer": {
"audio_0": {
"type": "attachments",
"id": "audio_0",
"imgSizes": {
"kqedFullSize": {
"file": "https://ww2.kqed.org/news/wp-content/themes/KQED-unified/img/audio_bgs/background0.jpg"
}
}
},
"audio_1": {
"type": "attachments",
"id": "audio_1",
"imgSizes": {
"kqedFullSize": {
"file": "https://ww2.kqed.org/news/wp-content/themes/KQED-unified/img/audio_bgs/background1.jpg"
}
}
},
"audio_2": {
"type": "attachments",
"id": "audio_2",
"imgSizes": {
"kqedFullSize": {
"file": "https://ww2.kqed.org/news/wp-content/themes/KQED-unified/img/audio_bgs/background2.jpg"
}
}
},
"audio_3": {
"type": "attachments",
"id": "audio_3",
"imgSizes": {
"kqedFullSize": {
"file": "https://ww2.kqed.org/news/wp-content/themes/KQED-unified/img/audio_bgs/background3.jpg"
}
}
},
"audio_4": {
"type": "attachments",
"id": "audio_4",
"imgSizes": {
"kqedFullSize": {
"file": "https://ww2.kqed.org/news/wp-content/themes/KQED-unified/img/audio_bgs/background4.jpg"
}
}
},
"placeholder": {
"type": "attachments",
"id": "placeholder",
"imgSizes": {
"thumbnail": {
"file": "https://cdn.kqed.org/wp-content/uploads/2024/12/KQED-Default-Image-816638274-2000x1333-1-160x107.jpg",
"width": 160,
"height": 107,
"mimeType": "image/jpeg"
},
"medium": {
"file": "https://cdn.kqed.org/wp-content/uploads/2024/12/KQED-Default-Image-816638274-2000x1333-1-800x533.jpg",
"width": 800,
"height": 533,
"mimeType": "image/jpeg"
},
"medium_large": {
"file": "https://cdn.kqed.org/wp-content/uploads/2024/12/KQED-Default-Image-816638274-2000x1333-1-768x512.jpg",
"width": 768,
"height": 512,
"mimeType": "image/jpeg"
},
"large": {
"file": "https://cdn.kqed.org/wp-content/uploads/2024/12/KQED-Default-Image-816638274-2000x1333-1-1020x680.jpg",
"width": 1020,
"height": 680,
"mimeType": "image/jpeg"
},
"1536x1536": {
"file": "https://cdn.kqed.org/wp-content/uploads/2024/12/KQED-Default-Image-816638274-2000x1333-1-1536x1024.jpg",
"width": 1536,
"height": 1024,
"mimeType": "image/jpeg"
},
"fd-lrg": {
"file": "https://cdn.kqed.org/wp-content/uploads/2024/12/KQED-Default-Image-816638274-2000x1333-1-1536x1024.jpg",
"width": 1536,
"height": 1024,
"mimeType": "image/jpeg"
},
"fd-med": {
"file": "https://cdn.kqed.org/wp-content/uploads/2024/12/KQED-Default-Image-816638274-2000x1333-1-1020x680.jpg",
"width": 1020,
"height": 680,
"mimeType": "image/jpeg"
},
"fd-sm": {
"file": "https://cdn.kqed.org/wp-content/uploads/2024/12/KQED-Default-Image-816638274-2000x1333-1-800x533.jpg",
"width": 800,
"height": 533,
"mimeType": "image/jpeg"
},
"post-thumbnail": {
"file": "https://cdn.kqed.org/wp-content/uploads/2024/12/KQED-Default-Image-816638274-2000x1333-1-672x372.jpg",
"width": 672,
"height": 372,
"mimeType": "image/jpeg"
},
"twentyfourteen-full-width": {
"file": "https://cdn.kqed.org/wp-content/uploads/2024/12/KQED-Default-Image-816638274-2000x1333-1-1038x576.jpg",
"width": 1038,
"height": 576,
"mimeType": "image/jpeg"
},
"xxsmall": {
"file": "https://cdn.kqed.org/wp-content/uploads/2024/12/KQED-Default-Image-816638274-2000x1333-1-160x107.jpg",
"width": 160,
"height": 107,
"mimeType": "image/jpeg"
},
"xsmall": {
"file": "https://cdn.kqed.org/wp-content/uploads/2024/12/KQED-Default-Image-816638274-2000x1333-1-672x372.jpg",
"width": 672,
"height": 372,
"mimeType": "image/jpeg"
},
"small": {
"file": "https://cdn.kqed.org/wp-content/uploads/2024/12/KQED-Default-Image-816638274-2000x1333-1-672x372.jpg",
"width": 672,
"height": 372,
"mimeType": "image/jpeg"
},
"xlarge": {
"file": "https://cdn.kqed.org/wp-content/uploads/2024/12/KQED-Default-Image-816638274-2000x1333-1-1020x680.jpg",
"width": 1020,
"height": 680,
"mimeType": "image/jpeg"
},
"full-width": {
"file": "https://cdn.kqed.org/wp-content/uploads/2024/12/KQED-Default-Image-816638274-2000x1333-1-1920x1280.jpg",
"width": 1920,
"height": 1280,
"mimeType": "image/jpeg"
},
"guest-author-32": {
"file": "https://cdn.kqed.org/wp-content/uploads/2025/01/KQED-Default-Image-816638274-1333x1333-1-160x160.jpg",
"width": 32,
"height": 32,
"mimeType": "image/jpeg"
},
"guest-author-50": {
"file": "https://cdn.kqed.org/wp-content/uploads/2025/01/KQED-Default-Image-816638274-1333x1333-1-160x160.jpg",
"width": 50,
"height": 50,
"mimeType": "image/jpeg"
},
"guest-author-64": {
"file": "https://cdn.kqed.org/wp-content/uploads/2025/01/KQED-Default-Image-816638274-1333x1333-1-160x160.jpg",
"width": 64,
"height": 64,
"mimeType": "image/jpeg"
},
"guest-author-96": {
"file": "https://cdn.kqed.org/wp-content/uploads/2025/01/KQED-Default-Image-816638274-1333x1333-1-160x160.jpg",
"width": 96,
"height": 96,
"mimeType": "image/jpeg"
},
"guest-author-128": {
"file": "https://cdn.kqed.org/wp-content/uploads/2025/01/KQED-Default-Image-816638274-1333x1333-1-160x160.jpg",
"width": 128,
"height": 128,
"mimeType": "image/jpeg"
},
"detail": {
"file": "https://cdn.kqed.org/wp-content/uploads/2025/01/KQED-Default-Image-816638274-1333x1333-1-160x160.jpg",
"width": 160,
"height": 160,
"mimeType": "image/jpeg"
},
"kqedFullSize": {
"file": "https://cdn.kqed.org/wp-content/uploads/2024/12/KQED-Default-Image-816638274-2000x1333-1.jpg",
"width": 2000,
"height": 1333
}
}
},
"science_287870": {
"type": "attachments",
"id": "science_287870",
"meta": {
"index": "attachments_1716263798",
"site": "science",
"id": "287870",
"found": true
},
"parent": 286593,
"imgSizes": {
"twentyfourteen-full-width": {
"file": "https://ww2.kqed.org/app/uploads/sites/35/2015/10/dubois-on-stanislaus-1038x576.jpg",
"width": 1038,
"mimeType": "image/jpeg",
"height": 576
},
"thumbnail": {
"file": "https://ww2.kqed.org/app/uploads/sites/35/2015/10/dubois-on-stanislaus-400x225.jpg",
"width": 400,
"mimeType": "image/jpeg",
"height": 225
},
"fd-sm": {
"file": "https://ww2.kqed.org/app/uploads/sites/35/2015/10/dubois-on-stanislaus-960x540.jpg",
"width": 960,
"mimeType": "image/jpeg",
"height": 540
},
"post-thumbnail": {
"file": "https://ww2.kqed.org/app/uploads/sites/35/2015/10/dubois-on-stanislaus-672x372.jpg",
"width": 672,
"mimeType": "image/jpeg",
"height": 372
},
"kqedFullSize": {
"file": "https://ww2.kqed.org/app/uploads/sites/35/2015/10/dubois-on-stanislaus-e1443806038291.jpg",
"width": 1920,
"height": 1080
},
"large": {
"file": "https://ww2.kqed.org/app/uploads/sites/35/2015/10/dubois-on-stanislaus-1440x810.jpg",
"width": 1440,
"mimeType": "image/jpeg",
"height": 810
},
"guest-author-96": {
"file": "https://ww2.kqed.org/app/uploads/sites/35/2015/10/dubois-on-stanislaus-96x96.jpg",
"width": 96,
"mimeType": "image/jpeg",
"height": 96
},
"medium": {
"file": "https://ww2.kqed.org/app/uploads/sites/35/2015/10/dubois-on-stanislaus-800x450.jpg",
"width": 800,
"mimeType": "image/jpeg",
"height": 450
},
"guest-author-64": {
"file": "https://ww2.kqed.org/app/uploads/sites/35/2015/10/dubois-on-stanislaus-64x64.jpg",
"width": 64,
"mimeType": "image/jpeg",
"height": 64
},
"guest-author-32": {
"file": "https://ww2.kqed.org/app/uploads/sites/35/2015/10/dubois-on-stanislaus-32x32.jpg",
"width": 32,
"mimeType": "image/jpeg",
"height": 32
},
"fd-lrg": {
"file": "https://ww2.kqed.org/app/uploads/sites/35/2015/10/dubois-on-stanislaus-1920x1080.jpg",
"width": 1920,
"mimeType": "image/jpeg",
"height": 1080
},
"fd-med": {
"file": "https://ww2.kqed.org/app/uploads/sites/35/2015/10/dubois-on-stanislaus-1180x664.jpg",
"width": 1180,
"mimeType": "image/jpeg",
"height": 664
},
"detail": {
"file": "https://ww2.kqed.org/app/uploads/sites/35/2015/10/dubois-on-stanislaus-75x75.jpg",
"width": 75,
"mimeType": "image/jpeg",
"height": 75
},
"guest-author-128": {
"file": "https://ww2.kqed.org/app/uploads/sites/35/2015/10/dubois-on-stanislaus-128x128.jpg",
"width": 128,
"mimeType": "image/jpeg",
"height": 128
}
},
"publishDate": 1443805985,
"modified": 1443824964,
"caption": "Mark Dubois rafting the Stanislaus for the first time in more than three decades. Dubois is considered an icon among river advocates.",
"description": "Mark Dubois rafting the Stanislaus for the first time in more than three decades. Dubois is considered an icon among river advocates.",
"title": "dubois on stanislaus",
"credit": "Craig Miller/KQED",
"status": "inherit",
"isLoading": false,
"fetchFailed": false
},
"science_10732": {
"type": "attachments",
"id": "science_10732",
"meta": {
"index": "attachments_1716263798",
"site": "science",
"id": "10732",
"found": true
},
"parent": 10727,
"imgSizes": {
"kqedFullSize": {
"file": "https://ww2.kqed.org/app/uploads/sites/35/2013/11/RS696_Download090427-061-scr.jpg",
"width": 850,
"height": 638
}
},
"publishDate": 1383701736,
"modified": 1443633742,
"caption": "Calif. lawmakers halted a bill that would have mandated deep greenhouse gas emissions cuts by the year 2050.",
"description": "California's climate change policies are cutting emissions, but not enough, according to a report from Berkeley Lab. (Craig Miller/KQED)",
"title": "RS696_Download090427 061-scr",
"credit": "Craig Miller/KQED",
"status": "inherit",
"isLoading": false,
"fetchFailed": false
},
"science_267718": {
"type": "attachments",
"id": "science_267718",
"meta": {
"index": "attachments_1716263798",
"site": "science",
"id": "267718",
"found": true
},
"parent": 255377,
"imgSizes": {
"twentyfourteen-full-width": {
"file": "https://ww2.kqed.org/app/uploads/sites/35/2015/09/PGE-tree-limb-removal-e1442855479419-1038x576.jpg",
"width": 1038,
"mimeType": "image/jpeg",
"height": 576
},
"thumbnail": {
"file": "https://ww2.kqed.org/app/uploads/sites/35/2015/09/PGE-tree-limb-removal-e1442855479419-400x263.jpg",
"width": 400,
"mimeType": "image/jpeg",
"height": 263
},
"fd-sm": {
"file": "https://ww2.kqed.org/app/uploads/sites/35/2015/09/PGE-tree-limb-removal-e1442855479419-960x631.jpg",
"width": 960,
"mimeType": "image/jpeg",
"height": 631
},
"post-thumbnail": {
"file": "https://ww2.kqed.org/app/uploads/sites/35/2015/09/PGE-tree-limb-removal-e1442855479419-672x372.jpg",
"width": 672,
"mimeType": "image/jpeg",
"height": 372
},
"kqedFullSize": {
"file": "https://ww2.kqed.org/app/uploads/sites/35/2015/09/PGE-tree-limb-removal-e1442855479419.jpg",
"width": 1632,
"height": 1073
},
"large": {
"file": "https://ww2.kqed.org/app/uploads/sites/35/2015/09/PGE-tree-limb-removal-e1442855479419-1440x947.jpg",
"width": 1440,
"mimeType": "image/jpeg",
"height": 947
},
"guest-author-96": {
"file": "https://ww2.kqed.org/app/uploads/sites/35/2015/09/PGE-tree-limb-removal-e1442855479419-96x96.jpg",
"width": 96,
"mimeType": "image/jpeg",
"height": 96
},
"medium": {
"file": "https://ww2.kqed.org/app/uploads/sites/35/2015/09/PGE-tree-limb-removal-e1442855479419-800x526.jpg",
"width": 800,
"mimeType": "image/jpeg",
"height": 526
},
"guest-author-64": {
"file": "https://ww2.kqed.org/app/uploads/sites/35/2015/09/PGE-tree-limb-removal-e1442855479419-64x64.jpg",
"width": 64,
"mimeType": "image/jpeg",
"height": 64
},
"guest-author-32": {
"file": "https://ww2.kqed.org/app/uploads/sites/35/2015/09/PGE-tree-limb-removal-e1442855479419-32x32.jpg",
"width": 32,
"mimeType": "image/jpeg",
"height": 32
},
"fd-med": {
"file": "https://ww2.kqed.org/app/uploads/sites/35/2015/09/PGE-tree-limb-removal-e1442855479419-1180x776.jpg",
"width": 1180,
"mimeType": "image/jpeg",
"height": 776
},
"detail": {
"file": "https://ww2.kqed.org/app/uploads/sites/35/2015/09/PGE-tree-limb-removal-e1442855479419-75x75.jpg",
"width": 75,
"mimeType": "image/jpeg",
"height": 75
},
"guest-author-128": {
"file": "https://ww2.kqed.org/app/uploads/sites/35/2015/09/PGE-tree-limb-removal-e1442855479419-128x128.jpg",
"width": 128,
"mimeType": "image/jpeg",
"height": 128
}
},
"publishDate": 1442855090,
"modified": 1443041119,
"caption": "General Foreman Rene Landa holds a segment of a tree limb that was removed from a Douglas fir. The conifer is dying and close to a power line. ",
"description": null,
"title": "drought trees PGE",
"credit": "Lindsey Hoshaw/KQED",
"status": "inherit",
"isLoading": false,
"fetchFailed": false
},
"science_273867": {
"type": "attachments",
"id": "science_273867",
"meta": {
"index": "attachments_1716263798",
"site": "science",
"id": "273867",
"found": true
},
"parent": 273866,
"imgSizes": {
"twentyfourteen-full-width": {
"file": "https://ww2.kqed.org/app/uploads/sites/35/2015/09/IMG_0022-1038x576.jpg",
"width": 1038,
"mimeType": "image/jpeg",
"height": 576
},
"thumbnail": {
"file": "https://ww2.kqed.org/app/uploads/sites/35/2015/09/IMG_0022-400x267.jpg",
"width": 400,
"mimeType": "image/jpeg",
"height": 267
},
"fd-sm": {
"file": "https://ww2.kqed.org/app/uploads/sites/35/2015/09/IMG_0022-960x640.jpg",
"width": 960,
"mimeType": "image/jpeg",
"height": 640
},
"post-thumbnail": {
"file": "https://ww2.kqed.org/app/uploads/sites/35/2015/09/IMG_0022-672x372.jpg",
"width": 672,
"mimeType": "image/jpeg",
"height": 372
},
"kqedFullSize": {
"file": "https://ww2.kqed.org/app/uploads/sites/35/2015/09/IMG_0022.jpg",
"width": 5184,
"height": 3456
},
"large": {
"file": "https://ww2.kqed.org/app/uploads/sites/35/2015/09/IMG_0022-1440x960.jpg",
"width": 1440,
"mimeType": "image/jpeg",
"height": 960
},
"guest-author-96": {
"file": "https://ww2.kqed.org/app/uploads/sites/35/2015/09/IMG_0022-96x96.jpg",
"width": 96,
"mimeType": "image/jpeg",
"height": 96
},
"medium": {
"file": "https://ww2.kqed.org/app/uploads/sites/35/2015/09/IMG_0022-800x533.jpg",
"width": 800,
"mimeType": "image/jpeg",
"height": 533
},
"guest-author-64": {
"file": "https://ww2.kqed.org/app/uploads/sites/35/2015/09/IMG_0022-64x64.jpg",
"width": 64,
"mimeType": "image/jpeg",
"height": 64
},
"guest-author-32": {
"file": "https://ww2.kqed.org/app/uploads/sites/35/2015/09/IMG_0022-32x32.jpg",
"width": 32,
"mimeType": "image/jpeg",
"height": 32
},
"fd-lrg": {
"file": "https://ww2.kqed.org/app/uploads/sites/35/2015/09/IMG_0022-1920x1280.jpg",
"width": 1920,
"mimeType": "image/jpeg",
"height": 1280
},
"fd-med": {
"file": "https://ww2.kqed.org/app/uploads/sites/35/2015/09/IMG_0022-1180x787.jpg",
"width": 1180,
"mimeType": "image/jpeg",
"height": 787
},
"detail": {
"file": "https://ww2.kqed.org/app/uploads/sites/35/2015/09/IMG_0022-75x75.jpg",
"width": 75,
"mimeType": "image/jpeg",
"height": 75
},
"guest-author-128": {
"file": "https://ww2.kqed.org/app/uploads/sites/35/2015/09/IMG_0022-128x128.jpg",
"width": 128,
"mimeType": "image/jpeg",
"height": 128
}
},
"publishDate": 1443149677,
"modified": 1443150171,
"caption": "Native plants growing in division beds are tended by staff and volunteers from Save the Bay.",
"description": null,
"title": "Division Beds at Oro Loma",
"credit": "Vivian Reed, Save the Bay",
"status": "inherit",
"isLoading": false,
"fetchFailed": false
},
"science_270240": {
"type": "attachments",
"id": "science_270240",
"meta": {
"index": "attachments_1716263798",
"site": "science",
"id": "270240",
"found": true
},
"parent": 270178,
"imgSizes": {
"thumbnail": {
"file": "https://ww2.kqed.org/app/uploads/sites/35/2015/09/LindaBaja_md_NASA-400x309.jpg",
"width": 400,
"mimeType": "image/jpeg",
"height": 309
},
"post-thumbnail": {
"file": "https://ww2.kqed.org/app/uploads/sites/35/2015/09/LindaBaja_md_NASA-672x372.jpg",
"width": 672,
"mimeType": "image/jpeg",
"height": 372
},
"kqedFullSize": {
"file": "https://ww2.kqed.org/app/uploads/sites/35/2015/09/LindaBaja_md_NASA.jpg",
"width": 732,
"height": 566
},
"guest-author-96": {
"file": "https://ww2.kqed.org/app/uploads/sites/35/2015/09/LindaBaja_md_NASA-96x96.jpg",
"width": 96,
"mimeType": "image/jpeg",
"height": 96
},
"guest-author-64": {
"file": "https://ww2.kqed.org/app/uploads/sites/35/2015/09/LindaBaja_md_NASA-64x64.jpg",
"width": 64,
"mimeType": "image/jpeg",
"height": 64
},
"detail": {
"file": "https://ww2.kqed.org/app/uploads/sites/35/2015/09/LindaBaja_md_NASA-75x75.jpg",
"width": 75,
"mimeType": "image/jpeg",
"height": 75
},
"guest-author-32": {
"file": "https://ww2.kqed.org/app/uploads/sites/35/2015/09/LindaBaja_md_NASA-32x32.jpg",
"width": 32,
"mimeType": "image/jpeg",
"height": 32
},
"guest-author-128": {
"file": "https://ww2.kqed.org/app/uploads/sites/35/2015/09/LindaBaja_md_NASA-128x128.jpg",
"width": 128,
"mimeType": "image/jpeg",
"height": 128
}
},
"publishDate": 1442966394,
"modified": 1442966464,
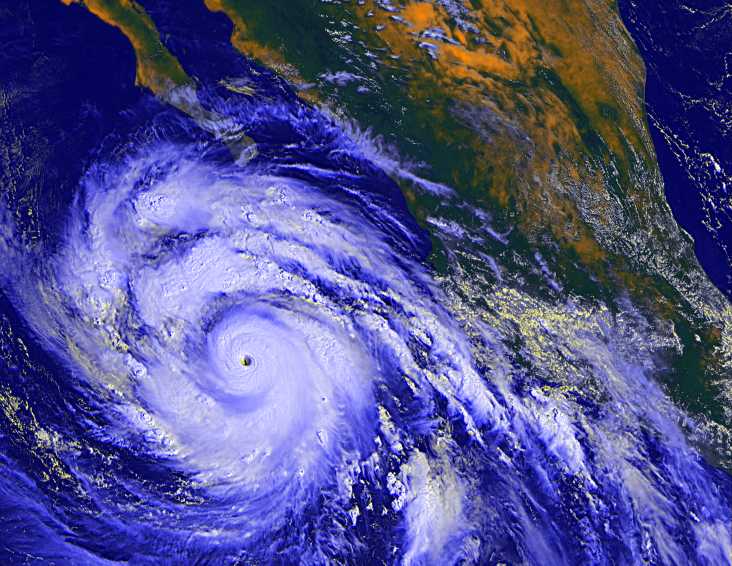
"caption": "Hurricane Linda roars past Baja California, spreading upper-level moisture far to the north.",
"description": "Hurricane Linda roars past Baja California, spreading upper-level moisture far to the north.",
"title": "LindaBaja_md_NASA",
"credit": "NASA",
"status": "inherit",
"isLoading": false,
"fetchFailed": false
},
"science_258300": {
"type": "attachments",
"id": "science_258300",
"meta": {
"index": "attachments_1716263798",
"site": "science",
"id": "258300",
"found": true
},
"parent": 255463,
"imgSizes": {
"twentyfourteen-full-width": {
"file": "https://ww2.kqed.org/app/uploads/sites/35/2015/09/RS16226_GettyImages-482741006-qut-1038x576.jpg",
"width": 1038,
"mimeType": "image/jpeg",
"height": 576
},
"thumbnail": {
"file": "https://ww2.kqed.org/app/uploads/sites/35/2015/09/RS16226_GettyImages-482741006-qut-400x246.jpg",
"width": 400,
"mimeType": "image/jpeg",
"height": 246
},
"fd-sm": {
"file": "https://ww2.kqed.org/app/uploads/sites/35/2015/09/RS16226_GettyImages-482741006-qut-960x592.jpg",
"width": 960,
"mimeType": "image/jpeg",
"height": 592
},
"post-thumbnail": {
"file": "https://ww2.kqed.org/app/uploads/sites/35/2015/09/RS16226_GettyImages-482741006-qut-672x372.jpg",
"width": 672,
"mimeType": "image/jpeg",
"height": 372
},
"kqedFullSize": {
"file": "https://ww2.kqed.org/app/uploads/sites/35/2015/09/RS16226_GettyImages-482741006-qut.jpg",
"width": 1920,
"height": 1183
},
"large": {
"file": "https://ww2.kqed.org/app/uploads/sites/35/2015/09/RS16226_GettyImages-482741006-qut-1440x887.jpg",
"width": 1440,
"mimeType": "image/jpeg",
"height": 887
},
"guest-author-96": {
"file": "https://ww2.kqed.org/app/uploads/sites/35/2015/09/RS16226_GettyImages-482741006-qut-96x96.jpg",
"width": 96,
"mimeType": "image/jpeg",
"height": 96
},
"medium": {
"file": "https://ww2.kqed.org/app/uploads/sites/35/2015/09/RS16226_GettyImages-482741006-qut-800x493.jpg",
"width": 800,
"mimeType": "image/jpeg",
"height": 493
},
"guest-author-64": {
"file": "https://ww2.kqed.org/app/uploads/sites/35/2015/09/RS16226_GettyImages-482741006-qut-64x64.jpg",
"width": 64,
"mimeType": "image/jpeg",
"height": 64
},
"guest-author-32": {
"file": "https://ww2.kqed.org/app/uploads/sites/35/2015/09/RS16226_GettyImages-482741006-qut-32x32.jpg",
"width": 32,
"mimeType": "image/jpeg",
"height": 32
},
"fd-lrg": {
"file": "https://ww2.kqed.org/app/uploads/sites/35/2015/09/RS16226_GettyImages-482741006-qut-1920x1183.jpg",
"width": 1920,
"mimeType": "image/jpeg",
"height": 1183
},
"fd-med": {
"file": "https://ww2.kqed.org/app/uploads/sites/35/2015/09/RS16226_GettyImages-482741006-qut-1180x727.jpg",
"width": 1180,
"mimeType": "image/jpeg",
"height": 727
},
"detail": {
"file": "https://ww2.kqed.org/app/uploads/sites/35/2015/09/RS16226_GettyImages-482741006-qut-75x75.jpg",
"width": 75,
"mimeType": "image/jpeg",
"height": 75
},
"guest-author-128": {
"file": "https://ww2.kqed.org/app/uploads/sites/35/2015/09/RS16226_GettyImages-482741006-qut-128x128.jpg",
"width": 128,
"mimeType": "image/jpeg",
"height": 128
}
},
"publishDate": 1442453605,
"modified": 1442453727,
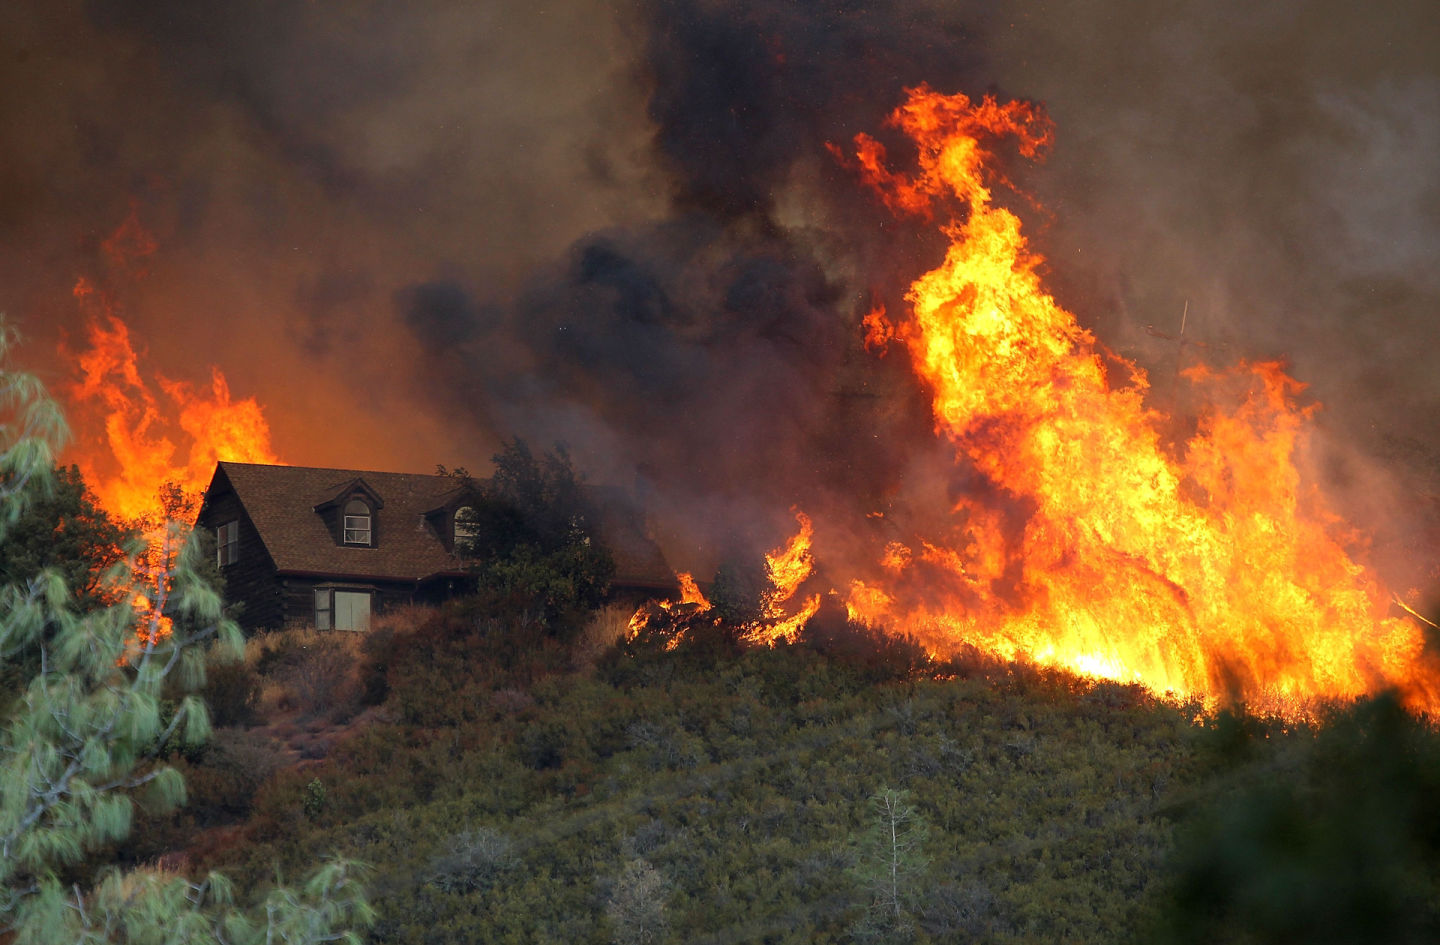
"caption": "The Rocky Fire was the first of the big Lake County fires this year to stun firefighters with its rapid growth and ferocity.",
"description": "The Rocky Fire was the first of the big Lake County fires this year to stun firefighters with its rapid growth and ferocity.",
"title": "RS16226_GettyImages-482741006-qut",
"credit": "Josh Edelson/AFP/Getty Images",
"status": "inherit",
"isLoading": false,
"fetchFailed": false
},
"science_247872": {
"type": "attachments",
"id": "science_247872",
"meta": {
"index": "attachments_1716263798",
"site": "science",
"id": "247872",
"found": true
},
"parent": 247785,
"imgSizes": {
"twentyfourteen-full-width": {
"file": "https://ww2.kqed.org/app/uploads/sites/35/2015/09/Turbines2b-1038x576.jpg",
"width": 1038,
"mimeType": "image/jpeg",
"height": 576
},
"thumbnail": {
"file": "https://ww2.kqed.org/app/uploads/sites/35/2015/09/Turbines2b-400x246.jpg",
"width": 400,
"mimeType": "image/jpeg",
"height": 246
},
"fd-sm": {
"file": "https://ww2.kqed.org/app/uploads/sites/35/2015/09/Turbines2b-960x591.jpg",
"width": 960,
"mimeType": "image/jpeg",
"height": 591
},
"post-thumbnail": {
"file": "https://ww2.kqed.org/app/uploads/sites/35/2015/09/Turbines2b-672x372.jpg",
"width": 672,
"mimeType": "image/jpeg",
"height": 372
},
"kqedFullSize": {
"file": "https://ww2.kqed.org/app/uploads/sites/35/2015/09/Turbines2b.jpg",
"width": 1623,
"height": 1000
},
"large": {
"file": "https://ww2.kqed.org/app/uploads/sites/35/2015/09/Turbines2b-1440x887.jpg",
"width": 1440,
"mimeType": "image/jpeg",
"height": 887
},
"guest-author-96": {
"file": "https://ww2.kqed.org/app/uploads/sites/35/2015/09/Turbines2b-96x96.jpg",
"width": 96,
"mimeType": "image/jpeg",
"height": 96
},
"medium": {
"file": "https://ww2.kqed.org/app/uploads/sites/35/2015/09/Turbines2b-800x493.jpg",
"width": 800,
"mimeType": "image/jpeg",
"height": 493
},
"guest-author-64": {
"file": "https://ww2.kqed.org/app/uploads/sites/35/2015/09/Turbines2b-64x64.jpg",
"width": 64,
"mimeType": "image/jpeg",
"height": 64
},
"guest-author-32": {
"file": "https://ww2.kqed.org/app/uploads/sites/35/2015/09/Turbines2b-32x32.jpg",
"width": 32,
"mimeType": "image/jpeg",
"height": 32
},
"fd-med": {
"file": "https://ww2.kqed.org/app/uploads/sites/35/2015/09/Turbines2b-1180x727.jpg",
"width": 1180,
"mimeType": "image/jpeg",
"height": 727
},
"detail": {
"file": "https://ww2.kqed.org/app/uploads/sites/35/2015/09/Turbines2b-75x75.jpg",
"width": 75,
"mimeType": "image/jpeg",
"height": 75
},
"guest-author-128": {
"file": "https://ww2.kqed.org/app/uploads/sites/35/2015/09/Turbines2b-128x128.jpg",
"width": 128,
"mimeType": "image/jpeg",
"height": 128
}
},
"publishDate": 1441993164,
"modified": 1441996956,
"caption": "Wind turbines like these in Solano County might reduce dependence on fossil fuels, but the trade-offs in wildlife deaths are hard to tally.",
"description": null,
"title": "Wind Power",
"credit": "Daniel Potter/KQED",
"status": "inherit",
"isLoading": false,
"fetchFailed": false
},
"science_235481": {
"type": "attachments",
"id": "science_235481",
"meta": {
"index": "attachments_1716263798",
"site": "science",
"id": "235481",
"found": true
},
"parent": 235245,
"imgSizes": {
"twentyfourteen-full-width": {
"file": "https://ww2.kqed.org/app/uploads/sites/35/2015/09/abalone-eggs_small-1038x576.jpg",
"width": 1038,
"mimeType": "image/jpeg",
"height": 576
},
"thumbnail": {
"file": "https://ww2.kqed.org/app/uploads/sites/35/2015/09/abalone-eggs_small-400x225.jpg",
"width": 400,
"mimeType": "image/jpeg",
"height": 225
},
"fd-sm": {
"file": "https://ww2.kqed.org/app/uploads/sites/35/2015/09/abalone-eggs_small-960x540.jpg",
"width": 960,
"mimeType": "image/jpeg",
"height": 540
},
"post-thumbnail": {
"file": "https://ww2.kqed.org/app/uploads/sites/35/2015/09/abalone-eggs_small-672x372.jpg",
"width": 672,
"mimeType": "image/jpeg",
"height": 372
},
"kqedFullSize": {
"file": "https://ww2.kqed.org/app/uploads/sites/35/2015/09/abalone-eggs_small.jpg",
"width": 2560,
"height": 1440
},
"large": {
"file": "https://ww2.kqed.org/app/uploads/sites/35/2015/09/abalone-eggs_small-1440x810.jpg",
"width": 1440,
"mimeType": "image/jpeg",
"height": 810
},
"guest-author-96": {
"file": "https://ww2.kqed.org/app/uploads/sites/35/2015/09/abalone-eggs_small-96x96.jpg",
"width": 96,
"mimeType": "image/jpeg",
"height": 96
},
"medium": {
"file": "https://ww2.kqed.org/app/uploads/sites/35/2015/09/abalone-eggs_small-800x450.jpg",
"width": 800,
"mimeType": "image/jpeg",
"height": 450
},
"guest-author-64": {
"file": "https://ww2.kqed.org/app/uploads/sites/35/2015/09/abalone-eggs_small-64x64.jpg",
"width": 64,
"mimeType": "image/jpeg",
"height": 64
},
"guest-author-32": {
"file": "https://ww2.kqed.org/app/uploads/sites/35/2015/09/abalone-eggs_small-32x32.jpg",
"width": 32,
"mimeType": "image/jpeg",
"height": 32
},
"fd-lrg": {
"file": "https://ww2.kqed.org/app/uploads/sites/35/2015/09/abalone-eggs_small-1920x1080.jpg",
"width": 1920,
"mimeType": "image/jpeg",
"height": 1080
},
"fd-med": {
"file": "https://ww2.kqed.org/app/uploads/sites/35/2015/09/abalone-eggs_small-1180x664.jpg",
"width": 1180,
"mimeType": "image/jpeg",
"height": 664
},
"detail": {
"file": "https://ww2.kqed.org/app/uploads/sites/35/2015/09/abalone-eggs_small-75x75.jpg",
"width": 75,
"mimeType": "image/jpeg",
"height": 75
},
"guest-author-128": {
"file": "https://ww2.kqed.org/app/uploads/sites/35/2015/09/abalone-eggs_small-128x128.jpg",
"width": 128,
"mimeType": "image/jpeg",
"height": 128
}
},
"publishDate": 1441413307,
"modified": 1441413516,
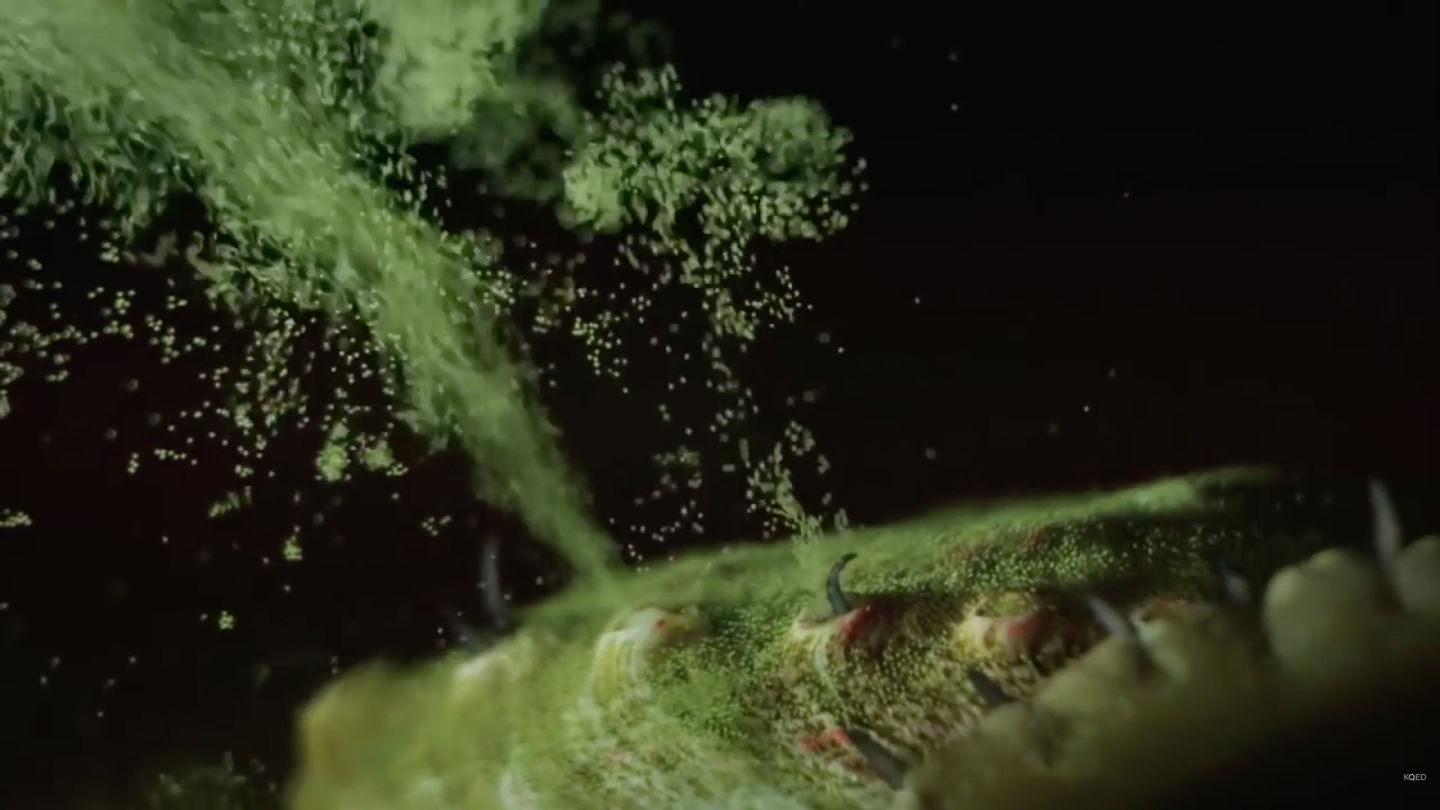
"caption": "This female abalone, an edible sea snail, releases tiny green eggs into the ocean to fertilize with sperm from the male abalone.",
"description": null,
"title": "abalone eggs_small",
"credit": "KQED",
"status": "inherit",
"isLoading": false,
"fetchFailed": false
},
"science_229588": {
"type": "attachments",
"id": "science_229588",
"meta": {
"index": "attachments_1716263798",
"site": "science",
"id": "229588",
"found": true
},
"parent": 229506,
"imgSizes": {
"twentyfourteen-full-width": {
"file": "https://ww2.kqed.org/app/uploads/sites/35/2015/09/RS16238_GettyImages-482608228-qut-1038x576.jpg",
"width": 1038,
"mimeType": "image/jpeg",
"height": 576
},
"thumbnail": {
"file": "https://ww2.kqed.org/app/uploads/sites/35/2015/09/RS16238_GettyImages-482608228-qut-400x263.jpg",
"width": 400,
"mimeType": "image/jpeg",
"height": 263
},
"fd-sm": {
"file": "https://ww2.kqed.org/app/uploads/sites/35/2015/09/RS16238_GettyImages-482608228-qut-960x630.jpg",
"width": 960,
"mimeType": "image/jpeg",
"height": 630
},
"post-thumbnail": {
"file": "https://ww2.kqed.org/app/uploads/sites/35/2015/09/RS16238_GettyImages-482608228-qut-672x372.jpg",
"width": 672,
"mimeType": "image/jpeg",
"height": 372
},
"kqedFullSize": {
"file": "https://ww2.kqed.org/app/uploads/sites/35/2015/09/RS16238_GettyImages-482608228-qut.jpg",
"width": 1920,
"height": 1260
},
"large": {
"file": "https://ww2.kqed.org/app/uploads/sites/35/2015/09/RS16238_GettyImages-482608228-qut-1440x945.jpg",
"width": 1440,
"mimeType": "image/jpeg",
"height": 945
},
"guest-author-96": {
"file": "https://ww2.kqed.org/app/uploads/sites/35/2015/09/RS16238_GettyImages-482608228-qut-96x96.jpg",
"width": 96,
"mimeType": "image/jpeg",
"height": 96
},
"medium": {
"file": "https://ww2.kqed.org/app/uploads/sites/35/2015/09/RS16238_GettyImages-482608228-qut-800x525.jpg",
"width": 800,
"mimeType": "image/jpeg",
"height": 525
},
"guest-author-64": {
"file": "https://ww2.kqed.org/app/uploads/sites/35/2015/09/RS16238_GettyImages-482608228-qut-64x64.jpg",
"width": 64,
"mimeType": "image/jpeg",
"height": 64
},
"guest-author-32": {
"file": "https://ww2.kqed.org/app/uploads/sites/35/2015/09/RS16238_GettyImages-482608228-qut-32x32.jpg",
"width": 32,
"mimeType": "image/jpeg",
"height": 32
},
"fd-lrg": {
"file": "https://ww2.kqed.org/app/uploads/sites/35/2015/09/RS16238_GettyImages-482608228-qut-1920x1260.jpg",
"width": 1920,
"mimeType": "image/jpeg",
"height": 1260
},
"fd-med": {
"file": "https://ww2.kqed.org/app/uploads/sites/35/2015/09/RS16238_GettyImages-482608228-qut-1180x774.jpg",
"width": 1180,
"mimeType": "image/jpeg",
"height": 774
},
"detail": {
"file": "https://ww2.kqed.org/app/uploads/sites/35/2015/09/RS16238_GettyImages-482608228-qut-75x75.jpg",
"width": 75,
"mimeType": "image/jpeg",
"height": 75
},
"guest-author-128": {
"file": "https://ww2.kqed.org/app/uploads/sites/35/2015/09/RS16238_GettyImages-482608228-qut-128x128.jpg",
"width": 128,
"mimeType": "image/jpeg",
"height": 128
}
},
"publishDate": 1441135513,
"modified": 1441135607,
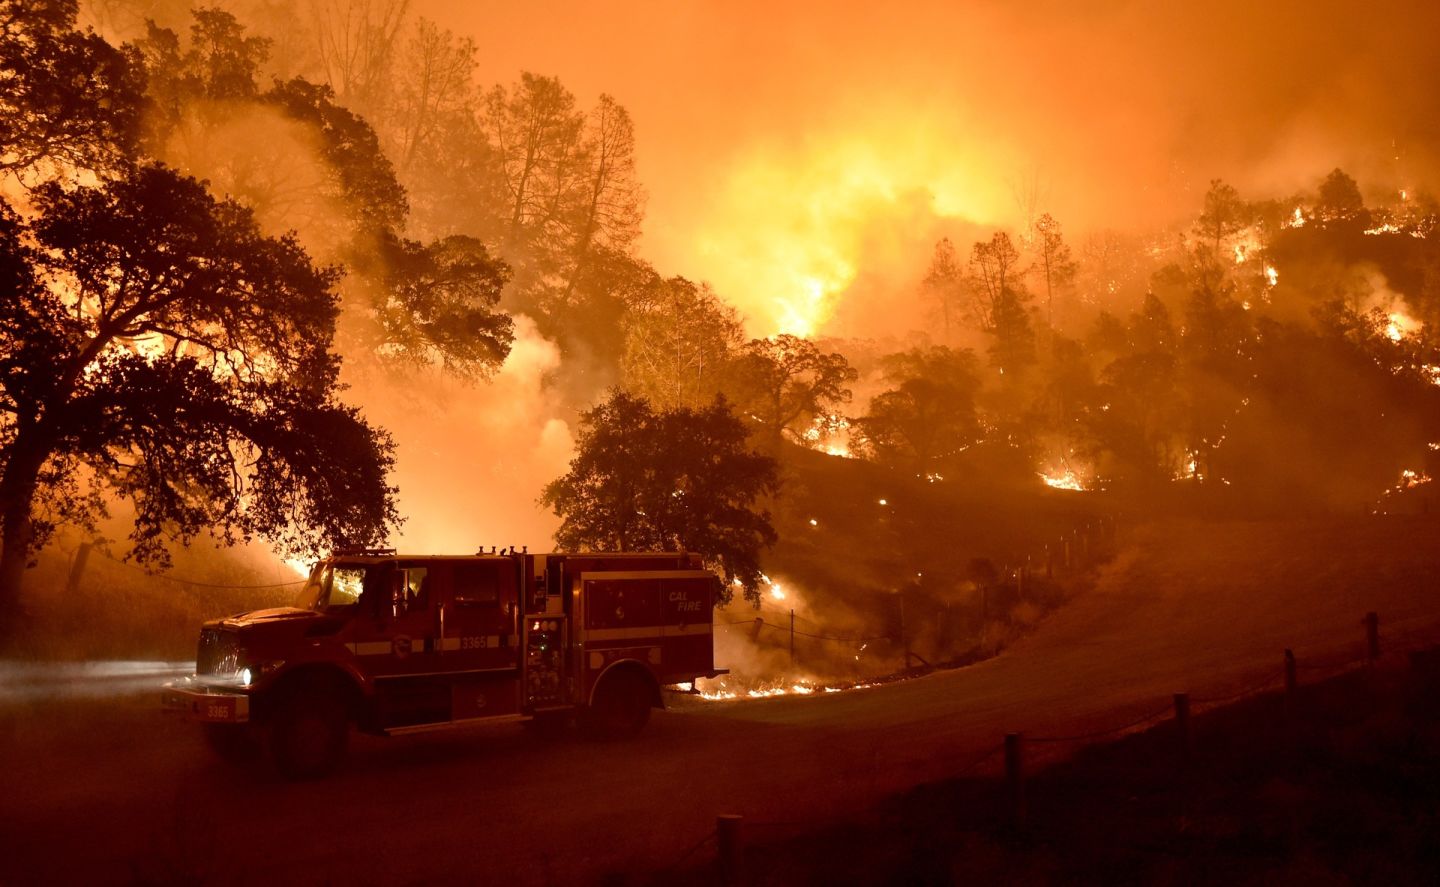
"caption": "Characterized by its rapid growth, the Rocky Fire claimed nearly 70,000 acres north of the Bay Area in August.",
"description": "Characterized by its rapid growth, the Rocky Fire claimed nearly 70,000 acres north of the Bay Area in August.",
"title": "RS16238_GettyImages-482608228-qut",
"credit": "Justin Sullivan/Getty Images",
"status": "inherit",
"isLoading": false,
"fetchFailed": false
},
"science_219522": {
"type": "attachments",
"id": "science_219522",
"meta": {
"index": "attachments_1716263798",
"site": "science",
"id": "219522",
"found": true
},
"parent": 218798,
"imgSizes": {
"twentyfourteen-full-width": {
"file": "https://ww2.kqed.org/app/uploads/sites/35/2015/08/July-water-conservation-map_for-web-1038x576.jpg",
"width": 1038,
"mimeType": "image/jpeg",
"height": 576
},
"thumbnail": {
"file": "https://ww2.kqed.org/app/uploads/sites/35/2015/08/July-water-conservation-map_for-web-400x211.jpg",
"width": 400,
"mimeType": "image/jpeg",
"height": 211
},
"fd-sm": {
"file": "https://ww2.kqed.org/app/uploads/sites/35/2015/08/July-water-conservation-map_for-web-960x506.jpg",
"width": 960,
"mimeType": "image/jpeg",
"height": 506
},
"post-thumbnail": {
"file": "https://ww2.kqed.org/app/uploads/sites/35/2015/08/July-water-conservation-map_for-web-672x372.jpg",
"width": 672,
"mimeType": "image/jpeg",
"height": 372
},
"kqedFullSize": {
"file": "https://ww2.kqed.org/app/uploads/sites/35/2015/08/July-water-conservation-map_for-web.jpg",
"width": 1998,
"height": 1054
},
"large": {
"file": "https://ww2.kqed.org/app/uploads/sites/35/2015/08/July-water-conservation-map_for-web-1440x760.jpg",
"width": 1440,
"mimeType": "image/jpeg",
"height": 760
},
"guest-author-96": {
"file": "https://ww2.kqed.org/app/uploads/sites/35/2015/08/July-water-conservation-map_for-web-96x96.jpg",
"width": 96,
"mimeType": "image/jpeg",
"height": 96
},
"medium": {
"file": "https://ww2.kqed.org/app/uploads/sites/35/2015/08/July-water-conservation-map_for-web-800x422.jpg",
"width": 800,
"mimeType": "image/jpeg",
"height": 422
},
"guest-author-64": {
"file": "https://ww2.kqed.org/app/uploads/sites/35/2015/08/July-water-conservation-map_for-web-64x64.jpg",
"width": 64,
"mimeType": "image/jpeg",
"height": 64
},
"guest-author-32": {
"file": "https://ww2.kqed.org/app/uploads/sites/35/2015/08/July-water-conservation-map_for-web-32x32.jpg",
"width": 32,
"mimeType": "image/jpeg",
"height": 32
},
"fd-lrg": {
"file": "https://ww2.kqed.org/app/uploads/sites/35/2015/08/July-water-conservation-map_for-web-1920x1013.jpg",
"width": 1920,
"mimeType": "image/jpeg",
"height": 1013
},
"fd-med": {
"file": "https://ww2.kqed.org/app/uploads/sites/35/2015/08/July-water-conservation-map_for-web-1180x622.jpg",
"width": 1180,
"mimeType": "image/jpeg",
"height": 622
},
"detail": {
"file": "https://ww2.kqed.org/app/uploads/sites/35/2015/08/July-water-conservation-map_for-web-75x75.jpg",
"width": 75,
"mimeType": "image/jpeg",
"height": 75
},
"guest-author-128": {
"file": "https://ww2.kqed.org/app/uploads/sites/35/2015/08/July-water-conservation-map_for-web-128x128.jpg",
"width": 128,
"mimeType": "image/jpeg",
"height": 128
}
},
"publishDate": 1440722126,
"modified": 1440722184,
"caption": "Most California cities are stepping up to the water conservation challenge — but not all. Blue dots show districts that met or exceeded their goal while orange dots represent districts that fell short in June and July.",
"description": null,
"title": "July water conservation map_for web",
"credit": "CartoDB",
"status": "inherit",
"isLoading": false,
"fetchFailed": false
},
"science_216657": {
"type": "attachments",
"id": "science_216657",
"meta": {
"index": "attachments_1716263798",
"site": "science",
"id": "216657",
"found": true
},
"parent": 216656,
"imgSizes": {
"thumbnail": {
"file": "https://ww2.kqed.org/app/uploads/sites/35/2015/08/davenport-terrace-400x225.jpg",
"width": 400,
"mimeType": "image/jpeg",
"height": 225
},
"fd-sm": {
"file": "https://ww2.kqed.org/app/uploads/sites/35/2015/08/davenport-terrace-960x540.jpg",
"width": 960,
"mimeType": "image/jpeg",
"height": 540
},
"post-thumbnail": {
"file": "https://ww2.kqed.org/app/uploads/sites/35/2015/08/davenport-terrace-672x372.jpg",
"width": 672,
"mimeType": "image/jpeg",
"height": 372
},
"kqedFullSize": {
"file": "https://ww2.kqed.org/app/uploads/sites/35/2015/08/davenport-terrace.jpg",
"width": 1000,
"height": 563
},
"guest-author-96": {
"file": "https://ww2.kqed.org/app/uploads/sites/35/2015/08/davenport-terrace-96x96.jpg",
"width": 96,
"mimeType": "image/jpeg",
"height": 96
},
"medium": {
"file": "https://ww2.kqed.org/app/uploads/sites/35/2015/08/davenport-terrace-800x450.jpg",
"width": 800,
"mimeType": "image/jpeg",
"height": 450
},
"guest-author-64": {
"file": "https://ww2.kqed.org/app/uploads/sites/35/2015/08/davenport-terrace-64x64.jpg",
"width": 64,
"mimeType": "image/jpeg",
"height": 64
},
"detail": {
"file": "https://ww2.kqed.org/app/uploads/sites/35/2015/08/davenport-terrace-75x75.jpg",
"width": 75,
"mimeType": "image/jpeg",
"height": 75
},
"guest-author-32": {
"file": "https://ww2.kqed.org/app/uploads/sites/35/2015/08/davenport-terrace-32x32.jpg",
"width": 32,
"mimeType": "image/jpeg",
"height": 32
},
"guest-author-128": {
"file": "https://ww2.kqed.org/app/uploads/sites/35/2015/08/davenport-terrace-128x128.jpg",
"width": 128,
"mimeType": "image/jpeg",
"height": 128
}
},
"publishDate": 1440608618,
"modified": 1440641830,
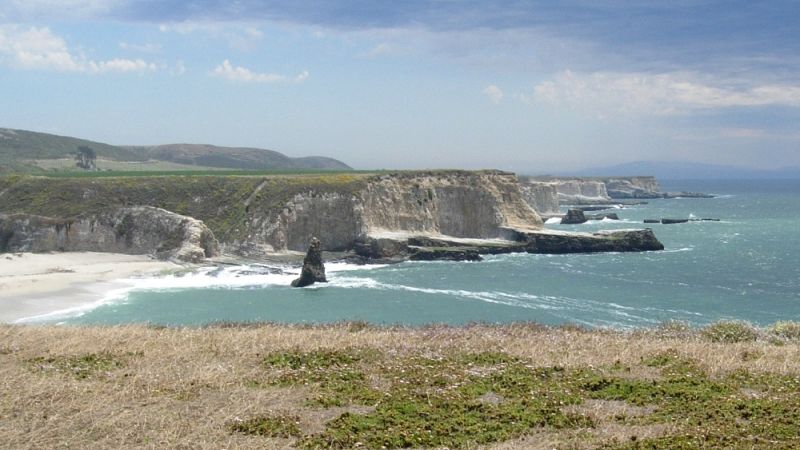
"caption": "This prominent marine terrace south of Davenport, is one of several well-known terraces in the Santa Cruz area. It marks the high sea level of 84,000 years ago, but it's also been uplifted by tectonic activity since that time. ",
"description": null,
"title": "davenport-terrace",
"credit": "Andrew Alden/KQED",
"status": "inherit",
"isLoading": false,
"fetchFailed": false
},
"science_217190": {
"type": "attachments",
"id": "science_217190",
"meta": {
"index": "attachments_1716263798",
"site": "science",
"id": "217190",
"found": true
},
"parent": 217096,
"imgSizes": {
"thumbnail": {
"file": "https://ww2.kqed.org/app/uploads/sites/35/2015/08/Screen-Shot-2015-08-26-at-3.31.32-PM-400x223.png",
"width": 400,
"mimeType": "image/png",
"height": 223
},
"post-thumbnail": {
"file": "https://ww2.kqed.org/app/uploads/sites/35/2015/08/Screen-Shot-2015-08-26-at-3.31.32-PM-672x372.png",
"width": 672,
"mimeType": "image/png",
"height": 372
},
"kqedFullSize": {
"file": "https://ww2.kqed.org/app/uploads/sites/35/2015/08/Screen-Shot-2015-08-26-at-3.31.32-PM.png",
"width": 738,
"height": 411
},
"guest-author-96": {
"file": "https://ww2.kqed.org/app/uploads/sites/35/2015/08/Screen-Shot-2015-08-26-at-3.31.32-PM-96x96.png",
"width": 96,
"mimeType": "image/png",
"height": 96
},
"guest-author-64": {
"file": "https://ww2.kqed.org/app/uploads/sites/35/2015/08/Screen-Shot-2015-08-26-at-3.31.32-PM-64x64.png",
"width": 64,
"mimeType": "image/png",
"height": 64
},
"detail": {
"file": "https://ww2.kqed.org/app/uploads/sites/35/2015/08/Screen-Shot-2015-08-26-at-3.31.32-PM-75x75.png",
"width": 75,
"mimeType": "image/png",
"height": 75
},
"guest-author-32": {
"file": "https://ww2.kqed.org/app/uploads/sites/35/2015/08/Screen-Shot-2015-08-26-at-3.31.32-PM-32x32.png",
"width": 32,
"mimeType": "image/png",
"height": 32
},
"guest-author-128": {
"file": "https://ww2.kqed.org/app/uploads/sites/35/2015/08/Screen-Shot-2015-08-26-at-3.31.32-PM-128x128.png",
"width": 128,
"mimeType": "image/png",
"height": 128
}
},
"publishDate": 1440628867,
"modified": 1440637513,
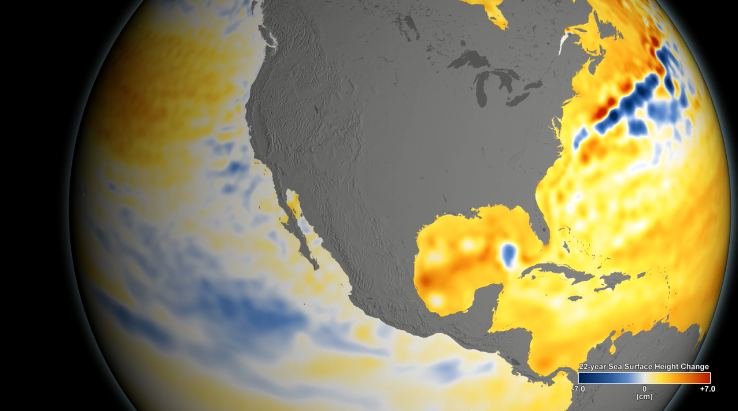
"caption": "NASA Animation shows the wide variance in sea level rise in recent years. The pale coloration along the West Coast illustrates a lower rate of rise.",
"description": "NASA Animation shows the wide variance in sea level rise in recent years. The pale coloration along the West Coast illustrates a lower rate of rise.",
"title": "Screen Shot 2015-08-26 at 3.31.32 PM",
"credit": "NASA Scientific Visualization Studio",
"status": "inherit",
"isLoading": false,
"fetchFailed": false
}
},
"audioPlayerReducer": {
"postId": "stream_live",
"isPaused": true,
"isPlaying": false,
"pfsActive": false,
"pledgeModalIsOpen": true,
"playerDrawerIsOpen": false,
"liveAudioPlayStartedAt": 0,
"liveAudioPlayContext": ""
},
"authorsReducer": {
"byline_science_284657": {
"type": "authors",
"id": "byline_science_284657",
"meta": {
"override": true
},
"slug": "byline_science_284657",
"name": "Kate Galbraith\u003cbr>CALmatters",
"isLoading": false
},
"byline_science_229506": {
"type": "authors",
"id": "byline_science_229506",
"meta": {
"override": true
},
"slug": "byline_science_229506",
"name": "\u003cstrong>\u003ca href=\"http://www.climatecentral.org/what-we-do/people/brian-kahn\">Brian Kahn\u003c/a>, Climate Central\u003c/strong>",
"isLoading": false
},
"cmiller": {
"type": "authors",
"id": "221",
"meta": {
"index": "authors_1716337520",
"id": "221",
"found": true
},
"name": "Craig Miller",
"firstName": "Craig",
"lastName": "Miller",
"slug": "cmiller",
"email": "craig@voxterra.net",
"display_author_email": false,
"staff_mastheads": [
"science"
],
"title": "Editor Emeritus, Science",
"bio": "Craig is a former KQED Science editor, specializing in weather, climate, water & energy issues, with a little seismology thrown in just to shake things up. Prior to that, he launched and led the station's award-winning multimedia project, Climate Watch. Craig is also an accomplished writer/producer of television documentaries, with a focus on natural resource issues.",
"avatar": "https://secure.gravatar.com/avatar/b91661df645e001a9cafe0861fa685f9?s=600&d=blank&r=g",
"twitter": "voxterra",
"facebook": null,
"instagram": null,
"linkedin": null,
"sites": [
{
"site": "news",
"roles": [
"author"
]
},
{
"site": "futureofyou",
"roles": [
"editor"
]
},
{
"site": "stateofhealth",
"roles": [
"author"
]
},
{
"site": "science",
"roles": [
"editor"
]
},
{
"site": "quest",
"roles": [
"editor"
]
}
],
"headData": {
"title": "Craig Miller | KQED",
"description": "Editor Emeritus, Science",
"ogImgSrc": "https://secure.gravatar.com/avatar/b91661df645e001a9cafe0861fa685f9?s=600&d=blank&r=g",
"twImgSrc": "https://secure.gravatar.com/avatar/b91661df645e001a9cafe0861fa685f9?s=600&d=blank&r=g"
},
"isLoading": false,
"link": "/author/cmiller"
},
"lindseyhoshaw": {
"type": "authors",
"id": "5432",
"meta": {
"index": "authors_1716337520",
"id": "5432",
"found": true
},
"name": "Lindsey Hoshaw",
"firstName": "Lindsey",
"lastName": "Hoshaw",
"slug": "lindseyhoshaw",
"email": "lhoshaw@kqed.org",
"display_author_email": false,
"staff_mastheads": [],
"title": "KQED Contributor",
"bio": "Lindsey Hoshaw is a former interactive producer for KQED Science. Before joining KQED, Lindsey was a science correspondent for The New York Times, The Boston Globe, Forbes and Scientific American. On Twitter @lindseyhoshaw",
"avatar": "https://secure.gravatar.com/avatar/274b07694c998eaa8f26cfabaa941186?s=600&d=mm&r=g",
"twitter": "lindseyhoshaw",
"facebook": "lindsey.hoshaw.9",
"instagram": null,
"linkedin": null,
"sites": [
{
"site": "arts",
"roles": [
"author"
]
},
{
"site": "news",
"roles": [
"subscriber"
]
},
{
"site": "futureofyou",
"roles": [
"editor"
]
},
{
"site": "bayareabites",
"roles": [
"contributor"
]
},
{
"site": "stateofhealth",
"roles": [
"author"
]
},
{
"site": "science",
"roles": [
"edit_theme_options",
"subscriber"
]
},
{
"site": "quest",
"roles": [
"edit_post_subscriptions",
"edit_usergroups",
"unfiltered_html",
"unfiltered_upload",
"leadcoordinator",
"editor"
]
},
{
"site": "food",
"roles": []
}
],
"headData": {
"title": "Lindsey Hoshaw | KQED",
"description": "KQED Contributor",
"ogImgSrc": "https://secure.gravatar.com/avatar/274b07694c998eaa8f26cfabaa941186?s=600&d=mm&r=g",
"twImgSrc": "https://secure.gravatar.com/avatar/274b07694c998eaa8f26cfabaa941186?s=600&d=mm&r=g"
},
"isLoading": false,
"link": "/author/lindseyhoshaw"
},
"andrew-alden": {
"type": "authors",
"id": "6228",
"meta": {
"index": "authors_1716337520",
"id": "6228",
"found": true
},
"name": "Andrew Alden",
"firstName": "Andrew",
"lastName": "Alden",
"slug": "andrew-alden",
"email": "alden@andrew-alden.com",
"display_author_email": false,
"staff_mastheads": [],
"title": null,
"bio": "Andrew Alden earned his geology degree at the University of New Hampshire and moved back to the Bay Area to work at the U.S. Geological Survey for six years. He has \u003ca href=\"http://geology.about.com/\">written on geology for About.com\u003c/a> since its founding in 1997. In 2007, he started the Oakland Geology blog, which won recognition as \"Best of the East Bay\" from the \u003ci>East Bay Express\u003c/i> in 2010. In writing about geology in the Bay Area and surroundings, he hopes to share some of the useful and pleasurable insights that geologists give us—not just facts about the deep past, but an attitude that might be called the \u003ci>deep present\u003c/i>.\r\n\r\nRead his \u003ca href=\"http://science.kqed.org/quest/author/andrew-alden/\">previous contributions\u003c/a> to \u003ca href=\"http://http://science.kqed.org/quest/\">QUEST\u003c/a>, a project dedicated to exploring the Science of Sustainability.",
"avatar": "https://secure.gravatar.com/avatar/9eaa0afc32f98c5fc7ce634437334a64?s=600&d=blank&r=g",
"twitter": null,
"facebook": null,
"instagram": null,
"linkedin": null,
"sites": [
{
"site": "science",
"roles": [
"author"
]
},
{
"site": "quest",
"roles": [
"subscriber"
]
}
],
"headData": {
"title": "Andrew Alden | KQED",
"description": null,
"ogImgSrc": "https://secure.gravatar.com/avatar/9eaa0afc32f98c5fc7ce634437334a64?s=600&d=blank&r=g",
"twImgSrc": "https://secure.gravatar.com/avatar/9eaa0afc32f98c5fc7ce634437334a64?s=600&d=blank&r=g"
},
"isLoading": false,
"link": "/author/andrew-alden"
},
"sharolembry": {
"type": "authors",
"id": "6328",
"meta": {
"index": "authors_1716337520",
"id": "6328",
"found": true
},
"name": "Sharol Nelson-Embry",
"firstName": "Sharol",
"lastName": "Nelson-Embry",
"slug": "sharolembry",
"email": "bobsharol@gmail.com",
"display_author_email": false,
"staff_mastheads": [],
"title": "KQED Contributor",
"bio": "Sharol Nelson-Embry is the Supervising Naturalist at the Crab Cove Visitor Center & Aquarium on San Francisco Bay in Alameda. Crab Cove is part of the East Bay Regional Park District, one of the largest and oldest regional park agencies in the nation. She graduated from Cal Poly, San Luis Obispo with a degree in Natural Resources Management and an epiphany that connecting kids with nature was her destiny. She's been rooted in the Bay Area since 1991 after working at nature centers and outdoor science schools around our fair state. She loves the great variety of habitats stretching from the Bay shoreline to the redwoods, lakes, and hills. Sharol enjoys connecting people to nature with articles in local newspapers and online forums.\r\n\r\nRead her \u003ca href=\"http://science.kqed.org/quest/author/sharolembry/\">previous contributions\u003c/a> to \u003ca href=\"http://http://science.kqed.org/quest/\">QUEST\u003c/a>, a project dedicated to exploring the Science of Sustainability.",
"avatar": "https://secure.gravatar.com/avatar/7d0ffaf107f228c8293464f98d8aeecdc95cf55410e3481c2f4e9f5d0e415cec?s=600&d=blank&r=g",
"twitter": null,
"bluesky": null,
"facebook": null,
"instagram": null,
"linkedin": null,
"sites": [
{
"site": "science",
"roles": [
"subscriber"
]
},
{
"site": "quest",
"roles": [
"subscriber"
]
}
],
"headData": {
"title": "Sharol Nelson-Embry | KQED",
"description": "KQED Contributor",
"ogImgSrc": "https://secure.gravatar.com/avatar/7d0ffaf107f228c8293464f98d8aeecdc95cf55410e3481c2f4e9f5d0e415cec?s=600&d=blank&r=g",
"twImgSrc": "https://secure.gravatar.com/avatar/7d0ffaf107f228c8293464f98d8aeecdc95cf55410e3481c2f4e9f5d0e415cec?s=600&d=blank&r=g"
},
"isLoading": false,
"link": "/author/sharolembry"
},
"kqedscience": {
"type": "authors",
"id": "6387",
"meta": {
"index": "authors_1716337520",
"id": "6387",
"found": true
},
"name": "KQED Science",
"firstName": "KQED",
"lastName": "Science",
"slug": "kqedscience",
"email": "kqedscience@gmail.com",
"display_author_email": false,
"staff_mastheads": [],
"title": null,
"bio": "KQED Science brings you award-winning science and environment coverage from the Bay Area and beyond by the flagship Northern California PBS and NPR affiliate.",
"avatar": "https://secure.gravatar.com/avatar/5a295ff49cf82a8c0f30937d3f788b2f?s=600&d=blank&r=g",
"twitter": null,
"facebook": null,
"instagram": null,
"linkedin": null,
"sites": [
{
"site": "science",
"roles": [
"contributor"
]
},
{
"site": "quest",
"roles": [
"editor"
]
},
{
"site": "food",
"roles": [
"contributor"
]
}
],
"headData": {
"title": "KQED Science | KQED",
"description": null,
"ogImgSrc": "https://secure.gravatar.com/avatar/5a295ff49cf82a8c0f30937d3f788b2f?s=600&d=blank&r=g",
"twImgSrc": "https://secure.gravatar.com/avatar/5a295ff49cf82a8c0f30937d3f788b2f?s=600&d=blank&r=g"
},
"isLoading": false,
"link": "/author/kqedscience"
},
"dpotter": {
"type": "authors",
"id": "6609",
"meta": {
"index": "authors_1716337520",
"id": "6609",
"found": true
},
"name": "Daniel Potter",
"firstName": "Daniel",
"lastName": "Potter",
"slug": "dpotter",
"email": "dpotter@kqed.org",
"display_author_email": false,
"staff_mastheads": [],
"title": "KQED Contributor",
"bio": "Daniel Potter is a reporter for KQED Science. Before that, he worked at Nashville Public Radio for six years. He’s gathered tape for The New York Times, contributed to a growing list of podcasts, and done national features for NPR on everything from bats to meningitis. He tweets at @hellodanpo.",
"avatar": "https://secure.gravatar.com/avatar/59396b9ad9c672dd4cd1d3e453425f12?s=600&d=blank&r=g",
"twitter": "hellodanpo",
"facebook": null,
"instagram": null,
"linkedin": null,
"sites": [
{
"site": "futureofyou",
"roles": [
"author"
]
},
{
"site": "science",
"roles": []
}
],
"headData": {
"title": "Daniel Potter | KQED",
"description": "KQED Contributor",
"ogImgSrc": "https://secure.gravatar.com/avatar/59396b9ad9c672dd4cd1d3e453425f12?s=600&d=blank&r=g",
"twImgSrc": "https://secure.gravatar.com/avatar/59396b9ad9c672dd4cd1d3e453425f12?s=600&d=blank&r=g"
},
"isLoading": false,
"link": "/author/dpotter"
}
},
"pagesReducer": {
"science_category_climate": {
"type": "terms",
"id": "science_31",
"meta": {
"index": "terms_1716263798",
"site": "science",
"id": "31",
"score": 11.061988
},
"featImg": null,
"name": "Climate",
"description": null,
"taxonomy": "category",
"headData": {
"twImgId": null,
"twTitle": null,
"ogTitle": null,
"ogImgId": null,
"twDescription": null,
"description": null,
"title": "Climate Archives | KQED Science",
"ogDescription": null
},
"ttid": 33,
"slug": "climate",
"isLoading": false,
"title": "Climate",
"pageMeta": {
"site": "science",
"WpPageTemplate": "page-topic-editorial",
"currentPage": 107
},
"blocks": [
{
"blockName": "kqed/post-list",
"attrs": {
"layout": "cardArticle2",
"query": "posts/science?category=climate",
"seeMore": false,
"paginated": true,
"page": 107
}
},
{
"blockName": "kqed/ad"
}
]
}
},
"pfsSessionReducer": {},
"postsReducer": {
"stream_live": {
"type": "live",
"id": "stream_live",
"audioUrl": "https://streams.kqed.org/kqedradio",
"title": "Live Stream",
"excerpt": "Live Stream information currently unavailable.",
"link": "/radio",
"featImg": "",
"label": {
"name": "KQED Live",
"link": "/"
}
},
"stream_kqedNewscast": {
"type": "posts",
"id": "stream_kqedNewscast",
"audioUrl": "https://www.kqed.org/.stream/anon/radio/RDnews/newscast.mp3?_=1",
"title": "KQED Newscast",
"featImg": "",
"label": {
"name": "88.5 FM",
"link": "/"
}
},
"science_286593": {
"type": "posts",
"id": "science_286593",
"meta": {
"index": "posts_1716263798",
"site": "science",
"id": "286593",
"score": null,
"sort": [
1443830456000
]
},
"parent": 0,
"labelTerm": {
"site": "science",
"term": 1151
},
"blocks": [],
"publishDate": 1443830456,
"format": "image",
"title": "California Drought Revives a River -- and a Poignant History",
"headTitle": "California Drought Revives a River — and a Poignant History | KQED",
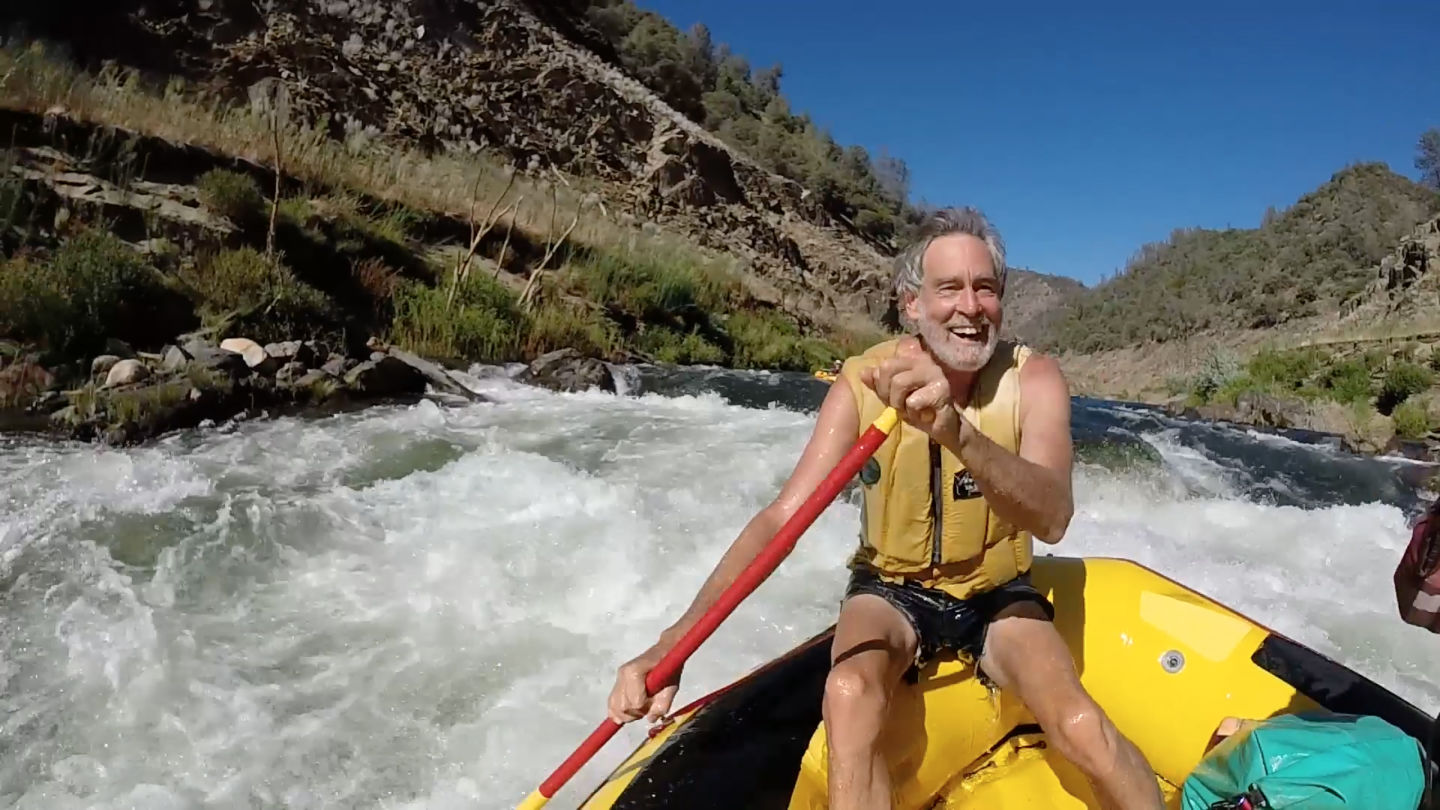
"content": "\u003cp>California’s relentless four-year drought has had some unexpected consequences. It’s uncovered lost bits of history — ancient petroglyphs and remnants of mining towns at the bottom of reservoirs.\u003c/p>\n\u003cp>And in the canyons of the Sierra foothills, the legendary rapids of the Stanislaus River are back.\u003c/p>\n\u003cp>The Stanislaus feeds New Melones Reservoir, about 80 miles east of the Bay Area — except that lately it hasn’t been feeding it much. The reservoir, which holds water for the federally operated Central Valley Project, has dropped to just over 10 percent of capacity. It’s receded so much that some of it has reverted to flowing river, exposing rapids that disappeared when the Army Corps of Engineers erected a \u003ca href=\"http://www.usbr.gov/projects/Project.jsp?proj_Name=New+Melones+Unit+Project\" target=\"_blank\" rel=\"noopener\">600-foot-high dam\u003c/a>, nearly 40 years ago.\u003c/p>\n\u003cp>“Look above us now,” Mark Dubois called out from the stern of a yellow inflatable raft. “Look downstream, you can see 40 feet above our heads would be reservoir in full season.”\u003c/p>\n\u003cp>\u003cstrong>Listen to the story:\u003c/strong>\u003cbr>\nhttp://www.kqed.org/.stream/anon/radio//2015/10/StanislausDubois.mp3\u003cbr>\nhttps://youtu.be/eanN_RJSdOs\u003c/p>\n\u003cp>[ad fullwidth]\u003c/p>\n\u003cp>Mark Dubois started running this river as a teenager. Now in his mid-60s, his bearded, 6-foot-8 presence is still bigger than life. He became world famous briefly in 1979, when he took a bold — some would say, reckless — stand to save this stretch of river from being submerged by the new dam.\u003c/p>\n\u003cp>“I’ve been groping all those years and every year since to describe the magic of every square foot of this river and what it does to people’s lives,” he says, “and I still have no words for it.”\u003c/p>\n\u003cp>But in 1979, when Dubois was 30 years old, he did have a kind of epiphany. After \u003ca href=\"http://www.friendsoftheriver.org/site/PageServer?pagename=SpiritoftheStan\" target=\"_blank\" rel=\"noopener\">years of protests and political action\u003c/a>, it looked like he and his fellow activists had run out of options for stopping the canyon’s inundation, and the new, expanded reservoir was about to be filled.\u003c/p>\n\u003cfigure id=\"attachment_287787\" class=\"wp-caption aligncenter\" style=\"max-width: 800px\">\u003ca href=\"http://ww2.kqed.org/science/wp-content/uploads/sites/35/2015/10/IMG_3577.jpg\">\u003cimg loading=\"lazy\" decoding=\"async\" class=\"wp-image-287787 size-medium\" src=\"http://ww2.kqed.org/science/wp-content/uploads/sites/35/2015/10/IMG_3577-800x600.jpg\" alt='Four years of drought have exposed standing forests that were underwater and \"bathtub rings\" that mark previous levels of the New Melones reservoir.' width=\"800\" height=\"600\" srcset=\"https://cdn.kqed.org/wp-content/uploads/sites/35/2015/10/IMG_3577-800x600.jpg 800w, https://cdn.kqed.org/wp-content/uploads/sites/35/2015/10/IMG_3577-400x300.jpg 400w, https://cdn.kqed.org/wp-content/uploads/sites/35/2015/10/IMG_3577-1440x1080.jpg 1440w, https://cdn.kqed.org/wp-content/uploads/sites/35/2015/10/IMG_3577-1920x1440.jpg 1920w, https://cdn.kqed.org/wp-content/uploads/sites/35/2015/10/IMG_3577-1180x885.jpg 1180w, https://cdn.kqed.org/wp-content/uploads/sites/35/2015/10/IMG_3577-960x720.jpg 960w\" sizes=\"(max-width: 800px) 100vw, 800px\">\u003c/a>\u003cfigcaption class=\"wp-caption-text\">Four years of drought have exposed standing forests that were underwater and “bathtub rings” that mark previous levels of the New Melones reservoir. \u003ccite>(Craig Miller/KQED)\u003c/cite>\u003c/figcaption>\u003c/figure>\n\u003cp>“In that moment I had no idea what I was going to do,” he says, “but I knew that in that moment, I couldn’t just turn away.”\u003c/p>\n\u003cp>So Dubois went down to the hardware store, bought some chain, and shackled himself to a canyon wall at a secret spot on the river’s edge — one that he knew would soon be underwater. He padlocked the chains and tossed the keys out of his reach.\u003c/p>\n\u003cp>I asked him if he was actually prepared to go under. His thoughtful one-word reply: “Yeah.”\u003c/p>\n\u003cp>The move had been kept under close wraps. Dubois knew every corner of the canyon and was so well hidden that after several days of searching, officials suspected a hoax. But it was real, and Dubois’ act stunned even many of his fellow activists.\u003c/p>\n\u003caside class=\"pullquote alignright\">‘I didn’t do this wanting to commit suicide. I wanted them to choose.’\u003ccite> Mark Dubois,\u003c/cite>\u003c/aside>\n\u003cp>Gina Cuclis, who worked on the Save-the-Stan campaign as a college student, remembers her reaction when someone handed her a newspaper in late May of ’79.\u003c/p>\n\u003cp>“Oh my god — look what he did!,” she recalls thinking. “And then it was stunned and shocked, but then it was like, wow. Wow.”\u003c/p>\n\u003cp>She recalls that at the time, she was nervous on Dubois’ behalf, but never actually feared for his life.\u003c/p>\n\u003cp>“I was glad he did it because it was the big event we needed,” Cuclis says. “How do you get attention? You gotta do something shocking, sadly.”\u003c/p>\n\u003cp>“I didn’t do this wanting to commit suicide,” says Dubois. “I wanted them (the Army Corps of Engineers) to choose. It was: You are consciously deciding to flood all the life in this canyon. Now you can choose to flood one more life.”\u003c/p>\n\u003cp>[gallery type=\"rectangular\" size=\"full\" ids=\"286816\"]\u003c/p>\n\u003cp>At the time, the Stan was wildly popular among rafters and kayakers. It was the closest thing California could offer to a Grand Canyon-type of experience: towering limestone canyons and Class III whitewater — rapids with “inviting” names like “Death Rock” and “Widowmaker.” But for all the morbid imagery, it was the life of the river that attracted Dubois — and cemented his resolve.\u003c/p>\n\u003cp>“You know, turquoise waters dancing around,” he recalls. “The butterflies were dancing, the dragonflies were coming, the grapevines were reaching out, the wildflowers blooming, and in a moment, I just felt the life of that place.”\u003c/p>\n\u003cp>A few fellow activists joined Dubois in literally chaining their fates to the river canyon. The governor — Jerry Brown, as it happens — sent a plea to President Jimmy Carter to stop the filling.\u003c/p>\n\u003cp>It worked, for a while. After a week in the canyon, Dubois came out with a deal in place to preserve at least part of the river, by filling the reservoir only partway. They managed to delay the flooding for a year, but ultimately the waters came, driven by the pressure for more irrigated land and the torrential El Niño rains of 1982.\u003c/p>\n\u003cp>The nine-mile stretch of river, so beloved by so many, disappeared, bubbling back up only now that severe drought has exposed not only the rapids, but the memories and the grief.\u003c/p>\n\u003cp>“Losing a place you love is like losing a person you truly love,” says Cuclis. “It’s not a person but when it’s a place that has touched you, changed you, you feel a deep loss.”\u003c/p>\n\u003cp>Today, the river offers only faint shadows of what was; the canyon walls are scarred with high-water marks known as “bathtub rings,” and groves of skeletal Ponderosa pines, submerged for decades, still stand a ghostly vigil near the riverbed, newly exposed by receding waters.\u003c/p>\n\u003cp>As the same punishing drought revives the call for more water storage — and to some that means more dams — some of the new generation of activists have returned to the Stan for inspiration.\u003c/p>\n\u003cp>“I needed to see this place for myself. I needed to come see this,” said Eric Wesselman. He’s the current head of \u003ca href=\"http://www.friendsoftheriver.org/site/PageServer\" target=\"_blank\" rel=\"noopener\">Friends of the River\u003c/a>, a job that Dubois himself held when the organization was just getting started.\u003c/p>\n\u003cp>“I’ve studied the campaign,” he told me as he was preparing to run the river with Dubois and a coterie of river enthusiasts. “Organizers like me yearn for the opportunity to be part of campaigns like that because they’re special and they’re magical and so powerful and great things can happen.”\u003c/p>\n\u003cp>Things did happen. There’s little doubt that the Stanislaus campaign supercharged a national movement to save \u003ca href=\"http://www.rivers.gov/\" target=\"_blank\" rel=\"noopener\">wild and scenic rivers\u003c/a>, probably sparing the nearby Tuolumne River a major dam project.\u003c/p>\n\u003cp>But for Dubois, the gains are still hard to balance against what was lost. Even today, he gets choked up contemplating it. He knows that, soon enough, rain will return and his lost world will again vanish beneath the waters of New Melones Lake.\u003c/p>\n\u003cp>[ad floatright]\u003c/p>\n\u003cp>\u003c!-- iframe plugin v.4.3 wordpress.org/plugins/iframe/ -->\u003cbr>\n\u003ciframe loading=\"lazy\" src=\"https://www.google.com/maps/embed?pb=!1m10!1m8!1m3!1d201109.7184484181!2d-120.3549019!3d38.0391785!3m2!1i1024!2i768!4f13.1!5e0!3m2!1sen!2sus!4v1443804779084\" width=\"600\" height=\"450\" frameborder=\"0\" style=\"border:0\" scrolling=\"yes\" class=\"iframe-class\">\u003c/iframe>\u003c/p>\n\n",
"stats": {
"hasVideo": false,
"hasChartOrMap": true,
"hasAudio": true,
"hasPolis": false,
"wordCount": 1256,
"hasGoogleForm": false,
"hasGallery": true,
"hasHearkenModule": false,
"iframeSrcs": [
"https://www.google.com/maps/embed"
],
"paragraphCount": 33
},
"modified": 1704931232,
"excerpt": "Drowned by a big dam project decades ago, a legendary stretch of the Stanislaus is back -- and so is the man who was willing to forfeit his life to save it.",
"headData": {
"twImgId": "",
"twTitle": "",
"ogTitle": "",
"ogImgId": "",
"twDescription": "",
"description": "Drowned by a big dam project decades ago, a legendary stretch of the Stanislaus is back -- and so is the man who was willing to forfeit his life to save it.",
"title": "California Drought Revives a River -- and a Poignant History | KQED",
"ogDescription": "",
"schema": {
"@context": "https://schema.org",
"@type": "Article",
"headline": "California Drought Revives a River -- and a Poignant History",
"datePublished": "2015-10-02T17:00:56-07:00",
"dateModified": "2024-01-10T16:00:32-08:00",
"image": "https://cdn.kqed.org/wp-content/uploads/2020/02/KQED-OG-Image@1x.png"
}
},
"guestAuthors": [],
"slug": "california-drought-revives-a-river-and-a-poignant-history",
"status": "publish",
"sticky": false,
"path": "/science/286593/california-drought-revives-a-river-and-a-poignant-history",
"audioUrl": "http://www.kqed.org/.stream/anon/radio//2015/10/StanislausDubois.mp3",
"audioDuration": null,
"audioTrackLength": null,
"parsedContent": [
{
"type": "contentString",
"content": "\u003cdiv class=\"post-body\">\u003cp>\u003cp>California’s relentless four-year drought has had some unexpected consequences. It’s uncovered lost bits of history — ancient petroglyphs and remnants of mining towns at the bottom of reservoirs.\u003c/p>\n\u003cp>And in the canyons of the Sierra foothills, the legendary rapids of the Stanislaus River are back.\u003c/p>\n\u003cp>The Stanislaus feeds New Melones Reservoir, about 80 miles east of the Bay Area — except that lately it hasn’t been feeding it much. The reservoir, which holds water for the federally operated Central Valley Project, has dropped to just over 10 percent of capacity. It’s receded so much that some of it has reverted to flowing river, exposing rapids that disappeared when the Army Corps of Engineers erected a \u003ca href=\"http://www.usbr.gov/projects/Project.jsp?proj_Name=New+Melones+Unit+Project\" target=\"_blank\" rel=\"noopener\">600-foot-high dam\u003c/a>, nearly 40 years ago.\u003c/p>\n\u003cp>“Look above us now,” Mark Dubois called out from the stern of a yellow inflatable raft. “Look downstream, you can see 40 feet above our heads would be reservoir in full season.”\u003c/p>\n\u003cp>\u003cstrong>Listen to the story:\u003c/strong>\u003cbr>\nhttp://www.kqed.org/.stream/anon/radio//2015/10/StanislausDubois.mp3\u003cbr>\u003c/p>\u003cp>\u003cspan class='utils-parseShortcode-shortcodes-__youtubeShortcode__embedYoutube'>\n \u003cspan class='utils-parseShortcode-shortcodes-__youtubeShortcode__embedYoutubeInside'>\n \u003ciframe\n loading='lazy'\n class='utils-parseShortcode-shortcodes-__youtubeShortcode__youtubePlayer'\n type='text/html'\n src='//www.youtube.com/embed/eanN_RJSdOs'\n title='//www.youtube.com/embed/eanN_RJSdOs'\n allowfullscreen='true'\n style='border:0;'>\u003c/iframe>\n \u003c/span>\n \u003c/span>\u003c/p>\u003cp>\u003cp>\u003c/p>\u003c/div>",
"attributes": {
"named": {},
"numeric": []
}
},
{
"type": "component",
"content": "",
"name": "ad",
"attributes": {
"named": {
"label": "fullwidth"
},
"numeric": [
"fullwidth"
]
}
},
{
"type": "contentString",
"content": "\u003cdiv class=\"post-body\">\u003cp>\u003c/p>\n\u003cp>Mark Dubois started running this river as a teenager. Now in his mid-60s, his bearded, 6-foot-8 presence is still bigger than life. He became world famous briefly in 1979, when he took a bold — some would say, reckless — stand to save this stretch of river from being submerged by the new dam.\u003c/p>\n\u003cp>“I’ve been groping all those years and every year since to describe the magic of every square foot of this river and what it does to people’s lives,” he says, “and I still have no words for it.”\u003c/p>\n\u003cp>But in 1979, when Dubois was 30 years old, he did have a kind of epiphany. After \u003ca href=\"http://www.friendsoftheriver.org/site/PageServer?pagename=SpiritoftheStan\" target=\"_blank\" rel=\"noopener\">years of protests and political action\u003c/a>, it looked like he and his fellow activists had run out of options for stopping the canyon’s inundation, and the new, expanded reservoir was about to be filled.\u003c/p>\n\u003cfigure id=\"attachment_287787\" class=\"wp-caption aligncenter\" style=\"max-width: 800px\">\u003ca href=\"http://ww2.kqed.org/science/wp-content/uploads/sites/35/2015/10/IMG_3577.jpg\">\u003cimg loading=\"lazy\" decoding=\"async\" class=\"wp-image-287787 size-medium\" src=\"http://ww2.kqed.org/science/wp-content/uploads/sites/35/2015/10/IMG_3577-800x600.jpg\" alt='Four years of drought have exposed standing forests that were underwater and \"bathtub rings\" that mark previous levels of the New Melones reservoir.' width=\"800\" height=\"600\" srcset=\"https://cdn.kqed.org/wp-content/uploads/sites/35/2015/10/IMG_3577-800x600.jpg 800w, https://cdn.kqed.org/wp-content/uploads/sites/35/2015/10/IMG_3577-400x300.jpg 400w, https://cdn.kqed.org/wp-content/uploads/sites/35/2015/10/IMG_3577-1440x1080.jpg 1440w, https://cdn.kqed.org/wp-content/uploads/sites/35/2015/10/IMG_3577-1920x1440.jpg 1920w, https://cdn.kqed.org/wp-content/uploads/sites/35/2015/10/IMG_3577-1180x885.jpg 1180w, https://cdn.kqed.org/wp-content/uploads/sites/35/2015/10/IMG_3577-960x720.jpg 960w\" sizes=\"(max-width: 800px) 100vw, 800px\">\u003c/a>\u003cfigcaption class=\"wp-caption-text\">Four years of drought have exposed standing forests that were underwater and “bathtub rings” that mark previous levels of the New Melones reservoir. \u003ccite>(Craig Miller/KQED)\u003c/cite>\u003c/figcaption>\u003c/figure>\n\u003cp>“In that moment I had no idea what I was going to do,” he says, “but I knew that in that moment, I couldn’t just turn away.”\u003c/p>\n\u003cp>So Dubois went down to the hardware store, bought some chain, and shackled himself to a canyon wall at a secret spot on the river’s edge — one that he knew would soon be underwater. He padlocked the chains and tossed the keys out of his reach.\u003c/p>\n\u003cp>I asked him if he was actually prepared to go under. His thoughtful one-word reply: “Yeah.”\u003c/p>\n\u003cp>The move had been kept under close wraps. Dubois knew every corner of the canyon and was so well hidden that after several days of searching, officials suspected a hoax. But it was real, and Dubois’ act stunned even many of his fellow activists.\u003c/p>\n\u003caside class=\"pullquote alignright\">‘I didn’t do this wanting to commit suicide. I wanted them to choose.’\u003ccite> Mark Dubois,\u003c/cite>\u003c/aside>\n\u003cp>Gina Cuclis, who worked on the Save-the-Stan campaign as a college student, remembers her reaction when someone handed her a newspaper in late May of ’79.\u003c/p>\n\u003cp>“Oh my god — look what he did!,” she recalls thinking. “And then it was stunned and shocked, but then it was like, wow. Wow.”\u003c/p>\n\u003cp>She recalls that at the time, she was nervous on Dubois’ behalf, but never actually feared for his life.\u003c/p>\n\u003cp>“I was glad he did it because it was the big event we needed,” Cuclis says. “How do you get attention? You gotta do something shocking, sadly.”\u003c/p>\n\u003cp>“I didn’t do this wanting to commit suicide,” says Dubois. “I wanted them (the Army Corps of Engineers) to choose. It was: You are consciously deciding to flood all the life in this canyon. Now you can choose to flood one more life.”\u003c/p>\n\u003cp>\u003c/p>\u003c/div>",
"attributes": {
"named": {},
"numeric": []
}
},
{
"type": "component",
"content": "",
"name": "gallery",
"attributes": {
"named": {
"type": "rectangular",
"size": "full",
"ids": "286816",
"label": ""
},
"numeric": []
}
},
{
"type": "contentString",
"content": "\u003cdiv class=\"post-body\">\u003cp>\u003c/p>\n\u003cp>At the time, the Stan was wildly popular among rafters and kayakers. It was the closest thing California could offer to a Grand Canyon-type of experience: towering limestone canyons and Class III whitewater — rapids with “inviting” names like “Death Rock” and “Widowmaker.” But for all the morbid imagery, it was the life of the river that attracted Dubois — and cemented his resolve.\u003c/p>\n\u003cp>“You know, turquoise waters dancing around,” he recalls. “The butterflies were dancing, the dragonflies were coming, the grapevines were reaching out, the wildflowers blooming, and in a moment, I just felt the life of that place.”\u003c/p>\n\u003cp>A few fellow activists joined Dubois in literally chaining their fates to the river canyon. The governor — Jerry Brown, as it happens — sent a plea to President Jimmy Carter to stop the filling.\u003c/p>\n\u003cp>It worked, for a while. After a week in the canyon, Dubois came out with a deal in place to preserve at least part of the river, by filling the reservoir only partway. They managed to delay the flooding for a year, but ultimately the waters came, driven by the pressure for more irrigated land and the torrential El Niño rains of 1982.\u003c/p>\n\u003cp>The nine-mile stretch of river, so beloved by so many, disappeared, bubbling back up only now that severe drought has exposed not only the rapids, but the memories and the grief.\u003c/p>\n\u003cp>“Losing a place you love is like losing a person you truly love,” says Cuclis. “It’s not a person but when it’s a place that has touched you, changed you, you feel a deep loss.”\u003c/p>\n\u003cp>Today, the river offers only faint shadows of what was; the canyon walls are scarred with high-water marks known as “bathtub rings,” and groves of skeletal Ponderosa pines, submerged for decades, still stand a ghostly vigil near the riverbed, newly exposed by receding waters.\u003c/p>\n\u003cp>As the same punishing drought revives the call for more water storage — and to some that means more dams — some of the new generation of activists have returned to the Stan for inspiration.\u003c/p>\n\u003cp>“I needed to see this place for myself. I needed to come see this,” said Eric Wesselman. He’s the current head of \u003ca href=\"http://www.friendsoftheriver.org/site/PageServer\" target=\"_blank\" rel=\"noopener\">Friends of the River\u003c/a>, a job that Dubois himself held when the organization was just getting started.\u003c/p>\n\u003cp>“I’ve studied the campaign,” he told me as he was preparing to run the river with Dubois and a coterie of river enthusiasts. “Organizers like me yearn for the opportunity to be part of campaigns like that because they’re special and they’re magical and so powerful and great things can happen.”\u003c/p>\n\u003cp>Things did happen. There’s little doubt that the Stanislaus campaign supercharged a national movement to save \u003ca href=\"http://www.rivers.gov/\" target=\"_blank\" rel=\"noopener\">wild and scenic rivers\u003c/a>, probably sparing the nearby Tuolumne River a major dam project.\u003c/p>\n\u003cp>But for Dubois, the gains are still hard to balance against what was lost. Even today, he gets choked up contemplating it. He knows that, soon enough, rain will return and his lost world will again vanish beneath the waters of New Melones Lake.\u003c/p>\n\u003cp>\u003c/p>\u003c/div>",
"attributes": {
"named": {},
"numeric": []
}
},
{
"type": "component",
"content": "",
"name": "ad",
"attributes": {
"named": {
"label": "floatright"
},
"numeric": [
"floatright"
]
}
},
{
"type": "contentString",
"content": "\u003cdiv class=\"post-body\">\u003cp>\u003c/p>\n\u003cp>\u003c!-- iframe plugin v.4.3 wordpress.org/plugins/iframe/ -->\u003cbr>\n\u003ciframe loading=\"lazy\" src=\"https://www.google.com/maps/embed?pb=!1m10!1m8!1m3!1d201109.7184484181!2d-120.3549019!3d38.0391785!3m2!1i1024!2i768!4f13.1!5e0!3m2!1sen!2sus!4v1443804779084\" width=\"600\" height=\"450\" frameborder=\"0\" style=\"border:0\" scrolling=\"yes\" class=\"iframe-class\">\u003c/iframe>\u003c/p>\n\n\u003c/div>\u003c/p>",
"attributes": {
"named": {},
"numeric": []
}
}
],
"link": "/science/286593/california-drought-revives-a-river-and-a-poignant-history",
"authors": [
"221"
],
"series": [
"science_1151"
],
"categories": [
"science_31",
"science_89",
"science_35",
"science_40",
"science_43",
"science_86",
"science_98"
],
"tags": [
"science_1622"
],
"featImg": "science_287870",
"label": "science_1151"
},
"science_284657": {
"type": "posts",
"id": "science_284657",
"meta": {
"index": "posts_1716263798",
"site": "science",
"id": "284657",
"score": null,
"sort": [
1443635322000
]
},
"parent": 0,
"labelTerm": {
"site": "science"
},
"blocks": [],
"publishDate": 1443635322,
"format": "standard",
"title": "California Climate Change Policy: What's Coming Up",
"headTitle": "California Climate Change Policy: What’s Coming Up | KQED",
"content": "\u003cp>The Legislature may have scuttled the centerpiece of Gov. Jerry Brown’s climate change plans, but it still approved ambitious new environmental policies that will impact the economy and life of Californians.\u003c/p>\n\u003cp>“This is a long trek forward to change the very basis of our industrial economy,” Brown said last week. “And I think we’re making tremendous progress.”In coming years, the new \u003ca href=\"http://www.leginfo.ca.gov/pub/15-16/bill/sen/sb_0301-0350/sb_350_bill_20150911_enrolled.htm\" target=\"_blank\" rel=\"noopener\">legislation\u003c/a> means California’s homes and buildings are expected to use dramatically less electricity and the \u003ca href=\"http://calmatters.org/articles/california-pushes-forward-on-renewable-power/\">power grid will increase its share of renewable energy\u003c/a>. Brown also hopes to achieve much of what the Legislature rejected through \u003ca href=\"http://calmatters.org/articles/california-climate-change-policy-overview/\">executive orders and regulations\u003c/a>. That will mean more electric cars on the road and increased use of biofuels, as part of a far-reaching effort to slash greenhouse gas emissions.\u003c/p>\n\u003cp>In the legislative session that ended on Sept. 11, lawmakers halted a bill that would have mandated deep greenhouse gas emissions cuts by the year 2050. They also failed to extend the state’s carbon-limiting \u003ca href=\"http://calmatters.org/articles/cap-and-trade-is-california-a-leader-or-a-loner/\">cap-and-trade program\u003c/a>, which may otherwise expire in 2020.\u003c/p>\n\u003cp>Most contentious of all was a bid to \u003ca href=\"http://calmatters.org/articles/can-california-cut-gasoline-use-in-half-in-15-years-probably-not/\">slash petroleum use in motor vehicles in half by 2030\u003c/a>. That idea got dropped after the oil industry launched a \u003ca href=\"http://calmatters.org/articles/ad-blitz-heats-up-climate-change-fight/\">vigorous advertising campaign in opposition\u003c/a>, and some Democrats in the state Assembly shied away.\u003c/p>\n\u003cp>\u003cstrong>Landmark Measure Passed\u003c/strong>\u003c/p>\n\u003cp>[ad fullwidth]\u003c/p>\n\u003cp>Still, Brown and Senate President pro Tem \u003ca href=\"http://calmatters.org/articles/climate-soulmates/\">Kevin de León\u003c/a> (D-Los Angeles) will bring almost unparalleled accomplishments to a major international climate-change conference in Paris this December.\u003c/p>\n\u003cp>Lawmakers passed and sent to the governor a landmark measure, carried by de León, to require electric power providers to get half of their electricity from renewable sources by 2030 (currently they are required to get 33 percent by 2020). It’s a target that’s stricter than all but a few states. Brown is expected to sign the legislation by the Oct. 11 deadline.\u003c/p>\n\u003cp>The renewable energy goal means that electricity providers must invest in more wind farms and large-scale solar plants as well as new transmission infrastructure. Currently, the three major utilities in the state – Pacific Gas & Electric, Southern California Edison and San Diego Gas & Electric — each get more than 20 percent of their electricity from renewables.\u003c/p>\n\u003cp>The Public Utilities Commission has not yet studied how the 50 percent target might affect consumers’ electric rates. Terrie Prosper, a commission spokeswoman, said the marginal cost should be minimal “if new technologies like storage and electric vehicles can be effectively used to integrate renewable resources.”\u003c/p>\n\u003cp>The renewable energy bill also calls for new and existing buildings across the state to become, collectively, twice as energy efficient by 2030. This \u003ca href=\"http://docketpublic.energy.ca.gov/PublicDocuments/15-IEPR-05/TN205919_20150828T153953_Existing_Buildings_Energy_Efficiency_Action_Plan.pdf\" target=\"_blank\" rel=\"noopener\">means\u003c/a> that Californians can expect to get more information about their homes’ energy usage, a helpful tool for homebuyers among others. It is also likely to be easier to find and use incentives like rebates to make homes more efficient. Energy-use standards for electronic appliances may also continue to tighten.\u003c/p>\n\u003cp>“It is a very big goal,” said Dennis Murphy of the US Green Building Council’s California branch, who noted that the state already was far more energy-efficient than most of the nation. Churches, schools and office buildings will be affected as well as homes, he said.\u003c/p>\n\u003cp>The third leg of de León’s bill, known as Senate Bill 350, would have required the state to cut petroleum usage in motor vehicles in half by 2030. That portion got removed from the final bill. But Brown said last week that the California Air Resources Board, which would have taken charge of the petroleum mandate had it passed, would work toward a lower-petroleum future anyhow.\u003c/p>\n\u003cp>“The only thing we don’t have is a formal statement in law of a 50 percent goal,” Brown said. “But the ARB is committed to that 50 percent goal, and I am committed to backing them up.”\u003c/p>\n\u003cp>Last week, the air board readopted a major rule known as the low-carbon fuel standard that requires producers of transportation fuels such as gasoline and diesel to make their products 10 percent less carbon-intensive by 2020.\u003c/p>\n\u003cp>\u003cstrong>Executive Orders\u003cbr>\n\u003c/strong>\u003c/p>\n\u003cp>The air board is already planning for long-term greenhouse gas emissions cuts to comply with executive orders issued by Brown and his predecessor, former Gov. Arnold Schwarzenegger. The executive orders \u003ca href=\"http://calmatters.org/articles/how-hard-will-it-be-to-meet-2030-and-2050-greenhouse-gas-reduction-goals/\">require emissions reductions of 40 percent below 1990 levels by 2030 and 80 percent below 1990 levels by 2050\u003c/a>. These cuts will have impacts for many sectors, prompting industrial plants and even perhaps farms to cut their greenhouse gas output.\u003c/p>\n\u003cp>A bill would have codified those goals into law, which would preserve the goal in statute no matter who succeeds Brown as governor.\u003c/p>\n\u003cp>“It’s not really set in stone. It’s an executive order,” said Ethan Elkind, a climate expert affiliated with the laws schools of the University of California, Berkeley and UCLA. He added that some groups may not follow those orders the way they would legislation.\u003c/p>\n\u003cp>But assuming the air board crafts policies to comply with the executive orders, that should effectively mean a close to 50 percent cut in petroleum use, said Simon Mui of the Natural Resources Defense Council — on the order, in other words, of what de León and Brown originally outlined.\u003c/p>\n\u003cp>Indeed, despite Brown’s fury at the oil companies, the air board may not be able to enact petroleum cuts directly, in the absence of legislative action.\u003c/p>\n\u003cp>The Air Resources Board “has pretty broad authority over air emissions, but I don’t think that translates into a direct ability to reduce petroleum,” said Brian Cragg, an attorney with the San Francisco firm Goodin, MacBride, Squeri & Day. “They would have to try to find some tie to air emissions…that would result in a reduction.”\u003c/p>\n\u003cp>Air board spokesman Dave Clegern said in an e-mail that the agency does not comment on legislation. However, “broadly we would note that Senate Bill 350 did not expand ARB’s authority, nor was it a directive to create new regulations,” he said.\u003c/p>\n\u003cp>The major programs needed to meet the decarbonizing goals announced this year by the governor are already in place, Clegern said. The air board has crafted policies that include reducing the carbon content of fuels, regulating the emissions from cars and trucks, and rewarding automakers that sell electric vehicles to Californians. The board also runs the cap-and-trade program, which limits carbon across nearly the entire California economy.\u003c/p>\n\u003cp>The air board operates some of its key programs under a landmark piece of legislation passed in 2006, which sought to slash California’s greenhouse gas emissions to 1990 levels by 2020 — a \u003ca href=\"http://calmatters.org/articles/will-california-meet-its-2020-greenhouse-gas-reduction-goal/\">goal that state officials expect to meet in time\u003c/a>.\u003c/p>\n\u003cp>But the air board, which is overseen by a panel of gubernatorial appointees, is also likely to face increased scrutiny from both businesses and lawmakers as it embarks on more ambitious policies whose costs have yet to be determined, including those that affect petroleum. New \u003ca href=\"http://www.leginfo.ca.gov/pub/15-16/bill/asm/ab_1251-1300/ab_1288_bill_20150914_enrolled.htm\" target=\"_blank\" rel=\"noopener\">legislation\u003c/a>provides that the Senate and the Assembly will now each appoint one member of the agency.\u003c/p>\n\u003cp>“There’s going to be a lot more attention paid to what strategies that we have available, including, like, litigation, to be able to address [regulatory] decisions, if we don’t think they’re fair and balanced,” said Rob Lapsley, president of the California Business Roundtable.\u003c/p>\n\u003cp>[ad floatright]\u003c/p>\n\u003cp>Lawmakers, some of whom toyed with the idea of curbing the air board’s power during the recent session, will also take a more active role in the watching and overseeing the agency, Lapsley said.\u003c/p>\n\n",
"stats": {
"hasVideo": false,
"hasChartOrMap": false,
"hasAudio": false,
"hasPolis": false,
"wordCount": 1324,
"hasGoogleForm": false,
"hasGallery": false,
"hasHearkenModule": false,
"iframeSrcs": [],
"paragraphCount": 29
},
"modified": 1704931246,
"excerpt": "The Legislature may have scuttled the centerpiece of Gov. Jerry Brown’s climate change plans, but it still approved ambitious new policies.",
"headData": {
"twImgId": "",
"twTitle": "",
"ogTitle": "",
"ogImgId": "",
"twDescription": "",
"description": "The Legislature may have scuttled the centerpiece of Gov. Jerry Brown’s climate change plans, but it still approved ambitious new policies.",
"title": "California Climate Change Policy: What's Coming Up | KQED",
"ogDescription": "",
"schema": {
"@context": "https://schema.org",
"@type": "Article",
"headline": "California Climate Change Policy: What's Coming Up",
"datePublished": "2015-09-30T10:48:42-07:00",
"dateModified": "2024-01-10T16:00:46-08:00",
"image": "https://cdn.kqed.org/wp-content/uploads/2020/02/KQED-OG-Image@1x.png"
}
},
"guestAuthors": [],
"slug": "despite-setbacks-california-climate-policy-still-ambitious",
"status": "publish",
"nprByline": "Kate Galbraith\u003cbr>CALmatters",
"sticky": false,
"path": "/science/284657/despite-setbacks-california-climate-policy-still-ambitious",
"audioTrackLength": null,
"parsedContent": [
{
"type": "contentString",
"content": "\u003cdiv class=\"post-body\">\u003cp>\u003cp>The Legislature may have scuttled the centerpiece of Gov. Jerry Brown’s climate change plans, but it still approved ambitious new environmental policies that will impact the economy and life of Californians.\u003c/p>\n\u003cp>“This is a long trek forward to change the very basis of our industrial economy,” Brown said last week. “And I think we’re making tremendous progress.”In coming years, the new \u003ca href=\"http://www.leginfo.ca.gov/pub/15-16/bill/sen/sb_0301-0350/sb_350_bill_20150911_enrolled.htm\" target=\"_blank\" rel=\"noopener\">legislation\u003c/a> means California’s homes and buildings are expected to use dramatically less electricity and the \u003ca href=\"http://calmatters.org/articles/california-pushes-forward-on-renewable-power/\">power grid will increase its share of renewable energy\u003c/a>. Brown also hopes to achieve much of what the Legislature rejected through \u003ca href=\"http://calmatters.org/articles/california-climate-change-policy-overview/\">executive orders and regulations\u003c/a>. That will mean more electric cars on the road and increased use of biofuels, as part of a far-reaching effort to slash greenhouse gas emissions.\u003c/p>\n\u003cp>In the legislative session that ended on Sept. 11, lawmakers halted a bill that would have mandated deep greenhouse gas emissions cuts by the year 2050. They also failed to extend the state’s carbon-limiting \u003ca href=\"http://calmatters.org/articles/cap-and-trade-is-california-a-leader-or-a-loner/\">cap-and-trade program\u003c/a>, which may otherwise expire in 2020.\u003c/p>\n\u003cp>Most contentious of all was a bid to \u003ca href=\"http://calmatters.org/articles/can-california-cut-gasoline-use-in-half-in-15-years-probably-not/\">slash petroleum use in motor vehicles in half by 2030\u003c/a>. That idea got dropped after the oil industry launched a \u003ca href=\"http://calmatters.org/articles/ad-blitz-heats-up-climate-change-fight/\">vigorous advertising campaign in opposition\u003c/a>, and some Democrats in the state Assembly shied away.\u003c/p>\n\u003cp>\u003cstrong>Landmark Measure Passed\u003c/strong>\u003c/p>\n\u003cp>\u003c/p>\u003c/div>",
"attributes": {
"named": {},
"numeric": []
}
},
{
"type": "component",
"content": "",
"name": "ad",
"attributes": {
"named": {
"label": "fullwidth"
},
"numeric": [
"fullwidth"
]
}
},
{
"type": "contentString",
"content": "\u003cdiv class=\"post-body\">\u003cp>\u003c/p>\n\u003cp>Still, Brown and Senate President pro Tem \u003ca href=\"http://calmatters.org/articles/climate-soulmates/\">Kevin de León\u003c/a> (D-Los Angeles) will bring almost unparalleled accomplishments to a major international climate-change conference in Paris this December.\u003c/p>\n\u003cp>Lawmakers passed and sent to the governor a landmark measure, carried by de León, to require electric power providers to get half of their electricity from renewable sources by 2030 (currently they are required to get 33 percent by 2020). It’s a target that’s stricter than all but a few states. Brown is expected to sign the legislation by the Oct. 11 deadline.\u003c/p>\n\u003cp>The renewable energy goal means that electricity providers must invest in more wind farms and large-scale solar plants as well as new transmission infrastructure. Currently, the three major utilities in the state – Pacific Gas & Electric, Southern California Edison and San Diego Gas & Electric — each get more than 20 percent of their electricity from renewables.\u003c/p>\n\u003cp>The Public Utilities Commission has not yet studied how the 50 percent target might affect consumers’ electric rates. Terrie Prosper, a commission spokeswoman, said the marginal cost should be minimal “if new technologies like storage and electric vehicles can be effectively used to integrate renewable resources.”\u003c/p>\n\u003cp>The renewable energy bill also calls for new and existing buildings across the state to become, collectively, twice as energy efficient by 2030. This \u003ca href=\"http://docketpublic.energy.ca.gov/PublicDocuments/15-IEPR-05/TN205919_20150828T153953_Existing_Buildings_Energy_Efficiency_Action_Plan.pdf\" target=\"_blank\" rel=\"noopener\">means\u003c/a> that Californians can expect to get more information about their homes’ energy usage, a helpful tool for homebuyers among others. It is also likely to be easier to find and use incentives like rebates to make homes more efficient. Energy-use standards for electronic appliances may also continue to tighten.\u003c/p>\n\u003cp>“It is a very big goal,” said Dennis Murphy of the US Green Building Council’s California branch, who noted that the state already was far more energy-efficient than most of the nation. Churches, schools and office buildings will be affected as well as homes, he said.\u003c/p>\n\u003cp>The third leg of de León’s bill, known as Senate Bill 350, would have required the state to cut petroleum usage in motor vehicles in half by 2030. That portion got removed from the final bill. But Brown said last week that the California Air Resources Board, which would have taken charge of the petroleum mandate had it passed, would work toward a lower-petroleum future anyhow.\u003c/p>\n\u003cp>“The only thing we don’t have is a formal statement in law of a 50 percent goal,” Brown said. “But the ARB is committed to that 50 percent goal, and I am committed to backing them up.”\u003c/p>\n\u003cp>Last week, the air board readopted a major rule known as the low-carbon fuel standard that requires producers of transportation fuels such as gasoline and diesel to make their products 10 percent less carbon-intensive by 2020.\u003c/p>\n\u003cp>\u003cstrong>Executive Orders\u003cbr>\n\u003c/strong>\u003c/p>\n\u003cp>The air board is already planning for long-term greenhouse gas emissions cuts to comply with executive orders issued by Brown and his predecessor, former Gov. Arnold Schwarzenegger. The executive orders \u003ca href=\"http://calmatters.org/articles/how-hard-will-it-be-to-meet-2030-and-2050-greenhouse-gas-reduction-goals/\">require emissions reductions of 40 percent below 1990 levels by 2030 and 80 percent below 1990 levels by 2050\u003c/a>. These cuts will have impacts for many sectors, prompting industrial plants and even perhaps farms to cut their greenhouse gas output.\u003c/p>\n\u003cp>A bill would have codified those goals into law, which would preserve the goal in statute no matter who succeeds Brown as governor.\u003c/p>\n\u003cp>“It’s not really set in stone. It’s an executive order,” said Ethan Elkind, a climate expert affiliated with the laws schools of the University of California, Berkeley and UCLA. He added that some groups may not follow those orders the way they would legislation.\u003c/p>\n\u003cp>But assuming the air board crafts policies to comply with the executive orders, that should effectively mean a close to 50 percent cut in petroleum use, said Simon Mui of the Natural Resources Defense Council — on the order, in other words, of what de León and Brown originally outlined.\u003c/p>\n\u003cp>Indeed, despite Brown’s fury at the oil companies, the air board may not be able to enact petroleum cuts directly, in the absence of legislative action.\u003c/p>\n\u003cp>The Air Resources Board “has pretty broad authority over air emissions, but I don’t think that translates into a direct ability to reduce petroleum,” said Brian Cragg, an attorney with the San Francisco firm Goodin, MacBride, Squeri & Day. “They would have to try to find some tie to air emissions…that would result in a reduction.”\u003c/p>\n\u003cp>Air board spokesman Dave Clegern said in an e-mail that the agency does not comment on legislation. However, “broadly we would note that Senate Bill 350 did not expand ARB’s authority, nor was it a directive to create new regulations,” he said.\u003c/p>\n\u003cp>The major programs needed to meet the decarbonizing goals announced this year by the governor are already in place, Clegern said. The air board has crafted policies that include reducing the carbon content of fuels, regulating the emissions from cars and trucks, and rewarding automakers that sell electric vehicles to Californians. The board also runs the cap-and-trade program, which limits carbon across nearly the entire California economy.\u003c/p>\n\u003cp>The air board operates some of its key programs under a landmark piece of legislation passed in 2006, which sought to slash California’s greenhouse gas emissions to 1990 levels by 2020 — a \u003ca href=\"http://calmatters.org/articles/will-california-meet-its-2020-greenhouse-gas-reduction-goal/\">goal that state officials expect to meet in time\u003c/a>.\u003c/p>\n\u003cp>But the air board, which is overseen by a panel of gubernatorial appointees, is also likely to face increased scrutiny from both businesses and lawmakers as it embarks on more ambitious policies whose costs have yet to be determined, including those that affect petroleum. New \u003ca href=\"http://www.leginfo.ca.gov/pub/15-16/bill/asm/ab_1251-1300/ab_1288_bill_20150914_enrolled.htm\" target=\"_blank\" rel=\"noopener\">legislation\u003c/a>provides that the Senate and the Assembly will now each appoint one member of the agency.\u003c/p>\n\u003cp>“There’s going to be a lot more attention paid to what strategies that we have available, including, like, litigation, to be able to address [regulatory] decisions, if we don’t think they’re fair and balanced,” said Rob Lapsley, president of the California Business Roundtable.\u003c/p>\n\u003cp>\u003c/p>\u003c/div>",
"attributes": {
"named": {},
"numeric": []
}
},
{
"type": "component",
"content": "",
"name": "ad",
"attributes": {
"named": {
"label": "floatright"
},
"numeric": [
"floatright"
]
}
},
{
"type": "contentString",
"content": "\u003cdiv class=\"post-body\">\u003cp>\u003c/p>\n\u003cp>Lawmakers, some of whom toyed with the idea of curbing the air board’s power during the recent session, will also take a more active role in the watching and overseeing the agency, Lapsley said.\u003c/p>\n\n\u003c/div>\u003c/p>",
"attributes": {
"named": {},
"numeric": []
}
}
],
"link": "/science/284657/despite-setbacks-california-climate-policy-still-ambitious",
"authors": [
"byline_science_284657"
],
"categories": [
"science_31",
"science_40"
],
"tags": [
"science_194"
],
"featImg": "science_10732",
"label": "science"
},
"science_255377": {
"type": "posts",
"id": "science_255377",
"meta": {
"index": "posts_1716263798",
"site": "science",
"id": "255377",
"score": null,
"sort": [
1443473565000
]
},
"parent": 0,
"labelTerm": {
"site": "science",
"term": 1151
},
"blocks": [],
"publishDate": 1443473565,
"format": "standard",
"title": "Drought-Weakened Trees Could Pose Danger This Winter",
"headTitle": "Drought-Weakened Trees Could Pose Danger This Winter | KQED",
"content": "\u003cp>\u003cstrong>Listen to the story:\u003c/strong>\u003c/p>\n\u003cp>http://www.kqed.org/.stream/anon/radio//2015/09/WebDroughtTrees.mp3\u003c/p>\n\u003cp>After four years of drought, California has a huge number of dead and dying trees.\u003c/p>\n\u003cp>After a U.S. Forest Service aerial survey last spring, researchers estimated there were 12.5 million dead trees on national forest lands alone.\u003c/p>\n\u003cp>That doesn’t count dead and dying trees in open spaces and urban parks, or on private property like your backyard or your neighbor’s.\u003c/p>\n\u003cp>[ad fullwidth]\u003c/p>\n\u003cp>With climatologists predicting that \u003ca href=\"http://ww2.kqed.org/science/2015/09/02/floods-in-a-drought-how-a-monster-el-nino-could-bring-relief-and-misery-to-california/\" target=\"_blank\" rel=\"noopener\">this year’s El Niño \u003c/a>will usher in strong winds and torrential rains, weakened trees pose dangers to people and property across the state.\u003c/p>\n\u003caside class=\"pullquote alignright\">‘If we’re going to incur any sort of storm, there’s going be a lot of trees in jeopardy.’\u003ccite>Remy Hummer, Arborist\u003c/cite>\u003c/aside>\n\u003cp>In the Bay Area, arborists are working overtime to prune or remove trees on private property. And many homeowners aren’t receiving any assistance with the cost; San Francisco, Oakland and Berkeley don’t have funds designated for this. In San Francisco, even street trees — normally a municipal responsibility — are being turned over to residents because the city doesn’t have the money to manage them.\u003c/p>\n\u003cp>\u003cstrong>Protecting Power Lines\u003c/strong>\u003c/p>\n\u003cp>PG&E inspects millions of trees each year and is responsible for removing limbs and trees that pose a threat to power lines in urban and rural areas.\u003c/p>\n\u003cp>On a work site in Santa Cruz recently, program manager Joel Smith points out the signs of a dead tree, a Douglas fir that crews are trimming.\u003c/p>\n\u003cp>“There’s just a small portion of green up toward the top,” he says, “and the rest of the crown is basically dead.”\u003c/p>\n\u003cp>Clumps of pine needles at the top of this Douglas fir have started to turn brown, and lichen hangs from the lower branches. Smith says this tree is too close to power lines.\u003c/p>\n\u003cdiv>\n\u003c!-- iframe plugin v.4.3 wordpress.org/plugins/iframe/ -->\u003cbr>\n\u003ciframe loading=\"lazy\" src=\"http://gifs.com/embed/KkPDkb\" frameborder=\"0\" scrolling=\"no\" width=\"800\" height=\"450\" style=\"-webkit-backface-visibility: hidden;-webkit-transform: scale(1);\" class=\"iframe-class\">\u003c/iframe>\n\u003c/div>\n\u003cp>\u003cem>To get a sense of the size of this tree, look for the PG&E crew member who’s barely visible, just under the branch that’s being trimmed off.\u003c/em>\u003c/p>\n\u003cp>“It is very serious,” he says. “Trees that are dead or are otherwise compromised can fail, and if they are close to our high voltage lines they can cause those lines to come down, which can create a very dangerous public safety hazard, as well as taking out the power and potentially causing a wildfire.”\u003c/p>\n\u003cp>Cal Fire officials are currently investigating whether this month’s devastating Butte Fire was ignited when a tree came into contact with a power line.\u003c/p>\n\u003cp>This year, says PG&E, crews are taking out 30 percent more dead trees and twice as many hazardous trees as in a non-drought year. And when customers call for a tree inspection, crews are doing less pruning and more removal.\u003c/p>\n\u003cp>\u003cstrong>What Should Homeowners Do?\u003c/strong>\u003c/p>\n\u003cp>If you see a drought-stressed tree near a power line, call PG&E; if it’s a street tree, call 311 to schedule a city inspection. But if you’re worried about a tree on your property, call a certified arborist.\u003c/p>\n\u003cp>Remy Hummer with Arborist Now says he’s been working overtime since the beginning of the year, trimming and removing trees or supporting them with cables. He says a lot of calls this fall are from homeowners worried about storms.\u003c/p>\n\u003cfigure id=\"attachment_268059\" class=\"wp-caption alignright\" style=\"max-width: 800px\">\u003ca href=\"http://ww2.kqed.org/science/wp-content/uploads/sites/35/2015/09/Fallen-tree-in-Vallejo.jpg\">\u003cimg loading=\"lazy\" decoding=\"async\" class=\"size-medium wp-image-268059\" src=\"http://ww2.kqed.org/science/wp-content/uploads/sites/35/2015/09/Fallen-tree-in-Vallejo-800x600.jpg\" alt=\"A weakened tree is uprooted in Vallejo by winds from one of last winter's rare atmospheric river storms.\" width=\"800\" height=\"600\" srcset=\"https://cdn.kqed.org/wp-content/uploads/sites/35/2015/09/Fallen-tree-in-Vallejo-800x600.jpg 800w, https://cdn.kqed.org/wp-content/uploads/sites/35/2015/09/Fallen-tree-in-Vallejo-400x300.jpg 400w, https://cdn.kqed.org/wp-content/uploads/sites/35/2015/09/Fallen-tree-in-Vallejo-1180x885.jpg 1180w, https://cdn.kqed.org/wp-content/uploads/sites/35/2015/09/Fallen-tree-in-Vallejo-960x720.jpg 960w, https://cdn.kqed.org/wp-content/uploads/sites/35/2015/09/Fallen-tree-in-Vallejo.jpg 1280w\" sizes=\"(max-width: 800px) 100vw, 800px\">\u003c/a>\u003cfigcaption class=\"wp-caption-text\">A weakened tree in Vallejo was uprooted by winds from one of last winter’s atmospheric river storms. \u003ccite>(Craig Miller/KQED)\u003c/cite>\u003c/figcaption>\u003c/figure>\n\u003cp>“If we’re going to incur any sort of storm, there’s going to be a lot of trees in jeopardy,” he says, “even the ones that are very sound.”\u003c/p>\n\u003cp>San Francisco officials say even in an ordinary year, between one and three tree branches fall every week in the city.\u003c/p>\n\u003cp>But U.C. Berkeley forest ecologist Joe McBride says this winter, hundreds of branches could fall every week.\u003c/p>\n\u003cp>Climatologists now say there’s a 95 percent chance El Niño will last through the winter. And they’re saying the storms could be as big as the El Niño of 1997-98, when San Francisco received double its normal amount of rain.\u003c/p>\n\u003cp>One clue that you may have a drought-stressed tree is a brown crown, says McBride. He says the crown is often the first place to go dry, because the tree simply can’t send enough water up to the taller branches.\u003c/p>\n\u003cp>\u003cstrong>A Bad Storm\u003c/strong>\u003c/p>\n\u003cp>In his four decades studying trees, McBride says one of the worst winter storms he remembers was in 1991.\u003c/p>\n\u003cp>“There were record wind velocities following about a week of rainfall in San Francisco,” he says, “and an estimated 6,000 trees at the Presidio and in Golden Gate Park were blown over as a result of that.”\u003c/p>\n\u003cp>And it didn’t take long.\u003c/p>\n\u003cp>“It all occurred in about a period of six hours, this one really heavy windstorm,” he says. “Blocked streets, a number of structures were hit by falling trees, cars were hit. It was a major disaster.”\u003c/p>\n\u003cp>It was a somewhat rare combination of prolonged rainfall with record winds, McBride says. And as to whether something similar is possible this winter?\u003c/p>\n\u003cp>\u003c/p>\n\u003cp>“Oh, I think it’s possible,” he says, “yeah.”\u003c/p>\n\n",
"stats": {
"hasVideo": false,
"hasChartOrMap": true,
"hasAudio": true,
"hasPolis": false,
"wordCount": 926,
"hasGoogleForm": false,
"hasGallery": false,
"hasHearkenModule": false,
"iframeSrcs": [
"http://gifs.com/embed/KkPDkb"
],
"paragraphCount": 32
},
"modified": 1704931264,
"excerpt": "If El Niño brings heavy wind and rain, California's dead and dying trees could topple, threatening homes and people.",
"headData": {
"twImgId": "",
"twTitle": "",
"ogTitle": "",
"ogImgId": "",
"twDescription": "",
"description": "If El Niño brings heavy wind and rain, California's dead and dying trees could topple, threatening homes and people.",
"title": "Drought-Weakened Trees Could Pose Danger This Winter | KQED",
"ogDescription": "",
"schema": {
"@context": "https://schema.org",
"@type": "Article",
"headline": "Drought-Weakened Trees Could Pose Danger This Winter",
"datePublished": "2015-09-28T13:52:45-07:00",
"dateModified": "2024-01-10T16:01:04-08:00",
"image": "https://cdn.kqed.org/wp-content/uploads/2020/02/KQED-OG-Image@1x.png"
}
},
"guestAuthors": [],
"slug": "drought-weakened-trees-pose-danger-in-winter-storms",
"status": "publish",
"sticky": false,
"path": "/science/255377/drought-weakened-trees-pose-danger-in-winter-storms",
"audioUrl": "http://www.kqed.org/.stream/anon/radio//2015/09/WebDroughtTrees.mp3",
"audioDuration": null,
"audioTrackLength": null,
"parsedContent": [
{
"type": "contentString",
"content": "\u003cdiv class=\"post-body\">\u003cp>\u003cp>\u003cstrong>Listen to the story:\u003c/strong>\u003c/p>\u003c/p>\u003c/div>",
"attributes": {
"named": {},
"numeric": []
}
},
{
"type": "component",
"content": "",
"name": "audioLink",
"attributes": {
"named": {
"src": "http://www.kqed.org/.stream/anon/radio//2015/09/WebDroughtTrees.mp3"
},
"numeric": []
}
},
{
"type": "contentString",
"content": "\u003cdiv class=\"post-body\">\u003cp>\u003cp>After four years of drought, California has a huge number of dead and dying trees.\u003c/p>\n\u003cp>After a U.S. Forest Service aerial survey last spring, researchers estimated there were 12.5 million dead trees on national forest lands alone.\u003c/p>\n\u003cp>That doesn’t count dead and dying trees in open spaces and urban parks, or on private property like your backyard or your neighbor’s.\u003c/p>\n\u003cp>\u003c/p>\u003c/div>",
"attributes": {
"named": {},
"numeric": []
}
},
{
"type": "component",
"content": "",
"name": "ad",
"attributes": {
"named": {
"label": "fullwidth"
},
"numeric": [
"fullwidth"
]
}
},
{
"type": "contentString",
"content": "\u003cdiv class=\"post-body\">\u003cp>\u003c/p>\n\u003cp>With climatologists predicting that \u003ca href=\"http://ww2.kqed.org/science/2015/09/02/floods-in-a-drought-how-a-monster-el-nino-could-bring-relief-and-misery-to-california/\" target=\"_blank\" rel=\"noopener\">this year’s El Niño \u003c/a>will usher in strong winds and torrential rains, weakened trees pose dangers to people and property across the state.\u003c/p>\n\u003caside class=\"pullquote alignright\">‘If we’re going to incur any sort of storm, there’s going be a lot of trees in jeopardy.’\u003ccite>Remy Hummer, Arborist\u003c/cite>\u003c/aside>\n\u003cp>In the Bay Area, arborists are working overtime to prune or remove trees on private property. And many homeowners aren’t receiving any assistance with the cost; San Francisco, Oakland and Berkeley don’t have funds designated for this. In San Francisco, even street trees — normally a municipal responsibility — are being turned over to residents because the city doesn’t have the money to manage them.\u003c/p>\n\u003cp>\u003cstrong>Protecting Power Lines\u003c/strong>\u003c/p>\n\u003cp>PG&E inspects millions of trees each year and is responsible for removing limbs and trees that pose a threat to power lines in urban and rural areas.\u003c/p>\n\u003cp>On a work site in Santa Cruz recently, program manager Joel Smith points out the signs of a dead tree, a Douglas fir that crews are trimming.\u003c/p>\n\u003cp>“There’s just a small portion of green up toward the top,” he says, “and the rest of the crown is basically dead.”\u003c/p>\n\u003cp>Clumps of pine needles at the top of this Douglas fir have started to turn brown, and lichen hangs from the lower branches. Smith says this tree is too close to power lines.\u003c/p>\n\u003cdiv>\n\u003c!-- iframe plugin v.4.3 wordpress.org/plugins/iframe/ -->\u003cbr>\n\u003ciframe loading=\"lazy\" src=\"http://gifs.com/embed/KkPDkb\" frameborder=\"0\" scrolling=\"no\" width=\"800\" height=\"450\" style=\"-webkit-backface-visibility: hidden;-webkit-transform: scale(1);\" class=\"iframe-class\">\u003c/iframe>\n\u003c/div>\n\u003cp>\u003cem>To get a sense of the size of this tree, look for the PG&E crew member who’s barely visible, just under the branch that’s being trimmed off.\u003c/em>\u003c/p>\n\u003cp>“It is very serious,” he says. “Trees that are dead or are otherwise compromised can fail, and if they are close to our high voltage lines they can cause those lines to come down, which can create a very dangerous public safety hazard, as well as taking out the power and potentially causing a wildfire.”\u003c/p>\n\u003cp>Cal Fire officials are currently investigating whether this month’s devastating Butte Fire was ignited when a tree came into contact with a power line.\u003c/p>\n\u003cp>This year, says PG&E, crews are taking out 30 percent more dead trees and twice as many hazardous trees as in a non-drought year. And when customers call for a tree inspection, crews are doing less pruning and more removal.\u003c/p>\n\u003cp>\u003cstrong>What Should Homeowners Do?\u003c/strong>\u003c/p>\n\u003cp>If you see a drought-stressed tree near a power line, call PG&E; if it’s a street tree, call 311 to schedule a city inspection. But if you’re worried about a tree on your property, call a certified arborist.\u003c/p>\n\u003cp>Remy Hummer with Arborist Now says he’s been working overtime since the beginning of the year, trimming and removing trees or supporting them with cables. He says a lot of calls this fall are from homeowners worried about storms.\u003c/p>\n\u003cfigure id=\"attachment_268059\" class=\"wp-caption alignright\" style=\"max-width: 800px\">\u003ca href=\"http://ww2.kqed.org/science/wp-content/uploads/sites/35/2015/09/Fallen-tree-in-Vallejo.jpg\">\u003cimg loading=\"lazy\" decoding=\"async\" class=\"size-medium wp-image-268059\" src=\"http://ww2.kqed.org/science/wp-content/uploads/sites/35/2015/09/Fallen-tree-in-Vallejo-800x600.jpg\" alt=\"A weakened tree is uprooted in Vallejo by winds from one of last winter's rare atmospheric river storms.\" width=\"800\" height=\"600\" srcset=\"https://cdn.kqed.org/wp-content/uploads/sites/35/2015/09/Fallen-tree-in-Vallejo-800x600.jpg 800w, https://cdn.kqed.org/wp-content/uploads/sites/35/2015/09/Fallen-tree-in-Vallejo-400x300.jpg 400w, https://cdn.kqed.org/wp-content/uploads/sites/35/2015/09/Fallen-tree-in-Vallejo-1180x885.jpg 1180w, https://cdn.kqed.org/wp-content/uploads/sites/35/2015/09/Fallen-tree-in-Vallejo-960x720.jpg 960w, https://cdn.kqed.org/wp-content/uploads/sites/35/2015/09/Fallen-tree-in-Vallejo.jpg 1280w\" sizes=\"(max-width: 800px) 100vw, 800px\">\u003c/a>\u003cfigcaption class=\"wp-caption-text\">A weakened tree in Vallejo was uprooted by winds from one of last winter’s atmospheric river storms. \u003ccite>(Craig Miller/KQED)\u003c/cite>\u003c/figcaption>\u003c/figure>\n\u003cp>“If we’re going to incur any sort of storm, there’s going to be a lot of trees in jeopardy,” he says, “even the ones that are very sound.”\u003c/p>\n\u003cp>San Francisco officials say even in an ordinary year, between one and three tree branches fall every week in the city.\u003c/p>\n\u003cp>But U.C. Berkeley forest ecologist Joe McBride says this winter, hundreds of branches could fall every week.\u003c/p>\n\u003cp>Climatologists now say there’s a 95 percent chance El Niño will last through the winter. And they’re saying the storms could be as big as the El Niño of 1997-98, when San Francisco received double its normal amount of rain.\u003c/p>\n\u003cp>One clue that you may have a drought-stressed tree is a brown crown, says McBride. He says the crown is often the first place to go dry, because the tree simply can’t send enough water up to the taller branches.\u003c/p>\n\u003cp>\u003cstrong>A Bad Storm\u003c/strong>\u003c/p>\n\u003cp>In his four decades studying trees, McBride says one of the worst winter storms he remembers was in 1991.\u003c/p>\n\u003cp>“There were record wind velocities following about a week of rainfall in San Francisco,” he says, “and an estimated 6,000 trees at the Presidio and in Golden Gate Park were blown over as a result of that.”\u003c/p>\n\u003cp>And it didn’t take long.\u003c/p>\n\u003cp>“It all occurred in about a period of six hours, this one really heavy windstorm,” he says. “Blocked streets, a number of structures were hit by falling trees, cars were hit. It was a major disaster.”\u003c/p>\n\u003cp>It was a somewhat rare combination of prolonged rainfall with record winds, McBride says. And as to whether something similar is possible this winter?\u003c/p>\n\u003cp>\u003c/p>\n\u003cp>“Oh, I think it’s possible,” he says, “yeah.”\u003c/p>\n\n\u003c/div>\u003c/p>",
"attributes": {
"named": {},
"numeric": []
}
}
],
"link": "/science/255377/drought-weakened-trees-pose-danger-in-winter-storms",
"authors": [
"5432"
],
"series": [
"science_1151"
],
"categories": [
"science_31",
"science_35",
"science_40",
"science_43"
],
"tags": [
"science_572",
"science_371",
"science_787"
],
"featImg": "science_267718",
"label": "science_1151"
},
"science_273866": {
"type": "posts",
"id": "science_273866",
"meta": {
"index": "posts_1716263798",
"site": "science",
"id": "273866",
"score": null,
"sort": [
1443247215000
]
},
"parent": 0,
"labelTerm": {
"site": "science"
},
"blocks": [],
"publishDate": 1443247215,
"format": "standard",
"title": "Restoring Marshland and Protecting Bay Shoreline From Rising Tides and Storm Events",
"headTitle": "Restoring Marshland and Protecting Bay Shoreline From Rising Tides and Storm Events | KQED",
"content": "\u003cp>The San Francisco Bay and Delta were once ringed by a deep fringe of marshes. They acted as the lungs and kidneys of the ecosystem, filtering water and providing homes to millions of shorebirds, ducks, fish and other wildlife. But because of diking, dredging and filling before 1970 when modern environmental laws began to protect wetlands, the amount of tidal marsh around the bay and delta declined from roughly 555,000 acres in 1800 to about 40,000 acres by 2009 -– a drop of more than 90 percent.\u003c/p>\n\u003cp>Since then, tidal marsh protection and restoration has been a priority for public agencies and environmental groups, and more than 11,000 acres have been added or restored. You can see an \u003ca href=\"http://maps.californiawetlands.net/soter2015/tidalmarsh/map/index.php\">animation of the bay’s marsh history\u003c/a> from the San Francisco Estuary Institute.\u003c/p>\n\u003cp>Now a pilot project is underway near Hayward that could revolutionize future tidal marsh restoration efforts, and pave the way for protecting property that rings the bay from rising sea levels that most scientists expect as climate change continues to warm the planet.\u003c/p>\n\u003cp>The “Horizontal Levee” project at the Oro Loma Sanitary District is a first-of-its-kind effort designed to mimic the way historical marsh areas work, from filtering wastewater to protecting the shoreline against battering waves and erosion during storms.\u003c/p>\n\u003cp>Unlike traditional narrow levees or sea walls, “horizontal levees” are wider, with a gentle slope from dry land toward the bay that is similar to natural wetlands. They are designed to blunt the force of waves, preventing flooding.\u003c/p>\n\u003cp>[ad fullwidth]\u003c/p>\n\u003cp>Planting thousands of native plants in the $9 million project is expected to begin Nov. 1, with the entire project taking about two years to complete. In addition to the wide, sloping levee, the plan also includes building a two-acre adjacent wetland area inside the levee near the Oro Loma sewage treatment plant.\u003c/p>\n\u003cp>The new freshwater wetland area will hold up to 8 million gallons of overflow water in storms. The wide levee and the wetland will be covered with plants, and will naturally filter and clean treated wastewater from the sewage plant through thousands of rushes and sedges. It also will provide habitat for wildlife. If the project is successful, it could be duplicated around the bay, scientists say.\u003c/p>\n\u003cfigure id=\"attachment_273868\" class=\"wp-caption alignright\" style=\"max-width: 800px\">\u003ca href=\"http://ww2.kqed.org/science/wp-content/uploads/sites/35/2015/09/IMG_2412.jpg\">\u003cimg loading=\"lazy\" decoding=\"async\" class=\"size-medium wp-image-273868\" src=\"http://ww2.kqed.org/science/wp-content/uploads/sites/35/2015/09/IMG_2412-800x1067.jpg\" alt=\"Teen volunteers from EBRPD's "Teen EcoAction" lend a hand transplanting native marsh plants at Save the Bay's nursery in Oakland.\" width=\"800\" height=\"1067\" srcset=\"https://cdn.kqed.org/wp-content/uploads/sites/35/2015/09/IMG_2412-800x1067.jpg 800w, https://cdn.kqed.org/wp-content/uploads/sites/35/2015/09/IMG_2412-400x533.jpg 400w, https://cdn.kqed.org/wp-content/uploads/sites/35/2015/09/IMG_2412.jpg 960w\" sizes=\"(max-width: 800px) 100vw, 800px\">\u003c/a>\u003cfigcaption class=\"wp-caption-text\">Teen volunteers from EBRPD’s “Teen EcoAction” lend a hand transplanting native marsh plants at Save the Bay’s nursery in Oakland. \u003ccite>(Morgan Dill, EBRPD)\u003c/cite>\u003c/figcaption>\u003c/figure>\n\u003cp>You can see more of the design in this \u003ca href=\"http://www.oroloma.org/asset/doc/ecotone/oro-loma-ecotone-public-outreach-brochure.pdf\">informational brochure\u003c/a> from the sanitary district.\u003c/p>\n\u003cp>Jessie Olson, nursery manager for Save the Bay, explained that planners grew more than 60,000 native marsh plants for the project.\u003c/p>\n\u003cp>The plants were raised from seeds, hand collected last summer and early fall, or grown from cuttings taken from sites around the bay, including Sears Point, China Camp and East Bay Regional parks.\u003c/p>\n\u003cp>To grow the native plants, Save the Bay staff and volunteers installed 17 large raised beds near the restoration site in addition to two existing nursery areas in Oakland and Palo Alto.\u003c/p>\n\u003cp>More than 20 species, including creeping wild rye, Baltic rush, spikerush, basket sedge and field sedge, western ragweed, California blackberry and alkali bulrush are ready to be planted in the project.\u003c/p>\n\u003cfigure id=\"attachment_273870\" class=\"wp-caption alignright\" style=\"max-width: 400px\">\u003ca href=\"http://ww2.kqed.org/science/wp-content/uploads/sites/35/2015/09/IMG_0036.jpg\">\u003cimg loading=\"lazy\" decoding=\"async\" class=\"size-thumbnail wp-image-273870\" src=\"http://ww2.kqed.org/science/wp-content/uploads/sites/35/2015/09/IMG_0036-400x267.jpg\" alt=\"The new marsh will be beautiful as well as functional. California loosestrife (Lythrum californicum) is one of the native plants grown for the project.\" width=\"400\" height=\"267\" srcset=\"https://cdn.kqed.org/wp-content/uploads/sites/35/2015/09/IMG_0036-400x267.jpg 400w, https://cdn.kqed.org/wp-content/uploads/sites/35/2015/09/IMG_0036-800x533.jpg 800w, https://cdn.kqed.org/wp-content/uploads/sites/35/2015/09/IMG_0036-1440x960.jpg 1440w, https://cdn.kqed.org/wp-content/uploads/sites/35/2015/09/IMG_0036-1920x1280.jpg 1920w, https://cdn.kqed.org/wp-content/uploads/sites/35/2015/09/IMG_0036-1180x787.jpg 1180w, https://cdn.kqed.org/wp-content/uploads/sites/35/2015/09/IMG_0036-960x640.jpg 960w\" sizes=\"(max-width: 400px) 100vw, 400px\">\u003c/a>\u003cfigcaption class=\"wp-caption-text\">The new marsh will be beautiful as well as functional. California loosestrife (Lythrum californicum) is one of the native plants grown for the project. \u003ccite>(Vivian Reed, Save the Bay)\u003c/cite>\u003c/figcaption>\u003c/figure>\n\u003cp>The work is the latest in wetland restoration efforts around the east and southern parts of the bay, the most prominent being the South Bay Salt Restoration Project, in which state and federal officials are converting thousands of acres of former Cargill Salt industrial evaporation ponds back into marshes for ducks, shorebirds and fish.\u003c/p>\n\u003cp>“People are so excited about the Oro Loma project,” said Olson. “With the South Bay Salt Pond Restoration Project coming online, there is a lot of hope for tidal marsh and transition zones to be restored around the bay.”\u003c/p>\n\u003cp>\u003c/p>\n\u003cp>For more about the “Horizontal Levee” project see \u003ca href=\"http://science.kqed.org/quest/2013/07/16/wetlands-horizontal-levees-sea-level-rise/\">“Are Wetlands Nature’s Best Defense Against Sea Level Rise?” \u003c/a>\u003c/p>\n\n",
"stats": {
"hasVideo": false,
"hasChartOrMap": false,
"hasAudio": false,
"hasPolis": false,
"wordCount": 698,
"hasGoogleForm": false,
"hasGallery": false,
"hasHearkenModule": false,
"iframeSrcs": [],
"paragraphCount": 17
},
"modified": 1704931276,
"excerpt": "A project revolutionizing future tidal marsh restoration efforts, paving the way for protecting property.",
"headData": {
"twImgId": "",
"twTitle": "",
"ogTitle": "",
"ogImgId": "",
"twDescription": "",
"description": "A project revolutionizing future tidal marsh restoration efforts, paving the way for protecting property.",
"title": "Restoring Marshland and Protecting Bay Shoreline From Rising Tides and Storm Events | KQED",
"ogDescription": "",
"schema": {
"@context": "https://schema.org",
"@type": "Article",
"headline": "Restoring Marshland and Protecting Bay Shoreline From Rising Tides and Storm Events",
"datePublished": "2015-09-25T23:00:15-07:00",
"dateModified": "2024-01-10T16:01:16-08:00",
"image": "https://cdn.kqed.org/wp-content/uploads/2020/02/KQED-OG-Image@1x.png"
}
},
"guestAuthors": [],
"slug": "restoring-marshland-and-protecting-bay-shoreline-from-rising-tides-and-storm-events",
"status": "publish",
"sticky": false,
"path": "/science/273866/restoring-marshland-and-protecting-bay-shoreline-from-rising-tides-and-storm-events",
"audioTrackLength": null,
"parsedContent": [
{
"type": "contentString",
"content": "\u003cdiv class=\"post-body\">\u003cp>\u003cp>The San Francisco Bay and Delta were once ringed by a deep fringe of marshes. They acted as the lungs and kidneys of the ecosystem, filtering water and providing homes to millions of shorebirds, ducks, fish and other wildlife. But because of diking, dredging and filling before 1970 when modern environmental laws began to protect wetlands, the amount of tidal marsh around the bay and delta declined from roughly 555,000 acres in 1800 to about 40,000 acres by 2009 -– a drop of more than 90 percent.\u003c/p>\n\u003cp>Since then, tidal marsh protection and restoration has been a priority for public agencies and environmental groups, and more than 11,000 acres have been added or restored. You can see an \u003ca href=\"http://maps.californiawetlands.net/soter2015/tidalmarsh/map/index.php\">animation of the bay’s marsh history\u003c/a> from the San Francisco Estuary Institute.\u003c/p>\n\u003cp>Now a pilot project is underway near Hayward that could revolutionize future tidal marsh restoration efforts, and pave the way for protecting property that rings the bay from rising sea levels that most scientists expect as climate change continues to warm the planet.\u003c/p>\n\u003cp>The “Horizontal Levee” project at the Oro Loma Sanitary District is a first-of-its-kind effort designed to mimic the way historical marsh areas work, from filtering wastewater to protecting the shoreline against battering waves and erosion during storms.\u003c/p>\n\u003cp>Unlike traditional narrow levees or sea walls, “horizontal levees” are wider, with a gentle slope from dry land toward the bay that is similar to natural wetlands. They are designed to blunt the force of waves, preventing flooding.\u003c/p>\n\u003cp>\u003c/p>\u003c/div>",
"attributes": {
"named": {},
"numeric": []
}
},
{
"type": "component",
"content": "",
"name": "ad",
"attributes": {
"named": {
"label": "fullwidth"
},
"numeric": [
"fullwidth"
]
}
},
{
"type": "contentString",
"content": "\u003cdiv class=\"post-body\">\u003cp>\u003c/p>\n\u003cp>Planting thousands of native plants in the $9 million project is expected to begin Nov. 1, with the entire project taking about two years to complete. In addition to the wide, sloping levee, the plan also includes building a two-acre adjacent wetland area inside the levee near the Oro Loma sewage treatment plant.\u003c/p>\n\u003cp>The new freshwater wetland area will hold up to 8 million gallons of overflow water in storms. The wide levee and the wetland will be covered with plants, and will naturally filter and clean treated wastewater from the sewage plant through thousands of rushes and sedges. It also will provide habitat for wildlife. If the project is successful, it could be duplicated around the bay, scientists say.\u003c/p>\n\u003cfigure id=\"attachment_273868\" class=\"wp-caption alignright\" style=\"max-width: 800px\">\u003ca href=\"http://ww2.kqed.org/science/wp-content/uploads/sites/35/2015/09/IMG_2412.jpg\">\u003cimg loading=\"lazy\" decoding=\"async\" class=\"size-medium wp-image-273868\" src=\"http://ww2.kqed.org/science/wp-content/uploads/sites/35/2015/09/IMG_2412-800x1067.jpg\" alt=\"Teen volunteers from EBRPD's "Teen EcoAction" lend a hand transplanting native marsh plants at Save the Bay's nursery in Oakland.\" width=\"800\" height=\"1067\" srcset=\"https://cdn.kqed.org/wp-content/uploads/sites/35/2015/09/IMG_2412-800x1067.jpg 800w, https://cdn.kqed.org/wp-content/uploads/sites/35/2015/09/IMG_2412-400x533.jpg 400w, https://cdn.kqed.org/wp-content/uploads/sites/35/2015/09/IMG_2412.jpg 960w\" sizes=\"(max-width: 800px) 100vw, 800px\">\u003c/a>\u003cfigcaption class=\"wp-caption-text\">Teen volunteers from EBRPD’s “Teen EcoAction” lend a hand transplanting native marsh plants at Save the Bay’s nursery in Oakland. \u003ccite>(Morgan Dill, EBRPD)\u003c/cite>\u003c/figcaption>\u003c/figure>\n\u003cp>You can see more of the design in this \u003ca href=\"http://www.oroloma.org/asset/doc/ecotone/oro-loma-ecotone-public-outreach-brochure.pdf\">informational brochure\u003c/a> from the sanitary district.\u003c/p>\n\u003cp>Jessie Olson, nursery manager for Save the Bay, explained that planners grew more than 60,000 native marsh plants for the project.\u003c/p>\n\u003cp>The plants were raised from seeds, hand collected last summer and early fall, or grown from cuttings taken from sites around the bay, including Sears Point, China Camp and East Bay Regional parks.\u003c/p>\n\u003cp>To grow the native plants, Save the Bay staff and volunteers installed 17 large raised beds near the restoration site in addition to two existing nursery areas in Oakland and Palo Alto.\u003c/p>\n\u003cp>More than 20 species, including creeping wild rye, Baltic rush, spikerush, basket sedge and field sedge, western ragweed, California blackberry and alkali bulrush are ready to be planted in the project.\u003c/p>\n\u003cfigure id=\"attachment_273870\" class=\"wp-caption alignright\" style=\"max-width: 400px\">\u003ca href=\"http://ww2.kqed.org/science/wp-content/uploads/sites/35/2015/09/IMG_0036.jpg\">\u003cimg loading=\"lazy\" decoding=\"async\" class=\"size-thumbnail wp-image-273870\" src=\"http://ww2.kqed.org/science/wp-content/uploads/sites/35/2015/09/IMG_0036-400x267.jpg\" alt=\"The new marsh will be beautiful as well as functional. California loosestrife (Lythrum californicum) is one of the native plants grown for the project.\" width=\"400\" height=\"267\" srcset=\"https://cdn.kqed.org/wp-content/uploads/sites/35/2015/09/IMG_0036-400x267.jpg 400w, https://cdn.kqed.org/wp-content/uploads/sites/35/2015/09/IMG_0036-800x533.jpg 800w, https://cdn.kqed.org/wp-content/uploads/sites/35/2015/09/IMG_0036-1440x960.jpg 1440w, https://cdn.kqed.org/wp-content/uploads/sites/35/2015/09/IMG_0036-1920x1280.jpg 1920w, https://cdn.kqed.org/wp-content/uploads/sites/35/2015/09/IMG_0036-1180x787.jpg 1180w, https://cdn.kqed.org/wp-content/uploads/sites/35/2015/09/IMG_0036-960x640.jpg 960w\" sizes=\"(max-width: 400px) 100vw, 400px\">\u003c/a>\u003cfigcaption class=\"wp-caption-text\">The new marsh will be beautiful as well as functional. California loosestrife (Lythrum californicum) is one of the native plants grown for the project. \u003ccite>(Vivian Reed, Save the Bay)\u003c/cite>\u003c/figcaption>\u003c/figure>\n\u003cp>The work is the latest in wetland restoration efforts around the east and southern parts of the bay, the most prominent being the South Bay Salt Restoration Project, in which state and federal officials are converting thousands of acres of former Cargill Salt industrial evaporation ponds back into marshes for ducks, shorebirds and fish.\u003c/p>\n\u003cp>“People are so excited about the Oro Loma project,” said Olson. “With the South Bay Salt Pond Restoration Project coming online, there is a lot of hope for tidal marsh and transition zones to be restored around the bay.”\u003c/p>\n\u003cp>\u003c/p>\n\u003cp>For more about the “Horizontal Levee” project see \u003ca href=\"http://science.kqed.org/quest/2013/07/16/wetlands-horizontal-levees-sea-level-rise/\">“Are Wetlands Nature’s Best Defense Against Sea Level Rise?” \u003c/a>\u003c/p>\n\n\u003c/div>\u003c/p>",
"attributes": {
"named": {},
"numeric": []
}
}
],
"link": "/science/273866/restoring-marshland-and-protecting-bay-shoreline-from-rising-tides-and-storm-events",
"authors": [
"6328"
],
"categories": [
"science_31",
"science_35"
],
"tags": [
"science_454",
"science_208"
],
"featImg": "science_273867",
"label": "science"
},
"science_270178": {
"type": "posts",
"id": "science_270178",
"meta": {
"index": "posts_1716263798",
"site": "science",
"id": "270178",
"score": null,
"sort": [
1442968580000
]
},
"parent": 0,
"labelTerm": {
"site": "science"
},
"blocks": [],
"publishDate": 1442968580,
"format": "standard",
"title": "How El Niño Might Have Fed the Valley Fire's Strange Ferocity",
"headTitle": "How El Niño Might Have Fed the Valley Fire’s Strange Ferocity | KQED",
"content": "\u003cp>Researchers at San Jose State have a theory that could explain the wind-driven explosive growth of the \u003ca href=\"http://ww2.kqed.org/news/2015/09/13/valley-fire-forcing-residents-to-evacuate-injures-firefighters-in-lake-county\">Valley Fire\u003c/a>, and as strange as it sounds it’s … a hurricane.\u003c/p>\n\u003cp>Strengthening El Niño conditions have spawned an active Pacific hurricane season. Just as the Valley Fire was getting started, a dying hurricane named Linda was still pumping moist air into the upper atmosphere, well north along the California coast.\u003c/p>\n\u003cp>“And it’s really the mixture of those two air masses — the moist air aloft and the really dry air near the surface — that led to the development of these winds,” says Neil Lareau, a researcher at the university’s Fire Weather Research Lab and \u003ca href=\"http://www.fireweather.org/blog/2015/9/15/did-tropical-moisture-contribute-to-the-valley-fire-blow-up\">co-author of the article\u003c/a> appearing on the lab’s website.\u003c/p>\n\u003cp>“Cooler air is actually denser than warmer air,” he explains. “So when you cool the air, it tends to sink towards the surface, and it also tends to develop higher pressure.”\u003c/p>\n\u003cp>That high pressure building just off the coast created a “burst of northwest winds” that bedeviled firefighters with 35 mph gusts.\u003c/p>\n\u003cp>[ad fullwidth]\u003c/p>\n\u003cp>\u003cstrong>When Wetter Isn’t Better\u003cbr>\n\u003c/strong>\u003c/p>\n\u003cp>The rain that never made it to the ground (known as virga) in the fire zone actually made matters worse, in Lareau’s analysis. Evaporating raindrops rapidly cooled the upper-level air, which created a downdraft that increased winds locally.\u003c/p>\n\u003cp>While Lareau’s article is not based on any formal peer-reviewed study, he writes that there is “clear evidence that tropical moisture contributed to enhanced northwest winds that propelled the fire.”\u003c/p>\n\u003cp>When the fire was in its most explosive growth phase, fire officials marveled at how the blaze seemed to leapfrog attempts to subdue it.\u003c/p>\n\u003cp>“The fire would throw embers a half-mile beyond where firefighters were working,” said Cal Fire spokesman Daniel Berlant.\u003c/p>\n\u003cp>“This is the kind of fire we \u003ca href=\"http://ww2.kqed.org/science/2015/09/17/why-the-worst-of-fire-season-may-lie-ahead/\">would see with Santa Ana winds\u003c/a> but in our area, this is unprecedented.”\u003c/p>\n\u003cp>Lareau has an explanation for that, too. He says the same bizarre set of meteorological conditions caused the usual upward column of hot air to tilt.\u003c/p>\n\u003cp>“And then all of those embers that would’ve been going straight up in the plume get ejected out in front of the initial fire,” explains Lareau, “causing new fires to form in this kind of hopscotch fire growth across the landscape.”\u003c/p>\n\u003cp>\u003c/p>\n\u003cp>Lareau says it’s hard to tell what implications this has for the remaining fire season. The likelihood of similar events might depend on what other storms are spun out of the tropical Pacific by El Niño.\u003c/p>\n\n",
"stats": {
"hasVideo": false,
"hasChartOrMap": false,
"hasAudio": false,
"hasPolis": false,
"wordCount": 459,
"hasGoogleForm": false,
"hasGallery": false,
"hasHearkenModule": false,
"iframeSrcs": [],
"paragraphCount": 16
},
"modified": 1704931289,
"excerpt": "Strengthening El Niño conditions have spawned an active Pacific hurricane season, one long tendril of which could have stoked flames in Lake County.",
"headData": {
"twImgId": "",
"twTitle": "",
"ogTitle": "",
"ogImgId": "",
"twDescription": "",
"description": "Strengthening El Niño conditions have spawned an active Pacific hurricane season, one long tendril of which could have stoked flames in Lake County.",
"title": "How El Niño Might Have Fed the Valley Fire's Strange Ferocity | KQED",
"ogDescription": "",
"schema": {
"@context": "https://schema.org",
"@type": "Article",
"headline": "How El Niño Might Have Fed the Valley Fire's Strange Ferocity",
"datePublished": "2015-09-22T17:36:20-07:00",
"dateModified": "2024-01-10T16:01:29-08:00",
"image": "https://cdn.kqed.org/wp-content/uploads/2020/02/KQED-OG-Image@1x.png"
}
},
"guestAuthors": [],
"slug": "how-el-nino-might-have-fed-the-valley-fires-strange-ferocity",
"status": "publish",
"sticky": false,
"path": "/science/270178/how-el-nino-might-have-fed-the-valley-fires-strange-ferocity",
"audioTrackLength": null,
"parsedContent": [
{
"type": "contentString",
"content": "\u003cdiv class=\"post-body\">\u003cp>\u003cp>Researchers at San Jose State have a theory that could explain the wind-driven explosive growth of the \u003ca href=\"http://ww2.kqed.org/news/2015/09/13/valley-fire-forcing-residents-to-evacuate-injures-firefighters-in-lake-county\">Valley Fire\u003c/a>, and as strange as it sounds it’s … a hurricane.\u003c/p>\n\u003cp>Strengthening El Niño conditions have spawned an active Pacific hurricane season. Just as the Valley Fire was getting started, a dying hurricane named Linda was still pumping moist air into the upper atmosphere, well north along the California coast.\u003c/p>\n\u003cp>“And it’s really the mixture of those two air masses — the moist air aloft and the really dry air near the surface — that led to the development of these winds,” says Neil Lareau, a researcher at the university’s Fire Weather Research Lab and \u003ca href=\"http://www.fireweather.org/blog/2015/9/15/did-tropical-moisture-contribute-to-the-valley-fire-blow-up\">co-author of the article\u003c/a> appearing on the lab’s website.\u003c/p>\n\u003cp>“Cooler air is actually denser than warmer air,” he explains. “So when you cool the air, it tends to sink towards the surface, and it also tends to develop higher pressure.”\u003c/p>\n\u003cp>That high pressure building just off the coast created a “burst of northwest winds” that bedeviled firefighters with 35 mph gusts.\u003c/p>\n\u003cp>\u003c/p>\u003c/div>",
"attributes": {
"named": {},
"numeric": []
}
},
{
"type": "component",
"content": "",
"name": "ad",
"attributes": {
"named": {
"label": "fullwidth"
},
"numeric": [
"fullwidth"
]
}
},
{
"type": "contentString",
"content": "\u003cdiv class=\"post-body\">\u003cp>\u003c/p>\n\u003cp>\u003cstrong>When Wetter Isn’t Better\u003cbr>\n\u003c/strong>\u003c/p>\n\u003cp>The rain that never made it to the ground (known as virga) in the fire zone actually made matters worse, in Lareau’s analysis. Evaporating raindrops rapidly cooled the upper-level air, which created a downdraft that increased winds locally.\u003c/p>\n\u003cp>While Lareau’s article is not based on any formal peer-reviewed study, he writes that there is “clear evidence that tropical moisture contributed to enhanced northwest winds that propelled the fire.”\u003c/p>\n\u003cp>When the fire was in its most explosive growth phase, fire officials marveled at how the blaze seemed to leapfrog attempts to subdue it.\u003c/p>\n\u003cp>“The fire would throw embers a half-mile beyond where firefighters were working,” said Cal Fire spokesman Daniel Berlant.\u003c/p>\n\u003cp>“This is the kind of fire we \u003ca href=\"http://ww2.kqed.org/science/2015/09/17/why-the-worst-of-fire-season-may-lie-ahead/\">would see with Santa Ana winds\u003c/a> but in our area, this is unprecedented.”\u003c/p>\n\u003cp>Lareau has an explanation for that, too. He says the same bizarre set of meteorological conditions caused the usual upward column of hot air to tilt.\u003c/p>\n\u003cp>“And then all of those embers that would’ve been going straight up in the plume get ejected out in front of the initial fire,” explains Lareau, “causing new fires to form in this kind of hopscotch fire growth across the landscape.”\u003c/p>\n\u003cp>\u003c/p>\n\u003cp>Lareau says it’s hard to tell what implications this has for the remaining fire season. The likelihood of similar events might depend on what other storms are spun out of the tropical Pacific by El Niño.\u003c/p>\n\n\u003c/div>\u003c/p>",
"attributes": {
"named": {},
"numeric": []
}
}
],
"link": "/science/270178/how-el-nino-might-have-fed-the-valley-fires-strange-ferocity",
"authors": [
"221"
],
"categories": [
"science_31",
"science_40",
"science_42"
],
"tags": [
"science_371",
"science_1596",
"science_113"
],
"featImg": "science_270240",
"label": "science"
},
"science_255463": {
"type": "posts",
"id": "science_255463",
"meta": {
"index": "posts_1716263798",
"site": "science",
"id": "255463",
"score": null,
"sort": [
1442519078000
]
},
"parent": 0,
"labelTerm": {
"site": "science",
"term": 1151
},
"blocks": [],
"publishDate": 1442519078,
"format": "standard",
"title": "Why the Worst of Fire Season May Lie Ahead",
"headTitle": "Why the Worst of Fire Season May Lie Ahead | KQED",
"content": "\u003cp>As bad as things are already, the system in place to manage California’s \u003ca href=\"http://ww2.kqed.org/news/2015/09/13/valley-fire-forcing-residents-to-evacuate-injures-firefighters-in-lake-county\">wildfire season\u003c/a> is already “stretched very, very thinly,” according to Mark Ghilarducci, who directs the state’s Office of Emergency Services.\u003c/p>\n\u003cp>“The fire season itself has probably been the most extreme that I’ve seen in my 30 years,” said Ghilarducci in a state-produced \u003ca href=\"https://vimeo.com/139405750\">video interview\u003c/a> on Tuesday.\u003c/p>\n\u003cp>And it’s not over. In fact, it could get worse, for three main reasons:\u003c/p>\n\u003cp>\u003cstrong>We’re still in a drought\u003c/strong>\u003c/p>\n\u003cp>The “rainy season” is still a good six weeks away though don’t tell L.A. residents who got a \u003ca href=\"http://www.latimes.com/local/lanow/la-me-ln-rain-moves-into-southern-california-thanks-to-former-hurricane-linda-20150915-story.html\">surprise drenching\u003c/a> of nearly two inches of rain in one morning this week. The Southland has seen other freak rains this summer, which washed out a freeway overpass and forced the first Major League Baseball rain-outs in two decades. Those were shards from an active Pacific hurricane season, probably linked to El Niño.\u003c/p>\n\u003cp>[ad fullwidth]\u003c/p>\n\u003cp>But the light rain that fell near the \u003ca href=\"http://ww2.kqed.org/news/2015/09/14/photos-scenes-from-the-lake-county-valley-fire\">Valley Fire\u003c/a> on Monday, never even made it to the ground, according to officials on the scene. In fact, \u003ca href=\"http://www.fireweather.org/blog/2015/9/15/did-tropical-moisture-contribute-to-the-valley-fire-blow-up\">preliminary research\u003c/a> at San Jose State University’s Fire Weather Research Lab suggests that the \u003ca href=\"http://earthsky.org/earth/virga-is-rain-that-doesnt-reach-the-ground\">virga\u003c/a> actually made matters worse on the ground.\u003c/p>\n\u003cp>“The rain that we saw in Southern California notwithstanding, it certainly hasn’t rained like that up north and even in the south it will dry out quickly,” warns Stanford climate scientist Daniel Swain.\u003c/p>\n\u003cp>“California is still experiencing really severe drought conditions and we definitely have a few more months before we see substantial relief.”\u003c/p>\n\u003cp>Swain says that even if the current El Niño conditions in the Pacific turn out to be a major rainmaker, California is not likely to see the peak effects until December or January. Meanwhile, each passing week without substantial precipitation increases evaporation, baking out what little moisture remains in soils and setting the stage for more severe wildfires.\u003c/p>\n\u003cp>\u003cstrong>Changes in the Wind\u003cbr>\n\u003c/strong>\u003c/p>\n\u003cp>Some of California’s most aggressive fires are driven by what scientists call katabatic winds, \u003ca href=\"http://blogs.kqed.org/climatewatch/2011/12/01/santa-ana-wind-season-may-be-stretched-by-climate-change/\">better known as Santa Anas\u003c/a> in Southern California, Diablos in the north.\u003c/p>\n\u003cp>In the fall, the usual onshore breezes start backing around and dry easterly winds roar through mountain passes, speeding up and heating up along the way. This season, some fires have behaved like classic Santa Ana-driven fires — without the winds.\u003c/p>\n\u003cp>The devastating Valley Fire north of the Bay Area stunned firefighters, blowing up to 40,000 acres in one day.\u003c/p>\n\u003cp>“The fire would throw embers a half-mile beyond where firefighters were working, said Cal Fire spokesman Daniel Berlant.\u003c/p>\n\u003cp>“This is the kind of fire we would see with Santa Ana winds but in our area, this is unprecedented.”\u003c/p>\n\u003cp>\u003cstrong>High Temperatures Will Up the Ante\u003cbr>\n\u003c/strong>\u003c/p>\n\u003cp>Add to the mix the abnormally high temperatures that have persisted this summer, often at the most inopportune times, such as the early days of the Valley Fire.\u003c/p>\n\u003cp>“This late-season heat really sort of sets the stage for any big offshore wind events—these Santa Ana or Diablo winds that often occur later in the fall,” warns Swain.\u003c/p>\n\u003cp>2014 went down as California’s warmest year on record and 2015 is on track to beat it. According to NOAA, the statewide average temperature was slightly above normal in July, then spiked to nearly 3 degrees Fahrenheit above the 20th Century average in August.\u003c/p>\n\u003cp>Some of the state’s most catastrophic fires have broken out in October, including the historic \u003ca href=\"https://oaklandnorth.net/oakland-hills-fire/\">Oakland Hills firestorm, \u003c/a>which destroyed more than 3,000 homes in 1991.\u003c/p>\n\u003cp>\u003c/p>\n\u003cp>“All the vegetation is drought-stressed and especially dry given the heat wave, and so if and when we get these big wind events over the next couple of months, that’s probably going to lead to some big problems,” says Swain.\u003c/p>\n\n",
"stats": {
"hasVideo": false,
"hasChartOrMap": false,
"hasAudio": false,
"hasPolis": false,
"wordCount": 669,
"hasGoogleForm": false,
"hasGallery": false,
"hasHearkenModule": false,
"iframeSrcs": [],
"paragraphCount": 23
},
"modified": 1704931312,
"excerpt": "The fire season has been \"a marathon, not a sprint,\" according to one top official -- and there are miles left to go.",
"headData": {
"twImgId": "",
"twTitle": "",
"ogTitle": "",
"ogImgId": "",
"twDescription": "",
"description": "The fire season has been "a marathon, not a sprint," according to one top official -- and there are miles left to go.",
"title": "Why the Worst of Fire Season May Lie Ahead | KQED",
"ogDescription": "",
"schema": {
"@context": "https://schema.org",
"@type": "Article",
"headline": "Why the Worst of Fire Season May Lie Ahead",
"datePublished": "2015-09-17T12:44:38-07:00",
"dateModified": "2024-01-10T16:01:52-08:00",
"image": "https://cdn.kqed.org/wp-content/uploads/2020/02/KQED-OG-Image@1x.png"
}
},
"guestAuthors": [],
"slug": "why-the-worst-of-fire-season-may-lie-ahead",
"status": "publish",
"sticky": false,
"path": "/science/255463/why-the-worst-of-fire-season-may-lie-ahead",
"audioTrackLength": null,
"parsedContent": [
{
"type": "contentString",
"content": "\u003cdiv class=\"post-body\">\u003cp>\u003cp>As bad as things are already, the system in place to manage California’s \u003ca href=\"http://ww2.kqed.org/news/2015/09/13/valley-fire-forcing-residents-to-evacuate-injures-firefighters-in-lake-county\">wildfire season\u003c/a> is already “stretched very, very thinly,” according to Mark Ghilarducci, who directs the state’s Office of Emergency Services.\u003c/p>\n\u003cp>“The fire season itself has probably been the most extreme that I’ve seen in my 30 years,” said Ghilarducci in a state-produced \u003ca href=\"https://vimeo.com/139405750\">video interview\u003c/a> on Tuesday.\u003c/p>\n\u003cp>And it’s not over. In fact, it could get worse, for three main reasons:\u003c/p>\n\u003cp>\u003cstrong>We’re still in a drought\u003c/strong>\u003c/p>\n\u003cp>The “rainy season” is still a good six weeks away though don’t tell L.A. residents who got a \u003ca href=\"http://www.latimes.com/local/lanow/la-me-ln-rain-moves-into-southern-california-thanks-to-former-hurricane-linda-20150915-story.html\">surprise drenching\u003c/a> of nearly two inches of rain in one morning this week. The Southland has seen other freak rains this summer, which washed out a freeway overpass and forced the first Major League Baseball rain-outs in two decades. Those were shards from an active Pacific hurricane season, probably linked to El Niño.\u003c/p>\n\u003cp>\u003c/p>\u003c/div>",
"attributes": {
"named": {},
"numeric": []
}
},
{
"type": "component",
"content": "",
"name": "ad",
"attributes": {
"named": {
"label": "fullwidth"
},
"numeric": [
"fullwidth"
]
}
},
{
"type": "contentString",
"content": "\u003cdiv class=\"post-body\">\u003cp>\u003c/p>\n\u003cp>But the light rain that fell near the \u003ca href=\"http://ww2.kqed.org/news/2015/09/14/photos-scenes-from-the-lake-county-valley-fire\">Valley Fire\u003c/a> on Monday, never even made it to the ground, according to officials on the scene. In fact, \u003ca href=\"http://www.fireweather.org/blog/2015/9/15/did-tropical-moisture-contribute-to-the-valley-fire-blow-up\">preliminary research\u003c/a> at San Jose State University’s Fire Weather Research Lab suggests that the \u003ca href=\"http://earthsky.org/earth/virga-is-rain-that-doesnt-reach-the-ground\">virga\u003c/a> actually made matters worse on the ground.\u003c/p>\n\u003cp>“The rain that we saw in Southern California notwithstanding, it certainly hasn’t rained like that up north and even in the south it will dry out quickly,” warns Stanford climate scientist Daniel Swain.\u003c/p>\n\u003cp>“California is still experiencing really severe drought conditions and we definitely have a few more months before we see substantial relief.”\u003c/p>\n\u003cp>Swain says that even if the current El Niño conditions in the Pacific turn out to be a major rainmaker, California is not likely to see the peak effects until December or January. Meanwhile, each passing week without substantial precipitation increases evaporation, baking out what little moisture remains in soils and setting the stage for more severe wildfires.\u003c/p>\n\u003cp>\u003cstrong>Changes in the Wind\u003cbr>\n\u003c/strong>\u003c/p>\n\u003cp>Some of California’s most aggressive fires are driven by what scientists call katabatic winds, \u003ca href=\"http://blogs.kqed.org/climatewatch/2011/12/01/santa-ana-wind-season-may-be-stretched-by-climate-change/\">better known as Santa Anas\u003c/a> in Southern California, Diablos in the north.\u003c/p>\n\u003cp>In the fall, the usual onshore breezes start backing around and dry easterly winds roar through mountain passes, speeding up and heating up along the way. This season, some fires have behaved like classic Santa Ana-driven fires — without the winds.\u003c/p>\n\u003cp>The devastating Valley Fire north of the Bay Area stunned firefighters, blowing up to 40,000 acres in one day.\u003c/p>\n\u003cp>“The fire would throw embers a half-mile beyond where firefighters were working, said Cal Fire spokesman Daniel Berlant.\u003c/p>\n\u003cp>“This is the kind of fire we would see with Santa Ana winds but in our area, this is unprecedented.”\u003c/p>\n\u003cp>\u003cstrong>High Temperatures Will Up the Ante\u003cbr>\n\u003c/strong>\u003c/p>\n\u003cp>Add to the mix the abnormally high temperatures that have persisted this summer, often at the most inopportune times, such as the early days of the Valley Fire.\u003c/p>\n\u003cp>“This late-season heat really sort of sets the stage for any big offshore wind events—these Santa Ana or Diablo winds that often occur later in the fall,” warns Swain.\u003c/p>\n\u003cp>2014 went down as California’s warmest year on record and 2015 is on track to beat it. According to NOAA, the statewide average temperature was slightly above normal in July, then spiked to nearly 3 degrees Fahrenheit above the 20th Century average in August.\u003c/p>\n\u003cp>Some of the state’s most catastrophic fires have broken out in October, including the historic \u003ca href=\"https://oaklandnorth.net/oakland-hills-fire/\">Oakland Hills firestorm, \u003c/a>which destroyed more than 3,000 homes in 1991.\u003c/p>\n\u003cp>\u003c/p>\n\u003cp>“All the vegetation is drought-stressed and especially dry given the heat wave, and so if and when we get these big wind events over the next couple of months, that’s probably going to lead to some big problems,” says Swain.\u003c/p>\n\n\u003c/div>\u003c/p>",
"attributes": {
"named": {},
"numeric": []
}
}
],
"link": "/science/255463/why-the-worst-of-fire-season-may-lie-ahead",
"authors": [
"221"
],
"series": [
"science_1151"
],
"categories": [
"science_31",
"science_40"
],
"tags": [
"science_1596",
"science_113"
],
"featImg": "science_258300",
"label": "science_1151"
},
"science_247785": {
"type": "posts",
"id": "science_247785",
"meta": {
"index": "posts_1716263798",
"site": "science",
"id": "247785",
"score": null,
"sort": [
1442235649000
]
},
"parent": 0,
"labelTerm": {
"site": "science"
},
"blocks": [],
"publishDate": 1442235649,
"format": "standard",
"title": "Big Challenge as California Ramps Up Wind Power: Golden Eagles",
"headTitle": "Big Challenge as California Ramps Up Wind Power: Golden Eagles | KQED",
"content": "\u003cp>\u003cstrong>Listen to the story:\u003c/strong>\u003cbr>\nhttp://www.kqed.org/.stream/anon/radio//2015/09/WindFarmsEagles.mp3\u003c/p>\n\u003cp>California’s history with wind power goes back decades — as do its troubles with turbines killing birds, including federally protected golden eagles.\u003c/p>\n\u003cp>With state officials now planning to ramp up renewable energy, an uneasy tension exists between protecting wildlife, and fighting climate change.\u003c/p>\n\u003caside class=\"pullquote alignright\">“At nighttime, as soon as it gets dark, striped skunks run to the wind turbines. Literally run.”\u003ccite>Shawn Smallwood, Ecologist\u003c/cite>\u003c/aside>\n\u003cp>Ecologist Shawn Smallwood has found mangled eagles several times in wind farms like those at Altamont Pass, near Livermore. The place has a reputation for turbines killing birds. Alameda County estimates 35 golden eagles were killed there in 2013.\u003c/p>\n\u003cp>Researching this problem is complicated partly by scavengers, such as ravens, snatching up carcasses before Smallwood can tally them. Coyotes, foxes and badgers converge on the wind farm and search the grounds in a pattern, he says, just like a scientist would.\u003c/p>\n\u003cp>[ad fullwidth]\u003c/p>\n\u003cp>“At nighttime, as soon as it gets dark, striped skunks run to the wind turbines. Literally run,” says Smallwood. “They also go to the turbines that kill the most animals, so they’re familiar with where they can find food. They usually go to the downwind side of the turbines, again where the bats and birds are most likely to fall after they get hit by a wind turbine.”\u003c/p>\n\u003cp>The history of wind power is littered with attempts to make turbines safer for birds and bats. \u003ca href=\"https://www.youtube.com/watch?v=RtgBWNKwBkE\">It’s not easy\u003c/a>. Golden eagles fix their eyesight on prey on the ground and don’t necessarily see what they’re flying into. Smallwood once advocated shutting turbines off over winter, but says on an overcast day, birds can still fly right into blades that aren’t even turning.\u003c/p>\n\u003cfigure id=\"attachment_247869\" class=\"wp-caption alignleft\" style=\"max-width: 401px\">\u003ca href=\"http://ww2.kqed.org/science/wp-content/uploads/sites/35/2015/09/Mighty2.jpg\">\u003cimg loading=\"lazy\" decoding=\"async\" class=\" wp-image-247869\" src=\"http://ww2.kqed.org/science/wp-content/uploads/sites/35/2015/09/Mighty2-800x844.jpg\" alt=\"Biologists are studying golden eagles in the Altamont Pass by placing radio transmitters on them.\" width=\"401\" height=\"423\" srcset=\"https://cdn.kqed.org/wp-content/uploads/sites/35/2015/09/Mighty2-800x844.jpg 800w, https://cdn.kqed.org/wp-content/uploads/sites/35/2015/09/Mighty2-400x422.jpg 400w, https://cdn.kqed.org/wp-content/uploads/sites/35/2015/09/Mighty2-1440x1518.jpg 1440w, https://cdn.kqed.org/wp-content/uploads/sites/35/2015/09/Mighty2-1180x1244.jpg 1180w, https://cdn.kqed.org/wp-content/uploads/sites/35/2015/09/Mighty2-960x1012.jpg 960w, https://cdn.kqed.org/wp-content/uploads/sites/35/2015/09/Mighty2.jpg 1600w\" sizes=\"(max-width: 401px) 100vw, 401px\">\u003c/a>\u003cfigcaption class=\"wp-caption-text\">Biologists are studying golden eagles in the Altamont Pass by placing radio transmitters on them. \u003ccite>(Joseph DiDonato/Wildlife Consulting and Photography)\u003c/cite>\u003c/figcaption>\u003c/figure>\n\u003cp>At the Altamont Pass Wind Farm, a process is underway right now called “repowering.” This means removing hundreds of older, less efficient turbines. A single massive, new turbine can take the place of 20 or 30 of the older models. This also affords an opportunity to get turbines out of particularly lethal spots altogether.\u003c/p>\n\u003cp>Even so, the tip of a huge blade can slice through the air at \u003ca href=\"http://gizmodo.com/5930272/the-worlds-biggest-wind-turbine-blades-are-so-long-their-tips-spin-at-180-mph\">speeds like a racecar\u003c/a>.\u003c/p>\n\u003cp>A few years ago, before the repowering process started, Smallwood estimates 60 golden eagles were killed each year at Altamont.\u003c/p>\n\u003cp>\u003cstrong>Permit to Kill\u003c/strong>\u003c/p>\n\u003cp>While not listed as endangered, golden eagles are protected under the federal Migratory Bird Treaty Act and the Bald and Golden Eagle Protection Act. Killing them is illegal. But, with the exception of a couple wind companies recently fined in Wyoming, the federal government \u003ca href=\"http://www.csmonitor.com/Environment/Latest-News-Wires/2013/0514/Why-wind-farms-kill-eagles-with-federal-impunity\">has rarely enforced such laws\u003c/a>.\u003c/p>\n\u003cp>Scott Flaherty, a spokesman for the U.S. Fish and Wildlife Service, says the agency wants to work alongside wind companies — not punish them.\u003c/p>\n\u003cp>“While prosecutions are great and make for great headlines, they don’t always do the best thing for eagles,” he says.\u003c/p>\n\u003cp>Since 2009, wind companies have been able to apply for a “take permit,” essentially, permission to kill a small number of golden eagles. Such applications are thick, highly technical and take a long time to write. Only one permit has been issued since the program was introduced — for a wind farm in Solano County. Seven other wind farms have applications in the pipeline.\u003c/p>\n\u003cfigure id=\"attachment_247865\" class=\"wp-caption alignright\" style=\"max-width: 800px\">\u003ca href=\"http://ww2.kqed.org/science/wp-content/uploads/sites/35/2015/09/Smallwood2.jpg\">\u003cimg loading=\"lazy\" decoding=\"async\" class=\"size-medium wp-image-247865\" src=\"http://ww2.kqed.org/science/wp-content/uploads/sites/35/2015/09/Smallwood2-800x600.jpg\" alt=\"Ecologist Shawn Smallwood holds a golden eagle found injured in the Altamont Pass.\" width=\"800\" height=\"600\" srcset=\"https://cdn.kqed.org/wp-content/uploads/sites/35/2015/09/Smallwood2-800x600.jpg 800w, https://cdn.kqed.org/wp-content/uploads/sites/35/2015/09/Smallwood2-400x300.jpg 400w, https://cdn.kqed.org/wp-content/uploads/sites/35/2015/09/Smallwood2-1440x1080.jpg 1440w, https://cdn.kqed.org/wp-content/uploads/sites/35/2015/09/Smallwood2-1180x885.jpg 1180w, https://cdn.kqed.org/wp-content/uploads/sites/35/2015/09/Smallwood2-960x720.jpg 960w, https://cdn.kqed.org/wp-content/uploads/sites/35/2015/09/Smallwood2.jpg 1600w\" sizes=\"(max-width: 800px) 100vw, 800px\">\u003c/a>\u003cfigcaption class=\"wp-caption-text\">Ecologist Shawn Smallwood holds a golden eagle found injured in the Altamont Pass. \u003ccite>(Joseph DiDonato/Wildlife Consulting and Photography)\u003c/cite>\u003c/figcaption>\u003c/figure>\n\u003cp>By getting wind companies in the door to discuss permits, Flaherty says the agency can also have a frank discussion about settling up over eagles killed in years past.\u003c/p>\n\u003cp>“One thing about eagle permits is that they don’t allow for past take,” he says. “They don’t really forgive past take.”\u003c/p>\n\u003cp>In an agreement with U.S. Fish and Wildlife, one company recently paid $10,000 and will spend hundreds of thousands more on research to help eagles.\u003c/p>\n\u003cp>The permits last five years. Last month, a federal judge kicked a new 30-year version \u003ca href=\"http://www.kcet.org/news/redefine/rewire/commentary/court-sends-30-year-eagle-kill-permits-back-to-drawing-board.html\">back to Fish and Wildlife officials\u003c/a> for more work.\u003c/p>\n\u003cp>\u003cstrong>Hardly a Free Pass\u003c/strong>\u003c/p>\n\u003cp>Governor Jerry Brown’s administration has set an ambitious goal: By 2030, Brown wants half of California’s power to come from renewable sources.\u003c/p>\n\u003cp>Nancy Rader, executive director for the California Wind Energy Association, says the industry is aiming to more than double wind energy capacity by 2030; hundreds of new turbines have to go \u003cem>somewhere.\u003c/em>\u003c/p>\n\u003cfigure id=\"attachment_248142\" class=\"wp-caption alignleft\" style=\"max-width: 355px\">\u003ca href=\"http://ww2.kqed.org/science/wp-content/uploads/sites/35/2015/09/wind3B.jpg\">\u003cimg loading=\"lazy\" decoding=\"async\" class=\" wp-image-248142\" src=\"http://ww2.kqed.org/science/wp-content/uploads/sites/35/2015/09/wind3B-800x1052.jpg\" alt=\"Only one wind farm, in Solano County, has received a federal permit for the killing of golden eagles. Several others have applications in the pipeline.\" width=\"355\" height=\"467\" srcset=\"https://cdn.kqed.org/wp-content/uploads/sites/35/2015/09/wind3B-800x1052.jpg 800w, https://cdn.kqed.org/wp-content/uploads/sites/35/2015/09/wind3B-400x526.jpg 400w, https://cdn.kqed.org/wp-content/uploads/sites/35/2015/09/wind3B-1180x1552.jpg 1180w, https://cdn.kqed.org/wp-content/uploads/sites/35/2015/09/wind3B-960x1262.jpg 960w, https://cdn.kqed.org/wp-content/uploads/sites/35/2015/09/wind3B.jpg 1219w\" sizes=\"(max-width: 355px) 100vw, 355px\">\u003c/a>\u003cfigcaption class=\"wp-caption-text\">Only one wind farm, located in Solano County, has received a federal permit for the killing of golden eagles. Several others have applications in the pipeline. \u003ccite>(Daniel Potter/KQED)\u003c/cite>\u003c/figcaption>\u003c/figure>\n\u003cp>Far from getting an easy pass from regulators, Rader points to proposed restrictions from the Bureau of Land Management, as well as local governments in places like Los Angeles County.\u003c/p>\n\u003cp>“We’re seeing land-use plans coming out from both the federal government and county governments that actually prohibit the development of wind energy across large areas of California,” Rader says.\u003c/p>\n\u003cp>Energy supply is about trade-offs, says Ryan Wiser, a senior scientist at Lawrence Berkeley National Laboratory.\u003c/p>\n\u003cp>“There’s really no free lunch here,” he says, and refers to \u003ca href=\"http://energy.gov/eere/wind/wind-vision\">a report out this year\u003c/a> from the federal Department of Energy.\u003c/p>\n\u003cp>The report examines a future in which wind energy scales up dramatically in coming decades. It concludes that replacing fossil fuels with wind will save hundreds of billions of dollars in “avoided global climate damages.”\u003c/p>\n\u003cp>However, Wiser points out, the report didn’t attempt to pin down the economic value of the loss of wildlife – such as eagles.\u003c/p>\n\u003cp>\u003c/p>\n\u003cp>\u003cem>KQED Science coordinating television producer Gabriela Quiros contributed to this story.\u003c/em>\u003c/p>\n\n",
"stats": {
"hasVideo": false,
"hasChartOrMap": false,
"hasAudio": true,
"hasPolis": false,
"wordCount": 993,
"hasGoogleForm": false,
"hasGallery": false,
"hasHearkenModule": false,
"iframeSrcs": [],
"paragraphCount": 31
},
"modified": 1704931320,
"excerpt": "So far, only one wind farm has gotten a permit allowing its turbines to kill the federally protected eagles.\r\n",
"headData": {
"twImgId": "",
"twTitle": "",
"ogTitle": "",
"ogImgId": "",
"twDescription": "",
"description": "So far, only one wind farm has gotten a permit allowing its turbines to kill the federally protected eagles.\r\n",
"title": "Big Challenge as California Ramps Up Wind Power: Golden Eagles | KQED",
"ogDescription": "",
"schema": {
"@context": "https://schema.org",
"@type": "Article",
"headline": "Big Challenge as California Ramps Up Wind Power: Golden Eagles",
"datePublished": "2015-09-14T06:00:49-07:00",
"dateModified": "2024-01-10T16:02:00-08:00",
"image": "https://cdn.kqed.org/wp-content/uploads/2020/02/KQED-OG-Image@1x.png"
}
},
"guestAuthors": [],
"slug": "big-challenge-as-california-ramps-up-wind-power-golden-eagles",
"status": "publish",
"sticky": false,
"path": "/science/247785/big-challenge-as-california-ramps-up-wind-power-golden-eagles",
"audioUrl": "http://www.kqed.org/.stream/anon/radio//2015/09/WindFarmsEagles.mp3",
"audioDuration": null,
"audioTrackLength": null,
"parsedContent": [
{
"type": "contentString",
"content": "\u003cdiv class=\"post-body\">\u003cp>\u003cp>\u003cstrong>Listen to the story:\u003c/strong>\u003cbr>\u003c/p>\u003c/div>",
"attributes": {
"named": {},
"numeric": []
}
},
{
"type": "component",
"content": "",
"name": "audioLink",
"attributes": {
"named": {
"src": "http://www.kqed.org/.stream/anon/radio//2015/09/WindFarmsEagles.mp3"
},
"numeric": []
}
},
{
"type": "contentString",
"content": "\u003cdiv class=\"post-body\">\u003cp>\u003cp>California’s history with wind power goes back decades — as do its troubles with turbines killing birds, including federally protected golden eagles.\u003c/p>\n\u003cp>With state officials now planning to ramp up renewable energy, an uneasy tension exists between protecting wildlife, and fighting climate change.\u003c/p>\n\u003caside class=\"pullquote alignright\">“At nighttime, as soon as it gets dark, striped skunks run to the wind turbines. Literally run.”\u003ccite>Shawn Smallwood, Ecologist\u003c/cite>\u003c/aside>\n\u003cp>Ecologist Shawn Smallwood has found mangled eagles several times in wind farms like those at Altamont Pass, near Livermore. The place has a reputation for turbines killing birds. Alameda County estimates 35 golden eagles were killed there in 2013.\u003c/p>\n\u003cp>Researching this problem is complicated partly by scavengers, such as ravens, snatching up carcasses before Smallwood can tally them. Coyotes, foxes and badgers converge on the wind farm and search the grounds in a pattern, he says, just like a scientist would.\u003c/p>\n\u003cp>\u003c/p>\u003c/div>",
"attributes": {
"named": {},
"numeric": []
}
},
{
"type": "component",
"content": "",
"name": "ad",
"attributes": {
"named": {
"label": "fullwidth"
},
"numeric": [
"fullwidth"
]
}
},
{
"type": "contentString",
"content": "\u003cdiv class=\"post-body\">\u003cp>\u003c/p>\n\u003cp>“At nighttime, as soon as it gets dark, striped skunks run to the wind turbines. Literally run,” says Smallwood. “They also go to the turbines that kill the most animals, so they’re familiar with where they can find food. They usually go to the downwind side of the turbines, again where the bats and birds are most likely to fall after they get hit by a wind turbine.”\u003c/p>\n\u003cp>The history of wind power is littered with attempts to make turbines safer for birds and bats. \u003ca href=\"https://www.youtube.com/watch?v=RtgBWNKwBkE\">It’s not easy\u003c/a>. Golden eagles fix their eyesight on prey on the ground and don’t necessarily see what they’re flying into. Smallwood once advocated shutting turbines off over winter, but says on an overcast day, birds can still fly right into blades that aren’t even turning.\u003c/p>\n\u003cfigure id=\"attachment_247869\" class=\"wp-caption alignleft\" style=\"max-width: 401px\">\u003ca href=\"http://ww2.kqed.org/science/wp-content/uploads/sites/35/2015/09/Mighty2.jpg\">\u003cimg loading=\"lazy\" decoding=\"async\" class=\" wp-image-247869\" src=\"http://ww2.kqed.org/science/wp-content/uploads/sites/35/2015/09/Mighty2-800x844.jpg\" alt=\"Biologists are studying golden eagles in the Altamont Pass by placing radio transmitters on them.\" width=\"401\" height=\"423\" srcset=\"https://cdn.kqed.org/wp-content/uploads/sites/35/2015/09/Mighty2-800x844.jpg 800w, https://cdn.kqed.org/wp-content/uploads/sites/35/2015/09/Mighty2-400x422.jpg 400w, https://cdn.kqed.org/wp-content/uploads/sites/35/2015/09/Mighty2-1440x1518.jpg 1440w, https://cdn.kqed.org/wp-content/uploads/sites/35/2015/09/Mighty2-1180x1244.jpg 1180w, https://cdn.kqed.org/wp-content/uploads/sites/35/2015/09/Mighty2-960x1012.jpg 960w, https://cdn.kqed.org/wp-content/uploads/sites/35/2015/09/Mighty2.jpg 1600w\" sizes=\"(max-width: 401px) 100vw, 401px\">\u003c/a>\u003cfigcaption class=\"wp-caption-text\">Biologists are studying golden eagles in the Altamont Pass by placing radio transmitters on them. \u003ccite>(Joseph DiDonato/Wildlife Consulting and Photography)\u003c/cite>\u003c/figcaption>\u003c/figure>\n\u003cp>At the Altamont Pass Wind Farm, a process is underway right now called “repowering.” This means removing hundreds of older, less efficient turbines. A single massive, new turbine can take the place of 20 or 30 of the older models. This also affords an opportunity to get turbines out of particularly lethal spots altogether.\u003c/p>\n\u003cp>Even so, the tip of a huge blade can slice through the air at \u003ca href=\"http://gizmodo.com/5930272/the-worlds-biggest-wind-turbine-blades-are-so-long-their-tips-spin-at-180-mph\">speeds like a racecar\u003c/a>.\u003c/p>\n\u003cp>A few years ago, before the repowering process started, Smallwood estimates 60 golden eagles were killed each year at Altamont.\u003c/p>\n\u003cp>\u003cstrong>Permit to Kill\u003c/strong>\u003c/p>\n\u003cp>While not listed as endangered, golden eagles are protected under the federal Migratory Bird Treaty Act and the Bald and Golden Eagle Protection Act. Killing them is illegal. But, with the exception of a couple wind companies recently fined in Wyoming, the federal government \u003ca href=\"http://www.csmonitor.com/Environment/Latest-News-Wires/2013/0514/Why-wind-farms-kill-eagles-with-federal-impunity\">has rarely enforced such laws\u003c/a>.\u003c/p>\n\u003cp>Scott Flaherty, a spokesman for the U.S. Fish and Wildlife Service, says the agency wants to work alongside wind companies — not punish them.\u003c/p>\n\u003cp>“While prosecutions are great and make for great headlines, they don’t always do the best thing for eagles,” he says.\u003c/p>\n\u003cp>Since 2009, wind companies have been able to apply for a “take permit,” essentially, permission to kill a small number of golden eagles. Such applications are thick, highly technical and take a long time to write. Only one permit has been issued since the program was introduced — for a wind farm in Solano County. Seven other wind farms have applications in the pipeline.\u003c/p>\n\u003cfigure id=\"attachment_247865\" class=\"wp-caption alignright\" style=\"max-width: 800px\">\u003ca href=\"http://ww2.kqed.org/science/wp-content/uploads/sites/35/2015/09/Smallwood2.jpg\">\u003cimg loading=\"lazy\" decoding=\"async\" class=\"size-medium wp-image-247865\" src=\"http://ww2.kqed.org/science/wp-content/uploads/sites/35/2015/09/Smallwood2-800x600.jpg\" alt=\"Ecologist Shawn Smallwood holds a golden eagle found injured in the Altamont Pass.\" width=\"800\" height=\"600\" srcset=\"https://cdn.kqed.org/wp-content/uploads/sites/35/2015/09/Smallwood2-800x600.jpg 800w, https://cdn.kqed.org/wp-content/uploads/sites/35/2015/09/Smallwood2-400x300.jpg 400w, https://cdn.kqed.org/wp-content/uploads/sites/35/2015/09/Smallwood2-1440x1080.jpg 1440w, https://cdn.kqed.org/wp-content/uploads/sites/35/2015/09/Smallwood2-1180x885.jpg 1180w, https://cdn.kqed.org/wp-content/uploads/sites/35/2015/09/Smallwood2-960x720.jpg 960w, https://cdn.kqed.org/wp-content/uploads/sites/35/2015/09/Smallwood2.jpg 1600w\" sizes=\"(max-width: 800px) 100vw, 800px\">\u003c/a>\u003cfigcaption class=\"wp-caption-text\">Ecologist Shawn Smallwood holds a golden eagle found injured in the Altamont Pass. \u003ccite>(Joseph DiDonato/Wildlife Consulting and Photography)\u003c/cite>\u003c/figcaption>\u003c/figure>\n\u003cp>By getting wind companies in the door to discuss permits, Flaherty says the agency can also have a frank discussion about settling up over eagles killed in years past.\u003c/p>\n\u003cp>“One thing about eagle permits is that they don’t allow for past take,” he says. “They don’t really forgive past take.”\u003c/p>\n\u003cp>In an agreement with U.S. Fish and Wildlife, one company recently paid $10,000 and will spend hundreds of thousands more on research to help eagles.\u003c/p>\n\u003cp>The permits last five years. Last month, a federal judge kicked a new 30-year version \u003ca href=\"http://www.kcet.org/news/redefine/rewire/commentary/court-sends-30-year-eagle-kill-permits-back-to-drawing-board.html\">back to Fish and Wildlife officials\u003c/a> for more work.\u003c/p>\n\u003cp>\u003cstrong>Hardly a Free Pass\u003c/strong>\u003c/p>\n\u003cp>Governor Jerry Brown’s administration has set an ambitious goal: By 2030, Brown wants half of California’s power to come from renewable sources.\u003c/p>\n\u003cp>Nancy Rader, executive director for the California Wind Energy Association, says the industry is aiming to more than double wind energy capacity by 2030; hundreds of new turbines have to go \u003cem>somewhere.\u003c/em>\u003c/p>\n\u003cfigure id=\"attachment_248142\" class=\"wp-caption alignleft\" style=\"max-width: 355px\">\u003ca href=\"http://ww2.kqed.org/science/wp-content/uploads/sites/35/2015/09/wind3B.jpg\">\u003cimg loading=\"lazy\" decoding=\"async\" class=\" wp-image-248142\" src=\"http://ww2.kqed.org/science/wp-content/uploads/sites/35/2015/09/wind3B-800x1052.jpg\" alt=\"Only one wind farm, in Solano County, has received a federal permit for the killing of golden eagles. Several others have applications in the pipeline.\" width=\"355\" height=\"467\" srcset=\"https://cdn.kqed.org/wp-content/uploads/sites/35/2015/09/wind3B-800x1052.jpg 800w, https://cdn.kqed.org/wp-content/uploads/sites/35/2015/09/wind3B-400x526.jpg 400w, https://cdn.kqed.org/wp-content/uploads/sites/35/2015/09/wind3B-1180x1552.jpg 1180w, https://cdn.kqed.org/wp-content/uploads/sites/35/2015/09/wind3B-960x1262.jpg 960w, https://cdn.kqed.org/wp-content/uploads/sites/35/2015/09/wind3B.jpg 1219w\" sizes=\"(max-width: 355px) 100vw, 355px\">\u003c/a>\u003cfigcaption class=\"wp-caption-text\">Only one wind farm, located in Solano County, has received a federal permit for the killing of golden eagles. Several others have applications in the pipeline. \u003ccite>(Daniel Potter/KQED)\u003c/cite>\u003c/figcaption>\u003c/figure>\n\u003cp>Far from getting an easy pass from regulators, Rader points to proposed restrictions from the Bureau of Land Management, as well as local governments in places like Los Angeles County.\u003c/p>\n\u003cp>“We’re seeing land-use plans coming out from both the federal government and county governments that actually prohibit the development of wind energy across large areas of California,” Rader says.\u003c/p>\n\u003cp>Energy supply is about trade-offs, says Ryan Wiser, a senior scientist at Lawrence Berkeley National Laboratory.\u003c/p>\n\u003cp>“There’s really no free lunch here,” he says, and refers to \u003ca href=\"http://energy.gov/eere/wind/wind-vision\">a report out this year\u003c/a> from the federal Department of Energy.\u003c/p>\n\u003cp>The report examines a future in which wind energy scales up dramatically in coming decades. It concludes that replacing fossil fuels with wind will save hundreds of billions of dollars in “avoided global climate damages.”\u003c/p>\n\u003cp>However, Wiser points out, the report didn’t attempt to pin down the economic value of the loss of wildlife – such as eagles.\u003c/p>\n\u003cp>\u003c/p>\n\u003cp>\u003cem>KQED Science coordinating television producer Gabriela Quiros contributed to this story.\u003c/em>\u003c/p>\n\n\u003c/div>\u003c/p>",
"attributes": {
"named": {},
"numeric": []
}
}
],
"link": "/science/247785/big-challenge-as-california-ramps-up-wind-power-golden-eagles",
"authors": [
"6609"
],
"categories": [
"science_30",
"science_31",
"science_33",
"science_35",
"science_40",
"science_43"
],
"featImg": "science_247872",
"label": "science"
},
"science_235245": {
"type": "posts",
"id": "science_235245",
"meta": {
"index": "posts_1716263798",
"site": "science",
"id": "235245",
"score": null,
"sort": [
1441461619000
]
},
"parent": 0,
"labelTerm": {
"site": "science"
},
"blocks": [],
"publishDate": 1441461619,
"format": "standard",
"title": "Watch Abalone Reproduce in Gorgeous Bursts of Eggs and Sperm",
"headTitle": "Watch Abalone Reproduce in Gorgeous Bursts of Eggs and Sperm | KQED",
"content": "\u003cp>When the female abalone is ready to reproduce, she shoots long bursts of eggs from her respiratory hole. The male releases curlicues of sperm, which then swim around to find the eggs.\u003c/p>\n\u003cp>Problem is, the increasing acidity in the ocean may be slowing the sperm down, say researchers at the \u003ca href=\"http://www.mbari.org/\">Monterey Bay Aquarium Research Institute\u003c/a>.\u003c/p>\n\u003cp>“The ocean critters out here,” says Jim Barry, a Senior Scientist at the Institute, “are faced with a faster and larger change in ocean chemistry than they’ve seen for 30 to maybe 300 million years, through much of their evolutionary history.”\u003c/p>\n\u003cdiv style=\"text-align: left\">\n\u003c!-- iframe plugin v.4.3 wordpress.org/plugins/iframe/ -->\u003cbr>\n\u003ciframe loading=\"lazy\" src=\"http://gifs.com/embed/y4ALew\" frameborder=\"0\" scrolling=\"no\" width=\"800\" height=\"450\" style=\"-webkit-backface-visibility: hidden;-webkit-transform: scale(1);\" class=\"iframe-class\">\u003c/iframe>\n\u003c/div>\n\u003cp> \u003cbr>\nBarry and researcher Charles Boch are looking at whether \u003ca href=\"http://www.mbari.org/highCO2/\">ocean acidification\u003c/a> interferes with ability of abalone to reproduce. And they’re finding that acidic waters significantly reduce the rate of abalone fertilization.\u003c/p>\n\u003cp>Abalone are an important source of food for sea otters, who in turn help keep kelp forests in balance.\u003c/p>\n\u003cp>[ad fullwidth]\u003c/p>\n\u003cp>“We know that ocean acidification is huge,” Barry says. “This is one of the biggest things that happened to this Earth in the last many tens of millions of years. It’s a huge environmental change that’s happening right in front of us.”\u003c/p>\n\u003cdiv>\n\u003c!-- iframe plugin v.4.3 wordpress.org/plugins/iframe/ -->\u003cbr>\n\u003ciframe loading=\"lazy\" src=\"http://gifs.com/embed/m2kNPq\" frameborder=\"0\" scrolling=\"no\" width=\"800\" height=\"450\" style=\"-webkit-backface-visibility: hidden;-webkit-transform: scale(1);\" class=\"iframe-class\">\u003c/iframe>\n\u003c/div>\n\u003cp>\u003c/p>\n\u003cp> \u003cbr>\nLearn more about ocean acidification \u003ca href=\"http://ww2.kqed.org/news/2015/08/31/ocean-acidification-threatening-many-species\">in this report\u003c/a> from \u003ca href=\"http://www.kqed.org/tv/programs/newsroom/\">KQED Newsroom\u003c/a>.\u003c/p>\n\n",
"stats": {
"hasVideo": false,
"hasChartOrMap": true,
"hasAudio": false,
"hasPolis": false,
"wordCount": 219,
"hasGoogleForm": false,
"hasGallery": false,
"hasHearkenModule": false,
"iframeSrcs": [
"http://gifs.com/embed/y4ALew",
"http://gifs.com/embed/m2kNPq"
],
"paragraphCount": 7
},
"modified": 1704931337,
"excerpt": "Researchers at the Monterey Bay Aquarium Research Institute find ocean acidification slows abalone fertilization.\r\n",
"headData": {
"twImgId": "",
"twTitle": "",
"ogTitle": "",
"ogImgId": "",
"twDescription": "",
"description": "Researchers at the Monterey Bay Aquarium Research Institute find ocean acidification slows abalone fertilization.\r\n",
"title": "Watch Abalone Reproduce in Gorgeous Bursts of Eggs and Sperm | KQED",
"ogDescription": "",
"schema": {
"@context": "https://schema.org",
"@type": "Article",
"headline": "Watch Abalone Reproduce in Gorgeous Bursts of Eggs and Sperm",
"datePublished": "2015-09-05T07:00:19-07:00",
"dateModified": "2024-01-10T16:02:17-08:00",
"image": "https://cdn.kqed.org/wp-content/uploads/2020/02/KQED-OG-Image@1x.png"
}
},
"guestAuthors": [],
"slug": "watch-abalone-reproduce-in-gorgeous-bursts-of-eggs-and-sperm",
"status": "publish",
"sticky": false,
"path": "/science/235245/watch-abalone-reproduce-in-gorgeous-bursts-of-eggs-and-sperm",
"audioTrackLength": null,
"parsedContent": [
{
"type": "contentString",
"content": "\u003cdiv class=\"post-body\">\u003cp>\u003cp>When the female abalone is ready to reproduce, she shoots long bursts of eggs from her respiratory hole. The male releases curlicues of sperm, which then swim around to find the eggs.\u003c/p>\n\u003cp>Problem is, the increasing acidity in the ocean may be slowing the sperm down, say researchers at the \u003ca href=\"http://www.mbari.org/\">Monterey Bay Aquarium Research Institute\u003c/a>.\u003c/p>\n\u003cp>“The ocean critters out here,” says Jim Barry, a Senior Scientist at the Institute, “are faced with a faster and larger change in ocean chemistry than they’ve seen for 30 to maybe 300 million years, through much of their evolutionary history.”\u003c/p>\n\u003cdiv style=\"text-align: left\">\n\u003c!-- iframe plugin v.4.3 wordpress.org/plugins/iframe/ -->\u003cbr>\n\u003ciframe loading=\"lazy\" src=\"http://gifs.com/embed/y4ALew\" frameborder=\"0\" scrolling=\"no\" width=\"800\" height=\"450\" style=\"-webkit-backface-visibility: hidden;-webkit-transform: scale(1);\" class=\"iframe-class\">\u003c/iframe>\n\u003c/div>\n\u003cp> \u003cbr>\nBarry and researcher Charles Boch are looking at whether \u003ca href=\"http://www.mbari.org/highCO2/\">ocean acidification\u003c/a> interferes with ability of abalone to reproduce. And they’re finding that acidic waters significantly reduce the rate of abalone fertilization.\u003c/p>\n\u003cp>Abalone are an important source of food for sea otters, who in turn help keep kelp forests in balance.\u003c/p>\n\u003cp>\u003c/p>\u003c/div>",
"attributes": {
"named": {},
"numeric": []
}
},
{
"type": "component",
"content": "",
"name": "ad",
"attributes": {
"named": {
"label": "fullwidth"
},
"numeric": [
"fullwidth"
]
}
},
{
"type": "contentString",
"content": "\u003cdiv class=\"post-body\">\u003cp>\u003c/p>\n\u003cp>“We know that ocean acidification is huge,” Barry says. “This is one of the biggest things that happened to this Earth in the last many tens of millions of years. It’s a huge environmental change that’s happening right in front of us.”\u003c/p>\n\u003cdiv>\n\u003c!-- iframe plugin v.4.3 wordpress.org/plugins/iframe/ -->\u003cbr>\n\u003ciframe loading=\"lazy\" src=\"http://gifs.com/embed/m2kNPq\" frameborder=\"0\" scrolling=\"no\" width=\"800\" height=\"450\" style=\"-webkit-backface-visibility: hidden;-webkit-transform: scale(1);\" class=\"iframe-class\">\u003c/iframe>\n\u003c/div>\n\u003cp>\u003c/p>\n\u003cp> \u003cbr>\nLearn more about ocean acidification \u003ca href=\"http://ww2.kqed.org/news/2015/08/31/ocean-acidification-threatening-many-species\">in this report\u003c/a> from \u003ca href=\"http://www.kqed.org/tv/programs/newsroom/\">KQED Newsroom\u003c/a>.\u003c/p>\n\n\u003c/div>\u003c/p>",
"attributes": {
"named": {},
"numeric": []
}
}
],
"link": "/science/235245/watch-abalone-reproduce-in-gorgeous-bursts-of-eggs-and-sperm",
"authors": [
"6387"
],
"categories": [
"science_2631",
"science_30",
"science_31"
],
"tags": [
"science_2698",
"science_1321"
],
"featImg": "science_235481",
"label": "science"
},
"science_229506": {
"type": "posts",
"id": "science_229506",
"meta": {
"index": "posts_1716263798",
"site": "science",
"id": "229506",
"score": null,
"sort": [
1441135856000
]
},
"parent": 0,
"labelTerm": {
"site": "science",
"term": 1151
},
"blocks": [],
"publishDate": 1441135856,
"format": "standard",
"title": "Trend: Large Wildfires More Common and Destructive in the West",
"headTitle": "Trend: Large Wildfires More Common and Destructive in the West | KQED",
"content": "\u003cp>The West continues to be an inferno at the start of September. Wildfires have exploded across the region in recent weeks.\u003c/p>\n\u003cp>There have been at least 117 large wildfires to date including 70 that are still burning. Those fires along with thousands of smaller blazes have contributed to 7.8 million acres burned in the U.S., a record for this time of year.\u003c/p>\n\u003cp>Washington has officially had its most destructive \u003ca href=\"http://www.columbian.com/news/2015/aug/26/washington-worst-wildfire-season/\">wildfire season on record\u003c/a>, including its \u003ca href=\"http://www.nbcnews.com/storyline/western-wildfires/okanogan-complex-washington-wildfire-now-largest-state-history-n414916\">largest wildfire\u003c/a> in state history. \u003ca href=\"http://www.climatecentral.org/news/alaska-entering-new-era-for-wildfires-19146\">In Alaska\u003c/a>, 5.1 million acres have burned. Even if all the fires went out across the West tomorrow, this year would still rank as the seventh-most destructive wildfire season in terms of acres burned. But with the season set to continue for at least another month, 2015 will continue to climb the charts, though whether it displaces 2006 for the record remains to be seen.\u003c/p>\n\u003cp>\u003ca href=\"http://ww2.kqed.org/science/wp-content/uploads/sites/35/2015/09/2015WildfiresWeb_Acres_West.jpg\">\u003cimg loading=\"lazy\" decoding=\"async\" class=\"alignnone size-medium wp-image-229508\" src=\"http://ww2.kqed.org/science/wp-content/uploads/sites/35/2015/09/2015WildfiresWeb_Acres_West-800x450.jpg\" alt=\"2015WildfiresWeb_Acres_West\" width=\"800\" height=\"450\" srcset=\"https://cdn.kqed.org/wp-content/uploads/sites/35/2015/09/2015WildfiresWeb_Acres_West-800x450.jpg 800w, https://cdn.kqed.org/wp-content/uploads/sites/35/2015/09/2015WildfiresWeb_Acres_West-400x225.jpg 400w, https://cdn.kqed.org/wp-content/uploads/sites/35/2015/09/2015WildfiresWeb_Acres_West-1440x810.jpg 1440w, https://cdn.kqed.org/wp-content/uploads/sites/35/2015/09/2015WildfiresWeb_Acres_West.jpg 1920w, https://cdn.kqed.org/wp-content/uploads/sites/35/2015/09/2015WildfiresWeb_Acres_West-1180x664.jpg 1180w, https://cdn.kqed.org/wp-content/uploads/sites/35/2015/09/2015WildfiresWeb_Acres_West-960x540.jpg 960w\" sizes=\"(max-width: 800px) 100vw, 800px\">\u003c/a>\u003c/p>\n\u003cp>That puts it right in line with trends since the 1970s of more large fires and more acres burned by these large wildfires as the West dries out and heats up according to an \u003ca href=\"http://www.climatecentral.org/western-wildfire-trends\">updated Climate Central analysis\u003c/a>. Climate change is one of the key drivers helping set up these \u003ca href=\"http://www.climatecentral.org/news/climate-change-bully-california-drought-19354\">dry and hot conditions\u003c/a> favorable for wildfires.\u003c/p>\n\u003cp>[ad fullwidth]\u003c/p>\n\u003cp>Spring and summer — two key seasons for wildfires — have warmed 2.1°F across the West, on average. Some states, particularly those in the Southwest, have warmed even faster. Add in \u003ca href=\"http://www.climatecentral.org/news/rising-temperatures-expected-to-accelerate-western-snowpack-decline\">shrinking snowpack\u003c/a> that’s disappearing earlier, and you have a recipe for a wildfire season that’s now 75 days longer and more devastating than it was in the 1970s.\u003c/p>\n\u003cp>There’s been a notable increase in the large wildfires — defined as those 1,000 acres or bigger. A Climate Central analysis of U.S. Forest Service data through 2014 shows that large fires are three-and-a-half times more common now than they were in the ‘70s. They also burn seven times more acreage in an average year.\u003c/p>\n\u003cp>The biggest changes are in the Northern Rockies. Large wildfires are now 10 times more common than they used to be and the area burned is up to 45 times greater in Idaho, Montana and Wyoming.\u003c/p>\n\u003cp>\u003ca href=\"http://ww2.kqed.org/science/wp-content/uploads/sites/35/2015/09/2015WildfiresWeb_NumberOfFires_TempTrend_West.jpg\">\u003cimg loading=\"lazy\" decoding=\"async\" class=\"alignnone size-medium wp-image-229507\" src=\"http://ww2.kqed.org/science/wp-content/uploads/sites/35/2015/09/2015WildfiresWeb_NumberOfFires_TempTrend_West-800x450.jpg\" alt=\"2015WildfiresWeb_NumberOfFires_TempTrend_West\" width=\"800\" height=\"450\" srcset=\"https://cdn.kqed.org/wp-content/uploads/sites/35/2015/09/2015WildfiresWeb_NumberOfFires_TempTrend_West-800x450.jpg 800w, https://cdn.kqed.org/wp-content/uploads/sites/35/2015/09/2015WildfiresWeb_NumberOfFires_TempTrend_West-400x225.jpg 400w, https://cdn.kqed.org/wp-content/uploads/sites/35/2015/09/2015WildfiresWeb_NumberOfFires_TempTrend_West-1440x810.jpg 1440w, https://cdn.kqed.org/wp-content/uploads/sites/35/2015/09/2015WildfiresWeb_NumberOfFires_TempTrend_West.jpg 1920w, https://cdn.kqed.org/wp-content/uploads/sites/35/2015/09/2015WildfiresWeb_NumberOfFires_TempTrend_West-1180x664.jpg 1180w, https://cdn.kqed.org/wp-content/uploads/sites/35/2015/09/2015WildfiresWeb_NumberOfFires_TempTrend_West-960x540.jpg 960w\" sizes=\"(max-width: 800px) 100vw, 800px\">\u003c/a>\u003c/p>\n\u003cp>Fire is a natural part of most ecosystems but a century of fire suppression, the expansion of homes, roads and infrastructure, and climate change have altered the order of things. Now there’s more fuel in the woods and hotter and drier conditions that can help fires explode with dire consequences.\u003c/p>\n\u003cp>Air quality in downwind communities (some a thousand miles away) also \u003ca href=\"http://www.climatecentral.org/news/report-wildfires-and-air-pollution-a-hidden-hazard-16651\">suffer from the smoke\u003c/a>. At least twice in the past 12 years, cities like Los Angeles and San Diego were forced to deal with Beijing-level air pollution caused by southern California wildfires.\u003c/p>\n\u003cp>Intense burns can leave soil barren and inhibit the regrowth of forest. They can also erode forests’ ability to store carbon and actually turn them into a source of carbon emissions. That’s \u003ca href=\"http://www.climatecentral.org/news/california-forests-climate-polluters-18941\">already occurring in California\u003c/a>, there are concerns that could \u003ca href=\"http://www.climatecentral.org/news/climate-change-alaska-wildfires-19181\">happen in Alaska\u003c/a> this year and it could be coming soon to a forest near you.\u003c/p>\n\u003cp>\u003c/p>\n\u003cp>\u003ci>This story first appeared at \u003ca href=\"http://www.climatecentral.org/\">Climate Central\u003c/a>, a content partner of KQED. Todd Sanford provided data analysis for this story.\u003c/i>\u003c/p>\n\n",
"stats": {
"hasVideo": false,
"hasChartOrMap": false,
"hasAudio": false,
"hasPolis": false,
"wordCount": 551,
"hasGoogleForm": false,
"hasGallery": false,
"hasHearkenModule": false,
"iframeSrcs": [],
"paragraphCount": 15
},
"modified": 1704931353,
"excerpt": "There’s been a notable increase in the large wildfires — defined as those 1,000 acres or bigger. That puts it right in line with trends since the 1970s of more large fires and more acres burned by these large wildfires as the West dries out and heats up.",
"headData": {
"twImgId": "",
"twTitle": "",
"ogTitle": "",
"ogImgId": "",
"twDescription": "",
"description": "There’s been a notable increase in the large wildfires — defined as those 1,000 acres or bigger. That puts it right in line with trends since the 1970s of more large fires and more acres burned by these large wildfires as the West dries out and heats up.",
"title": "Trend: Large Wildfires More Common and Destructive in the West | KQED",
"ogDescription": "",
"schema": {
"@context": "https://schema.org",
"@type": "Article",
"headline": "Trend: Large Wildfires More Common and Destructive in the West",
"datePublished": "2015-09-01T12:30:56-07:00",
"dateModified": "2024-01-10T16:02:33-08:00",
"image": "https://cdn.kqed.org/wp-content/uploads/2020/02/KQED-OG-Image@1x.png"
}
},
"guestAuthors": [],
"slug": "trend-large-wildfires-more-common-and-destructive-in-the-west",
"status": "publish",
"nprByline": "\u003cstrong>\u003ca href=\"http://www.climatecentral.org/what-we-do/people/brian-kahn\">Brian Kahn\u003c/a>, Climate Central\u003c/strong>",
"sticky": false,
"path": "/science/229506/trend-large-wildfires-more-common-and-destructive-in-the-west",
"audioTrackLength": null,
"parsedContent": [
{
"type": "contentString",
"content": "\u003cdiv class=\"post-body\">\u003cp>\u003cp>The West continues to be an inferno at the start of September. Wildfires have exploded across the region in recent weeks.\u003c/p>\n\u003cp>There have been at least 117 large wildfires to date including 70 that are still burning. Those fires along with thousands of smaller blazes have contributed to 7.8 million acres burned in the U.S., a record for this time of year.\u003c/p>\n\u003cp>Washington has officially had its most destructive \u003ca href=\"http://www.columbian.com/news/2015/aug/26/washington-worst-wildfire-season/\">wildfire season on record\u003c/a>, including its \u003ca href=\"http://www.nbcnews.com/storyline/western-wildfires/okanogan-complex-washington-wildfire-now-largest-state-history-n414916\">largest wildfire\u003c/a> in state history. \u003ca href=\"http://www.climatecentral.org/news/alaska-entering-new-era-for-wildfires-19146\">In Alaska\u003c/a>, 5.1 million acres have burned. Even if all the fires went out across the West tomorrow, this year would still rank as the seventh-most destructive wildfire season in terms of acres burned. But with the season set to continue for at least another month, 2015 will continue to climb the charts, though whether it displaces 2006 for the record remains to be seen.\u003c/p>\n\u003cp>\u003ca href=\"http://ww2.kqed.org/science/wp-content/uploads/sites/35/2015/09/2015WildfiresWeb_Acres_West.jpg\">\u003cimg loading=\"lazy\" decoding=\"async\" class=\"alignnone size-medium wp-image-229508\" src=\"http://ww2.kqed.org/science/wp-content/uploads/sites/35/2015/09/2015WildfiresWeb_Acres_West-800x450.jpg\" alt=\"2015WildfiresWeb_Acres_West\" width=\"800\" height=\"450\" srcset=\"https://cdn.kqed.org/wp-content/uploads/sites/35/2015/09/2015WildfiresWeb_Acres_West-800x450.jpg 800w, https://cdn.kqed.org/wp-content/uploads/sites/35/2015/09/2015WildfiresWeb_Acres_West-400x225.jpg 400w, https://cdn.kqed.org/wp-content/uploads/sites/35/2015/09/2015WildfiresWeb_Acres_West-1440x810.jpg 1440w, https://cdn.kqed.org/wp-content/uploads/sites/35/2015/09/2015WildfiresWeb_Acres_West.jpg 1920w, https://cdn.kqed.org/wp-content/uploads/sites/35/2015/09/2015WildfiresWeb_Acres_West-1180x664.jpg 1180w, https://cdn.kqed.org/wp-content/uploads/sites/35/2015/09/2015WildfiresWeb_Acres_West-960x540.jpg 960w\" sizes=\"(max-width: 800px) 100vw, 800px\">\u003c/a>\u003c/p>\n\u003cp>That puts it right in line with trends since the 1970s of more large fires and more acres burned by these large wildfires as the West dries out and heats up according to an \u003ca href=\"http://www.climatecentral.org/western-wildfire-trends\">updated Climate Central analysis\u003c/a>. Climate change is one of the key drivers helping set up these \u003ca href=\"http://www.climatecentral.org/news/climate-change-bully-california-drought-19354\">dry and hot conditions\u003c/a> favorable for wildfires.\u003c/p>\n\u003cp>\u003c/p>\u003c/div>",
"attributes": {
"named": {},
"numeric": []
}
},
{
"type": "component",
"content": "",
"name": "ad",
"attributes": {
"named": {
"label": "fullwidth"
},
"numeric": [
"fullwidth"
]
}
},
{
"type": "contentString",
"content": "\u003cdiv class=\"post-body\">\u003cp>\u003c/p>\n\u003cp>Spring and summer — two key seasons for wildfires — have warmed 2.1°F across the West, on average. Some states, particularly those in the Southwest, have warmed even faster. Add in \u003ca href=\"http://www.climatecentral.org/news/rising-temperatures-expected-to-accelerate-western-snowpack-decline\">shrinking snowpack\u003c/a> that’s disappearing earlier, and you have a recipe for a wildfire season that’s now 75 days longer and more devastating than it was in the 1970s.\u003c/p>\n\u003cp>There’s been a notable increase in the large wildfires — defined as those 1,000 acres or bigger. A Climate Central analysis of U.S. Forest Service data through 2014 shows that large fires are three-and-a-half times more common now than they were in the ‘70s. They also burn seven times more acreage in an average year.\u003c/p>\n\u003cp>The biggest changes are in the Northern Rockies. Large wildfires are now 10 times more common than they used to be and the area burned is up to 45 times greater in Idaho, Montana and Wyoming.\u003c/p>\n\u003cp>\u003ca href=\"http://ww2.kqed.org/science/wp-content/uploads/sites/35/2015/09/2015WildfiresWeb_NumberOfFires_TempTrend_West.jpg\">\u003cimg loading=\"lazy\" decoding=\"async\" class=\"alignnone size-medium wp-image-229507\" src=\"http://ww2.kqed.org/science/wp-content/uploads/sites/35/2015/09/2015WildfiresWeb_NumberOfFires_TempTrend_West-800x450.jpg\" alt=\"2015WildfiresWeb_NumberOfFires_TempTrend_West\" width=\"800\" height=\"450\" srcset=\"https://cdn.kqed.org/wp-content/uploads/sites/35/2015/09/2015WildfiresWeb_NumberOfFires_TempTrend_West-800x450.jpg 800w, https://cdn.kqed.org/wp-content/uploads/sites/35/2015/09/2015WildfiresWeb_NumberOfFires_TempTrend_West-400x225.jpg 400w, https://cdn.kqed.org/wp-content/uploads/sites/35/2015/09/2015WildfiresWeb_NumberOfFires_TempTrend_West-1440x810.jpg 1440w, https://cdn.kqed.org/wp-content/uploads/sites/35/2015/09/2015WildfiresWeb_NumberOfFires_TempTrend_West.jpg 1920w, https://cdn.kqed.org/wp-content/uploads/sites/35/2015/09/2015WildfiresWeb_NumberOfFires_TempTrend_West-1180x664.jpg 1180w, https://cdn.kqed.org/wp-content/uploads/sites/35/2015/09/2015WildfiresWeb_NumberOfFires_TempTrend_West-960x540.jpg 960w\" sizes=\"(max-width: 800px) 100vw, 800px\">\u003c/a>\u003c/p>\n\u003cp>Fire is a natural part of most ecosystems but a century of fire suppression, the expansion of homes, roads and infrastructure, and climate change have altered the order of things. Now there’s more fuel in the woods and hotter and drier conditions that can help fires explode with dire consequences.\u003c/p>\n\u003cp>Air quality in downwind communities (some a thousand miles away) also \u003ca href=\"http://www.climatecentral.org/news/report-wildfires-and-air-pollution-a-hidden-hazard-16651\">suffer from the smoke\u003c/a>. At least twice in the past 12 years, cities like Los Angeles and San Diego were forced to deal with Beijing-level air pollution caused by southern California wildfires.\u003c/p>\n\u003cp>Intense burns can leave soil barren and inhibit the regrowth of forest. They can also erode forests’ ability to store carbon and actually turn them into a source of carbon emissions. That’s \u003ca href=\"http://www.climatecentral.org/news/california-forests-climate-polluters-18941\">already occurring in California\u003c/a>, there are concerns that could \u003ca href=\"http://www.climatecentral.org/news/climate-change-alaska-wildfires-19181\">happen in Alaska\u003c/a> this year and it could be coming soon to a forest near you.\u003c/p>\n\u003cp>\u003c/p>\n\u003cp>\u003ci>This story first appeared at \u003ca href=\"http://www.climatecentral.org/\">Climate Central\u003c/a>, a content partner of KQED. Todd Sanford provided data analysis for this story.\u003c/i>\u003c/p>\n\n\u003c/div>\u003c/p>",
"attributes": {
"named": {},
"numeric": []
}
}
],
"link": "/science/229506/trend-large-wildfires-more-common-and-destructive-in-the-west",
"authors": [
"byline_science_229506"
],
"series": [
"science_1151"
],
"categories": [
"science_31",
"science_40"
],
"tags": [
"science_1678",
"science_112",
"science_113"
],
"featImg": "science_229588",
"label": "science_1151"
},
"science_218798": {
"type": "posts",
"id": "science_218798",
"meta": {
"index": "posts_1716263798",
"site": "science",
"id": "218798",
"score": null,
"sort": [
1440706524000
]
},
"parent": 0,
"labelTerm": {
"site": "science",
"term": 1151
},
"blocks": [],
"publishDate": 1440706524,
"format": "aside",
"title": "California Cities Squeezed Out More Water Savings Again in July",
"headTitle": "California Cities Squeezed Out More Water Savings Again in July | KQED",
"content": "\u003cp>Urban Californians stepped up to the plate again in July, beating Governor Jerry Brown’s statewide mandate for 25 percent water savings.\u003c/p>\n\u003cp>“We’ve got a lot of people hitting home runs,” said Felicia Marcus, who chairs the State Water Resources Control Board, and is sometimes referred to as California’s “water czar.”\u003c/p>\n\u003cp>Across the state, urban water agencies \u003ca href=\"http://www.waterboards.ca.gov/waterrights/water_issues/programs/drought/docs/fs082715_july_btn.pdf\">cut total water use\u003c/a> by 31.3 percent, compared to July in the benchmark year of 2013.\u003c/p>\n\u003cp>State officials conceded that freak July rains probably helped the cause, as some homeowners turned off lawn and garden sprinklers, at least temporarily.\u003c/p>\n\u003cp>\u003cstrong>Hover over the dots to see July conservation numbers:\u003c/strong>\u003c/p>\n\u003cdiv>\n\u003c!-- iframe plugin v.4.3 wordpress.org/plugins/iframe/ -->\u003cbr>\n\u003ciframe loading=\"lazy\" width=\"100%\" height=\"520\" frameborder=\"0\" src=\"https://kqednews.cartodb.com/viz/80cb94c6-4d1a-11e5-af2c-0e853d047bba/embed_map\" scrolling=\"yes\" class=\"iframe-class\">\u003c/iframe>\n\u003c/div>\n\u003cp>Water Board staffers called out a few Bay Area cities for their standout performance, including Menlo Park, which has effectively halved its water use since May, and San Francisco, which has whittled its daily use down to an average of 40 gallons per person.\u003c/p>\n\u003cp>[ad fullwidth]\u003c/p>\n\u003cp>On the flip side:\u003c/p>\n\u003cp>“We’ve got a few people who are striking out or not able to find the ball park,” said Marcus, rolling with the baseball metaphor, “and we need to focus on them.”\u003c/p>\n\u003cp>Most of the laggards continue to be in the Southland, especially in more arid regions. But Water Board officials said only four agencies in the state missed their assigned savings quotas by more than 15 percentage points. The quotas, or “tiers,” range from 4 to 36 percent. No agencies have yet incurred fines for missing their marks.\u003c/p>\n\u003cp>June was the first month in which water agencies had to meet their assigned conservation quotas and the numbers showed that most of them \u003ca href=\"http://ww2.kqed.org/science/2015/07/30/whos-saving-water-in-california-and-who-isnt/\">stepped up to the challenge\u003c/a>. About four out of ten urban water suppliers cut their water use dramatically, by 30 percent or more.\u003c/p>\n\u003cp>About a third of water districts, 140 in all, fell short, mostly in Southern California.\u003c/p>\n\u003cp>\u003cstrong>Listen to the story:\u003c/strong>\u003cbr>\n[soundcloud url=”https://api.soundcloud.com/tracks/221221727″ params=”auto_play=false&hide_related=false&show_comments=true&show_user=true&show_reposts=false&visual=true” width=”100%” height=”166″ iframe=”true”/]\u003c/p>\n\u003cp>Overall, Californians saved 27.3 percent \u003ca href=\"http://ww2.kqed.org/science/2015/07/30/whos-saving-water-in-california-and-who-isnt/\">in June, compared to June of 2013\u003c/a>, exceeding the 25 percent statewide mandate issued by Governor Jerry Brown on April 1. A year prior to that, Brown had called for a 20 percent cut in water use through voluntary action and the results were hugely disappointing, yielding less than half that in savings.\u003c/p>\n\u003cp>The Brown mandate applies only to urban water use, which includes most commercial and industrial applications. Urban water consumption accounts for about 10 percent of the total water used by Californians. Agriculture, which takes by far the biggest slice, is under a different system of restrictions.\u003c/p>\n\u003cp>\u003c/p>\n\u003cp>\u003cem>Map produced by Lindsey Hoshaw.\u003c/em>\u003c/p>\n\n",
"stats": {
"hasVideo": false,
"hasChartOrMap": true,
"hasAudio": false,
"hasPolis": false,
"wordCount": 482,
"hasGoogleForm": false,
"hasGallery": false,
"hasHearkenModule": false,
"iframeSrcs": [
"https://kqednews.cartodb.com/viz/80cb94c6-4d1a-11e5-af2c-0e853d047bba/embed_map"
],
"paragraphCount": 17
},
"modified": 1704931383,
"excerpt": "Officials call it a \"tremendous achievement,\" though freak July rains made things easier.",
"headData": {
"twImgId": "",
"twTitle": "",
"ogTitle": "",
"ogImgId": "",
"twDescription": "",
"description": "Officials call it a "tremendous achievement," though freak July rains made things easier.",
"title": "California Cities Squeezed Out More Water Savings Again in July | KQED",
"ogDescription": "",
"schema": {
"@context": "https://schema.org",
"@type": "Article",
"headline": "California Cities Squeezed Out More Water Savings Again in July",
"datePublished": "2015-08-27T13:15:24-07:00",
"dateModified": "2024-01-10T16:03:03-08:00",
"image": "https://cdn.kqed.org/wp-content/uploads/2020/02/KQED-OG-Image@1x.png"
}
},
"guestAuthors": [],
"slug": "california-cities-squeezed-out-more-water-savings-again-in-july",
"status": "publish",
"sticky": false,
"path": "/science/218798/california-cities-squeezed-out-more-water-savings-again-in-july",
"audioTrackLength": null,
"parsedContent": [
{
"type": "contentString",
"content": "\u003cdiv class=\"post-body\">\u003cp>\u003cp>Urban Californians stepped up to the plate again in July, beating Governor Jerry Brown’s statewide mandate for 25 percent water savings.\u003c/p>\n\u003cp>“We’ve got a lot of people hitting home runs,” said Felicia Marcus, who chairs the State Water Resources Control Board, and is sometimes referred to as California’s “water czar.”\u003c/p>\n\u003cp>Across the state, urban water agencies \u003ca href=\"http://www.waterboards.ca.gov/waterrights/water_issues/programs/drought/docs/fs082715_july_btn.pdf\">cut total water use\u003c/a> by 31.3 percent, compared to July in the benchmark year of 2013.\u003c/p>\n\u003cp>State officials conceded that freak July rains probably helped the cause, as some homeowners turned off lawn and garden sprinklers, at least temporarily.\u003c/p>\n\u003cp>\u003cstrong>Hover over the dots to see July conservation numbers:\u003c/strong>\u003c/p>\n\u003cdiv>\n\u003c!-- iframe plugin v.4.3 wordpress.org/plugins/iframe/ -->\u003cbr>\n\u003ciframe loading=\"lazy\" width=\"100%\" height=\"520\" frameborder=\"0\" src=\"https://kqednews.cartodb.com/viz/80cb94c6-4d1a-11e5-af2c-0e853d047bba/embed_map\" scrolling=\"yes\" class=\"iframe-class\">\u003c/iframe>\n\u003c/div>\n\u003cp>Water Board staffers called out a few Bay Area cities for their standout performance, including Menlo Park, which has effectively halved its water use since May, and San Francisco, which has whittled its daily use down to an average of 40 gallons per person.\u003c/p>\n\u003cp>\u003c/p>\u003c/div>",
"attributes": {
"named": {},
"numeric": []
}
},
{
"type": "component",
"content": "",
"name": "ad",
"attributes": {
"named": {
"label": "fullwidth"
},
"numeric": [
"fullwidth"
]
}
},
{
"type": "contentString",
"content": "\u003cdiv class=\"post-body\">\u003cp>\u003c/p>\n\u003cp>On the flip side:\u003c/p>\n\u003cp>“We’ve got a few people who are striking out or not able to find the ball park,” said Marcus, rolling with the baseball metaphor, “and we need to focus on them.”\u003c/p>\n\u003cp>Most of the laggards continue to be in the Southland, especially in more arid regions. But Water Board officials said only four agencies in the state missed their assigned savings quotas by more than 15 percentage points. The quotas, or “tiers,” range from 4 to 36 percent. No agencies have yet incurred fines for missing their marks.\u003c/p>\n\u003cp>June was the first month in which water agencies had to meet their assigned conservation quotas and the numbers showed that most of them \u003ca href=\"http://ww2.kqed.org/science/2015/07/30/whos-saving-water-in-california-and-who-isnt/\">stepped up to the challenge\u003c/a>. About four out of ten urban water suppliers cut their water use dramatically, by 30 percent or more.\u003c/p>\n\u003cp>About a third of water districts, 140 in all, fell short, mostly in Southern California.\u003c/p>\n\u003cp>\u003cstrong>Listen to the story:\u003c/strong>\u003cbr>\n\u003c/p>\u003cp>\u003cdiv class='utils-parseShortcode-shortcodes-__shortcodes__shortcodeWrapper'>\n \u003ciframe width='”100%”' height='”166″'\n scrolling='no' frameborder='no'\n src='https://w.soundcloud.com/player/?url=”https://api.soundcloud.com/tracks/221221727″&visual=true&”auto_play=false&hide_related=false&show_comments=true&show_user=true&show_reposts=false&visual=true”'\n title='”https://api.soundcloud.com/tracks/221221727″'>\n \u003c/iframe>\n \u003c/div>\u003c/p>\u003cp>\u003c/p>\n\u003cp>Overall, Californians saved 27.3 percent \u003ca href=\"http://ww2.kqed.org/science/2015/07/30/whos-saving-water-in-california-and-who-isnt/\">in June, compared to June of 2013\u003c/a>, exceeding the 25 percent statewide mandate issued by Governor Jerry Brown on April 1. A year prior to that, Brown had called for a 20 percent cut in water use through voluntary action and the results were hugely disappointing, yielding less than half that in savings.\u003c/p>\n\u003cp>The Brown mandate applies only to urban water use, which includes most commercial and industrial applications. Urban water consumption accounts for about 10 percent of the total water used by Californians. Agriculture, which takes by far the biggest slice, is under a different system of restrictions.\u003c/p>\n\u003cp>\u003c/p>\n\u003cp>\u003cem>Map produced by Lindsey Hoshaw.\u003c/em>\u003c/p>\n\n\u003c/div>\u003c/p>",
"attributes": {
"named": {},
"numeric": []
}
}
],
"link": "/science/218798/california-cities-squeezed-out-more-water-savings-again-in-july",
"authors": [
"221"
],
"series": [
"science_1151"
],
"categories": [
"science_31",
"science_40",
"science_98"
],
"tags": [
"science_876"
],
"featImg": "science_219522",
"label": "science_1151"
},
"science_216656": {
"type": "posts",
"id": "science_216656",
"meta": {
"index": "posts_1716263798",
"site": "science",
"id": "216656",
"score": null,
"sort": [
1440696923000
]
},
"parent": 0,
"labelTerm": {},
"blocks": [],
"publishDate": 1440696923,
"format": "standard",
"title": "California's Coast Gives Clues to Changing Sea Level",
"headTitle": "California’s Coast Gives Clues to Changing Sea Level | KQED",
"content": "\u003cp>As you drive along the California coast on Highway 1, in many places you’ll see wide flat areas that are elevated above the sea. These are famous among geologists, who’ve mapped these marine terraces up and down the entire west coast.\u003c/p>\n\u003cp>Each marine terrace is a record of sea level during the past. Just as sea level rises today as the world’s glaciers melt, previous changes in the polar ice caps have raised and lowered the sea by hundreds of feet.\u003c/p>\n\u003cp>Whenever the sea level remained steady for a few thousand years, the pounding surf had the leisure to cut into the shoreline. As the waves churned the sea cliffs into sand, they carved away the rocks as deep as they could reach and left a level surface behind.\u003c/p>\n\u003cfigure id=\"attachment_217485\" class=\"wp-caption alignright\" style=\"max-width: 509px\">\u003ca href=\"http://ww2.kqed.org/science/wp-content/uploads/sites/35/2015/08/Marine-terrace.jpg\">\u003cimg loading=\"lazy\" decoding=\"async\" class=\"wp-image-217485 size-full\" src=\"http://ww2.kqed.org/science/wp-content/uploads/sites/35/2015/08/Marine-terrace.jpg\" alt=\"A visual representation of marine terrace formation.\" width=\"509\" height=\"421\" srcset=\"https://cdn.kqed.org/wp-content/uploads/sites/35/2015/08/Marine-terrace.jpg 509w, https://cdn.kqed.org/wp-content/uploads/sites/35/2015/08/Marine-terrace-400x331.jpg 400w\" sizes=\"(max-width: 509px) 100vw, 509px\">\u003c/a>\u003cfigcaption class=\"wp-caption-text\">A visual representation of coastal marine terraces. \u003ccite>(University of Maryland)\u003c/cite>\u003c/figcaption>\u003c/figure>\n\u003cp>Sea level is on scientists’ minds these days as we keep a nervous eye on global warming. A rising sea threatens many places with a slow-motion Katrina. But geologists have always paid attention to this fundamental piece of information in order to visualize the deep past.\u003c/p>\n\u003cp>Imagine the landscape 120,000 years ago, during a warm interglacial period, when the ocean covered today’s coast some 40 feet deep.\u003c/p>\n\u003cp>[ad fullwidth]\u003c/p>\n\u003cp>Imagine later, during the Last Glacial Maximum around 20,000 years ago, when the seas were drawn down by more than 300 feet.\u003c/p>\n\u003cp>The coast was far to the west, and the area between must have been a wide grassland—a “California Serengeti”—roamed by mammoths, sabertooth cats and other Ice Age animals.\u003c/p>\n\u003cp>Compared to those extremes, today’s inches-per-century changes in sea level may seem minor, but they matter a great deal. Consider the Delta, all of which is essentially at sea level.\u003c/p>\n\u003cp>Today, many of the islands in the Delta are actually below sea level because their peaty soils, turned into farms, are shrinking from exposure to the air.\u003c/p>\n\u003cp>As seas rise and push against the levees protecting the Delta, inches matter.\u003c/p>\n\u003cp>[contextly_sidebar id=”sVbHc2H4i4wJlImNXXYOHHZkTE8tG1l6”]Rising seas are partly caused by climate change and partly by the oceanic winds, which push water against the shore in some places and away from it in others. Geological forces also move the land up and down in different places, which—when combined with changing sea levels—leads to the creation of marine terraces.\u003c/p>\n\u003cp>These vertical motions of the land are the topic of a new paper detailing how Ice Age changes affected California’s sea level during the last 120,000 years.\u003c/p>\n\u003cp>Authors \u003ca href=\"http://www.geol.ucsb.edu/faculty/simms/Site/Welcome.html\">Alex Simms\u003c/a> of UC Santa Barbara, along with French scientist \u003ca href=\"http://www.ipgp.fr/en/user/941\">Hélène Rouby\u003c/a> and \u003ca href=\"http://people.rses.anu.edu.au/lambeck_k/index.php\">Kurt Lambeck\u003c/a> of the Australian National University, \u003ca href=\"http://gsabulletin.gsapubs.org/content/early/2015/07/29/B31299.1.abstract\">published their findings last month\u003c/a> in the \u003ca href=\"http://gsabulletin.gsapubs.org/\">Geological Society of America Bulletin\u003c/a>.\u003c/p>\n\u003cp>Data from marine terraces all over the world has been assembled into a \u003ca href=\"https://commons.wikimedia.org/wiki/File:Post-Glacial_Sea_Level.png\">geological record of sea level\u003c/a>. And in places where these terraces vary from the global curve, the data also allows us to deduce vertical movements of the land.\u003c/p>\n\u003cp>In California, that’s important because our whole coastline is tectonically active. The coast north of Cape Mendocino is part of the \u003ca href=\"http://science.kqed.org/quest/2012/02/16/our-corner-of-cascadia/\">Cascadia subduction zone\u003c/a>.\u003c/p>\n\u003cp>The central coast is affected by pressures acting across the San Andreas fault system. And in southern California and Mexico, the coast responds to the forces opening up the Gulf of California.\u003c/p>\n\u003cfigure id=\"attachment_216658\" class=\"wp-caption alignnone\" style=\"max-width: 800px\">\u003ca href=\"http://ww2.kqed.org/science/wp-content/uploads/sites/35/2015/08/shellbeach-terrace.jpg\">\u003cimg loading=\"lazy\" decoding=\"async\" class=\"wp-image-216658 size-medium\" src=\"http://ww2.kqed.org/science/wp-content/uploads/sites/35/2015/08/shellbeach-terrace-800x599.jpg\" alt=\"Marine terrace at Shell Beach\" width=\"800\" height=\"599\" srcset=\"https://cdn.kqed.org/wp-content/uploads/sites/35/2015/08/shellbeach-terrace.jpg 800w, https://cdn.kqed.org/wp-content/uploads/sites/35/2015/08/shellbeach-terrace-400x300.jpg 400w\" sizes=\"(max-width: 800px) 100vw, 800px\">\u003c/a>\u003cfigcaption class=\"wp-caption-text\">This well-developed marine terrace near Shell Beach in Sonoma County has two large rock pinnacles that were once “sea stacks” like those seen offshore today. \u003ccite>(Andrew Alden/KQED)\u003c/cite>\u003c/figcaption>\u003c/figure>\n\u003cp>A lot happens when an ice age starts or ends. Research tells us that when the last ice age ended about 12,000 years ago, the Earth’s crust was affected in several ways.\u003c/p>\n\u003cp>Ice caps no longer pushed the crust down, so it slowly sprang back over thousands of years (and continues today in far northern regions).\u003c/p>\n\u003cp>The gravitational force of the ice no longer pulled the sea toward it. As the land rose, the gravity of the newly risen crust pulled the sea back again.\u003c/p>\n\u003cp>The extra water in the rising sea weighed down the crust along the coast and pushed down the seafloor globally. These and many more-subtle \u003ca href=\"http://sealevel.colorado.edu/faq#n3113\">glacio-isostatic adjustments\u003c/a> are not simple to calculate, but in the last decade they have been adopted by all serious scientists working on sea level.\u003c/p>\n\u003cp>Simms’ team looked at three sets of marine terraces between Washington and Baja California with ages of 120,000, 105,000 and 84,000 years. They estimated the glacio-isostatic effects during those years, and found they made a difference of as much as 65 feet in sea level, depending on the time and location.\u003c/p>\n\u003cp>At Santa Cruz, the results appeared to show that the terraces were rising three times faster than the rest of California. Simms concluded that a study published in 2001 probably gave one of the terraces an incorrect age, and that other studies from 1968 and 2006 had gotten it right. Instead of rising 1.3 millimeters per year, it appears that Santa Cruz has been rising about as fast as its neighbors at 0.3 millimeter per year.\u003c/p>\n\u003cp>Beyond the deep details of working science, these results matter to the rest of us because everything affects what will happen to sea level in the next century.\u003c/p>\n\u003cp>The tide gauge at Fort Point in San Francisco has recorded about 8 inches of sea-level rise since 1900.\u003c/p>\n\u003cp>Simms says the rise appears to be a combination of ocean warming and glacial melting, as seen elsewhere in the world, but it also includes the effect of changes in Pacific wind patterns that have been piling up water against the west coast.\u003c/p>\n\u003cp>\u003c/p>\n\u003cp>Simms’ paper shows that long-term uplift of the land is smaller than these changes. But all the numbers need to be as accurate as possible.\u003c/p>\n\n",
"stats": {
"hasVideo": false,
"hasChartOrMap": false,
"hasAudio": false,
"hasPolis": false,
"wordCount": 1000,
"hasGoogleForm": false,
"hasGallery": false,
"hasHearkenModule": false,
"iframeSrcs": [],
"paragraphCount": 28
},
"modified": 1704931387,
"excerpt": "A fresh look at our distinctive marine terraces shows how both the sea and the West Coast are rising.",
"headData": {
"twImgId": "",
"twTitle": "",
"ogTitle": "",
"ogImgId": "",
"twDescription": "",
"description": "A fresh look at our distinctive marine terraces shows how both the sea and the West Coast are rising.",
"title": "California's Coast Gives Clues to Changing Sea Level | KQED",
"ogDescription": "",
"schema": {
"@context": "https://schema.org",
"@type": "Article",
"headline": "California's Coast Gives Clues to Changing Sea Level",
"datePublished": "2015-08-27T10:35:23-07:00",
"dateModified": "2024-01-10T16:03:07-08:00",
"image": "https://cdn.kqed.org/wp-content/uploads/2020/02/KQED-OG-Image@1x.png"
}
},
"guestAuthors": [],
"slug": "californias-coast-gives-clues-to-changing-sea-level",
"status": "publish",
"sourceUrl": "https://ww2.kqed.org/science/",
"sticky": false,
"source": "KQED Science",
"path": "/science/216656/californias-coast-gives-clues-to-changing-sea-level",
"audioTrackLength": null,
"parsedContent": [
{
"type": "contentString",
"content": "\u003cdiv class=\"post-body\">\u003cp>\u003cp>As you drive along the California coast on Highway 1, in many places you’ll see wide flat areas that are elevated above the sea. These are famous among geologists, who’ve mapped these marine terraces up and down the entire west coast.\u003c/p>\n\u003cp>Each marine terrace is a record of sea level during the past. Just as sea level rises today as the world’s glaciers melt, previous changes in the polar ice caps have raised and lowered the sea by hundreds of feet.\u003c/p>\n\u003cp>Whenever the sea level remained steady for a few thousand years, the pounding surf had the leisure to cut into the shoreline. As the waves churned the sea cliffs into sand, they carved away the rocks as deep as they could reach and left a level surface behind.\u003c/p>\n\u003cfigure id=\"attachment_217485\" class=\"wp-caption alignright\" style=\"max-width: 509px\">\u003ca href=\"http://ww2.kqed.org/science/wp-content/uploads/sites/35/2015/08/Marine-terrace.jpg\">\u003cimg loading=\"lazy\" decoding=\"async\" class=\"wp-image-217485 size-full\" src=\"http://ww2.kqed.org/science/wp-content/uploads/sites/35/2015/08/Marine-terrace.jpg\" alt=\"A visual representation of marine terrace formation.\" width=\"509\" height=\"421\" srcset=\"https://cdn.kqed.org/wp-content/uploads/sites/35/2015/08/Marine-terrace.jpg 509w, https://cdn.kqed.org/wp-content/uploads/sites/35/2015/08/Marine-terrace-400x331.jpg 400w\" sizes=\"(max-width: 509px) 100vw, 509px\">\u003c/a>\u003cfigcaption class=\"wp-caption-text\">A visual representation of coastal marine terraces. \u003ccite>(University of Maryland)\u003c/cite>\u003c/figcaption>\u003c/figure>\n\u003cp>Sea level is on scientists’ minds these days as we keep a nervous eye on global warming. A rising sea threatens many places with a slow-motion Katrina. But geologists have always paid attention to this fundamental piece of information in order to visualize the deep past.\u003c/p>\n\u003cp>Imagine the landscape 120,000 years ago, during a warm interglacial period, when the ocean covered today’s coast some 40 feet deep.\u003c/p>\n\u003cp>\u003c/p>\u003c/div>",
"attributes": {
"named": {},
"numeric": []
}
},
{
"type": "component",
"content": "",
"name": "ad",
"attributes": {
"named": {
"label": "fullwidth"
},
"numeric": [
"fullwidth"
]
}
},
{
"type": "contentString",
"content": "\u003cdiv class=\"post-body\">\u003cp>\u003c/p>\n\u003cp>Imagine later, during the Last Glacial Maximum around 20,000 years ago, when the seas were drawn down by more than 300 feet.\u003c/p>\n\u003cp>The coast was far to the west, and the area between must have been a wide grassland—a “California Serengeti”—roamed by mammoths, sabertooth cats and other Ice Age animals.\u003c/p>\n\u003cp>Compared to those extremes, today’s inches-per-century changes in sea level may seem minor, but they matter a great deal. Consider the Delta, all of which is essentially at sea level.\u003c/p>\n\u003cp>Today, many of the islands in the Delta are actually below sea level because their peaty soils, turned into farms, are shrinking from exposure to the air.\u003c/p>\n\u003cp>As seas rise and push against the levees protecting the Delta, inches matter.\u003c/p>\n\u003cp>\u003c/p>\u003cp>\u003c/p>\u003cp>Rising seas are partly caused by climate change and partly by the oceanic winds, which push water against the shore in some places and away from it in others. Geological forces also move the land up and down in different places, which—when combined with changing sea levels—leads to the creation of marine terraces.\u003c/p>\n\u003cp>These vertical motions of the land are the topic of a new paper detailing how Ice Age changes affected California’s sea level during the last 120,000 years.\u003c/p>\n\u003cp>Authors \u003ca href=\"http://www.geol.ucsb.edu/faculty/simms/Site/Welcome.html\">Alex Simms\u003c/a> of UC Santa Barbara, along with French scientist \u003ca href=\"http://www.ipgp.fr/en/user/941\">Hélène Rouby\u003c/a> and \u003ca href=\"http://people.rses.anu.edu.au/lambeck_k/index.php\">Kurt Lambeck\u003c/a> of the Australian National University, \u003ca href=\"http://gsabulletin.gsapubs.org/content/early/2015/07/29/B31299.1.abstract\">published their findings last month\u003c/a> in the \u003ca href=\"http://gsabulletin.gsapubs.org/\">Geological Society of America Bulletin\u003c/a>.\u003c/p>\n\u003cp>Data from marine terraces all over the world has been assembled into a \u003ca href=\"https://commons.wikimedia.org/wiki/File:Post-Glacial_Sea_Level.png\">geological record of sea level\u003c/a>. And in places where these terraces vary from the global curve, the data also allows us to deduce vertical movements of the land.\u003c/p>\n\u003cp>In California, that’s important because our whole coastline is tectonically active. The coast north of Cape Mendocino is part of the \u003ca href=\"http://science.kqed.org/quest/2012/02/16/our-corner-of-cascadia/\">Cascadia subduction zone\u003c/a>.\u003c/p>\n\u003cp>The central coast is affected by pressures acting across the San Andreas fault system. And in southern California and Mexico, the coast responds to the forces opening up the Gulf of California.\u003c/p>\n\u003cfigure id=\"attachment_216658\" class=\"wp-caption alignnone\" style=\"max-width: 800px\">\u003ca href=\"http://ww2.kqed.org/science/wp-content/uploads/sites/35/2015/08/shellbeach-terrace.jpg\">\u003cimg loading=\"lazy\" decoding=\"async\" class=\"wp-image-216658 size-medium\" src=\"http://ww2.kqed.org/science/wp-content/uploads/sites/35/2015/08/shellbeach-terrace-800x599.jpg\" alt=\"Marine terrace at Shell Beach\" width=\"800\" height=\"599\" srcset=\"https://cdn.kqed.org/wp-content/uploads/sites/35/2015/08/shellbeach-terrace.jpg 800w, https://cdn.kqed.org/wp-content/uploads/sites/35/2015/08/shellbeach-terrace-400x300.jpg 400w\" sizes=\"(max-width: 800px) 100vw, 800px\">\u003c/a>\u003cfigcaption class=\"wp-caption-text\">This well-developed marine terrace near Shell Beach in Sonoma County has two large rock pinnacles that were once “sea stacks” like those seen offshore today. \u003ccite>(Andrew Alden/KQED)\u003c/cite>\u003c/figcaption>\u003c/figure>\n\u003cp>A lot happens when an ice age starts or ends. Research tells us that when the last ice age ended about 12,000 years ago, the Earth’s crust was affected in several ways.\u003c/p>\n\u003cp>Ice caps no longer pushed the crust down, so it slowly sprang back over thousands of years (and continues today in far northern regions).\u003c/p>\n\u003cp>The gravitational force of the ice no longer pulled the sea toward it. As the land rose, the gravity of the newly risen crust pulled the sea back again.\u003c/p>\n\u003cp>The extra water in the rising sea weighed down the crust along the coast and pushed down the seafloor globally. These and many more-subtle \u003ca href=\"http://sealevel.colorado.edu/faq#n3113\">glacio-isostatic adjustments\u003c/a> are not simple to calculate, but in the last decade they have been adopted by all serious scientists working on sea level.\u003c/p>\n\u003cp>Simms’ team looked at three sets of marine terraces between Washington and Baja California with ages of 120,000, 105,000 and 84,000 years. They estimated the glacio-isostatic effects during those years, and found they made a difference of as much as 65 feet in sea level, depending on the time and location.\u003c/p>\n\u003cp>At Santa Cruz, the results appeared to show that the terraces were rising three times faster than the rest of California. Simms concluded that a study published in 2001 probably gave one of the terraces an incorrect age, and that other studies from 1968 and 2006 had gotten it right. Instead of rising 1.3 millimeters per year, it appears that Santa Cruz has been rising about as fast as its neighbors at 0.3 millimeter per year.\u003c/p>\n\u003cp>Beyond the deep details of working science, these results matter to the rest of us because everything affects what will happen to sea level in the next century.\u003c/p>\n\u003cp>The tide gauge at Fort Point in San Francisco has recorded about 8 inches of sea-level rise since 1900.\u003c/p>\n\u003cp>Simms says the rise appears to be a combination of ocean warming and glacial melting, as seen elsewhere in the world, but it also includes the effect of changes in Pacific wind patterns that have been piling up water against the west coast.\u003c/p>\n\u003cp>\u003c/p>\n\u003cp>Simms’ paper shows that long-term uplift of the land is smaller than these changes. But all the numbers need to be as accurate as possible.\u003c/p>\n\n\u003c/div>\u003c/p>",
"attributes": {
"named": {},
"numeric": []
}
}
],
"link": "/science/216656/californias-coast-gives-clues-to-changing-sea-level",
"authors": [
"6228"
],
"series": [
"science_2625"
],
"categories": [
"science_2631",
"science_31",
"science_35",
"science_38",
"science_98"
],
"tags": [
"science_603",
"science_556",
"science_206"
],
"featImg": "science_216657",
"label": "source_science_216656"
},
"science_217096": {
"type": "posts",
"id": "science_217096",
"meta": {
"index": "posts_1716263798",
"site": "science",
"id": "217096",
"score": null,
"sort": [
1440637645000
]
},
"parent": 0,
"labelTerm": {},
"blocks": [],
"publishDate": 1440637645,
"format": "standard",
"title": "NASA: Rising Seas About to Catch Up With the West Coast",
"headTitle": "NASA: Rising Seas About to Catch Up With the West Coast | KQED",
"content": "\u003cp>Rising Seas are about to become a bigger issue for the West Coast, according to scientists.\u003c/p>\n\u003cp>Using satellite and other data, NASA scientists have been tracking \u003ca href=\"http://www.nasa.gov/feature/goddard/warming-seas-and-melting-ice-sheets\">rising sea levels\u003c/a> around the world. They say that natural cycles in the Pacific have been masking effects of sea rise for about the last 20 years. But that’s changing.\u003c/p>\n\u003cp>“In the next five or ten years, I think the west coast of the United States is going to catch up,” says Josh Willis, a climate scientist at NASA’s Jet Propulsion Lab in Pasadena. He says a major ocean phase known as the Pacific Decadal Oscillation is in the midst of a big shift.\u003c/p>\n\u003cp>For about the past two decades, the PDO, which Willis describes as “El Niño’s bigger, slower, brother,” was “piling up” warmer water on the far side of the ocean, exacerbating sea rise there. When water warms, it expands.\u003c/p>\n\u003cp>“So we’ve actually seen a slight drop in sea levels off of our coastline because of the rearrangement of heat within the oceans,” Willis explains.\u003c/p>\n\u003cp>[ad fullwidth]\u003c/p>\n\u003cp>[youtube https://www.youtube.com/watch?v=rkCzae-FCek&w=640&h=360]\u003c/p>\n\u003cp>That rearrangement could mean \u003ca href=\"http://ww2.kqed.org/science/2015/01/15/new-climate-research-suggests-acceleration-of-sea-level-rise/\">an acceleration in the rate\u003c/a> that seas rise long the West Coast, eventually overtaking the pace of sea level rise on the East Coast and elsewhere.\u003c/p>\n\u003cp>“We could be looking at rates in the eastern Pacific two or three times as high as the global rates in the coming years,” says Willis. “So we could be in for wild ride over the next 20 years or so.”\u003c/p>\n\u003cp>As KQED and San Francisco Public Press have reported recently, \u003ca href=\"http://ww2.kqed.org/news/2015/07/30/major-s-f-bayfront-developments-advance-despite-sea-rise-warnings\">billions in shoreline development\u003c/a> in the Bay Area are in the planning stages or already begun, despite scientists’ warnings about rising seas.\u003c/p>\n\u003cp>Scientists say the \u003ca href=\"http://ww2.kqed.org/science/2015/07/09/el-nino-update-californias-great-wet-hope-continues-to-build/\">brewing El Niño\u003c/a> will also pile up warm water along California, making coastal flooding that much more likely, very soon. The warm water along the Equator that largely defines El Niño is expected to rival or surpass the legendary “Godzilla” El Niño of 1997-98 in strength.\u003c/p>\n\u003cp>\u003c/p>\n\u003cp>NASA says global sea levels have risen about eight inches since the beginning of the 20\u003csup>th\u003c/sup> century and more than two inches in the last 20 years. Though simple thermal expansion of the water accounts for about a third of the rise so far, climate scientists expect melting glaciers and ice sheets to play a much larger role in coming years.\u003c/p>\n\n",
"stats": {
"hasVideo": true,
"hasChartOrMap": false,
"hasAudio": false,
"hasPolis": false,
"wordCount": 436,
"hasGoogleForm": false,
"hasGallery": false,
"hasHearkenModule": false,
"iframeSrcs": [],
"paragraphCount": 13
},
"modified": 1704931389,
"excerpt": "Turns out the West Coast has been getting a free pass on sea level rise. That's about to change.",
"headData": {
"twImgId": "",
"twTitle": "",
"ogTitle": "",
"ogImgId": "",
"twDescription": "",
"description": "Turns out the West Coast has been getting a free pass on sea level rise. That's about to change.",
"title": "NASA: Rising Seas About to Catch Up With the West Coast | KQED",
"ogDescription": "",
"schema": {
"@context": "https://schema.org",
"@type": "Article",
"headline": "NASA: Rising Seas About to Catch Up With the West Coast",
"datePublished": "2015-08-26T18:07:25-07:00",
"dateModified": "2024-01-10T16:03:09-08:00",
"image": "https://cdn.kqed.org/wp-content/uploads/2020/02/KQED-OG-Image@1x.png"
}
},
"guestAuthors": [],
"slug": "nasa-rising-seas-about-to-catch-up-with-the-west-coast",
"status": "publish",
"sourceUrl": "https://ww2.kqed.org/science/",
"sticky": false,
"source": "KQED Science",
"path": "/science/217096/nasa-rising-seas-about-to-catch-up-with-the-west-coast",
"audioTrackLength": null,
"parsedContent": [
{
"type": "contentString",
"content": "\u003cdiv class=\"post-body\">\u003cp>\u003cp>Rising Seas are about to become a bigger issue for the West Coast, according to scientists.\u003c/p>\n\u003cp>Using satellite and other data, NASA scientists have been tracking \u003ca href=\"http://www.nasa.gov/feature/goddard/warming-seas-and-melting-ice-sheets\">rising sea levels\u003c/a> around the world. They say that natural cycles in the Pacific have been masking effects of sea rise for about the last 20 years. But that’s changing.\u003c/p>\n\u003cp>“In the next five or ten years, I think the west coast of the United States is going to catch up,” says Josh Willis, a climate scientist at NASA’s Jet Propulsion Lab in Pasadena. He says a major ocean phase known as the Pacific Decadal Oscillation is in the midst of a big shift.\u003c/p>\n\u003cp>For about the past two decades, the PDO, which Willis describes as “El Niño’s bigger, slower, brother,” was “piling up” warmer water on the far side of the ocean, exacerbating sea rise there. When water warms, it expands.\u003c/p>\n\u003cp>“So we’ve actually seen a slight drop in sea levels off of our coastline because of the rearrangement of heat within the oceans,” Willis explains.\u003c/p>\n\u003cp>\u003c/p>\u003c/div>",
"attributes": {
"named": {},
"numeric": []
}
},
{
"type": "component",
"content": "",
"name": "ad",
"attributes": {
"named": {
"label": "fullwidth"
},
"numeric": [
"fullwidth"
]
}
},
{
"type": "contentString",
"content": "\u003cdiv class=\"post-body\">\u003cp>\u003c/p>\n\u003cp>\u003c/p>\u003cp>\u003cspan class='utils-parseShortcode-shortcodes-__youtubeShortcode__embedYoutube'>\n \u003cspan class='utils-parseShortcode-shortcodes-__youtubeShortcode__embedYoutubeInside'>\n \u003ciframe\n loading='lazy'\n class='utils-parseShortcode-shortcodes-__youtubeShortcode__youtubePlayer'\n type='text/html'\n src='//www.youtube.com/embed/rkCzae-FCek'\n title='//www.youtube.com/embed/rkCzae-FCek'\n allowfullscreen='true'\n style='border:0;'>\u003c/iframe>\n \u003c/span>\n \u003c/span>\u003c/p>\u003cp>\u003c/p>\n\u003cp>That rearrangement could mean \u003ca href=\"http://ww2.kqed.org/science/2015/01/15/new-climate-research-suggests-acceleration-of-sea-level-rise/\">an acceleration in the rate\u003c/a> that seas rise long the West Coast, eventually overtaking the pace of sea level rise on the East Coast and elsewhere.\u003c/p>\n\u003cp>“We could be looking at rates in the eastern Pacific two or three times as high as the global rates in the coming years,” says Willis. “So we could be in for wild ride over the next 20 years or so.”\u003c/p>\n\u003cp>As KQED and San Francisco Public Press have reported recently, \u003ca href=\"http://ww2.kqed.org/news/2015/07/30/major-s-f-bayfront-developments-advance-despite-sea-rise-warnings\">billions in shoreline development\u003c/a> in the Bay Area are in the planning stages or already begun, despite scientists’ warnings about rising seas.\u003c/p>\n\u003cp>Scientists say the \u003ca href=\"http://ww2.kqed.org/science/2015/07/09/el-nino-update-californias-great-wet-hope-continues-to-build/\">brewing El Niño\u003c/a> will also pile up warm water along California, making coastal flooding that much more likely, very soon. The warm water along the Equator that largely defines El Niño is expected to rival or surpass the legendary “Godzilla” El Niño of 1997-98 in strength.\u003c/p>\n\u003cp>\u003c/p>\n\u003cp>NASA says global sea levels have risen about eight inches since the beginning of the 20\u003csup>th\u003c/sup> century and more than two inches in the last 20 years. Though simple thermal expansion of the water accounts for about a third of the rise so far, climate scientists expect melting glaciers and ice sheets to play a much larger role in coming years.\u003c/p>\n\n\u003c/div>\u003c/p>",
"attributes": {
"named": {},
"numeric": []
}
}
],
"link": "/science/217096/nasa-rising-seas-about-to-catch-up-with-the-west-coast",
"authors": [
"221"
],
"series": [
"science_2625"
],
"categories": [
"science_31",
"science_40"
],
"tags": [
"science_371",
"science_206"
],
"featImg": "science_217190",
"label": "source_science_217096"
}
},
"podcastsReducer": {
"isFetching": false,
"fetchFailed": false,
"hasFetched": false,
"podcasts": {}
},
"radioProgramsReducer": {
"isFetching": false,
"fetchFailed": false,
"hasFetched": false,
"radioPrograms": {}
},
"radioSearchSegmentsReducer": {},
"programsReducer": {
"all-things-considered": {
"id": "all-things-considered",
"title": "All Things Considered",
"info": "Every weekday, \u003cem>All Things Considered\u003c/em> hosts Robert Siegel, Audie Cornish, Ari Shapiro, and Kelly McEvers present the program's trademark mix of news, interviews, commentaries, reviews, and offbeat features. Michel Martin hosts on the weekends.",
"airtime": "MON-FRI 1pm-2pm, 4:30pm-6:30pm\u003cbr />SAT-SUN 5pm-6pm",
"imageSrc": "https://cdn.kqed.org/wp-content/uploads/2024/04/All-Things-Considered-Podcast-Tile-360x360-1.jpg",
"officialWebsiteLink": "https://www.npr.org/programs/all-things-considered/",
"meta": {
"site": "news",
"source": "npr"
},
"link": "/radio/program/all-things-considered"
},
"american-suburb-podcast": {
"id": "american-suburb-podcast",
"title": "American Suburb: The Podcast",
"tagline": "The flip side of gentrification, told through one town",
"info": "Gentrification is changing cities across America, forcing people from neighborhoods they have long called home. Call them the displaced. Now those priced out of the Bay Area are looking for a better life in an unlikely place. American Suburb follows this migration to one California town along the Delta, 45 miles from San Francisco. But is this once sleepy suburb ready for them?",
"imageSrc": "https://cdn.kqed.org/wp-content/uploads/2024/04/American-Suburb-Podcast-Tile-703x703-1.jpg",
"officialWebsiteLink": "/news/series/american-suburb-podcast",
"meta": {
"site": "news",
"source": "kqed",
"order": 19
},
"link": "/news/series/american-suburb-podcast/",
"subscribe": {
"npr": "https://rpb3r.app.goo.gl/RBrW",
"apple": "https://itunes.apple.com/WebObjects/MZStore.woa/wa/viewPodcast?mt=2&id=1287748328",
"tuneIn": "https://tunein.com/radio/American-Suburb-p1086805/",
"rss": "https://ww2.kqed.org/news/series/american-suburb-podcast/feed/podcast",
"google": "https://podcasts.google.com/feed/aHR0cHM6Ly9mZWVkcy5tZWdhcGhvbmUuZm0vS1FJTkMzMDExODgxNjA5"
}
},
"baycurious": {
"id": "baycurious",
"title": "Bay Curious",
"tagline": "Exploring the Bay Area, one question at a time",
"info": "KQED’s new podcast, Bay Curious, gets to the bottom of the mysteries — both profound and peculiar — that give the Bay Area its unique identity. And we’ll do it with your help! You ask the questions. You decide what Bay Curious investigates. And you join us on the journey to find the answers.",
"imageSrc": "https://cdn.kqed.org/wp-content/uploads/2024/04/Bay-Curious-Podcast-Tile-703x703-1.jpg",
"imageAlt": "KQED Bay Curious",
"officialWebsiteLink": "/news/series/baycurious",
"meta": {
"site": "news",
"source": "kqed",
"order": 3
},
"link": "/podcasts/baycurious",
"subscribe": {
"apple": "https://podcasts.apple.com/us/podcast/bay-curious/id1172473406",
"npr": "https://www.npr.org/podcasts/500557090/bay-curious",
"rss": "https://ww2.kqed.org/news/category/bay-curious-podcast/feed/podcast",
"amazon": "https://music.amazon.com/podcasts/9a90d476-aa04-455d-9a4c-0871ed6216d4/bay-curious",
"stitcher": "https://www.stitcher.com/podcast/kqed/bay-curious",
"spotify": "https://open.spotify.com/show/6O76IdmhixfijmhTZLIJ8k"
}
},
"bbc-world-service": {
"id": "bbc-world-service",
"title": "BBC World Service",
"info": "The day's top stories from BBC News compiled twice daily in the week, once at weekends.",
"airtime": "MON-FRI 9pm-10pm, TUE-FRI 1am-2am",
"imageSrc": "https://cdn.kqed.org/wp-content/uploads/2024/04/BBC-World-Service-Podcast-Tile-360x360-1.jpg",
"officialWebsiteLink": "https://www.bbc.co.uk/sounds/play/live:bbc_world_service",
"meta": {
"site": "news",
"source": "BBC World Service"
},
"link": "/radio/program/bbc-world-service",
"subscribe": {
"apple": "https://itunes.apple.com/us/podcast/global-news-podcast/id135067274?mt=2",
"tuneIn": "https://tunein.com/radio/BBC-World-Service-p455581/",
"rss": "https://podcasts.files.bbci.co.uk/p02nq0gn.rss"
}
},
"californiareport": {
"id": "californiareport",
"title": "The California Report",
"tagline": "California, day by day",
"info": "KQED’s statewide radio news program providing daily coverage of issues, trends and public policy decisions.",
"imageSrc": "https://cdn.kqed.org/wp-content/uploads/2024/04/The-California-Report-Podcast-Tile-703x703-1.jpg",
"imageAlt": "KQED The California Report",
"officialWebsiteLink": "/californiareport",
"meta": {
"site": "news",
"source": "kqed",
"order": 8
},
"link": "/californiareport",
"subscribe": {
"apple": "https://podcasts.apple.com/us/podcast/kqeds-the-california-report/id79681292",
"amazon": "https://music.amazon.com/podcasts/26099305-72af-4542-9dde-ac1807fe36d5/kqed-s-the-california-report",
"npr": "https://www.npr.org/podcasts/432285393/the-california-report",
"stitcher": "https://www.stitcher.com/podcast/kqedfm-kqeds-the-california-report-podcast-8838",
"rss": "https://ww2.kqed.org/news/tag/tcram/feed/podcast"
}
},
"californiareportmagazine": {
"id": "californiareportmagazine",
"title": "The California Report Magazine",
"tagline": "Your state, your stories",
"info": "Every week, The California Report Magazine takes you on a road trip for the ears: to visit the places and meet the people who make California unique. The in-depth storytelling podcast from the California Report.",
"airtime": "FRI 4:30pm-5pm, 6:30pm-7pm, 11pm-11:30pm",
"imageSrc": "https://cdn.kqed.org/wp-content/uploads/2024/04/The-California-Report-Magazine-Podcast-Tile-703x703-1.jpg",
"imageAlt": "KQED The California Report Magazine",
"officialWebsiteLink": "/californiareportmagazine",
"meta": {
"site": "news",
"source": "kqed",
"order": 10
},
"link": "/californiareportmagazine",
"subscribe": {
"apple": "https://podcasts.apple.com/us/podcast/the-california-report-magazine/id1314750545",
"google": "https://podcasts.google.com/feed/aHR0cHM6Ly9mZWVkcy5tZWdhcGhvbmUuZm0vS1FJTkM3NjkwNjk1OTAz",
"npr": "https://www.npr.org/podcasts/564733126/the-california-report-magazine",
"stitcher": "https://www.stitcher.com/podcast/kqed/the-california-report-magazine",
"rss": "https://ww2.kqed.org/news/tag/tcrmag/feed/podcast"
}
},
"city-arts": {
"id": "city-arts",
"title": "City Arts & Lectures",
"info": "A one-hour radio program to hear celebrated writers, artists and thinkers address contemporary ideas and values, often discussing the creative process. Please note: tapes or transcripts are not available",
"imageSrc": "https://ww2.kqed.org/radio/wp-content/uploads/sites/50/2018/05/cityartsandlecture-300x300.jpg",
"officialWebsiteLink": "https://www.cityarts.net/",
"airtime": "SUN 1pm-2pm, TUE 10pm, WED 1am",
"meta": {
"site": "news",
"source": "City Arts & Lectures"
},
"link": "https://www.cityarts.net",
"subscribe": {
"tuneIn": "https://tunein.com/radio/City-Arts-and-Lectures-p692/",
"rss": "https://www.cityarts.net/feed/"
}
},
"closealltabs": {
"id": "closealltabs",
"title": "Close All Tabs",
"tagline": "Your irreverent guide to the trends redefining our world",
"info": "Close All Tabs breaks down how digital culture shapes our world through thoughtful insights and irreverent humor.",
"imageSrc": "https://cdn.kqed.org/wp-content/uploads/2025/02/CAT_2_Tile-scaled.jpg",
"imageAlt": "KQED Close All Tabs",
"officialWebsiteLink": "/podcasts/closealltabs",
"meta": {
"site": "news",
"source": "kqed",
"order": 1
},
"link": "/podcasts/closealltabs",
"subscribe": {
"apple": "https://podcasts.apple.com/us/podcast/close-all-tabs/id214663465",
"rss": "https://feeds.megaphone.fm/KQINC6993880386",
"amazon": "https://music.amazon.com/podcasts/92d9d4ac-67a3-4eed-b10a-fb45d45b1ef2/close-all-tabs",
"spotify": "https://open.spotify.com/show/6LAJFHnGK1pYXYzv6SIol6?si=deb0cae19813417c"
}
},
"code-switch-life-kit": {
"id": "code-switch-life-kit",
"title": "Code Switch / Life Kit",
"info": "\u003cem>Code Switch\u003c/em>, which listeners will hear in the first part of the hour, has fearless and much-needed conversations about race. Hosted by journalists of color, the show tackles the subject of race head-on, exploring how it impacts every part of society — from politics and pop culture to history, sports and more.\u003cbr />\u003cbr />\u003cem>Life Kit\u003c/em>, which will be in the second part of the hour, guides you through spaces and feelings no one prepares you for — from finances to mental health, from workplace microaggressions to imposter syndrome, from relationships to parenting. The show features experts with real world experience and shares their knowledge. Because everyone needs a little help being human.\u003cbr />\u003cbr />\u003ca href=\"https://www.npr.org/podcasts/510312/codeswitch\">\u003cem>Code Switch\u003c/em> offical site and podcast\u003c/a>\u003cbr />\u003ca href=\"https://www.npr.org/lifekit\">\u003cem>Life Kit\u003c/em> offical site and podcast\u003c/a>\u003cbr />",
"airtime": "SUN 9pm-10pm",
"imageSrc": "https://cdn.kqed.org/wp-content/uploads/2024/04/Code-Switch-Life-Kit-Podcast-Tile-360x360-1.jpg",
"meta": {
"site": "radio",
"source": "npr"
},
"link": "/radio/program/code-switch-life-kit",
"subscribe": {
"apple": "https://podcasts.apple.com/podcast/1112190608?mt=2&at=11l79Y&ct=nprdirectory",
"google": "https://podcasts.google.com/feed/aHR0cHM6Ly93d3cubnByLm9yZy9yc3MvcG9kY2FzdC5waHA_aWQ9NTEwMzEy",
"spotify": "https://open.spotify.com/show/3bExJ9JQpkwNhoHvaIIuyV",
"rss": "https://feeds.npr.org/510312/podcast.xml"
}
},
"commonwealth-club": {
"id": "commonwealth-club",
"title": "Commonwealth Club of California Podcast",
"info": "The Commonwealth Club of California is the nation's oldest and largest public affairs forum. As a non-partisan forum, The Club brings to the public airwaves diverse viewpoints on important topics. The Club's weekly radio broadcast - the oldest in the U.S., dating back to 1924 - is carried across the nation on public radio stations and is now podcasting. Our website archive features audio of our recent programs, as well as selected speeches from our long and distinguished history. This podcast feed is usually updated twice a week and is always un-edited.",
"airtime": "THU 10pm, FRI 1am",
"imageSrc": "https://cdn.kqed.org/wp-content/uploads/2024/04/Commonwealth-Club-Podcast-Tile-360x360-1.jpg",
"officialWebsiteLink": "https://www.commonwealthclub.org/podcasts",
"meta": {
"site": "news",
"source": "Commonwealth Club of California"
},
"link": "/radio/program/commonwealth-club",
"subscribe": {
"apple": "https://itunes.apple.com/us/podcast/commonwealth-club-of-california-podcast/id976334034?mt=2",
"google": "https://podcasts.google.com/feed/aHR0cDovL3d3dy5jb21tb253ZWFsdGhjbHViLm9yZy9hdWRpby9wb2RjYXN0L3dlZWtseS54bWw",
"tuneIn": "https://tunein.com/radio/Commonwealth-Club-of-California-p1060/"
}
},
"forum": {
"id": "forum",
"title": "Forum",
"tagline": "The conversation starts here",
"info": "KQED’s live call-in program discussing local, state, national and international issues, as well as in-depth interviews.",
"airtime": "MON-FRI 9am-11am, 10pm-11pm",
"imageSrc": "https://cdn.kqed.org/wp-content/uploads/2024/04/Forum-Podcast-Tile-703x703-1.jpg",
"imageAlt": "KQED Forum with Mina Kim and Alexis Madrigal",
"officialWebsiteLink": "/forum",
"meta": {
"site": "news",
"source": "kqed",
"order": 9
},
"link": "/forum",
"subscribe": {
"apple": "https://podcasts.apple.com/us/podcast/kqeds-forum/id73329719",
"google": "https://podcasts.google.com/feed/aHR0cHM6Ly9mZWVkcy5tZWdhcGhvbmUuZm0vS1FJTkM5NTU3MzgxNjMz",
"npr": "https://www.npr.org/podcasts/432307980/forum",
"stitcher": "https://www.stitcher.com/podcast/kqedfm-kqeds-forum-podcast",
"rss": "https://feeds.megaphone.fm/KQINC9557381633"
}
},
"freakonomics-radio": {
"id": "freakonomics-radio",
"title": "Freakonomics Radio",
"info": "Freakonomics Radio is a one-hour award-winning podcast and public-radio project hosted by Stephen Dubner, with co-author Steve Levitt as a regular guest. It is produced in partnership with WNYC.",
"imageSrc": "https://ww2.kqed.org/news/wp-content/uploads/sites/10/2018/05/freakonomicsRadio.png",
"officialWebsiteLink": "http://freakonomics.com/",
"airtime": "SUN 1am-2am, SAT 3pm-4pm",
"meta": {
"site": "radio",
"source": "WNYC"
},
"link": "/radio/program/freakonomics-radio",
"subscribe": {
"npr": "https://rpb3r.app.goo.gl/4s8b",
"apple": "https://itunes.apple.com/us/podcast/freakonomics-radio/id354668519",
"tuneIn": "https://tunein.com/podcasts/WNYC-Podcasts/Freakonomics-Radio-p272293/",
"rss": "https://feeds.feedburner.com/freakonomicsradio"
}
},
"fresh-air": {
"id": "fresh-air",
"title": "Fresh Air",
"info": "Hosted by Terry Gross, \u003cem>Fresh Air from WHYY\u003c/em> is the Peabody Award-winning weekday magazine of contemporary arts and issues. One of public radio's most popular programs, Fresh Air features intimate conversations with today's biggest luminaries.",
"airtime": "MON-FRI 7pm-8pm",
"imageSrc": "https://cdn.kqed.org/wp-content/uploads/2024/04/Fresh-Air-Podcast-Tile-360x360-1.jpg",
"officialWebsiteLink": "https://www.npr.org/programs/fresh-air/",
"meta": {
"site": "radio",
"source": "npr"
},
"link": "/radio/program/fresh-air",
"subscribe": {
"npr": "https://rpb3r.app.goo.gl/4s8b",
"apple": "https://itunes.apple.com/WebObjects/MZStore.woa/wa/viewPodcast?s=143441&mt=2&id=214089682&at=11l79Y&ct=nprdirectory",
"tuneIn": "https://tunein.com/radio/Fresh-Air-p17/",
"rss": "https://feeds.npr.org/381444908/podcast.xml"
}
},
"here-and-now": {
"id": "here-and-now",
"title": "Here & Now",
"info": "A live production of NPR and WBUR Boston, in collaboration with stations across the country, Here & Now reflects the fluid world of news as it's happening in the middle of the day, with timely, in-depth news, interviews and conversation. Hosted by Robin Young, Jeremy Hobson and Tonya Mosley.",
"airtime": "MON-THU 11am-12pm",
"imageSrc": "https://cdn.kqed.org/wp-content/uploads/2024/04/Here-And-Now-Podcast-Tile-360x360-1.jpg",
"officialWebsiteLink": "http://www.wbur.org/hereandnow",
"meta": {
"site": "news",
"source": "npr"
},
"link": "/radio/program/here-and-now",
"subsdcribe": {
"apple": "https://itunes.apple.com/WebObjects/MZStore.woa/wa/viewPodcast?mt=2&id=426698661",
"tuneIn": "https://tunein.com/radio/Here--Now-p211/",
"rss": "https://feeds.npr.org/510051/podcast.xml"
}
},
"hidden-brain": {
"id": "hidden-brain",
"title": "Hidden Brain",
"info": "Shankar Vedantam uses science and storytelling to reveal the unconscious patterns that drive human behavior, shape our choices and direct our relationships.",
"imageSrc": "https://ww2.kqed.org/radio/wp-content/uploads/sites/50/2018/05/hiddenbrain.jpg",
"officialWebsiteLink": "https://www.npr.org/series/423302056/hidden-brain",
"airtime": "SUN 7pm-8pm",
"meta": {
"site": "news",
"source": "NPR"
},
"link": "/radio/program/hidden-brain",
"subscribe": {
"apple": "https://itunes.apple.com/us/podcast/hidden-brain/id1028908750?mt=2",
"tuneIn": "https://tunein.com/podcasts/Science-Podcasts/Hidden-Brain-p787503/",
"rss": "https://feeds.npr.org/510308/podcast.xml"
}
},
"how-i-built-this": {
"id": "how-i-built-this",
"title": "How I Built This with Guy Raz",
"info": "Guy Raz dives into the stories behind some of the world's best known companies. How I Built This weaves a narrative journey about innovators, entrepreneurs and idealists—and the movements they built.",
"imageSrc": "https://ww2.kqed.org/news/wp-content/uploads/sites/10/2018/05/howIBuiltThis.png",
"officialWebsiteLink": "https://www.npr.org/podcasts/510313/how-i-built-this",
"airtime": "SUN 7:30pm-8pm",
"meta": {
"site": "news",
"source": "npr"
},
"link": "/radio/program/how-i-built-this",
"subscribe": {
"npr": "https://rpb3r.app.goo.gl/3zxy",
"apple": "https://itunes.apple.com/us/podcast/how-i-built-this-with-guy-raz/id1150510297?mt=2",
"tuneIn": "https://tunein.com/podcasts/Arts--Culture-Podcasts/How-I-Built-This-p910896/",
"rss": "https://feeds.npr.org/510313/podcast.xml"
}
},
"hyphenacion": {
"id": "hyphenacion",
"title": "Hyphenación",
"tagline": "Where conversation and cultura meet",
"info": "What kind of no sabo word is Hyphenación? For us, it’s about living within a hyphenation. Like being a third-gen Mexican-American from the Texas border now living that Bay Area Chicano life. Like Xorje! Each week we bring together a couple of hyphenated Latinos to talk all about personal life choices: family, careers, relationships, belonging … everything is on the table. ",
"imageSrc": "https://cdn.kqed.org/wp-content/uploads/2025/03/Hyphenacion_FinalAssets_PodcastTile.png",
"imageAlt": "KQED Hyphenación",
"officialWebsiteLink": "/podcasts/hyphenacion",
"meta": {
"site": "news",
"source": "kqed",
"order": 15
},
"link": "/podcasts/hyphenacion",
"subscribe": {
"apple": "https://podcasts.apple.com/us/podcast/hyphenaci%C3%B3n/id1191591838",
"spotify": "https://open.spotify.com/show/2p3Fifq96nw9BPcmFdIq0o?si=39209f7b25774f38",
"youtube": "https://www.youtube.com/c/kqedarts",
"amazon": "https://music.amazon.com/podcasts/6c3dd23c-93fb-4aab-97ba-1725fa6315f1/hyphenaci%C3%B3n",
"rss": "https://feeds.megaphone.fm/KQINC2275451163"
}
},
"jerrybrown": {
"id": "jerrybrown",
"title": "The Political Mind of Jerry Brown",
"tagline": "Lessons from a lifetime in politics",
"info": "The Political Mind of Jerry Brown brings listeners the wisdom of the former Governor, Mayor, and presidential candidate. Scott Shafer interviewed Brown for more than 40 hours, covering the former governor's life and half-century in the political game – and Brown has some lessons he'd like to share. ",
"imageSrc": "https://cdn.kqed.org/wp-content/uploads/2024/04/The-Political-Mind-of-Jerry-Brown-Podcast-Tile-703x703-1.jpg",
"imageAlt": "KQED The Political Mind of Jerry Brown",
"officialWebsiteLink": "/podcasts/jerrybrown",
"meta": {
"site": "news",
"source": "kqed",
"order": 18
},
"link": "/podcasts/jerrybrown",
"subscribe": {
"npr": "https://www.npr.org/podcasts/790253322/the-political-mind-of-jerry-brown",
"apple": "https://itunes.apple.com/us/podcast/id1492194549",
"rss": "https://ww2.kqed.org/news/series/jerrybrown/feed/podcast/",
"tuneIn": "http://tun.in/pjGcK",
"stitcher": "https://www.stitcher.com/podcast/kqed/the-political-mind-of-jerry-brown",
"spotify": "https://open.spotify.com/show/54C1dmuyFyKMFttY6X2j6r?si=K8SgRCoISNK6ZbjpXrX5-w",
"amazon": "https://music.amazon.com/podcasts/44420f75-3b0e-4301-ab3b-16da6b09e543/the-political-mind-of-jerry-brown"
}
},
"latino-usa": {
"id": "latino-usa",
"title": "Latino USA",
"airtime": "MON 1am-2am, SUN 6pm-7pm",
"info": "Latino USA, the radio journal of news and culture, is the only national, English-language radio program produced from a Latino perspective.",
"imageSrc": "https://ww2.kqed.org/radio/wp-content/uploads/sites/50/2018/04/latinoUsa.jpg",
"officialWebsiteLink": "http://latinousa.org/",
"meta": {
"site": "news",
"source": "npr"
},
"link": "/radio/program/latino-usa",
"subscribe": {
"npr": "https://rpb3r.app.goo.gl/xtTd",
"apple": "https://itunes.apple.com/WebObjects/MZStore.woa/wa/viewPodcast?s=143441&mt=2&id=79681317&at=11l79Y&ct=nprdirectory",
"tuneIn": "https://tunein.com/radio/Latino-USA-p621/",
"rss": "https://feeds.npr.org/510016/podcast.xml"
}
},
"marketplace": {
"id": "marketplace",
"title": "Marketplace",
"info": "Our flagship program, helmed by Kai Ryssdal, examines what the day in money delivered, through stories, conversations, newsworthy numbers and more. Updated Monday through Friday at about 3:30 p.m. PT.",
"airtime": "MON-FRI 4pm-4:30pm, MON-WED 6:30pm-7pm",
"imageSrc": "https://cdn.kqed.org/wp-content/uploads/2024/04/Marketplace-Podcast-Tile-360x360-1.jpg",
"officialWebsiteLink": "https://www.marketplace.org/",
"meta": {
"site": "news",
"source": "American Public Media"
},
"link": "/radio/program/marketplace",
"subscribe": {
"apple": "https://itunes.apple.com/WebObjects/MZStore.woa/wa/viewPodcast?s=143441&mt=2&id=201853034&at=11l79Y&ct=nprdirectory",
"tuneIn": "https://tunein.com/radio/APM-Marketplace-p88/",
"rss": "https://feeds.publicradio.org/public_feeds/marketplace-pm/rss/rss"
}
},
"masters-of-scale": {
"id": "masters-of-scale",
"title": "Masters of Scale",
"info": "Masters of Scale is an original podcast in which LinkedIn co-founder and Greylock Partner Reid Hoffman sets out to describe and prove theories that explain how great entrepreneurs take their companies from zero to a gazillion in ingenious fashion.",
"airtime": "Every other Wednesday June 12 through October 16 at 8pm (repeats Thursdays at 2am)",
"imageSrc": "https://cdn.kqed.org/wp-content/uploads/2024/04/Masters-of-Scale-Podcast-Tile-360x360-1.jpg",
"officialWebsiteLink": "https://mastersofscale.com/",
"meta": {
"site": "radio",
"source": "WaitWhat"
},
"link": "/radio/program/masters-of-scale",
"subscribe": {
"apple": "http://mastersofscale.app.link/",
"rss": "https://rss.art19.com/masters-of-scale"
}
},
"mindshift": {
"id": "mindshift",
"title": "MindShift",
"tagline": "A podcast about the future of learning and how we raise our kids",
"info": "The MindShift podcast explores the innovations in education that are shaping how kids learn. Hosts Ki Sung and Katrina Schwartz introduce listeners to educators, researchers, parents and students who are developing effective ways to improve how kids learn. We cover topics like how fed-up administrators are developing surprising tactics to deal with classroom disruptions; how listening to podcasts are helping kids develop reading skills; the consequences of overparenting; and why interdisciplinary learning can engage students on all ends of the traditional achievement spectrum. This podcast is part of the MindShift education site, a division of KQED News. KQED is an NPR/PBS member station based in San Francisco. You can also visit the MindShift website for episodes and supplemental blog posts or tweet us \u003ca href=\"https://twitter.com/MindShiftKQED\">@MindShiftKQED\u003c/a> or visit us at \u003ca href=\"/mindshift\">MindShift.KQED.org\u003c/a>",
"imageSrc": "https://cdn.kqed.org/wp-content/uploads/2024/04/Mindshift-Podcast-Tile-703x703-1.jpg",
"imageAlt": "KQED MindShift: How We Will Learn",
"officialWebsiteLink": "/mindshift/",
"meta": {
"site": "news",
"source": "kqed",
"order": 12
},
"link": "/podcasts/mindshift",
"subscribe": {
"apple": "https://podcasts.apple.com/us/podcast/mindshift-podcast/id1078765985",
"google": "https://podcasts.google.com/feed/aHR0cHM6Ly9mZWVkcy5tZWdhcGhvbmUuZm0vS1FJTkM1NzY0NjAwNDI5",
"npr": "https://www.npr.org/podcasts/464615685/mind-shift-podcast",
"stitcher": "https://www.stitcher.com/podcast/kqed/stories-teachers-share",
"spotify": "https://open.spotify.com/show/0MxSpNYZKNprFLCl7eEtyx"
}
},
"morning-edition": {
"id": "morning-edition",
"title": "Morning Edition",
"info": "\u003cem>Morning Edition\u003c/em> takes listeners around the country and the world with multi-faceted stories and commentaries every weekday. Hosts Steve Inskeep, David Greene and Rachel Martin bring you the latest breaking news and features to prepare you for the day.",
"airtime": "MON-FRI 3am-9am",
"imageSrc": "https://cdn.kqed.org/wp-content/uploads/2024/04/Morning-Edition-Podcast-Tile-360x360-1.jpg",
"officialWebsiteLink": "https://www.npr.org/programs/morning-edition/",
"meta": {
"site": "news",
"source": "npr"
},
"link": "/radio/program/morning-edition"
},
"onourwatch": {
"id": "onourwatch",
"title": "On Our Watch",
"tagline": "Deeply-reported investigative journalism",
"info": "For decades, the process for how police police themselves has been inconsistent – if not opaque. In some states, like California, these proceedings were completely hidden. After a new police transparency law unsealed scores of internal affairs files, our reporters set out to examine these cases and the shadow world of police discipline. On Our Watch brings listeners into the rooms where officers are questioned and witnesses are interrogated to find out who this system is really protecting. Is it the officers, or the public they've sworn to serve?",
"imageSrc": "https://cdn.kqed.org/wp-content/uploads/2024/04/On-Our-Watch-Podcast-Tile-703x703-1.jpg",
"imageAlt": "On Our Watch from NPR and KQED",
"officialWebsiteLink": "/podcasts/onourwatch",
"meta": {
"site": "news",
"source": "kqed",
"order": 11
},
"link": "/podcasts/onourwatch",
"subscribe": {
"apple": "https://podcasts.apple.com/podcast/id1567098962",
"google": "https://podcasts.google.com/feed/aHR0cHM6Ly9mZWVkcy5ucHIub3JnLzUxMDM2MC9wb2RjYXN0LnhtbD9zYz1nb29nbGVwb2RjYXN0cw",
"npr": "https://rpb3r.app.goo.gl/onourwatch",
"spotify": "https://open.spotify.com/show/0OLWoyizopu6tY1XiuX70x",
"tuneIn": "https://tunein.com/radio/On-Our-Watch-p1436229/",
"stitcher": "https://www.stitcher.com/show/on-our-watch",
"rss": "https://feeds.npr.org/510360/podcast.xml"
}
},
"on-the-media": {
"id": "on-the-media",
"title": "On The Media",
"info": "Our weekly podcast explores how the media 'sausage' is made, casts an incisive eye on fluctuations in the marketplace of ideas, and examines threats to the freedom of information and expression in America and abroad. For one hour a week, the show tries to lift the veil from the process of \"making media,\" especially news media, because it's through that lens that we see the world and the world sees us",
"airtime": "SUN 2pm-3pm, MON 12am-1am",
"imageSrc": "https://ww2.kqed.org/radio/wp-content/uploads/sites/50/2018/04/onTheMedia.png",
"officialWebsiteLink": "https://www.wnycstudios.org/shows/otm",
"meta": {
"site": "news",
"source": "wnyc"
},
"link": "/radio/program/on-the-media",
"subscribe": {
"apple": "https://itunes.apple.com/us/podcast/on-the-media/id73330715?mt=2",
"tuneIn": "https://tunein.com/radio/On-the-Media-p69/",
"rss": "http://feeds.wnyc.org/onthemedia"
}
},
"pbs-newshour": {
"id": "pbs-newshour",
"title": "PBS NewsHour",
"info": "Analysis, background reports and updates from the PBS NewsHour putting today's news in context.",
"airtime": "MON-FRI 3pm-4pm",
"imageSrc": "https://cdn.kqed.org/wp-content/uploads/2024/04/PBS-News-Hour-Podcast-Tile-360x360-1.jpg",
"officialWebsiteLink": "https://www.pbs.org/newshour/",
"meta": {
"site": "news",
"source": "pbs"
},
"link": "/radio/program/pbs-newshour",
"subscribe": {
"apple": "https://itunes.apple.com/us/podcast/pbs-newshour-full-show/id394432287?mt=2",
"tuneIn": "https://tunein.com/radio/PBS-NewsHour---Full-Show-p425698/",
"rss": "https://www.pbs.org/newshour/feeds/rss/podcasts/show"
}
},
"perspectives": {
"id": "perspectives",
"title": "Perspectives",
"tagline": "KQED's series of daily listener commentaries since 1991",
"info": "KQED's series of daily listener commentaries since 1991.",
"imageSrc": "https://cdn.kqed.org/wp-content/uploads/2025/01/Perspectives_Tile_Final.jpg",
"imageAlt": "KQED Perspectives",
"officialWebsiteLink": "/perspectives/",
"meta": {
"site": "radio",
"source": "kqed",
"order": 14
},
"link": "/perspectives",
"subscribe": {
"apple": "https://podcasts.apple.com/us/podcast/id73801135",
"npr": "https://www.npr.org/podcasts/432309616/perspectives",
"rss": "https://ww2.kqed.org/perspectives/category/perspectives/feed/",
"google": "https://podcasts.google.com/feed/aHR0cHM6Ly93dzIua3FlZC5vcmcvcGVyc3BlY3RpdmVzL2NhdGVnb3J5L3BlcnNwZWN0aXZlcy9mZWVkLw"
}
},
"planet-money": {
"id": "planet-money",
"title": "Planet Money",
"info": "The economy explained. Imagine you could call up a friend and say, Meet me at the bar and tell me what's going on with the economy. Now imagine that's actually a fun evening.",
"airtime": "SUN 3pm-4pm",
"imageSrc": "https://ww2.kqed.org/radio/wp-content/uploads/sites/50/2018/04/planetmoney.jpg",
"officialWebsiteLink": "https://www.npr.org/sections/money/",
"meta": {
"site": "news",
"source": "npr"
},
"link": "/radio/program/planet-money",
"subscribe": {
"npr": "https://rpb3r.app.goo.gl/M4f5",
"apple": "https://itunes.apple.com/us/podcast/planet-money/id290783428?mt=2",
"tuneIn": "https://tunein.com/podcasts/Business--Economics-Podcasts/Planet-Money-p164680/",
"rss": "https://feeds.npr.org/510289/podcast.xml"
}
},
"politicalbreakdown": {
"id": "politicalbreakdown",
"title": "Political Breakdown",
"tagline": "Politics from a personal perspective",
"info": "Political Breakdown is a new series that explores the political intersection of California and the nation. Each week hosts Scott Shafer and Marisa Lagos are joined with a new special guest to unpack politics -- with personality — and offer an insider’s glimpse at how politics happens.",
"airtime": "THU 6:30pm-7pm",
"imageSrc": "https://cdn.kqed.org/wp-content/uploads/2024/04/Political-Breakdown-2024-Podcast-Tile-703x703-1.jpg",
"imageAlt": "KQED Political Breakdown",
"officialWebsiteLink": "/podcasts/politicalbreakdown",
"meta": {
"site": "radio",
"source": "kqed",
"order": 5
},
"link": "/podcasts/politicalbreakdown",
"subscribe": {
"apple": "https://podcasts.apple.com/us/podcast/political-breakdown/id1327641087",
"amazon": "https://music.amazon.com/podcasts/e0c2d153-ad36-4c8d-901d-f1da6a724824/political-breakdown",
"npr": "https://www.npr.org/podcasts/572155894/political-breakdown",
"stitcher": "https://www.stitcher.com/podcast/kqed/political-breakdown",
"spotify": "https://open.spotify.com/show/07RVyIjIdk2WDuVehvBMoN",
"rss": "https://ww2.kqed.org/news/tag/political-breakdown/feed/podcast"
}
},
"possible": {
"id": "possible",
"title": "Possible",
"info": "Possible is hosted by entrepreneur Reid Hoffman and writer Aria Finger. Together in Possible, Hoffman and Finger lead enlightening discussions about building a brighter collective future. The show features interviews with visionary guests like Trevor Noah, Sam Altman and Janette Sadik-Khan. Possible paints an optimistic portrait of the world we can create through science, policy, business, art and our shared humanity. It asks: What if everything goes right for once? How can we get there? Each episode also includes a short fiction story generated by advanced AI GPT-4, serving as a thought-provoking springboard to speculate how humanity could leverage technology for good.",
"airtime": "SUN 2pm",
"imageSrc": "https://cdn.kqed.org/wp-content/uploads/2024/04/Possible-Podcast-Tile-360x360-1.jpg",
"officialWebsiteLink": "https://www.possible.fm/",
"meta": {
"site": "news",
"source": "Possible"
},
"link": "/radio/program/possible",
"subscribe": {
"apple": "https://podcasts.apple.com/us/podcast/possible/id1677184070",
"spotify": "https://open.spotify.com/show/730YpdUSNlMyPQwNnyjp4k"
}
},
"pri-the-world": {
"id": "pri-the-world",
"title": "PRI's The World: Latest Edition",
"info": "Each weekday, host Marco Werman and his team of producers bring you the world's most interesting stories in an hour of radio that reminds us just how small our planet really is.",
"airtime": "MON-FRI 2pm-3pm",
"imageSrc": "https://cdn.kqed.org/wp-content/uploads/2024/04/The-World-Podcast-Tile-360x360-1.jpg",
"officialWebsiteLink": "https://www.pri.org/programs/the-world",
"meta": {
"site": "news",
"source": "PRI"
},
"link": "/radio/program/pri-the-world",
"subscribe": {
"apple": "https://itunes.apple.com/us/podcast/pris-the-world-latest-edition/id278196007?mt=2",
"tuneIn": "https://tunein.com/podcasts/News--Politics-Podcasts/PRIs-The-World-p24/",
"rss": "http://feeds.feedburner.com/pri/theworld"
}
},
"radiolab": {
"id": "radiolab",
"title": "Radiolab",
"info": "A two-time Peabody Award-winner, Radiolab is an investigation told through sounds and stories, and centered around one big idea. In the Radiolab world, information sounds like music and science and culture collide. Hosted by Jad Abumrad and Robert Krulwich, the show is designed for listeners who demand skepticism, but appreciate wonder. WNYC Studios is the producer of other leading podcasts including Freakonomics Radio, Death, Sex & Money, On the Media and many more.",
"airtime": "SUN 12am-1am, SAT 2pm-3pm",
"imageSrc": "https://ww2.kqed.org/radio/wp-content/uploads/sites/50/2018/04/radiolab1400.png",
"officialWebsiteLink": "https://www.wnycstudios.org/shows/radiolab/",
"meta": {
"site": "science",
"source": "WNYC"
},
"link": "/radio/program/radiolab",
"subscribe": {
"apple": "https://itunes.apple.com/us/podcast/radiolab/id152249110?mt=2",
"tuneIn": "https://tunein.com/radio/RadioLab-p68032/",
"rss": "https://feeds.wnyc.org/radiolab"
}
},
"reveal": {
"id": "reveal",
"title": "Reveal",
"info": "Created by The Center for Investigative Reporting and PRX, Reveal is public radios first one-hour weekly radio show and podcast dedicated to investigative reporting. Credible, fact based and without a partisan agenda, Reveal combines the power and artistry of driveway moment storytelling with data-rich reporting on critically important issues. The result is stories that inform and inspire, arming our listeners with information to right injustices, hold the powerful accountable and improve lives.Reveal is hosted by Al Letson and showcases the award-winning work of CIR and newsrooms large and small across the nation. In a radio and podcast market crowded with choices, Reveal focuses on important and often surprising stories that illuminate the world for our listeners.",
"airtime": "SAT 4pm-5pm",
"imageSrc": "https://ww2.kqed.org/radio/wp-content/uploads/sites/50/2018/04/reveal300px.png",
"officialWebsiteLink": "https://www.revealnews.org/episodes/",
"meta": {
"site": "news",
"source": "npr"
},
"link": "/radio/program/reveal",
"subscribe": {
"apple": "https://itunes.apple.com/us/podcast/reveal/id886009669",
"tuneIn": "https://tunein.com/radio/Reveal-p679597/",
"rss": "http://feeds.revealradio.org/revealpodcast"
}
},
"rightnowish": {
"id": "rightnowish",
"title": "Rightnowish",
"tagline": "Art is where you find it",
"info": "Rightnowish digs into life in the Bay Area right now… ish. Journalist Pendarvis Harshaw takes us to galleries painted on the sides of liquor stores in West Oakland. We'll dance in warehouses in the Bayview, make smoothies with kids in South Berkeley, and listen to classical music in a 1984 Cutlass Supreme in Richmond. Every week, Pen talks to movers and shakers about how the Bay Area shapes what they create, and how they shape the place we call home.",
"imageSrc": "https://cdn.kqed.org/wp-content/uploads/2024/04/Rightnowish-Podcast-Tile-500x500-1.jpg",
"imageAlt": "KQED Rightnowish with Pendarvis Harshaw",
"officialWebsiteLink": "/podcasts/rightnowish",
"meta": {
"site": "arts",
"source": "kqed",
"order": 16
},
"link": "/podcasts/rightnowish",
"subscribe": {
"npr": "https://www.npr.org/podcasts/721590300/rightnowish",
"rss": "https://ww2.kqed.org/arts/programs/rightnowish/feed/podcast",
"apple": "https://podcasts.apple.com/us/podcast/rightnowish/id1482187648",
"stitcher": "https://www.stitcher.com/podcast/kqed/rightnowish",
"google": "https://podcasts.google.com/feed/aHR0cHM6Ly9mZWVkcy5tZWdhcGhvbmUuZm0vS1FJTkMxMjU5MTY3NDc4",
"spotify": "https://open.spotify.com/show/7kEJuafTzTVan7B78ttz1I"
}
},
"science-friday": {
"id": "science-friday",
"title": "Science Friday",
"info": "Science Friday is a weekly science talk show, broadcast live over public radio stations nationwide. Each week, the show focuses on science topics that are in the news and tries to bring an educated, balanced discussion to bear on the scientific issues at hand. Panels of expert guests join host Ira Flatow, a veteran science journalist, to discuss science and to take questions from listeners during the call-in portion of the program.",
"airtime": "FRI 11am-1pm",
"imageSrc": "https://cdn.kqed.org/wp-content/uploads/2024/04/Science-Friday-Podcast-Tile-360x360-1.jpg",
"officialWebsiteLink": "https://www.wnycstudios.org/shows/science-friday",
"meta": {
"site": "news",
"source": "npr"
},
"link": "/radio/program/science-friday",
"subscribe": {
"apple": "https://itunes.apple.com/WebObjects/MZStore.woa/wa/viewPodcast?s=143441&mt=2&id=73329284&at=11l79Y&ct=nprdirectory",
"tuneIn": "https://tunein.com/radio/Science-Friday-p394/",
"rss": "http://feeds.wnyc.org/science-friday"
}
},
"snap-judgment": {
"id": "snap-judgment",
"title": "Snap Judgment",
"tagline": "Real stories with killer beats",
"info": "The Snap Judgment radio show and podcast mixes real stories with killer beats to produce cinematic, dramatic radio. Snap's musical brand of storytelling dares listeners to see the world through the eyes of another. This is storytelling... with a BEAT!! Snap first aired on public radio stations nationwide in July 2010. Today, Snap Judgment airs on over 450 public radio stations and is brought to the airwaves by KQED & PRX.",
"airtime": "SAT 1pm-2pm, 9pm-10pm",
"imageSrc": "https://cdn.kqed.org/wp-content/uploads/2024/05/Snap-Judgment-Podcast-Tile-703x703-1.jpg",
"imageAlt": "KQED Snap Judgment",
"officialWebsiteLink": "https://snapjudgment.org",
"meta": {
"site": "arts",
"source": "kqed",
"order": 4
},
"link": "https://snapjudgment.org",
"subscribe": {
"apple": "https://podcasts.apple.com/us/podcast/snap-judgment/id283657561",
"npr": "https://www.npr.org/podcasts/449018144/snap-judgment",
"stitcher": "https://www.pandora.com/podcast/snap-judgment/PC:241?source=stitcher-sunset",
"spotify": "https://open.spotify.com/show/3Cct7ZWmxHNAtLgBTqjC5v",
"rss": "https://snap.feed.snapjudgment.org/"
}
},
"soldout": {
"id": "soldout",
"title": "SOLD OUT: Rethinking Housing in America",
"tagline": "A new future for housing",
"info": "Sold Out: Rethinking Housing in America",
"imageSrc": "https://cdn.kqed.org/wp-content/uploads/2024/04/Sold-Out-Podcast-Tile-703x703-1.jpg",
"imageAlt": "KQED Sold Out: Rethinking Housing in America",
"officialWebsiteLink": "/podcasts/soldout",
"meta": {
"site": "news",
"source": "kqed",
"order": 13
},
"link": "/podcasts/soldout",
"subscribe": {
"npr": "https://www.npr.org/podcasts/911586047/s-o-l-d-o-u-t-a-new-future-for-housing",
"apple": "https://podcasts.apple.com/us/podcast/introducing-sold-out-rethinking-housing-in-america/id1531354937",
"rss": "https://feeds.megaphone.fm/soldout",
"spotify": "https://open.spotify.com/show/38dTBSk2ISFoPiyYNoKn1X",
"stitcher": "https://www.stitcher.com/podcast/kqed/sold-out-rethinking-housing-in-america",
"tunein": "https://tunein.com/radio/SOLD-OUT-Rethinking-Housing-in-America-p1365871/"
}
},
"spooked": {
"id": "spooked",
"title": "Spooked",
"tagline": "True-life supernatural stories",
"info": "",
"imageSrc": "https://cdn.kqed.org/wp-content/uploads/2024/10/Spooked-Podcast-Tile-703x703-1.jpg",
"imageAlt": "KQED Spooked",
"officialWebsiteLink": "https://spookedpodcast.org/",
"meta": {
"site": "news",
"source": "kqed",
"order": 7
},
"link": "https://spookedpodcast.org/",
"subscribe": {
"apple": "https://podcasts.apple.com/us/podcast/spooked/id1279361017",
"npr": "https://www.npr.org/podcasts/549547848/snap-judgment-presents-spooked",
"spotify": "https://open.spotify.com/show/76571Rfl3m7PLJQZKQIGCT",
"rss": "https://feeds.simplecast.com/TBotaapn"
}
},
"tech-nation": {
"id": "tech-nation",
"title": "Tech Nation Radio Podcast",
"info": "Tech Nation is a weekly public radio program, hosted by Dr. Moira Gunn. Founded in 1993, it has grown from a simple interview show to a multi-faceted production, featuring conversations with noted technology and science leaders, and a weekly science and technology-related commentary.",
"airtime": "FRI 10pm",
"imageSrc": "https://cdn.kqed.org/wp-content/uploads/2024/04/Tech-Nation-Radio-Podcast-Tile-360x360-1.jpg",
"officialWebsiteLink": "http://technation.podomatic.com/",
"meta": {
"site": "science",
"source": "Tech Nation Media"
},
"link": "/radio/program/tech-nation",
"subscribe": {
"rss": "https://technation.podomatic.com/rss2.xml"
}
},
"ted-radio-hour": {
"id": "ted-radio-hour",
"title": "TED Radio Hour",
"info": "The TED Radio Hour is a journey through fascinating ideas, astonishing inventions, fresh approaches to old problems, and new ways to think and create.",
"airtime": "SUN 3pm-4pm, SAT 10pm-11pm",
"imageSrc": "https://ww2.kqed.org/radio/wp-content/uploads/sites/50/2018/04/tedRadioHour.jpg",
"officialWebsiteLink": "https://www.npr.org/programs/ted-radio-hour/?showDate=2018-06-22",
"meta": {
"site": "news",
"source": "npr"
},
"link": "/radio/program/ted-radio-hour",
"subscribe": {
"npr": "https://rpb3r.app.goo.gl/8vsS",
"apple": "https://itunes.apple.com/WebObjects/MZStore.woa/wa/viewPodcast?s=143441&mt=2&id=523121474&at=11l79Y&ct=nprdirectory",
"tuneIn": "https://tunein.com/radio/TED-Radio-Hour-p418021/",
"rss": "https://feeds.npr.org/510298/podcast.xml"
}
},
"thebay": {
"id": "thebay",
"title": "The Bay",
"tagline": "Local news to keep you rooted",
"info": "Host Devin Katayama walks you through the biggest story of the day with reporters and newsmakers.",
"imageSrc": "https://cdn.kqed.org/wp-content/uploads/2024/04/The-Bay-Podcast-Tile-703x703-1.jpg",
"imageAlt": "KQED The Bay",
"officialWebsiteLink": "/podcasts/thebay",
"meta": {
"site": "radio",
"source": "kqed",
"order": 2
},
"link": "/podcasts/thebay",
"subscribe": {
"apple": "https://podcasts.apple.com/us/podcast/the-bay/id1350043452",
"amazon": "https://music.amazon.com/podcasts/d800ea4c-7a2c-42f2-b861-edaf78a5db0b/the-bay",
"npr": "https://www.npr.org/podcasts/586725995/the-bay",
"stitcher": "https://www.stitcher.com/podcast/kqed/the-bay",
"spotify": "https://open.spotify.com/show/4BIKBKIujizLHlIlBNaAqQ",
"rss": "https://feeds.megaphone.fm/KQINC8259786327"
}
},
"thelatest": {
"id": "thelatest",
"title": "The Latest",
"tagline": "Trusted local news in real time",
"info": "",
"imageSrc": "https://cdn.kqed.org/wp-content/uploads/2025/05/The-Latest-2025-Podcast-Tile-703x703-1.jpg",
"imageAlt": "KQED The Latest",
"officialWebsiteLink": "/thelatest",
"meta": {
"site": "news",
"source": "kqed",
"order": 6
},
"link": "/thelatest",
"subscribe": {
"apple": "https://podcasts.apple.com/us/podcast/the-latest-from-kqed/id1197721799",
"npr": "https://www.npr.org/podcasts/1257949365/the-latest-from-k-q-e-d",
"spotify": "https://open.spotify.com/show/5KIIXMgM9GTi5AepwOYvIZ?si=bd3053fec7244dba",
"rss": "https://feeds.megaphone.fm/KQINC9137121918"
}
},
"theleap": {
"id": "theleap",
"title": "The Leap",
"tagline": "What if you closed your eyes, and jumped?",
"info": "Stories about people making dramatic, risky changes, told by award-winning public radio reporter Judy Campbell.",
"imageSrc": "https://cdn.kqed.org/wp-content/uploads/2024/04/The-Leap-Podcast-Tile-703x703-1.jpg",
"imageAlt": "KQED The Leap",
"officialWebsiteLink": "/podcasts/theleap",
"meta": {
"site": "news",
"source": "kqed",
"order": 17
},
"link": "/podcasts/theleap",
"subscribe": {
"apple": "https://podcasts.apple.com/us/podcast/the-leap/id1046668171",
"npr": "https://www.npr.org/podcasts/447248267/the-leap",
"stitcher": "https://www.stitcher.com/podcast/kqed/the-leap",
"spotify": "https://open.spotify.com/show/3sSlVHHzU0ytLwuGs1SD1U",
"rss": "https://ww2.kqed.org/news/programs/the-leap/feed/podcast"
}
},
"the-moth-radio-hour": {
"id": "the-moth-radio-hour",
"title": "The Moth Radio Hour",
"info": "Since its launch in 1997, The Moth has presented thousands of true stories, told live and without notes, to standing-room-only crowds worldwide. Moth storytellers stand alone, under a spotlight, with only a microphone and a roomful of strangers. The storyteller and the audience embark on a high-wire act of shared experience which is both terrifying and exhilarating. Since 2008, The Moth podcast has featured many of our favorite stories told live on Moth stages around the country. For information on all of our programs and live events, visit themoth.org.",
"airtime": "SAT 8pm-9pm and SUN 11am-12pm",
"imageSrc": "https://ww2.kqed.org/radio/wp-content/uploads/sites/50/2018/04/theMoth.jpg",
"officialWebsiteLink": "https://themoth.org/",
"meta": {
"site": "arts",
"source": "prx"
},
"link": "/radio/program/the-moth-radio-hour",
"subscribe": {
"apple": "https://itunes.apple.com/us/podcast/the-moth-podcast/id275699983?mt=2",
"tuneIn": "https://tunein.com/radio/The-Moth-p273888/",
"rss": "http://feeds.themoth.org/themothpodcast"
}
},
"the-new-yorker-radio-hour": {
"id": "the-new-yorker-radio-hour",
"title": "The New Yorker Radio Hour",
"info": "The New Yorker Radio Hour is a weekly program presented by the magazine's editor, David Remnick, and produced by WNYC Studios and The New Yorker. Each episode features a diverse mix of interviews, profiles, storytelling, and an occasional burst of humor inspired by the magazine, and shaped by its writers, artists, and editors. This isn't a radio version of a magazine, but something all its own, reflecting the rich possibilities of audio storytelling and conversation. Theme music for the show was composed and performed by Merrill Garbus of tUnE-YArDs.",
"airtime": "SAT 10am-11am",
"imageSrc": "https://cdn.kqed.org/wp-content/uploads/2024/04/The-New-Yorker-Podcast-Tile-360x360-1.jpg",
"officialWebsiteLink": "https://www.wnycstudios.org/shows/tnyradiohour",
"meta": {
"site": "arts",
"source": "WNYC"
},
"link": "/radio/program/the-new-yorker-radio-hour",
"subscribe": {
"apple": "https://itunes.apple.com/us/podcast/id1050430296",
"tuneIn": "https://tunein.com/podcasts/WNYC-Podcasts/New-Yorker-Radio-Hour-p803804/",
"rss": "https://feeds.feedburner.com/newyorkerradiohour"
}
},
"the-sam-sanders-show": {
"id": "the-sam-sanders-show",
"title": "The Sam Sanders Show",
"info": "One of public radio's most dynamic voices, Sam Sanders helped launch The NPR Politics Podcast and hosted NPR's hit show It's Been A Minute. Now, the award-winning host returns with something brand new, The Sam Sanders Show. Every week, Sam Sanders and friends dig into the culture that shapes our lives: what's driving the biggest trends, how artists really think, and even the memes you can't stop scrolling past. Sam is beloved for his way of unpacking the world and bringing you up close to fresh currents and engaging conversations. The Sam Sanders Show is smart, funny and always a good time.",
"airtime": "FRI 12-1pm AND SAT 11am-12pm",
"imageSrc": "https://cdn.kqed.org/wp-content/uploads/2025/11/The-Sam-Sanders-Show-Podcast-Tile-400x400-1.jpg",
"officialWebsiteLink": "https://www.kcrw.com/shows/the-sam-sanders-show/latest",
"meta": {
"site": "arts",
"source": "KCRW"
},
"link": "https://www.kcrw.com/shows/the-sam-sanders-show/latest",
"subscribe": {
"rss": "https://feed.cdnstream1.com/zjb/feed/download/ac/28/59/ac28594c-e1d0-4231-8728-61865cdc80e8.xml"
}
},
"the-splendid-table": {
"id": "the-splendid-table",
"title": "The Splendid Table",
"info": "\u003cem>The Splendid Table\u003c/em> hosts our nation's conversations about cooking, sustainability and food culture.",
"imageSrc": "https://cdn.kqed.org/wp-content/uploads/2024/04/The-Splendid-Table-Podcast-Tile-360x360-1.jpg",
"officialWebsiteLink": "https://www.splendidtable.org/",
"airtime": "SUN 10-11 pm",
"meta": {
"site": "radio",
"source": "npr"
},
"link": "/radio/program/the-splendid-table"
},
"this-american-life": {
"id": "this-american-life",
"title": "This American Life",
"info": "This American Life is a weekly public radio show, heard by 2.2 million people on more than 500 stations. Another 2.5 million people download the weekly podcast. It is hosted by Ira Glass, produced in collaboration with Chicago Public Media, delivered to stations by PRX The Public Radio Exchange, and has won all of the major broadcasting awards.",
"airtime": "SAT 12pm-1pm, 7pm-8pm",
"imageSrc": "https://ww2.kqed.org/radio/wp-content/uploads/sites/50/2018/04/thisAmericanLife.png",
"officialWebsiteLink": "https://www.thisamericanlife.org/",
"meta": {
"site": "news",
"source": "wbez"
},
"link": "/radio/program/this-american-life",
"subscribe": {
"apple": "https://itunes.apple.com/WebObjects/MZStore.woa/wa/viewPodcast?s=143441&mt=2&id=201671138&at=11l79Y&ct=nprdirectory",
"rss": "https://www.thisamericanlife.org/podcast/rss.xml"
}
},
"tinydeskradio": {
"id": "tinydeskradio",
"title": "Tiny Desk Radio",
"info": "We're bringing the best of Tiny Desk to the airwaves, only on public radio.",
"airtime": "SUN 8pm and SAT 9pm",
"imageSrc": "https://cdn.kqed.org/wp-content/uploads/2025/04/300x300-For-Member-Station-Logo-Tiny-Desk-Radio-@2x.png",
"officialWebsiteLink": "https://www.npr.org/series/g-s1-52030/tiny-desk-radio",
"meta": {
"site": "news",
"source": "npr"
},
"link": "/radio/program/tinydeskradio",
"subscribe": {
"rss": "https://feeds.npr.org/g-s1-52030/rss.xml"
}
},
"wait-wait-dont-tell-me": {
"id": "wait-wait-dont-tell-me",
"title": "Wait Wait... Don't Tell Me!",
"info": "Peter Sagal and Bill Kurtis host the weekly NPR News quiz show alongside some of the best and brightest news and entertainment personalities.",
"airtime": "SUN 10am-11am, SAT 11am-12pm, SAT 6pm-7pm",
"imageSrc": "https://cdn.kqed.org/wp-content/uploads/2024/04/Wait-Wait-Podcast-Tile-300x300-1.jpg",
"officialWebsiteLink": "https://www.npr.org/programs/wait-wait-dont-tell-me/",
"meta": {
"site": "news",
"source": "npr"
},
"link": "/radio/program/wait-wait-dont-tell-me",
"subscribe": {
"npr": "https://rpb3r.app.goo.gl/Xogv",
"apple": "https://itunes.apple.com/WebObjects/MZStore.woa/wa/viewPodcast?s=143441&mt=2&id=121493804&at=11l79Y&ct=nprdirectory",
"tuneIn": "https://tunein.com/radio/Wait-Wait-Dont-Tell-Me-p46/",
"rss": "https://feeds.npr.org/344098539/podcast.xml"
}
},
"weekend-edition-saturday": {
"id": "weekend-edition-saturday",
"title": "Weekend Edition Saturday",
"info": "Weekend Edition Saturday wraps up the week's news and offers a mix of analysis and features on a wide range of topics, including arts, sports, entertainment, and human interest stories. The two-hour program is hosted by NPR's Peabody Award-winning Scott Simon.",
"airtime": "SAT 5am-10am",
"imageSrc": "https://cdn.kqed.org/wp-content/uploads/2024/04/Weekend-Edition-Podcast-Tile-360x360-1.jpg",
"officialWebsiteLink": "https://www.npr.org/programs/weekend-edition-saturday/",
"meta": {
"site": "news",
"source": "npr"
},
"link": "/radio/program/weekend-edition-saturday"
},
"weekend-edition-sunday": {
"id": "weekend-edition-sunday",
"title": "Weekend Edition Sunday",
"info": "Weekend Edition Sunday features interviews with newsmakers, artists, scientists, politicians, musicians, writers, theologians and historians. The program has covered news events from Nelson Mandela's 1990 release from a South African prison to the capture of Saddam Hussein.",
"airtime": "SUN 5am-10am",
"imageSrc": "https://cdn.kqed.org/wp-content/uploads/2024/04/Weekend-Edition-Podcast-Tile-360x360-1.jpg",
"officialWebsiteLink": "https://www.npr.org/programs/weekend-edition-sunday/",
"meta": {
"site": "news",
"source": "npr"
},
"link": "/radio/program/weekend-edition-sunday"
}
},
"racesReducer": {},
"racesGenElectionReducer": {},
"racesGenElection2026Reducer": {},
"radioSchedulesReducer": {},
"listsReducer": {
"posts/science?category=climate": {
"isFetching": false,
"latestQuery": {
"from": 1272,
"size": 12
},
"vitalsOnly": false,
"totalRequested": 12,
"isLoading": false,
"isLoadingMore": true,
"total": {
"value": 1586,
"relation": "eq"
},
"items": [
"science_286593",
"science_284657",
"science_255377",
"science_273866",
"science_270178",
"science_255463",
"science_247785",
"science_235245",
"science_229506",
"science_218798",
"science_216656",
"science_217096"
],
"complete": true
}
},
"recallGuideReducer": {
"intros": {},
"policy": {},
"candidates": {}
},
"savedArticleReducer": {
"articles": [],
"status": {}
},
"newslettersReducer": {
"isFetching": false,
"fetchFailed": false,
"hasFetched": false,
"newsletters": {},
"isSubscribing": false,
"isUnsubscribing": false,
"subscribedNewsletters": {}
},
"termsReducer": {
"about": {
"name": "About",
"type": "terms",
"id": "about",
"slug": "about",
"link": "/about",
"taxonomy": "site"
},
"arts": {
"name": "Arts & Culture",
"grouping": [
"arts",
"pop",
"trulyca"
],
"description": "KQED Arts provides daily in-depth coverage of the Bay Area's music, art, film, performing arts, literature and arts news, as well as cultural commentary and criticism.",
"type": "terms",
"id": "arts",
"slug": "arts",
"link": "/arts",
"taxonomy": "site"
},
"artschool": {
"name": "Art School",
"parent": "arts",
"type": "terms",
"id": "artschool",
"slug": "artschool",
"link": "/artschool",
"taxonomy": "site"
},
"bayareabites": {
"name": "KQED food",
"grouping": [
"food",
"bayareabites",
"checkplease"
],
"parent": "food",
"type": "terms",
"id": "bayareabites",
"slug": "bayareabites",
"link": "/food",
"taxonomy": "site"
},
"bayareahiphop": {
"name": "Bay Area Hiphop",
"type": "terms",
"id": "bayareahiphop",
"slug": "bayareahiphop",
"link": "/bayareahiphop",
"taxonomy": "site"
},
"campaign21": {
"name": "Campaign 21",
"type": "terms",
"id": "campaign21",
"slug": "campaign21",
"link": "/campaign21",
"taxonomy": "site"
},
"careers": {
"name": "Careers",
"type": "terms",
"id": "careers",
"slug": "careers",
"link": "/careers",
"taxonomy": "site"
},
"checkplease": {
"name": "KQED food",
"grouping": [
"food",
"bayareabites",
"checkplease"
],
"parent": "food",
"type": "terms",
"id": "checkplease",
"slug": "checkplease",
"link": "/food",
"taxonomy": "site"
},
"education": {
"name": "Education",
"grouping": [
"education"
],
"type": "terms",
"id": "education",
"slug": "education",
"link": "/education",
"taxonomy": "site"
},
"elections": {
"name": "Elections",
"type": "terms",
"id": "elections",
"slug": "elections",
"link": "/elections",
"taxonomy": "site"
},
"events": {
"name": "Events",
"type": "terms",
"id": "events",
"slug": "events",
"link": "/events",
"taxonomy": "site"
},
"event": {
"name": "Event",
"alias": "events",
"type": "terms",
"id": "event",
"slug": "event",
"link": "/event",
"taxonomy": "site"
},
"filmschoolshorts": {
"name": "Film School Shorts",
"type": "terms",
"id": "filmschoolshorts",
"slug": "filmschoolshorts",
"link": "/filmschoolshorts",
"taxonomy": "site"
},
"food": {
"name": "KQED food",
"grouping": [
"food",
"bayareabites",
"checkplease"
],
"type": "terms",
"id": "food",
"slug": "food",
"link": "/food",
"taxonomy": "site"
},
"forum": {
"name": "Forum",
"relatedContentQuery": "posts/forum?",
"parent": "news",
"type": "terms",
"id": "forum",
"slug": "forum",
"link": "/forum",
"taxonomy": "site"
},
"futureofyou": {
"name": "Future of You",
"grouping": [
"science",
"futureofyou"
],
"parent": "science",
"type": "terms",
"id": "futureofyou",
"slug": "futureofyou",
"link": "/futureofyou",
"taxonomy": "site"
},
"jpepinheart": {
"name": "KQED food",
"relatedContentQuery": "posts/food,bayareabites,checkplease",
"parent": "food",
"type": "terms",
"id": "jpepinheart",
"slug": "jpepinheart",
"link": "/food",
"taxonomy": "site"
},
"liveblog": {
"name": "Live Blog",
"type": "terms",
"id": "liveblog",
"slug": "liveblog",
"link": "/liveblog",
"taxonomy": "site"
},
"livetv": {
"name": "Live TV",
"parent": "tv",
"type": "terms",
"id": "livetv",
"slug": "livetv",
"link": "/livetv",
"taxonomy": "site"
},
"lowdown": {
"name": "The Lowdown",
"relatedContentQuery": "posts/lowdown?",
"parent": "news",
"type": "terms",
"id": "lowdown",
"slug": "lowdown",
"link": "/lowdown",
"taxonomy": "site"
},
"mindshift": {
"name": "Mindshift",
"parent": "news",
"description": "MindShift explores the future of education by highlighting the innovative – and sometimes counterintuitive – ways educators and parents are helping all children succeed.",
"type": "terms",
"id": "mindshift",
"slug": "mindshift",
"link": "/mindshift",
"taxonomy": "site"
},
"news": {
"name": "News",
"grouping": [
"news",
"forum"
],
"type": "terms",
"id": "news",
"slug": "news",
"link": "/news",
"taxonomy": "site"
},
"newsletters": {
"name": "newsletters",
"type": "terms",
"id": "newsletters",
"slug": "newsletters",
"link": "/newsletters",
"taxonomy": "site"
},
"perspectives": {
"name": "Perspectives",
"parent": "radio",
"type": "terms",
"id": "perspectives",
"slug": "perspectives",
"link": "/perspectives",
"taxonomy": "site"
},
"podcasts": {
"name": "Podcasts",
"type": "terms",
"id": "podcasts",
"slug": "podcasts",
"link": "/podcasts",
"taxonomy": "site"
},
"pop": {
"name": "Pop",
"parent": "arts",
"type": "terms",
"id": "pop",
"slug": "pop",
"link": "/pop",
"taxonomy": "site"
},
"pressroom": {
"name": "Pressroom",
"type": "terms",
"id": "pressroom",
"slug": "pressroom",
"link": "/pressroom",
"taxonomy": "site"
},
"quest": {
"name": "Quest",
"parent": "science",
"type": "terms",
"id": "quest",
"slug": "quest",
"link": "/quest",
"taxonomy": "site"
},
"radio": {
"name": "Radio",
"grouping": [
"forum",
"perspectives"
],
"description": "Listen to KQED Public Radio – home of Forum and The California Report – on 88.5 FM in San Francisco, 89.3 FM in Sacramento, 88.3 FM in Santa Rosa and 88.1 FM in Martinez.",
"type": "terms",
"id": "radio",
"slug": "radio",
"link": "/radio",
"taxonomy": "site"
},
"root": {
"name": "KQED",
"image": "https://ww2.kqed.org/app/uploads/2020/02/KQED-OG-Image@1x.png",
"imageWidth": 1200,
"imageHeight": 630,
"headData": {
"title": "KQED | News, Radio, Podcasts, TV | Public Media for Northern California",
"description": "KQED provides public radio, television, and independent reporting on issues that matter to the Bay Area. We’re the NPR and PBS member station for Northern California."
},
"type": "terms",
"id": "root",
"slug": "root",
"link": "/root",
"taxonomy": "site"
},
"science": {
"name": "Science",
"grouping": [
"science",
"futureofyou"
],
"description": "KQED Science brings you award-winning science and environment coverage from the Bay Area and beyond.",
"type": "terms",
"id": "science",
"slug": "science",
"link": "/science",
"taxonomy": "site"
},
"stateofhealth": {
"name": "State of Health",
"parent": "science",
"type": "terms",
"id": "stateofhealth",
"slug": "stateofhealth",
"link": "/stateofhealth",
"taxonomy": "site"
},
"support": {
"name": "Support",
"type": "terms",
"id": "support",
"slug": "support",
"link": "/support",
"taxonomy": "site"
},
"thedolist": {
"name": "The Do List",
"parent": "arts",
"type": "terms",
"id": "thedolist",
"slug": "thedolist",
"link": "/thedolist",
"taxonomy": "site"
},
"trulyca": {
"name": "Truly CA",
"grouping": [
"arts",
"pop",
"trulyca"
],
"parent": "arts",
"type": "terms",
"id": "trulyca",
"slug": "trulyca",
"link": "/trulyca",
"taxonomy": "site"
},
"tv": {
"name": "TV",
"type": "terms",
"id": "tv",
"slug": "tv",
"link": "/tv",
"taxonomy": "site"
},
"voterguide": {
"name": "Voter Guide",
"parent": "elections",
"alias": "elections",
"type": "terms",
"id": "voterguide",
"slug": "voterguide",
"link": "/voterguide",
"taxonomy": "site"
},
"guiaelectoral": {
"name": "Guia Electoral",
"parent": "elections",
"alias": "elections",
"type": "terms",
"id": "guiaelectoral",
"slug": "guiaelectoral",
"link": "/guiaelectoral",
"taxonomy": "site"
},
"science_category_climate": {
"isLoading": true
},
"science_31": {
"type": "terms",
"id": "science_31",
"meta": {
"index": "terms_1716263798",
"site": "science",
"id": "31",
"found": true
},
"relationships": {},
"featImg": null,
"name": "Climate",
"description": null,
"taxonomy": "category",
"headData": {
"twImgId": null,
"twTitle": null,
"ogTitle": null,
"ogImgId": null,
"twDescription": null,
"description": null,
"title": "Climate Archives | KQED Science",
"ogDescription": null
},
"ttid": 33,
"slug": "climate",
"isLoading": false,
"link": "/science/category/climate"
},
"source_science_216656": {
"type": "terms",
"id": "source_science_216656",
"meta": {
"override": true
},
"name": "KQED Science",
"link": "https://ww2.kqed.org/science/",
"isLoading": false
},
"source_science_217096": {
"type": "terms",
"id": "source_science_217096",
"meta": {
"override": true
},
"name": "KQED Science",
"link": "https://ww2.kqed.org/science/",
"isLoading": false
},
"science_1151": {
"type": "terms",
"id": "science_1151",
"meta": {
"index": "terms_1716263798",
"site": "science",
"id": "1151",
"found": true
},
"relationships": {},
"featImg": null,
"name": "Drought Watch",
"description": "\u003cem>What California's reservoirs look like right now (From KQED's \u003ca href=\"http://ww2.kqed.org/lowdown/\">The Lowdown\u003c/a>)\u003c/em>\r\n\r\n[iframe src=\"http://kroodsma.com/KQED/water-supply-master/public/map.html\" width=\"640\" height=\"720\" frameborder=\"0\" scrolling=\"no\"]\r\n\r\n\u003cem>We’re collecting all of our California drought coverage here, starting with the current state of the drought, then providing the \u003ca href=\"#background\">background\u003c/a> and rounding up \u003ca href=\"#river\">all the stories\u003c/a> we’ve produced.\u003c/em>\r\n\r\n\u003cstrong>Relief at Last\r\n\u003c/strong>\r\n\r\nIn early April, after more than five years of the most withering drought on record, California Governor Jerry Brown finally lifted the emergency drought order he issued in January of 2014. By that time, the record-setting winter of 2016-17 had removed all doubt that the drought was over, though concerns over depleted groundwater levels still remain. According to the \u003ca href=\"http://droughtmonitor.unl.edu/\" target=\"_blank\">U.S. Drought Monitor\u003c/a>, less than 10 percent of California remains in “moderate drought” — compared to nearly 100 percent of the state a year ago.\r\n\r\n[http_redir]",
"taxonomy": "series",
"headData": {
"twImgId": null,
"twTitle": null,
"ogTitle": null,
"ogImgId": null,
"twDescription": null,
"description": "What California's reservoirs look like right now (From KQED's The Lowdown) [iframe src=\"http://kroodsma.com/KQED/water-supply-master/public/map.html\" width=\"640\" height=\"720\" frameborder=\"0\" scrolling=\"no\"] We’re collecting all of our California drought coverage here, starting with the current state of the drought, then providing the background and rounding up all the stories we’ve produced. Relief at Last In early April, after more than five years of the most withering drought on record, California Governor Jerry Brown finally lifted the emergency drought order he issued in January of 2014. By that time, the record-setting winter of 2016-17 had removed all doubt that the drought was over, though concerns over depleted groundwater levels still remain. According to the U.S. Drought Monitor, less than 10 percent of California remains in “moderate drought” — compared to nearly 100 percent of the state a year ago. [http_redir]",
"title": "Drought Watch Archives | KQED Science",
"ogDescription": null
},
"ttid": 1160,
"slug": "california-drought-watch",
"isLoading": false,
"link": "/science/series/california-drought-watch"
},
"science_89": {
"type": "terms",
"id": "science_89",
"meta": {
"index": "terms_1716263798",
"site": "science",
"id": "89",
"found": true
},
"relationships": {},
"featImg": null,
"name": "Engineering",
"description": null,
"taxonomy": "category",
"headData": {
"twImgId": null,
"twTitle": null,
"ogTitle": null,
"ogImgId": null,
"twDescription": null,
"description": null,
"title": "Engineering Archives | KQED Science",
"ogDescription": null
},
"ttid": 92,
"slug": "engineering",
"isLoading": false,
"link": "/science/category/engineering"
},
"science_35": {
"type": "terms",
"id": "science_35",
"meta": {
"index": "terms_1716263798",
"site": "science",
"id": "35",
"found": true
},
"relationships": {},
"featImg": null,
"name": "Environment",
"description": null,
"taxonomy": "category",
"headData": {
"twImgId": null,
"twTitle": null,
"ogTitle": null,
"ogImgId": null,
"twDescription": null,
"description": null,
"title": "Environment Archives | KQED Science",
"ogDescription": null
},
"ttid": 37,
"slug": "environment",
"isLoading": false,
"link": "/science/category/environment"
},
"science_40": {
"type": "terms",
"id": "science_40",
"meta": {
"index": "terms_1716263798",
"site": "science",
"id": "40",
"found": true
},
"relationships": {},
"featImg": null,
"name": "News",
"description": null,
"taxonomy": "category",
"headData": {
"twImgId": null,
"twTitle": null,
"ogTitle": null,
"ogImgId": null,
"twDescription": null,
"description": null,
"title": "News Archives | KQED Science",
"ogDescription": null
},
"ttid": 42,
"slug": "news",
"isLoading": false,
"link": "/science/category/news"
},
"science_43": {
"type": "terms",
"id": "science_43",
"meta": {
"index": "terms_1716263798",
"site": "science",
"id": "43",
"found": true
},
"relationships": {},
"featImg": null,
"name": "Radio",
"description": null,
"taxonomy": "category",
"headData": {
"twImgId": null,
"twTitle": null,
"ogTitle": null,
"ogImgId": null,
"twDescription": null,
"description": null,
"title": "Radio Archives | KQED Science",
"ogDescription": null
},
"ttid": 45,
"slug": "radio",
"isLoading": false,
"link": "/science/category/radio"
},
"science_86": {
"type": "terms",
"id": "science_86",
"meta": {
"index": "terms_1716263798",
"site": "science",
"id": "86",
"found": true
},
"relationships": {},
"featImg": null,
"name": "Video",
"description": null,
"taxonomy": "category",
"headData": {
"twImgId": null,
"twTitle": null,
"ogTitle": null,
"ogImgId": null,
"twDescription": null,
"description": null,
"title": "Video Archives | KQED Science",
"ogDescription": null
},
"ttid": 89,
"slug": "video",
"isLoading": false,
"link": "/science/category/video"
},
"science_98": {
"type": "terms",
"id": "science_98",
"meta": {
"index": "terms_1716263798",
"site": "science",
"id": "98",
"found": true
},
"relationships": {},
"featImg": null,
"name": "Water",
"description": null,
"taxonomy": "category",
"headData": {
"twImgId": null,
"twTitle": null,
"ogTitle": null,
"ogImgId": null,
"twDescription": null,
"description": null,
"title": "Water Archives | KQED Science",
"ogDescription": null
},
"ttid": 102,
"slug": "water",
"isLoading": false,
"link": "/science/category/water"
},
"science_1622": {
"type": "terms",
"id": "science_1622",
"meta": {
"index": "terms_1716263798",
"site": "science",
"id": "1622",
"found": true
},
"relationships": {},
"featImg": null,
"name": "California drought",
"description": null,
"taxonomy": "tag",
"headData": {
"twImgId": null,
"twTitle": null,
"ogTitle": null,
"ogImgId": null,
"twDescription": null,
"description": null,
"title": "California drought Archives | KQED Science",
"ogDescription": null
},
"ttid": 1631,
"slug": "california-drought",
"isLoading": false,
"link": "/science/tag/california-drought"
},
"science_194": {
"type": "terms",
"id": "science_194",
"meta": {
"index": "terms_1716263798",
"site": "science",
"id": "194",
"found": true
},
"relationships": {},
"featImg": null,
"name": "climate change",
"description": null,
"taxonomy": "tag",
"headData": {
"twImgId": null,
"twTitle": null,
"ogTitle": null,
"ogImgId": null,
"twDescription": null,
"description": null,
"title": "climate change Archives | KQED Science",
"ogDescription": null
},
"ttid": 198,
"slug": "climate-change",
"isLoading": false,
"link": "/science/tag/climate-change"
},
"science_572": {
"type": "terms",
"id": "science_572",
"meta": {
"index": "terms_1716263798",
"site": "science",
"id": "572",
"found": true
},
"relationships": {},
"featImg": null,
"name": "drought",
"description": null,
"taxonomy": "tag",
"headData": {
"twImgId": null,
"twTitle": null,
"ogTitle": null,
"ogImgId": null,
"twDescription": null,
"description": null,
"title": "drought Archives | KQED Science",
"ogDescription": null
},
"ttid": 578,
"slug": "drought",
"isLoading": false,
"link": "/science/tag/drought"
},
"science_371": {
"type": "terms",
"id": "science_371",
"meta": {
"index": "terms_1716263798",
"site": "science",
"id": "371",
"found": true
},
"relationships": {},
"featImg": null,
"name": "el nino",
"description": null,
"taxonomy": "tag",
"headData": {
"twImgId": null,
"twTitle": null,
"ogTitle": null,
"ogImgId": null,
"twDescription": null,
"description": null,
"title": "el nino Archives | KQED Science",
"ogDescription": null
},
"ttid": 377,
"slug": "el-nino",
"isLoading": false,
"link": "/science/tag/el-nino"
},
"science_787": {
"type": "terms",
"id": "science_787",
"meta": {
"index": "terms_1716263798",
"site": "science",
"id": "787",
"found": true
},
"relationships": {},
"featImg": null,
"name": "trees",
"description": null,
"taxonomy": "tag",
"headData": {
"twImgId": null,
"twTitle": null,
"ogTitle": null,
"ogImgId": null,
"twDescription": null,
"description": null,
"title": "trees Archives | KQED Science",
"ogDescription": null
},
"ttid": 794,
"slug": "trees",
"isLoading": false,
"link": "/science/tag/trees"
},
"science_454": {
"type": "terms",
"id": "science_454",
"meta": {
"index": "terms_1716263798",
"site": "science",
"id": "454",
"found": true
},
"relationships": {},
"featImg": null,
"name": "east bay regional parks district",
"description": null,
"taxonomy": "tag",
"headData": {
"twImgId": null,
"twTitle": null,
"ogTitle": null,
"ogImgId": null,
"twDescription": null,
"description": null,
"title": "east bay regional parks district Archives | KQED Science",
"ogDescription": null
},
"ttid": 460,
"slug": "east-bay-regional-parks-district",
"isLoading": false,
"link": "/science/tag/east-bay-regional-parks-district"
},
"science_208": {
"type": "terms",
"id": "science_208",
"meta": {
"index": "terms_1716263798",
"site": "science",
"id": "208",
"found": true
},
"relationships": {},
"featImg": null,
"name": "San Francisco Bay",
"description": null,
"taxonomy": "tag",
"headData": {
"twImgId": null,
"twTitle": null,
"ogTitle": null,
"ogImgId": null,
"twDescription": null,
"description": null,
"title": "San Francisco Bay Archives | KQED Science",
"ogDescription": null
},
"ttid": 212,
"slug": "san-francisco-bay",
"isLoading": false,
"link": "/science/tag/san-francisco-bay"
},
"science_42": {
"type": "terms",
"id": "science_42",
"meta": {
"index": "terms_1716263798",
"site": "science",
"id": "42",
"found": true
},
"relationships": {},
"featImg": null,
"name": "Physics",
"description": null,
"taxonomy": "category",
"headData": {
"twImgId": null,
"twTitle": null,
"ogTitle": null,
"ogImgId": null,
"twDescription": null,
"description": null,
"title": "Physics Archives | KQED Science",
"ogDescription": null
},
"ttid": 44,
"slug": "physics",
"isLoading": false,
"link": "/science/category/physics"
},
"science_1596": {
"type": "terms",
"id": "science_1596",
"meta": {
"index": "terms_1716263798",
"site": "science",
"id": "1596",
"found": true
},
"relationships": {},
"featImg": null,
"name": "fire season",
"description": null,
"taxonomy": "tag",
"headData": {
"twImgId": null,
"twTitle": null,
"ogTitle": null,
"ogImgId": null,
"twDescription": null,
"description": null,
"title": "fire season Archives | KQED Science",
"ogDescription": null
},
"ttid": 1605,
"slug": "fire-season",
"isLoading": false,
"link": "/science/tag/fire-season"
},
"science_113": {
"type": "terms",
"id": "science_113",
"meta": {
"index": "terms_1716263798",
"site": "science",
"id": "113",
"found": true
},
"relationships": {},
"featImg": null,
"name": "wildfire",
"description": null,
"taxonomy": "tag",
"headData": {
"twImgId": null,
"twTitle": null,
"ogTitle": null,
"ogImgId": null,
"twDescription": null,
"description": null,
"title": "wildfire Archives | KQED Science",
"ogDescription": null
},
"ttid": 117,
"slug": "wildfire",
"isLoading": false,
"link": "/science/tag/wildfire"
},
"science_30": {
"type": "terms",
"id": "science_30",
"meta": {
"index": "terms_1716263798",
"site": "science",
"id": "30",
"found": true
},
"relationships": {},
"featImg": null,
"name": "Biology",
"description": null,
"taxonomy": "category",
"headData": {
"twImgId": null,
"twTitle": null,
"ogTitle": null,
"ogImgId": null,
"twDescription": null,
"description": null,
"title": "Biology Archives | KQED Science",
"ogDescription": null
},
"ttid": 32,
"slug": "biology",
"isLoading": false,
"link": "/science/category/biology"
},
"science_33": {
"type": "terms",
"id": "science_33",
"meta": {
"index": "terms_1716263798",
"site": "science",
"id": "33",
"found": true
},
"relationships": {},
"featImg": null,
"name": "Energy",
"description": null,
"taxonomy": "category",
"headData": {
"twImgId": null,
"twTitle": null,
"ogTitle": null,
"ogImgId": null,
"twDescription": null,
"description": null,
"title": "Energy Archives | KQED Science",
"ogDescription": null
},
"ttid": 35,
"slug": "energy",
"isLoading": false,
"link": "/science/category/energy"
},
"science_2631": {
"type": "terms",
"id": "science_2631",
"meta": {
"index": "terms_1716263798",
"site": "science",
"id": "2631",
"found": true
},
"relationships": {},
"featImg": null,
"name": "BBL",
"description": null,
"taxonomy": "category",
"headData": {
"twImgId": null,
"twTitle": null,
"ogTitle": null,
"ogImgId": null,
"twDescription": null,
"description": null,
"title": "BBL Archives | KQED Science",
"ogDescription": null
},
"ttid": 2643,
"slug": "bbl",
"isLoading": false,
"link": "/science/category/bbl"
},
"science_2698": {
"type": "terms",
"id": "science_2698",
"meta": {
"index": "terms_1716263798",
"site": "science",
"id": "2698",
"found": true
},
"relationships": {},
"featImg": null,
"name": "Monterey Bay Aquarium",
"description": null,
"taxonomy": "tag",
"headData": {
"twImgId": null,
"twTitle": null,
"ogTitle": null,
"ogImgId": null,
"twDescription": null,
"description": null,
"title": "Monterey Bay Aquarium Archives | KQED Science",
"ogDescription": null
},
"ttid": 2190,
"slug": "monterey-bay-aquarium",
"isLoading": false,
"link": "/science/tag/monterey-bay-aquarium"
},
"science_1321": {
"type": "terms",
"id": "science_1321",
"meta": {
"index": "terms_1716263798",
"site": "science",
"id": "1321",
"found": true
},
"relationships": {},
"featImg": null,
"name": "ocean acidification",
"description": null,
"taxonomy": "tag",
"headData": {
"twImgId": null,
"twTitle": null,
"ogTitle": null,
"ogImgId": null,
"twDescription": null,
"description": null,
"title": "ocean acidification Archives | KQED Science",
"ogDescription": null
},
"ttid": 1330,
"slug": "ocean-acidification",
"isLoading": false,
"link": "/science/tag/ocean-acidification"
},
"science_1678": {
"type": "terms",
"id": "science_1678",
"meta": {
"index": "terms_1716263798",
"site": "science",
"id": "1678",
"found": true
},
"relationships": {},
"featImg": null,
"name": "climate central",
"description": null,
"taxonomy": "tag",
"headData": {
"twImgId": null,
"twTitle": null,
"ogTitle": null,
"ogImgId": null,
"twDescription": null,
"description": null,
"title": "climate central Archives | KQED Science",
"ogDescription": null
},
"ttid": 1687,
"slug": "climate-central",
"isLoading": false,
"link": "/science/tag/climate-central"
},
"science_112": {
"type": "terms",
"id": "science_112",
"meta": {
"index": "terms_1716263798",
"site": "science",
"id": "112",
"found": true
},
"relationships": {},
"featImg": null,
"name": "fire",
"description": null,
"taxonomy": "tag",
"headData": {
"twImgId": null,
"twTitle": null,
"ogTitle": null,
"ogImgId": null,
"twDescription": null,
"description": null,
"title": "fire Archives | KQED Science",
"ogDescription": null
},
"ttid": 116,
"slug": "fire",
"isLoading": false,
"link": "/science/tag/fire"
},
"science_876": {
"type": "terms",
"id": "science_876",
"meta": {
"index": "terms_1716263798",
"site": "science",
"id": "876",
"found": true
},
"relationships": {},
"featImg": null,
"name": "water conservation",
"description": null,
"taxonomy": "tag",
"headData": {
"twImgId": null,
"twTitle": null,
"ogTitle": null,
"ogImgId": null,
"twDescription": null,
"description": null,
"title": "water conservation Archives | KQED Science",
"ogDescription": null
},
"ttid": 882,
"slug": "water-conservation",
"isLoading": false,
"link": "/science/tag/water-conservation"
},
"science_2625": {
"type": "terms",
"id": "science_2625",
"meta": {
"index": "terms_1716263798",
"site": "science",
"id": "2625",
"found": true
},
"relationships": {},
"featImg": null,
"name": "PBS and the BBC present 'Big Blue Live'",
"description": "[caption id=\"attachment_149123\" align=\"aligncenter\" width=\"800\"] (Craig Miller/KQED)[/caption]\r\n\r\nFrom breaching humpback whales to fuzzy sea otters, great white sharks, kelp forests and an underwater canyon deeper than the Grand Canyon, Monterey Bay is one of the world's most amazing ocean destinations. In an unprecedented collaboration, PBS and the BBC presented \"\u003ca href=\"http://www.pbs.org/big-blue-live/home/\">Big Blue Live\u003c/a>,\" a three-night live broadcast that aired on KQED 9 at 8 pm Aug. 31 to Sept. 2, 2015 and featured the majestic marine life of Monterey Bay. \r\n\r\nAnchored from open-air studios at the Monterey Bay Aquarium and aboard research ships on the bay, scientists, filmmakers and other experts came together to document the extraordinary rejuvenation of the once-endangered and now thriving ecosystem of the Monterey Bay National Marine Sanctuary for viewers in the United States and Europe. Over the past decade, KQED has told many of the stories of this remarkable area on television, radio and the web.\r\n\r\nAlthough the Big Blue Live event is now over, you can \u003ca href=\"http://video.kqed.org/program/big-blue-live/\">watch all 3 episodes online through the entire month of September\u003c/a>:\r\n\r\nFeatured Stories",
"taxonomy": "series",
"headData": {
"twImgId": null,
"twTitle": null,
"ogTitle": null,
"ogImgId": null,
"twDescription": null,
"description": "[caption id=\"attachment_149123\" align=\"aligncenter\" width=\"800\"] (Craig Miller/KQED)[/caption] From breaching humpback whales to fuzzy sea otters, great white sharks, kelp forests and an underwater canyon deeper than the Grand Canyon, Monterey Bay is one of the world's most amazing ocean destinations. In an unprecedented collaboration, PBS and the BBC presented \"Big Blue Live,\" a three-night live broadcast that aired on KQED 9 at 8 pm Aug. 31 to Sept. 2, 2015 and featured the majestic marine life of Monterey Bay. Anchored from open-air studios at the Monterey Bay Aquarium and aboard research ships on the bay, scientists, filmmakers and other experts came together to document the extraordinary rejuvenation of the once-endangered and now thriving ecosystem of the Monterey Bay National Marine Sanctuary for viewers in the United States and Europe. Over the past decade, KQED has told many of the stories of this remarkable area on television, radio and the web. Although the Big Blue Live event is now over, you can watch all 3 episodes online through the entire month of September: Featured Stories",
"title": "PBS and the BBC present 'Big Blue Live' Archives | KQED Science",
"ogDescription": null
},
"ttid": 2637,
"slug": "big-blue-live",
"isLoading": false,
"link": "/science/series/big-blue-live"
},
"science_38": {
"type": "terms",
"id": "science_38",
"meta": {
"index": "terms_1716263798",
"site": "science",
"id": "38",
"found": true
},
"relationships": {},
"featImg": null,
"name": "Geology",
"description": null,
"taxonomy": "category",
"headData": {
"twImgId": null,
"twTitle": null,
"ogTitle": null,
"ogImgId": null,
"twDescription": null,
"description": null,
"title": "Geology Archives | KQED Science",
"ogDescription": null
},
"ttid": 40,
"slug": "geology",
"isLoading": false,
"link": "/science/category/geology"
},
"science_603": {
"type": "terms",
"id": "science_603",
"meta": {
"index": "terms_1716263798",
"site": "science",
"id": "603",
"found": true
},
"relationships": {},
"featImg": null,
"name": "climate change impacts",
"description": null,
"taxonomy": "tag",
"headData": {
"twImgId": null,
"twTitle": null,
"ogTitle": null,
"ogImgId": null,
"twDescription": null,
"description": null,
"title": "climate change impacts Archives | KQED Science",
"ogDescription": null
},
"ttid": 609,
"slug": "climate-change-impacts",
"isLoading": false,
"link": "/science/tag/climate-change-impacts"
},
"science_556": {
"type": "terms",
"id": "science_556",
"meta": {
"index": "terms_1716263798",
"site": "science",
"id": "556",
"found": true
},
"relationships": {},
"featImg": null,
"name": "global warming",
"description": null,
"taxonomy": "tag",
"headData": {
"twImgId": null,
"twTitle": null,
"ogTitle": null,
"ogImgId": null,
"twDescription": null,
"description": null,
"title": "global warming Archives | KQED Science",
"ogDescription": null
},
"ttid": 562,
"slug": "global-warming",
"isLoading": false,
"link": "/science/tag/global-warming"
},
"science_206": {
"type": "terms",
"id": "science_206",
"meta": {
"index": "terms_1716263798",
"site": "science",
"id": "206",
"found": true
},
"relationships": {},
"featImg": null,
"name": "sea level rise",
"description": null,
"taxonomy": "tag",
"headData": {
"twImgId": null,
"twTitle": null,
"ogTitle": null,
"ogImgId": null,
"twDescription": null,
"description": null,
"title": "sea level rise Archives | KQED Science",
"ogDescription": null
},
"ttid": 210,
"slug": "sea-level-rise",
"isLoading": false,
"link": "/science/tag/sea-level-rise"
}
},
"userPermissionsReducer": {
"wpLoggedIn": false
},
"eventsReducer": {},
"fssReducer": {},
"tvDailyScheduleReducer": {},
"tvWeeklyScheduleReducer": {},
"tvPrimetimeScheduleReducer": {},
"tvMonthlyScheduleReducer": {},
"userAccountReducer": {
"user": {
"email": null,
"emailStatus": "EMAIL_UNVALIDATED",
"loggedStatus": "LOGGED_OUT",
"loggingChecked": false,
"articles": [],
"firstName": null,
"lastName": null,
"phoneNumber": null,
"fetchingMembership": false,
"membershipError": false,
"memberships": [
{
"id": null,
"startDate": null,
"firstName": null,
"lastName": null,
"familyNumber": null,
"memberNumber": null,
"memberSince": null,
"expirationDate": null,
"pfsEligible": false,
"isSustaining": false,
"membershipLevel": "Prospect",
"membershipStatus": "Non Member",
"lastGiftDate": null,
"renewalDate": null,
"lastDonationAmount": null
}
]
},
"authModal": {
"isOpen": false,
"view": "LANDING_VIEW"
},
"error": null
},
"youthMediaReducer": {},
"checkPleaseReducer": {
"filterData": {
"region": {
"key": "Restaurant Region",
"filters": [
"Any Region"
]
},
"cuisine": {
"key": "Restaurant Cuisine",
"filters": [
"Any Cuisine"
]
}
},
"restaurantDataById": {},
"restaurantIdsSorted": [],
"error": null
},
"userAgentReducer": {
"userAgent": "Mozilla/5.0 AppleWebKit/537.36 (KHTML, like Gecko; compatible; ClaudeBot/1.0; +claudebot@anthropic.com)",
"isBot": true
},
"requestOutcomesReducer": {
"notFound": []
}
}