window.__IS_SSR__=true
window.__INITIAL_STATE__={
"attachmentsReducer": {
"audio_0": {
"type": "attachments",
"id": "audio_0",
"imgSizes": {
"kqedFullSize": {
"file": "https://ww2.kqed.org/news/wp-content/themes/KQED-unified/img/audio_bgs/background0.jpg"
}
}
},
"audio_1": {
"type": "attachments",
"id": "audio_1",
"imgSizes": {
"kqedFullSize": {
"file": "https://ww2.kqed.org/news/wp-content/themes/KQED-unified/img/audio_bgs/background1.jpg"
}
}
},
"audio_2": {
"type": "attachments",
"id": "audio_2",
"imgSizes": {
"kqedFullSize": {
"file": "https://ww2.kqed.org/news/wp-content/themes/KQED-unified/img/audio_bgs/background2.jpg"
}
}
},
"audio_3": {
"type": "attachments",
"id": "audio_3",
"imgSizes": {
"kqedFullSize": {
"file": "https://ww2.kqed.org/news/wp-content/themes/KQED-unified/img/audio_bgs/background3.jpg"
}
}
},
"audio_4": {
"type": "attachments",
"id": "audio_4",
"imgSizes": {
"kqedFullSize": {
"file": "https://ww2.kqed.org/news/wp-content/themes/KQED-unified/img/audio_bgs/background4.jpg"
}
}
},
"placeholder": {
"type": "attachments",
"id": "placeholder",
"imgSizes": {
"thumbnail": {
"file": "https://cdn.kqed.org/wp-content/uploads/2024/12/KQED-Default-Image-816638274-2000x1333-1-160x107.jpg",
"width": 160,
"height": 107,
"mimeType": "image/jpeg"
},
"medium": {
"file": "https://cdn.kqed.org/wp-content/uploads/2024/12/KQED-Default-Image-816638274-2000x1333-1-800x533.jpg",
"width": 800,
"height": 533,
"mimeType": "image/jpeg"
},
"medium_large": {
"file": "https://cdn.kqed.org/wp-content/uploads/2024/12/KQED-Default-Image-816638274-2000x1333-1-768x512.jpg",
"width": 768,
"height": 512,
"mimeType": "image/jpeg"
},
"large": {
"file": "https://cdn.kqed.org/wp-content/uploads/2024/12/KQED-Default-Image-816638274-2000x1333-1-1020x680.jpg",
"width": 1020,
"height": 680,
"mimeType": "image/jpeg"
},
"1536x1536": {
"file": "https://cdn.kqed.org/wp-content/uploads/2024/12/KQED-Default-Image-816638274-2000x1333-1-1536x1024.jpg",
"width": 1536,
"height": 1024,
"mimeType": "image/jpeg"
},
"fd-lrg": {
"file": "https://cdn.kqed.org/wp-content/uploads/2024/12/KQED-Default-Image-816638274-2000x1333-1-1536x1024.jpg",
"width": 1536,
"height": 1024,
"mimeType": "image/jpeg"
},
"fd-med": {
"file": "https://cdn.kqed.org/wp-content/uploads/2024/12/KQED-Default-Image-816638274-2000x1333-1-1020x680.jpg",
"width": 1020,
"height": 680,
"mimeType": "image/jpeg"
},
"fd-sm": {
"file": "https://cdn.kqed.org/wp-content/uploads/2024/12/KQED-Default-Image-816638274-2000x1333-1-800x533.jpg",
"width": 800,
"height": 533,
"mimeType": "image/jpeg"
},
"post-thumbnail": {
"file": "https://cdn.kqed.org/wp-content/uploads/2024/12/KQED-Default-Image-816638274-2000x1333-1-672x372.jpg",
"width": 672,
"height": 372,
"mimeType": "image/jpeg"
},
"twentyfourteen-full-width": {
"file": "https://cdn.kqed.org/wp-content/uploads/2024/12/KQED-Default-Image-816638274-2000x1333-1-1038x576.jpg",
"width": 1038,
"height": 576,
"mimeType": "image/jpeg"
},
"xxsmall": {
"file": "https://cdn.kqed.org/wp-content/uploads/2024/12/KQED-Default-Image-816638274-2000x1333-1-160x107.jpg",
"width": 160,
"height": 107,
"mimeType": "image/jpeg"
},
"xsmall": {
"file": "https://cdn.kqed.org/wp-content/uploads/2024/12/KQED-Default-Image-816638274-2000x1333-1-672x372.jpg",
"width": 672,
"height": 372,
"mimeType": "image/jpeg"
},
"small": {
"file": "https://cdn.kqed.org/wp-content/uploads/2024/12/KQED-Default-Image-816638274-2000x1333-1-672x372.jpg",
"width": 672,
"height": 372,
"mimeType": "image/jpeg"
},
"xlarge": {
"file": "https://cdn.kqed.org/wp-content/uploads/2024/12/KQED-Default-Image-816638274-2000x1333-1-1020x680.jpg",
"width": 1020,
"height": 680,
"mimeType": "image/jpeg"
},
"full-width": {
"file": "https://cdn.kqed.org/wp-content/uploads/2024/12/KQED-Default-Image-816638274-2000x1333-1-1920x1280.jpg",
"width": 1920,
"height": 1280,
"mimeType": "image/jpeg"
},
"guest-author-32": {
"file": "https://cdn.kqed.org/wp-content/uploads/2025/01/KQED-Default-Image-816638274-1333x1333-1-160x160.jpg",
"width": 32,
"height": 32,
"mimeType": "image/jpeg"
},
"guest-author-50": {
"file": "https://cdn.kqed.org/wp-content/uploads/2025/01/KQED-Default-Image-816638274-1333x1333-1-160x160.jpg",
"width": 50,
"height": 50,
"mimeType": "image/jpeg"
},
"guest-author-64": {
"file": "https://cdn.kqed.org/wp-content/uploads/2025/01/KQED-Default-Image-816638274-1333x1333-1-160x160.jpg",
"width": 64,
"height": 64,
"mimeType": "image/jpeg"
},
"guest-author-96": {
"file": "https://cdn.kqed.org/wp-content/uploads/2025/01/KQED-Default-Image-816638274-1333x1333-1-160x160.jpg",
"width": 96,
"height": 96,
"mimeType": "image/jpeg"
},
"guest-author-128": {
"file": "https://cdn.kqed.org/wp-content/uploads/2025/01/KQED-Default-Image-816638274-1333x1333-1-160x160.jpg",
"width": 128,
"height": 128,
"mimeType": "image/jpeg"
},
"detail": {
"file": "https://cdn.kqed.org/wp-content/uploads/2025/01/KQED-Default-Image-816638274-1333x1333-1-160x160.jpg",
"width": 160,
"height": 160,
"mimeType": "image/jpeg"
},
"kqedFullSize": {
"file": "https://cdn.kqed.org/wp-content/uploads/2024/12/KQED-Default-Image-816638274-2000x1333-1.jpg",
"width": 2000,
"height": 1333
}
}
},
"science_365350": {
"type": "attachments",
"id": "science_365350",
"meta": {
"index": "attachments_1716263798",
"site": "science",
"id": "365350",
"found": true
},
"parent": 364990,
"imgSizes": {
"twentyfourteen-full-width": {
"file": "https://ww2.kqed.org/app/uploads/sites/35/2015/11/3254475503_19a31aff6c_o-1038x576.jpg",
"width": 1038,
"mimeType": "image/jpeg",
"height": 576
},
"thumbnail": {
"file": "https://ww2.kqed.org/app/uploads/sites/35/2015/11/3254475503_19a31aff6c_o-400x300.jpg",
"width": 400,
"mimeType": "image/jpeg",
"height": 300
},
"fd-sm": {
"file": "https://ww2.kqed.org/app/uploads/sites/35/2015/11/3254475503_19a31aff6c_o-960x720.jpg",
"width": 960,
"mimeType": "image/jpeg",
"height": 720
},
"post-thumbnail": {
"file": "https://ww2.kqed.org/app/uploads/sites/35/2015/11/3254475503_19a31aff6c_o-672x372.jpg",
"width": 672,
"mimeType": "image/jpeg",
"height": 372
},
"kqedFullSize": {
"file": "https://ww2.kqed.org/app/uploads/sites/35/2015/11/3254475503_19a31aff6c_o.jpg",
"width": 2592,
"height": 1944
},
"large": {
"file": "https://ww2.kqed.org/app/uploads/sites/35/2015/11/3254475503_19a31aff6c_o-1440x1080.jpg",
"width": 1440,
"mimeType": "image/jpeg",
"height": 1080
},
"guest-author-96": {
"file": "https://ww2.kqed.org/app/uploads/sites/35/2015/11/3254475503_19a31aff6c_o-96x96.jpg",
"width": 96,
"mimeType": "image/jpeg",
"height": 96
},
"medium": {
"file": "https://ww2.kqed.org/app/uploads/sites/35/2015/11/3254475503_19a31aff6c_o-800x600.jpg",
"width": 800,
"mimeType": "image/jpeg",
"height": 600
},
"guest-author-64": {
"file": "https://ww2.kqed.org/app/uploads/sites/35/2015/11/3254475503_19a31aff6c_o-64x64.jpg",
"width": 64,
"mimeType": "image/jpeg",
"height": 64
},
"guest-author-32": {
"file": "https://ww2.kqed.org/app/uploads/sites/35/2015/11/3254475503_19a31aff6c_o-32x32.jpg",
"width": 32,
"mimeType": "image/jpeg",
"height": 32
},
"fd-lrg": {
"file": "https://ww2.kqed.org/app/uploads/sites/35/2015/11/3254475503_19a31aff6c_o-1920x1440.jpg",
"width": 1920,
"mimeType": "image/jpeg",
"height": 1440
},
"fd-med": {
"file": "https://ww2.kqed.org/app/uploads/sites/35/2015/11/3254475503_19a31aff6c_o-1180x885.jpg",
"width": 1180,
"mimeType": "image/jpeg",
"height": 885
},
"detail": {
"file": "https://ww2.kqed.org/app/uploads/sites/35/2015/11/3254475503_19a31aff6c_o-75x75.jpg",
"width": 75,
"mimeType": "image/jpeg",
"height": 75
},
"guest-author-128": {
"file": "https://ww2.kqed.org/app/uploads/sites/35/2015/11/3254475503_19a31aff6c_o-128x128.jpg",
"width": 128,
"mimeType": "image/jpeg",
"height": 128
}
},
"publishDate": 1447888933,
"modified": 1447889111,
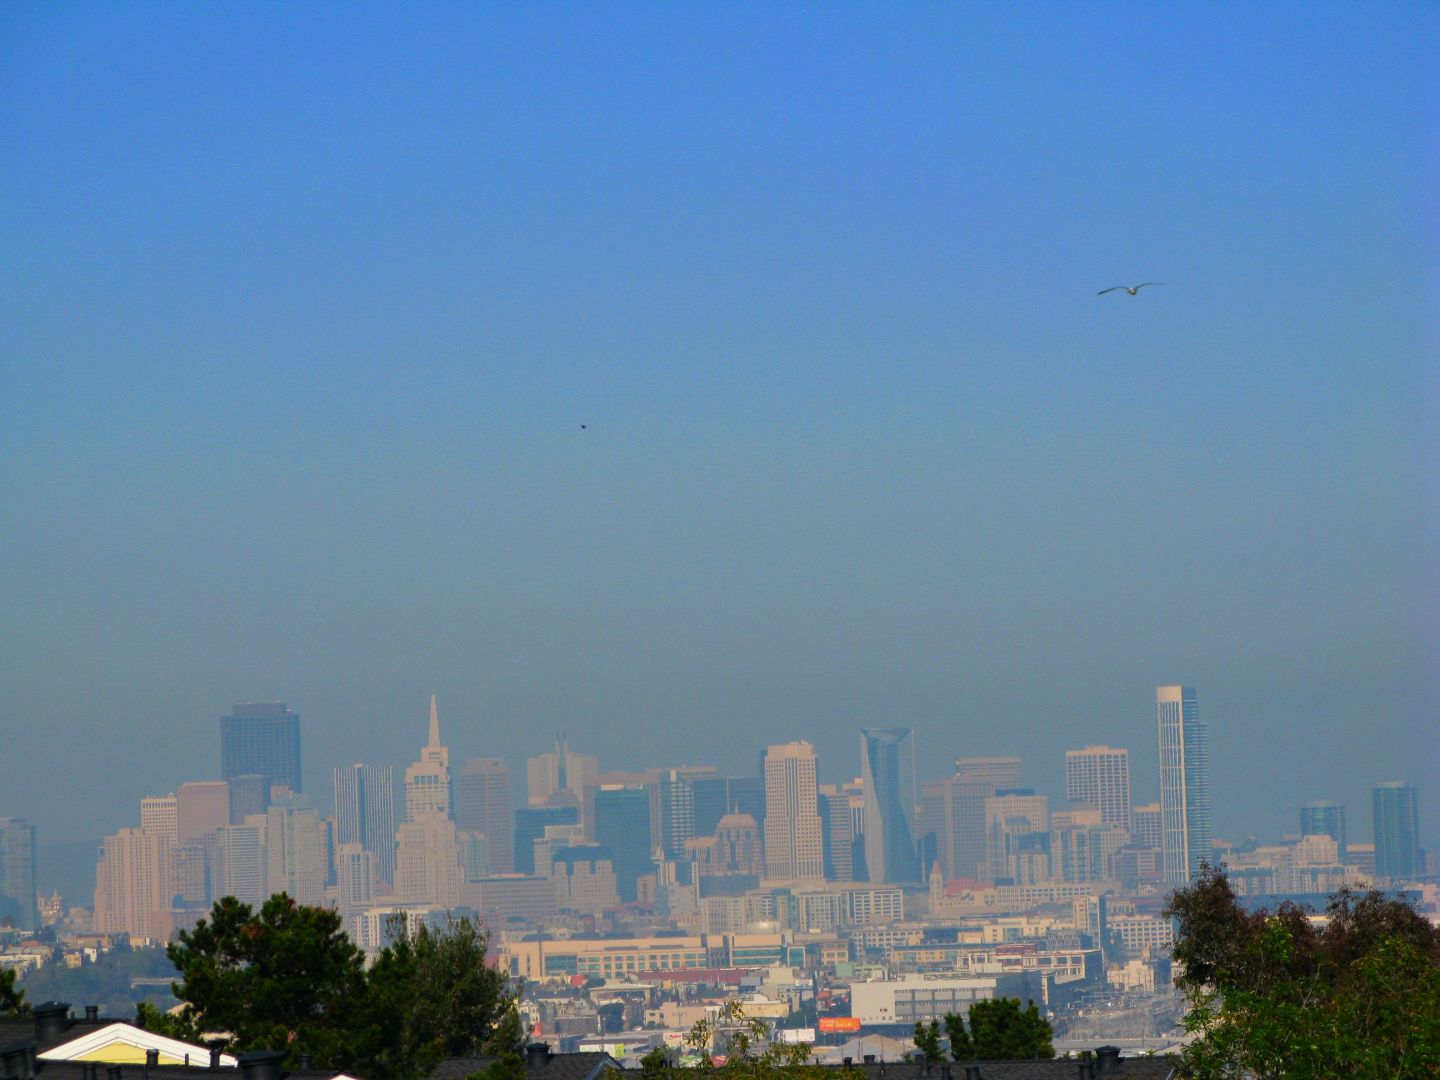
"caption": "Smog over downtown San Francisco, February 2009.",
"description": "Smog over downtown San Francisco, February 2009.",
"title": "Smog",
"credit": "Jerome Paz/flickr Creative Commons",
"status": "inherit",
"isLoading": false,
"fetchFailed": false
},
"science_357088": {
"type": "attachments",
"id": "science_357088",
"meta": {
"index": "attachments_1716263798",
"site": "science",
"id": "357088",
"found": true
},
"parent": 355510,
"imgSizes": {
"twentyfourteen-full-width": {
"file": "https://ww2.kqed.org/app/uploads/sites/35/2015/11/brown-modi-web-1038x576.jpg",
"width": 1038,
"mimeType": "image/jpeg",
"height": 576
},
"thumbnail": {
"file": "https://ww2.kqed.org/app/uploads/sites/35/2015/11/brown-modi-web-400x227.jpg",
"width": 400,
"mimeType": "image/jpeg",
"height": 227
},
"fd-sm": {
"file": "https://ww2.kqed.org/app/uploads/sites/35/2015/11/brown-modi-web-960x545.jpg",
"width": 960,
"mimeType": "image/jpeg",
"height": 545
},
"post-thumbnail": {
"file": "https://ww2.kqed.org/app/uploads/sites/35/2015/11/brown-modi-web-672x372.jpg",
"width": 672,
"mimeType": "image/jpeg",
"height": 372
},
"kqedFullSize": {
"file": "https://ww2.kqed.org/app/uploads/sites/35/2015/11/brown-modi-web.jpg",
"width": 1920,
"height": 1090
},
"large": {
"file": "https://ww2.kqed.org/app/uploads/sites/35/2015/11/brown-modi-web-1440x818.jpg",
"width": 1440,
"mimeType": "image/jpeg",
"height": 818
},
"guest-author-96": {
"file": "https://ww2.kqed.org/app/uploads/sites/35/2015/11/brown-modi-web-96x96.jpg",
"width": 96,
"mimeType": "image/jpeg",
"height": 96
},
"medium": {
"file": "https://ww2.kqed.org/app/uploads/sites/35/2015/11/brown-modi-web-800x454.jpg",
"width": 800,
"mimeType": "image/jpeg",
"height": 454
},
"guest-author-64": {
"file": "https://ww2.kqed.org/app/uploads/sites/35/2015/11/brown-modi-web-64x64.jpg",
"width": 64,
"mimeType": "image/jpeg",
"height": 64
},
"guest-author-32": {
"file": "https://ww2.kqed.org/app/uploads/sites/35/2015/11/brown-modi-web-32x32.jpg",
"width": 32,
"mimeType": "image/jpeg",
"height": 32
},
"fd-lrg": {
"file": "https://ww2.kqed.org/app/uploads/sites/35/2015/11/brown-modi-web-1920x1090.jpg",
"width": 1920,
"mimeType": "image/jpeg",
"height": 1090
},
"fd-med": {
"file": "https://ww2.kqed.org/app/uploads/sites/35/2015/11/brown-modi-web-1180x670.jpg",
"width": 1180,
"mimeType": "image/jpeg",
"height": 670
},
"detail": {
"file": "https://ww2.kqed.org/app/uploads/sites/35/2015/11/brown-modi-web-75x75.jpg",
"width": 75,
"mimeType": "image/jpeg",
"height": 75
},
"guest-author-128": {
"file": "https://ww2.kqed.org/app/uploads/sites/35/2015/11/brown-modi-web-128x128.jpg",
"width": 128,
"mimeType": "image/jpeg",
"height": 128
}
},
"publishDate": 1447457346,
"modified": 1447457419,
"caption": "Governor Jerry Brown talks climate change with Prime Minister of India Narendra Modi in September.",
"description": null,
"title": "brown-modi-web",
"credit": "Joe McHugh, California Highway Patrol",
"status": "inherit",
"isLoading": false,
"fetchFailed": false
},
"science_341359": {
"type": "attachments",
"id": "science_341359",
"meta": {
"index": "attachments_1716263798",
"site": "science",
"id": "341359",
"found": true
},
"parent": 0,
"imgSizes": {
"thumbnail": {
"file": "https://ww2.kqed.org/app/uploads/sites/35/2015/11/5984807021_bcae4c8f4e_o-400x241.jpg",
"width": 400,
"mimeType": "image/jpeg",
"height": 241
},
"post-thumbnail": {
"file": "https://ww2.kqed.org/app/uploads/sites/35/2015/11/5984807021_bcae4c8f4e_o-672x372.jpg",
"width": 672,
"mimeType": "image/jpeg",
"height": 372
},
"kqedFullSize": {
"file": "https://ww2.kqed.org/app/uploads/sites/35/2015/11/5984807021_bcae4c8f4e_o.jpg",
"width": 878,
"height": 529
},
"guest-author-96": {
"file": "https://ww2.kqed.org/app/uploads/sites/35/2015/11/5984807021_bcae4c8f4e_o-96x96.jpg",
"width": 96,
"mimeType": "image/jpeg",
"height": 96
},
"medium": {
"file": "https://ww2.kqed.org/app/uploads/sites/35/2015/11/5984807021_bcae4c8f4e_o-800x482.jpg",
"width": 800,
"mimeType": "image/jpeg",
"height": 482
},
"guest-author-64": {
"file": "https://ww2.kqed.org/app/uploads/sites/35/2015/11/5984807021_bcae4c8f4e_o-64x64.jpg",
"width": 64,
"mimeType": "image/jpeg",
"height": 64
},
"detail": {
"file": "https://ww2.kqed.org/app/uploads/sites/35/2015/11/5984807021_bcae4c8f4e_o-75x75.jpg",
"width": 75,
"mimeType": "image/jpeg",
"height": 75
},
"guest-author-32": {
"file": "https://ww2.kqed.org/app/uploads/sites/35/2015/11/5984807021_bcae4c8f4e_o-32x32.jpg",
"width": 32,
"mimeType": "image/jpeg",
"height": 32
},
"guest-author-128": {
"file": "https://ww2.kqed.org/app/uploads/sites/35/2015/11/5984807021_bcae4c8f4e_o-128x128.jpg",
"width": 128,
"mimeType": "image/jpeg",
"height": 128
}
},
"publishDate": 1446676229,
"modified": 1446676530,
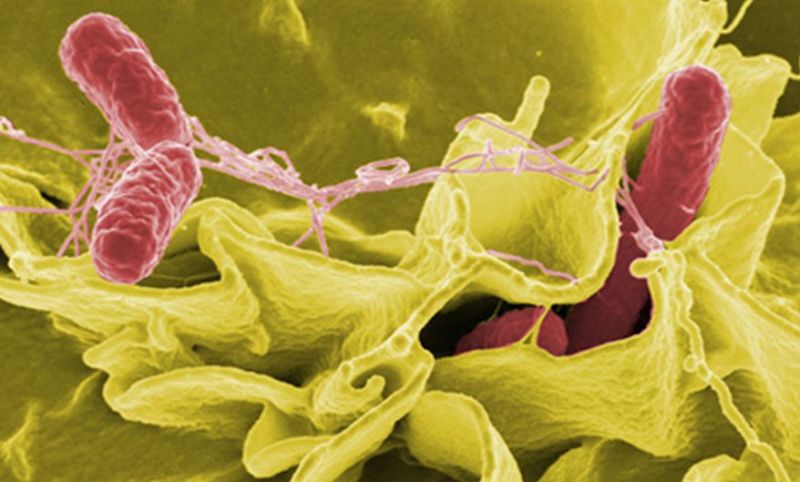
"caption": "Salmonella invade cultured human cells.",
"description": null,
"title": "microbes",
"credit": "Rocky Mountain Laboratories/NIAID/NIH",
"status": "inherit",
"isLoading": false,
"fetchFailed": false
},
"science_10732": {
"type": "attachments",
"id": "science_10732",
"meta": {
"index": "attachments_1716263798",
"site": "science",
"id": "10732",
"found": true
},
"parent": 10727,
"imgSizes": {
"kqedFullSize": {
"file": "https://ww2.kqed.org/app/uploads/sites/35/2013/11/RS696_Download090427-061-scr.jpg",
"width": 850,
"height": 638
}
},
"publishDate": 1383701736,
"modified": 1443633742,
"caption": "Calif. lawmakers halted a bill that would have mandated deep greenhouse gas emissions cuts by the year 2050.",
"description": "California's climate change policies are cutting emissions, but not enough, according to a report from Berkeley Lab. (Craig Miller/KQED)",
"title": "RS696_Download090427 061-scr",
"credit": "Craig Miller/KQED",
"status": "inherit",
"isLoading": false,
"fetchFailed": false
},
"science_186675": {
"type": "attachments",
"id": "science_186675",
"meta": {
"index": "attachments_1716263798",
"site": "science",
"id": "186675",
"found": true
},
"parent": 185601,
"imgSizes": {
"twentyfourteen-full-width": {
"file": "https://ww2.kqed.org/app/uploads/sites/35/2015/08/sunspots-NASA-1038x576.jpg",
"width": 1038,
"mimeType": "image/jpeg",
"height": 576
},
"thumbnail": {
"file": "https://ww2.kqed.org/app/uploads/sites/35/2015/08/sunspots-NASA-400x225.jpg",
"width": 400,
"mimeType": "image/jpeg",
"height": 225
},
"fd-sm": {
"file": "https://ww2.kqed.org/app/uploads/sites/35/2015/08/sunspots-NASA-960x540.jpg",
"width": 960,
"mimeType": "image/jpeg",
"height": 540
},
"post-thumbnail": {
"file": "https://ww2.kqed.org/app/uploads/sites/35/2015/08/sunspots-NASA-672x372.jpg",
"width": 672,
"mimeType": "image/jpeg",
"height": 372
},
"kqedFullSize": {
"file": "https://ww2.kqed.org/app/uploads/sites/35/2015/08/sunspots-NASA.jpg",
"width": 1404,
"height": 790
},
"fd-med": {
"file": "https://ww2.kqed.org/app/uploads/sites/35/2015/08/sunspots-NASA-1180x664.jpg",
"width": 1180,
"mimeType": "image/jpeg",
"height": 664
},
"guest-author-96": {
"file": "https://ww2.kqed.org/app/uploads/sites/35/2015/08/sunspots-NASA-96x96.jpg",
"width": 96,
"mimeType": "image/jpeg",
"height": 96
},
"medium": {
"file": "https://ww2.kqed.org/app/uploads/sites/35/2015/08/sunspots-NASA-800x450.jpg",
"width": 800,
"mimeType": "image/jpeg",
"height": 450
},
"guest-author-64": {
"file": "https://ww2.kqed.org/app/uploads/sites/35/2015/08/sunspots-NASA-64x64.jpg",
"width": 64,
"mimeType": "image/jpeg",
"height": 64
},
"detail": {
"file": "https://ww2.kqed.org/app/uploads/sites/35/2015/08/sunspots-NASA-75x75.jpg",
"width": 75,
"mimeType": "image/jpeg",
"height": 75
},
"guest-author-32": {
"file": "https://ww2.kqed.org/app/uploads/sites/35/2015/08/sunspots-NASA-32x32.jpg",
"width": 32,
"mimeType": "image/jpeg",
"height": 32
},
"guest-author-128": {
"file": "https://ww2.kqed.org/app/uploads/sites/35/2015/08/sunspots-NASA-128x128.jpg",
"width": 128,
"mimeType": "image/jpeg",
"height": 128
}
},
"publishDate": 1439436702,
"modified": 1439583418,
"caption": "This groups of sunspots was photographed on July 10, 2012. The largest spot is 11 times the size of Earth.",
"description": null,
"title": "sunspots-NASA",
"credit": "Alan Friedman/NASA",
"status": "inherit",
"isLoading": false,
"fetchFailed": false
},
"science_152115": {
"type": "attachments",
"id": "science_152115",
"meta": {
"index": "attachments_1716263798",
"site": "science",
"id": "152115",
"found": true
},
"parent": 151663,
"imgSizes": {
"twentyfourteen-full-width": {
"file": "https://ww2.kqed.org/app/uploads/sites/35/2015/07/RS15374_GettyImages-475039512-qut-1038x576.jpg",
"width": 1038,
"mimeType": "image/jpeg",
"height": 576
},
"thumbnail": {
"file": "https://ww2.kqed.org/app/uploads/sites/35/2015/07/RS15374_GettyImages-475039512-qut-400x276.jpg",
"width": 400,
"mimeType": "image/jpeg",
"height": 276
},
"fd-sm": {
"file": "https://ww2.kqed.org/app/uploads/sites/35/2015/07/RS15374_GettyImages-475039512-qut-960x663.jpg",
"width": 960,
"mimeType": "image/jpeg",
"height": 663
},
"post-thumbnail": {
"file": "https://ww2.kqed.org/app/uploads/sites/35/2015/07/RS15374_GettyImages-475039512-qut-672x372.jpg",
"width": 672,
"mimeType": "image/jpeg",
"height": 372
},
"kqedFullSize": {
"file": "https://ww2.kqed.org/app/uploads/sites/35/2015/07/RS15374_GettyImages-475039512-qut.jpg",
"width": 1920,
"height": 1325
},
"large": {
"file": "https://ww2.kqed.org/app/uploads/sites/35/2015/07/RS15374_GettyImages-475039512-qut-1440x994.jpg",
"width": 1440,
"mimeType": "image/jpeg",
"height": 994
},
"guest-author-96": {
"file": "https://ww2.kqed.org/app/uploads/sites/35/2015/07/RS15374_GettyImages-475039512-qut-96x96.jpg",
"width": 96,
"mimeType": "image/jpeg",
"height": 96
},
"medium": {
"file": "https://ww2.kqed.org/app/uploads/sites/35/2015/07/RS15374_GettyImages-475039512-qut-800x552.jpg",
"width": 800,
"mimeType": "image/jpeg",
"height": 552
},
"guest-author-64": {
"file": "https://ww2.kqed.org/app/uploads/sites/35/2015/07/RS15374_GettyImages-475039512-qut-64x64.jpg",
"width": 64,
"mimeType": "image/jpeg",
"height": 64
},
"guest-author-32": {
"file": "https://ww2.kqed.org/app/uploads/sites/35/2015/07/RS15374_GettyImages-475039512-qut-32x32.jpg",
"width": 32,
"mimeType": "image/jpeg",
"height": 32
},
"fd-lrg": {
"file": "https://ww2.kqed.org/app/uploads/sites/35/2015/07/RS15374_GettyImages-475039512-qut-1920x1325.jpg",
"width": 1920,
"mimeType": "image/jpeg",
"height": 1325
},
"fd-med": {
"file": "https://ww2.kqed.org/app/uploads/sites/35/2015/07/RS15374_GettyImages-475039512-qut-1180x814.jpg",
"width": 1180,
"mimeType": "image/jpeg",
"height": 814
},
"detail": {
"file": "https://ww2.kqed.org/app/uploads/sites/35/2015/07/RS15374_GettyImages-475039512-qut-75x75.jpg",
"width": 75,
"mimeType": "image/jpeg",
"height": 75
},
"guest-author-128": {
"file": "https://ww2.kqed.org/app/uploads/sites/35/2015/07/RS15374_GettyImages-475039512-qut-128x128.jpg",
"width": 128,
"mimeType": "image/jpeg",
"height": 128
}
},
"publishDate": 1438216943,
"modified": 1438217083,
"caption": "Houseboats are moored on a shrinking arm of the Lake Oroville reservoir as it dropped below 25 percent capacity in May.",
"description": "Houseboats are moored on a shrinking arm of the Lake Oroville reservoir as it dropped below 25 percent capacity in May.",
"title": "RS15374_GettyImages-475039512-qut",
"credit": "Mark Ralston/AFP/Getty Images)",
"status": "inherit",
"isLoading": false,
"fetchFailed": false
},
"science_139914": {
"type": "attachments",
"id": "science_139914",
"meta": {
"index": "attachments_1716263798",
"site": "science",
"id": "139914",
"found": true
},
"parent": 139910,
"imgSizes": {
"twentyfourteen-full-width": {
"file": "https://ww2.kqed.org/app/uploads/sites/35/2015/07/leaf1-1038x576.jpg",
"width": 1038,
"mimeType": "image/jpeg",
"height": 576
},
"thumbnail": {
"file": "https://ww2.kqed.org/app/uploads/sites/35/2015/07/leaf1-400x225.jpg",
"width": 400,
"mimeType": "image/jpeg",
"height": 225
},
"fd-sm": {
"file": "https://ww2.kqed.org/app/uploads/sites/35/2015/07/leaf1-960x540.jpg",
"width": 960,
"mimeType": "image/jpeg",
"height": 540
},
"post-thumbnail": {
"file": "https://ww2.kqed.org/app/uploads/sites/35/2015/07/leaf1-672x372.jpg",
"width": 672,
"mimeType": "image/jpeg",
"height": 372
},
"kqedFullSize": {
"file": "https://ww2.kqed.org/app/uploads/sites/35/2015/07/leaf1.jpg",
"width": 1920,
"height": 1080
},
"large": {
"file": "https://ww2.kqed.org/app/uploads/sites/35/2015/07/leaf1-1440x810.jpg",
"width": 1440,
"mimeType": "image/jpeg",
"height": 810
},
"guest-author-96": {
"file": "https://ww2.kqed.org/app/uploads/sites/35/2015/07/leaf1-96x96.jpg",
"width": 96,
"mimeType": "image/jpeg",
"height": 96
},
"medium": {
"file": "https://ww2.kqed.org/app/uploads/sites/35/2015/07/leaf1-800x450.jpg",
"width": 800,
"mimeType": "image/jpeg",
"height": 450
},
"guest-author-64": {
"file": "https://ww2.kqed.org/app/uploads/sites/35/2015/07/leaf1-64x64.jpg",
"width": 64,
"mimeType": "image/jpeg",
"height": 64
},
"guest-author-32": {
"file": "https://ww2.kqed.org/app/uploads/sites/35/2015/07/leaf1-32x32.jpg",
"width": 32,
"mimeType": "image/jpeg",
"height": 32
},
"fd-lrg": {
"file": "https://ww2.kqed.org/app/uploads/sites/35/2015/07/leaf1-1400x788.jpg",
"width": 1400,
"mimeType": "image/jpeg",
"height": 788
},
"fd-med": {
"file": "https://ww2.kqed.org/app/uploads/sites/35/2015/07/leaf1-1180x664.jpg",
"width": 1180,
"mimeType": "image/jpeg",
"height": 664
},
"detail": {
"file": "https://ww2.kqed.org/app/uploads/sites/35/2015/07/leaf1-75x75.jpg",
"width": 75,
"mimeType": "image/jpeg",
"height": 75
},
"guest-author-128": {
"file": "https://ww2.kqed.org/app/uploads/sites/35/2015/07/leaf1-128x128.jpg",
"width": 128,
"mimeType": "image/jpeg",
"height": 128
}
},
"publishDate": 1437766908,
"modified": 1437767102,
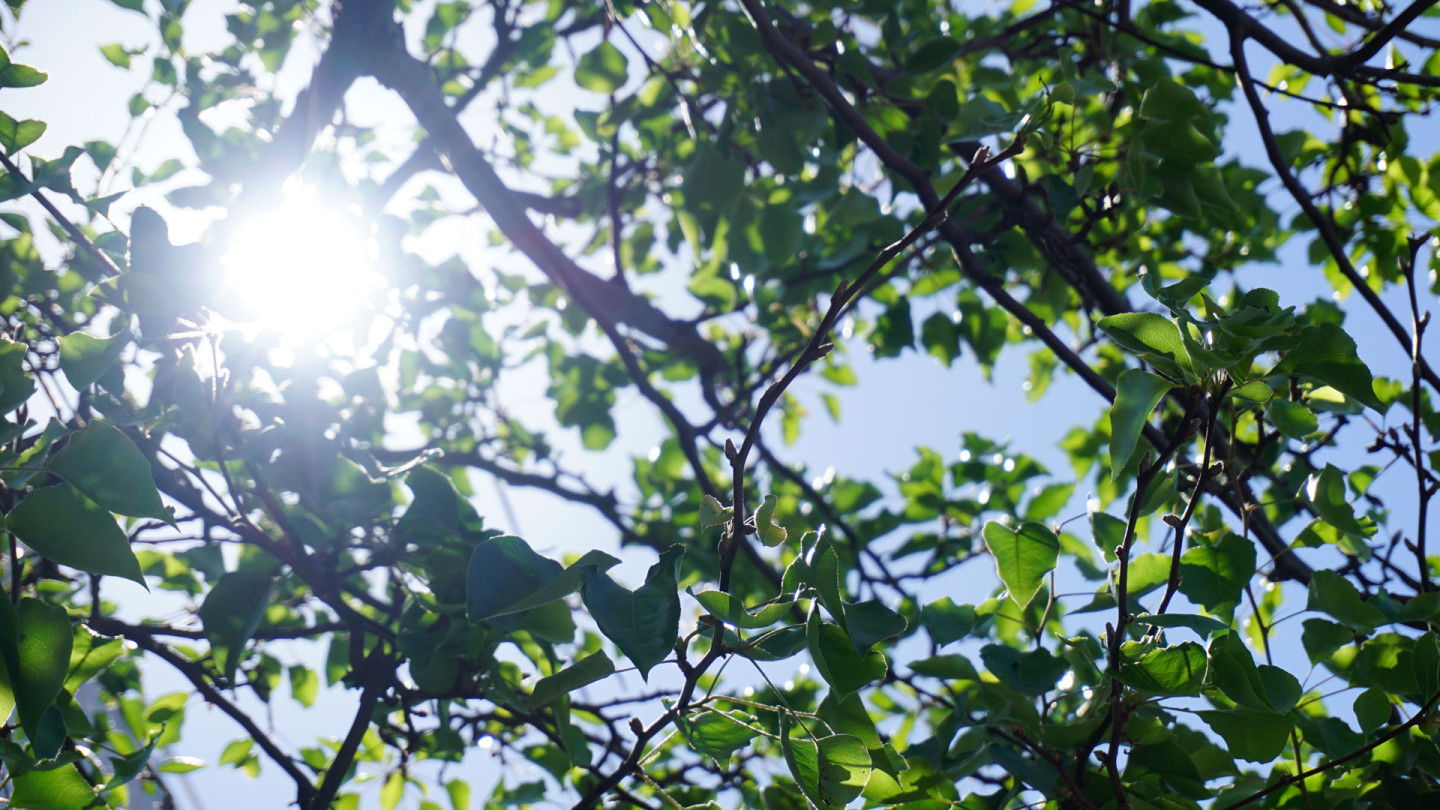
"caption": "Scientists are trying to create renewable fuels by copying what plants do.",
"description": null,
"title": "leaf1",
"credit": "Lauren Sommer/KQED",
"status": "inherit",
"isLoading": false,
"fetchFailed": false
},
"science_27644": {
"type": "attachments",
"id": "science_27644",
"meta": {
"index": "attachments_1716263798",
"site": "science",
"id": "27644",
"found": true
},
"parent": 27643,
"imgSizes": {
"kqedFullSize": {
"file": "https://ww2.kqed.org/app/uploads/sites/35/2015/02/CO2trends.png",
"width": 800,
"height": 450
}
},
"publishDate": 1424929672,
"modified": 1424929706,
"caption": "Eleven-year graphs of energy trapped in the atmosphere due to extra CO\u003csub>2\u003c/sub>, as observed at the Southern Great Plains (SGP) and North Slope Alaska (NSA) sites. The red line shows the CO\u003csub>2\u003c/sub> effect, the gray line shows the CO\u003csub>2\u003c/sub> concentrations, and the blue line shows the trend of the CO\u003csub>2\u003c/sub> effect (shading shows its formal uncertainty). From Figure 4 of Feldman et al.'s \u003ci>Nature\u003c/i> paper. (LBL/Nature)",
"description": null,
"title": "CO2trends",
"credit": null,
"status": "inherit",
"isLoading": false,
"fetchFailed": false
},
"science_27417": {
"type": "attachments",
"id": "science_27417",
"meta": {
"index": "attachments_1716263798",
"site": "science",
"id": "27417",
"found": true
},
"parent": 27409,
"imgSizes": {
"kqedFullSize": {
"file": "https://ww2.kqed.org/app/uploads/sites/35/2015/02/drought-e1424450367181.jpg",
"width": 638,
"height": 361
}
},
"publishDate": 1424450061,
"modified": 1424451441,
"caption": "Corn plants struggle to survive in a drought-stricken farm field near Oakton, Indiana. The corn and soybean belt in the middle of the nation is experiencing one of the worst droughts in more than five decades.\n(Scott Olson/Getty Images)",
"description": "OAKTON, IN - JULY 19: Corn plants struggle to survive in a drought-stricken farm field on July 19, 2012 near Oakton, Indiana. The corn and soybean belt in the middle of the nation is experiencing one of the worst droughts in more than five decades. Indiana was the nation's fourth largest corn producer in 2011. (Photo by Scott Olson/Getty Images)",
"title": "Severe Midwest Drought Continues",
"credit": null,
"status": "inherit",
"isLoading": false,
"fetchFailed": false
},
"science_27189": {
"type": "attachments",
"id": "science_27189",
"meta": {
"index": "attachments_1716263798",
"site": "science",
"id": "27189",
"found": true
},
"parent": 27188,
"imgSizes": {
"kqedFullSize": {
"file": "https://ww2.kqed.org/app/uploads/sites/35/2015/02/Ten-century-drought.png",
"width": 800,
"height": 450
}
},
"publishDate": 1423720451,
"modified": 1423720487,
"caption": "Drought conditions during the last thousand years (brown line), along with projected conditions for the rest of this century, point to unprecedented megadroughts. Details of this graph are shown below. (All images Cook/AAAS)",
"description": null,
"title": "Ten-century-drought",
"credit": null,
"status": "inherit",
"isLoading": false,
"fetchFailed": false
},
"science_26350": {
"type": "attachments",
"id": "science_26350",
"meta": {
"index": "attachments_1716263798",
"site": "science",
"id": "26350",
"found": true
},
"parent": 26347,
"imgSizes": {
"kqedFullSize": {
"file": "https://ww2.kqed.org/app/uploads/sites/35/2015/01/NOAA-image-e1421433001878.gif",
"width": 640,
"height": 342
}
},
"publishDate": 1421432110,
"modified": 1421432110,
"caption": null,
"description": null,
"title": "NOAA image",
"credit": null,
"status": "inherit",
"isLoading": false,
"fetchFailed": false
},
"science_26318": {
"type": "attachments",
"id": "science_26318",
"meta": {
"index": "attachments_1716263798",
"site": "science",
"id": "26318",
"found": true
},
"parent": 26317,
"imgSizes": {
"kqedFullSize": {
"file": "https://ww2.kqed.org/app/uploads/sites/35/2015/01/SF-tide-gauges.jpg",
"width": 800,
"height": 450
}
},
"publishDate": 1421351688,
"modified": 1421351729,
"caption": "Sea level is the result of a complex set of forces and influences on land, on the seafloor and in the water between them. Estimating sea-level rise from imperfect data is a scientific challenge that may progress through more sophisticated statistics. (\u003ca href=\"https://www.flickr.com/photos/daver6/\">Dave R\u003c/a>/\u003ca href=\"https://creativecommons.org/licenses/by-nc/2.0/\">CC-BY-NC\u003c/a>)",
"description": null,
"title": "SF-tide-gauges",
"credit": null,
"status": "inherit",
"isLoading": false,
"fetchFailed": false
}
},
"audioPlayerReducer": {
"postId": "stream_live",
"isPaused": true,
"isPlaying": false,
"pfsActive": false,
"pledgeModalIsOpen": true,
"playerDrawerIsOpen": false,
"liveAudioPlayStartedAt": 0,
"liveAudioPlayContext": ""
},
"authorsReducer": {
"byline_science_284657": {
"type": "authors",
"id": "byline_science_284657",
"meta": {
"override": true
},
"slug": "byline_science_284657",
"name": "Kate Galbraith\u003cbr>CALmatters",
"isLoading": false
},
"cmiller": {
"type": "authors",
"id": "221",
"meta": {
"index": "authors_1716337520",
"id": "221",
"found": true
},
"name": "Craig Miller",
"firstName": "Craig",
"lastName": "Miller",
"slug": "cmiller",
"email": "craig@voxterra.net",
"display_author_email": false,
"staff_mastheads": [
"science"
],
"title": "Editor Emeritus, Science",
"bio": "Craig is a former KQED Science editor, specializing in weather, climate, water & energy issues, with a little seismology thrown in just to shake things up. Prior to that, he launched and led the station's award-winning multimedia project, Climate Watch. Craig is also an accomplished writer/producer of television documentaries, with a focus on natural resource issues.",
"avatar": "https://secure.gravatar.com/avatar/b91661df645e001a9cafe0861fa685f9?s=600&d=blank&r=g",
"twitter": "voxterra",
"facebook": null,
"instagram": null,
"linkedin": null,
"sites": [
{
"site": "news",
"roles": [
"author"
]
},
{
"site": "futureofyou",
"roles": [
"editor"
]
},
{
"site": "stateofhealth",
"roles": [
"author"
]
},
{
"site": "science",
"roles": [
"editor"
]
},
{
"site": "quest",
"roles": [
"editor"
]
}
],
"headData": {
"title": "Craig Miller | KQED",
"description": "Editor Emeritus, Science",
"ogImgSrc": "https://secure.gravatar.com/avatar/b91661df645e001a9cafe0861fa685f9?s=600&d=blank&r=g",
"twImgSrc": "https://secure.gravatar.com/avatar/b91661df645e001a9cafe0861fa685f9?s=600&d=blank&r=g"
},
"isLoading": false,
"link": "/author/cmiller"
},
"laurensommer": {
"type": "authors",
"id": "239",
"meta": {
"index": "authors_1716337520",
"id": "239",
"found": true
},
"name": "Lauren Sommer",
"firstName": "Lauren",
"lastName": "Sommer",
"slug": "laurensommer",
"email": "lsommer@kqed.org",
"display_author_email": false,
"staff_mastheads": [],
"title": "KQED Contributor",
"bio": "Lauren is a radio reporter formerly covering environment, water, and energy for KQED Science. As part of her day job, she has scaled Sierra Nevada peaks, run from charging elephant seals, and desperately tried to get her sea legs - all in pursuit of good radio. Her work has appeared on Marketplace, Living on Earth, Science Friday and NPR's Morning Edition and All Things Considered. You can find her on Twitter at \u003ca href=\"https://twitter.com/lesommer\">@lesommer\u003c/a>.",
"avatar": "https://secure.gravatar.com/avatar/33aa3772bb86c6ad45b8aca6a238bbdf?s=600&d=blank&r=g",
"twitter": null,
"facebook": null,
"instagram": null,
"linkedin": null,
"sites": [
{
"site": "news",
"roles": [
"author"
]
},
{
"site": "science",
"roles": [
"editor",
"manage_content_types",
"manage_taxonomies"
]
},
{
"site": "quest",
"roles": [
"editor"
]
}
],
"headData": {
"title": "Lauren Sommer | KQED",
"description": "KQED Contributor",
"ogImgSrc": "https://secure.gravatar.com/avatar/33aa3772bb86c6ad45b8aca6a238bbdf?s=600&d=blank&r=g",
"twImgSrc": "https://secure.gravatar.com/avatar/33aa3772bb86c6ad45b8aca6a238bbdf?s=600&d=blank&r=g"
},
"isLoading": false,
"link": "/author/laurensommer"
},
"andrew-alden": {
"type": "authors",
"id": "6228",
"meta": {
"index": "authors_1716337520",
"id": "6228",
"found": true
},
"name": "Andrew Alden",
"firstName": "Andrew",
"lastName": "Alden",
"slug": "andrew-alden",
"email": "alden@andrew-alden.com",
"display_author_email": false,
"staff_mastheads": [],
"title": null,
"bio": "Andrew Alden earned his geology degree at the University of New Hampshire and moved back to the Bay Area to work at the U.S. Geological Survey for six years. He has \u003ca href=\"http://geology.about.com/\">written on geology for About.com\u003c/a> since its founding in 1997. In 2007, he started the Oakland Geology blog, which won recognition as \"Best of the East Bay\" from the \u003ci>East Bay Express\u003c/i> in 2010. In writing about geology in the Bay Area and surroundings, he hopes to share some of the useful and pleasurable insights that geologists give us—not just facts about the deep past, but an attitude that might be called the \u003ci>deep present\u003c/i>.\r\n\r\nRead his \u003ca href=\"http://science.kqed.org/quest/author/andrew-alden/\">previous contributions\u003c/a> to \u003ca href=\"http://http://science.kqed.org/quest/\">QUEST\u003c/a>, a project dedicated to exploring the Science of Sustainability.",
"avatar": "https://secure.gravatar.com/avatar/9eaa0afc32f98c5fc7ce634437334a64?s=600&d=blank&r=g",
"twitter": null,
"facebook": null,
"instagram": null,
"linkedin": null,
"sites": [
{
"site": "science",
"roles": [
"author"
]
},
{
"site": "quest",
"roles": [
"subscriber"
]
}
],
"headData": {
"title": "Andrew Alden | KQED",
"description": null,
"ogImgSrc": "https://secure.gravatar.com/avatar/9eaa0afc32f98c5fc7ce634437334a64?s=600&d=blank&r=g",
"twImgSrc": "https://secure.gravatar.com/avatar/9eaa0afc32f98c5fc7ce634437334a64?s=600&d=blank&r=g"
},
"isLoading": false,
"link": "/author/andrew-alden"
},
"kqedscience": {
"type": "authors",
"id": "6387",
"meta": {
"index": "authors_1716337520",
"id": "6387",
"found": true
},
"name": "KQED Science",
"firstName": "KQED",
"lastName": "Science",
"slug": "kqedscience",
"email": "kqedscience@gmail.com",
"display_author_email": false,
"staff_mastheads": [],
"title": null,
"bio": "KQED Science brings you award-winning science and environment coverage from the Bay Area and beyond by the flagship Northern California PBS and NPR affiliate.",
"avatar": "https://secure.gravatar.com/avatar/5a295ff49cf82a8c0f30937d3f788b2f?s=600&d=blank&r=g",
"twitter": null,
"facebook": null,
"instagram": null,
"linkedin": null,
"sites": [
{
"site": "science",
"roles": [
"contributor"
]
},
{
"site": "quest",
"roles": [
"editor"
]
},
{
"site": "food",
"roles": [
"contributor"
]
}
],
"headData": {
"title": "KQED Science | KQED",
"description": null,
"ogImgSrc": "https://secure.gravatar.com/avatar/5a295ff49cf82a8c0f30937d3f788b2f?s=600&d=blank&r=g",
"twImgSrc": "https://secure.gravatar.com/avatar/5a295ff49cf82a8c0f30937d3f788b2f?s=600&d=blank&r=g"
},
"isLoading": false,
"link": "/author/kqedscience"
}
},
"pagesReducer": {
"science_tag_climate-change": {
"type": "terms",
"id": "science_194",
"meta": {
"index": "terms_1716263798",
"site": "science",
"id": "194",
"score": 7.946677
},
"featImg": null,
"name": "climate change",
"description": null,
"taxonomy": "tag",
"headData": {
"twImgId": null,
"twTitle": null,
"ogTitle": null,
"ogImgId": null,
"twDescription": null,
"description": null,
"title": "climate change Archives | KQED Science",
"ogDescription": null
},
"ttid": 198,
"slug": "climate-change",
"isLoading": false,
"title": "climate change",
"pageMeta": {
"site": "science",
"WpPageTemplate": "page-topic-editorial",
"currentPage": 51
},
"blocks": [
{
"blockName": "kqed/post-list",
"attrs": {
"layout": "cardArticle2",
"query": "posts/science?tag=climate-change",
"seeMore": false,
"paginated": true,
"page": 51
}
},
{
"blockName": "kqed/ad"
}
]
}
},
"pfsSessionReducer": {},
"postsReducer": {
"stream_live": {
"type": "live",
"id": "stream_live",
"audioUrl": "https://streams.kqed.org/kqedradio",
"title": "Live Stream",
"excerpt": "Live Stream information currently unavailable.",
"link": "/radio",
"featImg": "",
"label": {
"name": "KQED Live",
"link": "/"
}
},
"stream_kqedNewscast": {
"type": "posts",
"id": "stream_kqedNewscast",
"audioUrl": "https://www.kqed.org/.stream/anon/radio/RDnews/newscast.mp3?_=1",
"title": "KQED Newscast",
"featImg": "",
"label": {
"name": "88.5 FM",
"link": "/"
}
},
"science_364990": {
"type": "posts",
"id": "science_364990",
"meta": {
"index": "posts_1716263798",
"site": "science",
"id": "364990",
"score": null,
"sort": [
1447948596000
]
},
"parent": 0,
"labelTerm": {
"site": "science"
},
"blocks": [],
"publishDate": 1447948596,
"format": "standard",
"title": "CO2: Earth Passes Into 'Uncharted Territory'",
"headTitle": "CO2: Earth Passes Into ‘Uncharted Territory’ | KQED",
"content": "\u003cp>This week, \u003ca href=\"https://scripps.ucsd.edu/programs/keelingcurve/\" target=\"_blank\" rel=\"noopener\">you can watch\u003c/a> as Earth passes a threshold not seen for at least a million years. The concentration of carbon dioxide in the air will rise above 400 parts per million. And scientists predict neither you nor your children will ever see it go below 400 ppm again.\u003c/p>\n\u003cp>The World Meteorological Organization (WMO) said on Monday that this year’s El Niño combined with global warming puts the world “\u003ca href=\"https://www.wmo.int/media/content/el-ni%C3%B1o-expected-strengthen-further-high-impacts-unprecedented-preparation\" target=\"_blank\" rel=\"noopener\">in uncharted territory\u003c/a>.”\u003c/p>\n\u003cp>“This naturally occurring El Niño event and human induced climate change may interact and modify each other in ways which we have \u003ca href=\"https://www.wmo.int/media/content/weather-reports-future-0\" target=\"_blank\" rel=\"noopener\">never before experienced\u003c/a>,” said WMO Secretary-General Michel Jarraud.\u003c/p>\n\u003cp>\u003cstrong>‘An Icon of Climate Change’\u003c/strong>\u003c/p>\n\u003cp>When scientists talk about atmospheric CO\u003csub>2\u003c/sub>, their yardstick is the so-called Keeling curve. It’s the record of the air’s composition, made each day at a station run by the \u003ca href=\"http://scrippsco2.ucsd.edu/\" target=\"_blank\" rel=\"noopener\">Scripps Institution of Oceanography\u003c/a> in the pure air high on Mauna Loa volcano, in Hawaii.\u003c/p>\n\u003cfigure id=\"attachment_364994\" class=\"wp-caption alignright\" style=\"max-width: 800px\">\u003ca href=\"http://ww2.kqed.org/science/wp-content/uploads/sites/35/2015/11/CO2-this-week.png\">\u003cimg loading=\"lazy\" decoding=\"async\" class=\"size-medium wp-image-364994\" src=\"http://ww2.kqed.org/science/wp-content/uploads/sites/35/2015/11/CO2-this-week-800x480.png\" alt=\"CO2 at Mauna Loa this week\" width=\"800\" height=\"480\" srcset=\"https://cdn.kqed.org/wp-content/uploads/sites/35/2015/11/CO2-this-week-800x480.png 800w, https://cdn.kqed.org/wp-content/uploads/sites/35/2015/11/CO2-this-week-400x240.png 400w, https://cdn.kqed.org/wp-content/uploads/sites/35/2015/11/CO2-this-week-960x576.png 960w, https://cdn.kqed.org/wp-content/uploads/sites/35/2015/11/CO2-this-week.png 1000w\" sizes=\"(max-width: 800px) 100vw, 800px\">\u003c/a>\u003cfigcaption class=\"wp-caption-text\">This week’s carbon dioxide readings at the Mauna Loa Observatory are updated every day. As they rise above the 400 parts-per-million threshold, scientists warn that they will not return to it in our lifetimes. \u003ccite>(Scripps/UC San Diego)\u003c/cite>\u003c/figcaption>\u003c/figure>\n\u003cp>Ralph Keeling, the custodian of the CO\u003csub>2\u003c/sub> record, made his prediction last week in \u003ca href=\"https://scripps.ucsd.edu/programs/keelingcurve/2015/10/21/is-this-the-last-year-below-400/\" target=\"_blank\" rel=\"noopener\">a blog post on the Keeling Curve website\u003c/a>.\u003c/p>\n\u003cp>[ad fullwidth]\u003c/p>\n\u003cp>The Keeling curve was started in 1958 under the direction of Keeling’s father, Charles David “Dave” Keeling. Today it’s the longest series of such measurements in the world. It was named a \u003ca href=\"http://www.acs.org/content/acs/en/education/whatischemistry/landmarks/landmarksdirectory.html\" target=\"_blank\" rel=\"noopener\">National Historic Chemical Landmark\u003c/a> this year.\u003c/p>\n\u003cp>The Keeling curve is an icon of climate change. What does it show?\u003c/p>\n\u003cp>In the 1960s, Dave Keeling’s measurements showed that the CO\u003csub>2\u003c/sub> level in the air was rising steadily. That long-term increase is the mark of human influence. It comes overwhelmingly \u003ca href=\"http://www.esrl.noaa.gov/gmd/ccgg/trends/ff.html\" target=\"_blank\" rel=\"noopener\">from the fossil fuels we burn\u003c/a> — largely to generate electricity, but also to smelt metals, produce cement, run motors and so on. Other smaller sources of CO\u003csub>2\u003c/sub> are from humans cutting down forests and from large-scale mechanical farming, which removes most of the carbon-rich humus contained in soil.\u003c/p>\n\u003cp>Since the 1960s, the long-term increase in CO\u003csub>2\u003c/sub> has sped up. A little over half of the CO\u003csub>2\u003c/sub> we produce is absorbed by the ocean and by growing plants. The rest stays in the air and acts as a greenhouse gas.\u003c/p>\n\u003cfigure id=\"attachment_365502\" class=\"wp-caption alignright\" style=\"max-width: 640px\">\u003ca href=\"http://ww2.kqed.org/science/wp-content/uploads/sites/35/2015/11/mauna-loa2.jpg\">\u003cimg loading=\"lazy\" decoding=\"async\" class=\"size-full wp-image-365502\" src=\"http://ww2.kqed.org/science/wp-content/uploads/sites/35/2015/11/mauna-loa2.jpg\" alt=\"NOAA's Mauna Loa Observatory on Hawaii, a small collection of buildings where scientists take key measurements on air and sunlight.\" width=\"640\" height=\"480\" srcset=\"https://cdn.kqed.org/wp-content/uploads/sites/35/2015/11/mauna-loa2.jpg 640w, https://cdn.kqed.org/wp-content/uploads/sites/35/2015/11/mauna-loa2-400x300.jpg 400w\" sizes=\"(max-width: 640px) 100vw, 640px\">\u003c/a>\u003cfigcaption class=\"wp-caption-text\">NOAA’s Mauna Loa Observatory on Hawaii, a small collection of buildings where scientists take key measurements on air and sunlight. \u003ccite>(NOAA)\u003c/cite>\u003c/figcaption>\u003c/figure>\n\u003cp>If CO\u003csub>2\u003c/sub> weren’t a greenhouse gas, we might welcome it for promoting plant growth. But because it is one, higher CO\u003csub>2\u003c/sub> levels will make Earth steadily warmer until either human ingenuity or geology can bring them back down.\u003c/p>\n\u003cp>What led to Ralph Keeling’s prediction, and the significance of this week? That stems from another of Dave Keeling’s early discoveries — the CO\u003csub>2\u003c/sub> curve also goes through a yearly cycle, rising to a peak around May and falling to a low around October.\u003c/p>\n\u003cp>The yearly cycle is a signal of natural life. Plants absorb CO\u003csub>2\u003c/sub> from the air during the growing season, then release it as they are eaten or die back. Because most of Earth’s land area is in the northern hemisphere, the yearly cycle is dominated by the seasons in the north.\u003c/p>\n\u003cp>But this year we have \u003ca href=\"https://wunderground.atavist.com/el-nino-forecast\" target=\"_blank\" rel=\"noopener\">a record-breaking El Niño\u003c/a> in the cycle, triggering drought in the tropics and hampering plant growth there, and fueling widespread forest fires that pour CO\u003csub>2\u003c/sub> into the air. The forest grows back, but not in time for next summer.\u003c/p>\n\u003cfigure id=\"attachment_364992\" class=\"wp-caption alignleft\" style=\"max-width: 398px\">\u003ca href=\"http://ww2.kqed.org/science/wp-content/uploads/sites/35/2015/11/CO2-two-years.png\">\u003cimg loading=\"lazy\" decoding=\"async\" class=\" wp-image-364992\" src=\"http://ww2.kqed.org/science/wp-content/uploads/sites/35/2015/11/CO2-two-years-800x454.png\" alt=\"CO2 at L+Mauna Loa, 2014-2015\" width=\"398\" height=\"226\" srcset=\"https://cdn.kqed.org/wp-content/uploads/sites/35/2015/11/CO2-two-years-800x454.png 800w, https://cdn.kqed.org/wp-content/uploads/sites/35/2015/11/CO2-two-years-400x227.png 400w, https://cdn.kqed.org/wp-content/uploads/sites/35/2015/11/CO2-two-years.png 900w\" sizes=\"(max-width: 398px) 100vw, 398px\">\u003c/a>\u003cfigcaption class=\"wp-caption-text\">Atmospheric CO\u003csub>2\u003c/sub> at the Mauna Loa Observatory in the last two years. \u003ccite>(Scripps/UC San Diego)\u003c/cite>\u003c/figcaption>\u003c/figure>\n\u003cp>So Ralph Keeling predicts the annual summer dip won’t bring readings back down into the 390s, as it did in 2014 and 2015.\u003c/p>\n\u003cp>“Will daily values at Mauna Loa ever fall below 400 ppm again in our lifetimes?” Keeling asked. “I’m prepared to project that they won’t, making the current values the last time the Mauna Loa record will produce numbers in the 300s.”\u003c/p>\n\u003cp>Meanwhile the stubborn long-term climb caused by humans shows no sign of slackening.\u003c/p>\n\u003cp>\u003cstrong>Change Can Happen, But Are We Willing?\u003cbr>\n\u003c/strong>\u003cbr>\nIn the 1700s, before coal began to be burned for industrial processes, CO\u003csub>2\u003c/sub> was at about 280 ppm.\u003c/p>\n\u003cp>The long-term upward trend has never gone down since the Keeling measurements began. The only way to make the climb stop is to burn less carbon and, at the same time, fix more carbon. Burning less means changing our economic system severely and rapidly. It can be done, but the change will be profound.\u003c/p>\n\u003cfigure id=\"attachment_364991\" class=\"wp-caption alignright\" style=\"max-width: 492px\">\u003ca href=\"http://ww2.kqed.org/science/wp-content/uploads/sites/35/2015/11/CO2-since-1958.png\">\u003cimg loading=\"lazy\" decoding=\"async\" class=\" wp-image-364991\" src=\"http://ww2.kqed.org/science/wp-content/uploads/sites/35/2015/11/CO2-since-1958-800x480.png\" alt=\"Full record from Mauna Loa\" width=\"492\" height=\"295\" srcset=\"https://cdn.kqed.org/wp-content/uploads/sites/35/2015/11/CO2-since-1958-800x480.png 800w, https://cdn.kqed.org/wp-content/uploads/sites/35/2015/11/CO2-since-1958-400x240.png 400w, https://cdn.kqed.org/wp-content/uploads/sites/35/2015/11/CO2-since-1958-960x576.png 960w, https://cdn.kqed.org/wp-content/uploads/sites/35/2015/11/CO2-since-1958.png 1000w\" sizes=\"(max-width: 492px) 100vw, 492px\">\u003c/a>\u003cfigcaption class=\"wp-caption-text\">Rise in atmospheric CO2 at the Mauna Loa Observatory since March 1958. \u003ccite>(Scripps/UC San Diego)\u003c/cite>\u003c/figcaption>\u003c/figure>\n\u003cp>Fixing more carbon is a project with many options, most of which involve burying CO\u003csub>2\u003c/sub> underground. One promising frontier is working with the natural carbon cycle to increase the world’s biomass. Restoring the soil, by reforming our farming practices, could help turn the Keeling curve back toward 400 and below, once again. That, too, would be a profound change.\u003c/p>\n\u003cp>Eventually, geology will take care of the atmosphere through the \u003ci>really\u003c/i> long-term carbon cycle. First the ocean will stir excess CO\u003csub>2\u003c/sub> throughout its deepest waters. That will take on the order of 1,000 years.\u003c/p>\n\u003cp>Second, the erosion of rocks will fertilize the sea with dissolved carbon minerals, which plankton will use to make their microscopic shells, which will fall to the seafloor as the plankton die and be buried. It’s a roundabout system, but that’s how the Earth works. That will take many thousands of years.\u003c/p>\n\u003cp>\u003c/p>\n\u003cp>We probably can’t wait that long.\u003c/p>\n\n",
"stats": {
"hasVideo": false,
"hasChartOrMap": false,
"hasAudio": false,
"hasPolis": false,
"wordCount": 990,
"hasGoogleForm": false,
"hasGallery": false,
"hasHearkenModule": false,
"iframeSrcs": [],
"paragraphCount": 25
},
"modified": 1704931032,
"excerpt": "Very soon, we will stop seeing carbon dioxide at levels below 400 parts per million -- essentially forever.",
"headData": {
"twImgId": "",
"twTitle": "",
"ogTitle": "",
"ogImgId": "",
"twDescription": "",
"description": "Very soon, we will stop seeing carbon dioxide at levels below 400 parts per million -- essentially forever.",
"title": "CO2: Earth Passes Into 'Uncharted Territory' | KQED",
"ogDescription": "",
"schema": {
"@context": "https://schema.org",
"@type": "Article",
"headline": "CO2: Earth Passes Into 'Uncharted Territory'",
"datePublished": "2015-11-19T07:56:36-08:00",
"dateModified": "2024-01-10T15:57:12-08:00",
"image": "https://cdn.kqed.org/wp-content/uploads/2020/02/KQED-OG-Image@1x.png"
}
},
"guestAuthors": [],
"slug": "co2-earth-passes-into-uncharted-territory",
"status": "publish",
"sticky": false,
"path": "/science/364990/co2-earth-passes-into-uncharted-territory",
"audioTrackLength": null,
"parsedContent": [
{
"type": "contentString",
"content": "\u003cdiv class=\"post-body\">\u003cp>\u003cp>This week, \u003ca href=\"https://scripps.ucsd.edu/programs/keelingcurve/\" target=\"_blank\" rel=\"noopener\">you can watch\u003c/a> as Earth passes a threshold not seen for at least a million years. The concentration of carbon dioxide in the air will rise above 400 parts per million. And scientists predict neither you nor your children will ever see it go below 400 ppm again.\u003c/p>\n\u003cp>The World Meteorological Organization (WMO) said on Monday that this year’s El Niño combined with global warming puts the world “\u003ca href=\"https://www.wmo.int/media/content/el-ni%C3%B1o-expected-strengthen-further-high-impacts-unprecedented-preparation\" target=\"_blank\" rel=\"noopener\">in uncharted territory\u003c/a>.”\u003c/p>\n\u003cp>“This naturally occurring El Niño event and human induced climate change may interact and modify each other in ways which we have \u003ca href=\"https://www.wmo.int/media/content/weather-reports-future-0\" target=\"_blank\" rel=\"noopener\">never before experienced\u003c/a>,” said WMO Secretary-General Michel Jarraud.\u003c/p>\n\u003cp>\u003cstrong>‘An Icon of Climate Change’\u003c/strong>\u003c/p>\n\u003cp>When scientists talk about atmospheric CO\u003csub>2\u003c/sub>, their yardstick is the so-called Keeling curve. It’s the record of the air’s composition, made each day at a station run by the \u003ca href=\"http://scrippsco2.ucsd.edu/\" target=\"_blank\" rel=\"noopener\">Scripps Institution of Oceanography\u003c/a> in the pure air high on Mauna Loa volcano, in Hawaii.\u003c/p>\n\u003cfigure id=\"attachment_364994\" class=\"wp-caption alignright\" style=\"max-width: 800px\">\u003ca href=\"http://ww2.kqed.org/science/wp-content/uploads/sites/35/2015/11/CO2-this-week.png\">\u003cimg loading=\"lazy\" decoding=\"async\" class=\"size-medium wp-image-364994\" src=\"http://ww2.kqed.org/science/wp-content/uploads/sites/35/2015/11/CO2-this-week-800x480.png\" alt=\"CO2 at Mauna Loa this week\" width=\"800\" height=\"480\" srcset=\"https://cdn.kqed.org/wp-content/uploads/sites/35/2015/11/CO2-this-week-800x480.png 800w, https://cdn.kqed.org/wp-content/uploads/sites/35/2015/11/CO2-this-week-400x240.png 400w, https://cdn.kqed.org/wp-content/uploads/sites/35/2015/11/CO2-this-week-960x576.png 960w, https://cdn.kqed.org/wp-content/uploads/sites/35/2015/11/CO2-this-week.png 1000w\" sizes=\"(max-width: 800px) 100vw, 800px\">\u003c/a>\u003cfigcaption class=\"wp-caption-text\">This week’s carbon dioxide readings at the Mauna Loa Observatory are updated every day. As they rise above the 400 parts-per-million threshold, scientists warn that they will not return to it in our lifetimes. \u003ccite>(Scripps/UC San Diego)\u003c/cite>\u003c/figcaption>\u003c/figure>\n\u003cp>Ralph Keeling, the custodian of the CO\u003csub>2\u003c/sub> record, made his prediction last week in \u003ca href=\"https://scripps.ucsd.edu/programs/keelingcurve/2015/10/21/is-this-the-last-year-below-400/\" target=\"_blank\" rel=\"noopener\">a blog post on the Keeling Curve website\u003c/a>.\u003c/p>\n\u003cp>\u003c/p>\u003c/div>",
"attributes": {
"named": {},
"numeric": []
}
},
{
"type": "component",
"content": "",
"name": "ad",
"attributes": {
"named": {
"label": "fullwidth"
},
"numeric": [
"fullwidth"
]
}
},
{
"type": "contentString",
"content": "\u003cdiv class=\"post-body\">\u003cp>\u003c/p>\n\u003cp>The Keeling curve was started in 1958 under the direction of Keeling’s father, Charles David “Dave” Keeling. Today it’s the longest series of such measurements in the world. It was named a \u003ca href=\"http://www.acs.org/content/acs/en/education/whatischemistry/landmarks/landmarksdirectory.html\" target=\"_blank\" rel=\"noopener\">National Historic Chemical Landmark\u003c/a> this year.\u003c/p>\n\u003cp>The Keeling curve is an icon of climate change. What does it show?\u003c/p>\n\u003cp>In the 1960s, Dave Keeling’s measurements showed that the CO\u003csub>2\u003c/sub> level in the air was rising steadily. That long-term increase is the mark of human influence. It comes overwhelmingly \u003ca href=\"http://www.esrl.noaa.gov/gmd/ccgg/trends/ff.html\" target=\"_blank\" rel=\"noopener\">from the fossil fuels we burn\u003c/a> — largely to generate electricity, but also to smelt metals, produce cement, run motors and so on. Other smaller sources of CO\u003csub>2\u003c/sub> are from humans cutting down forests and from large-scale mechanical farming, which removes most of the carbon-rich humus contained in soil.\u003c/p>\n\u003cp>Since the 1960s, the long-term increase in CO\u003csub>2\u003c/sub> has sped up. A little over half of the CO\u003csub>2\u003c/sub> we produce is absorbed by the ocean and by growing plants. The rest stays in the air and acts as a greenhouse gas.\u003c/p>\n\u003cfigure id=\"attachment_365502\" class=\"wp-caption alignright\" style=\"max-width: 640px\">\u003ca href=\"http://ww2.kqed.org/science/wp-content/uploads/sites/35/2015/11/mauna-loa2.jpg\">\u003cimg loading=\"lazy\" decoding=\"async\" class=\"size-full wp-image-365502\" src=\"http://ww2.kqed.org/science/wp-content/uploads/sites/35/2015/11/mauna-loa2.jpg\" alt=\"NOAA's Mauna Loa Observatory on Hawaii, a small collection of buildings where scientists take key measurements on air and sunlight.\" width=\"640\" height=\"480\" srcset=\"https://cdn.kqed.org/wp-content/uploads/sites/35/2015/11/mauna-loa2.jpg 640w, https://cdn.kqed.org/wp-content/uploads/sites/35/2015/11/mauna-loa2-400x300.jpg 400w\" sizes=\"(max-width: 640px) 100vw, 640px\">\u003c/a>\u003cfigcaption class=\"wp-caption-text\">NOAA’s Mauna Loa Observatory on Hawaii, a small collection of buildings where scientists take key measurements on air and sunlight. \u003ccite>(NOAA)\u003c/cite>\u003c/figcaption>\u003c/figure>\n\u003cp>If CO\u003csub>2\u003c/sub> weren’t a greenhouse gas, we might welcome it for promoting plant growth. But because it is one, higher CO\u003csub>2\u003c/sub> levels will make Earth steadily warmer until either human ingenuity or geology can bring them back down.\u003c/p>\n\u003cp>What led to Ralph Keeling’s prediction, and the significance of this week? That stems from another of Dave Keeling’s early discoveries — the CO\u003csub>2\u003c/sub> curve also goes through a yearly cycle, rising to a peak around May and falling to a low around October.\u003c/p>\n\u003cp>The yearly cycle is a signal of natural life. Plants absorb CO\u003csub>2\u003c/sub> from the air during the growing season, then release it as they are eaten or die back. Because most of Earth’s land area is in the northern hemisphere, the yearly cycle is dominated by the seasons in the north.\u003c/p>\n\u003cp>But this year we have \u003ca href=\"https://wunderground.atavist.com/el-nino-forecast\" target=\"_blank\" rel=\"noopener\">a record-breaking El Niño\u003c/a> in the cycle, triggering drought in the tropics and hampering plant growth there, and fueling widespread forest fires that pour CO\u003csub>2\u003c/sub> into the air. The forest grows back, but not in time for next summer.\u003c/p>\n\u003cfigure id=\"attachment_364992\" class=\"wp-caption alignleft\" style=\"max-width: 398px\">\u003ca href=\"http://ww2.kqed.org/science/wp-content/uploads/sites/35/2015/11/CO2-two-years.png\">\u003cimg loading=\"lazy\" decoding=\"async\" class=\" wp-image-364992\" src=\"http://ww2.kqed.org/science/wp-content/uploads/sites/35/2015/11/CO2-two-years-800x454.png\" alt=\"CO2 at L+Mauna Loa, 2014-2015\" width=\"398\" height=\"226\" srcset=\"https://cdn.kqed.org/wp-content/uploads/sites/35/2015/11/CO2-two-years-800x454.png 800w, https://cdn.kqed.org/wp-content/uploads/sites/35/2015/11/CO2-two-years-400x227.png 400w, https://cdn.kqed.org/wp-content/uploads/sites/35/2015/11/CO2-two-years.png 900w\" sizes=\"(max-width: 398px) 100vw, 398px\">\u003c/a>\u003cfigcaption class=\"wp-caption-text\">Atmospheric CO\u003csub>2\u003c/sub> at the Mauna Loa Observatory in the last two years. \u003ccite>(Scripps/UC San Diego)\u003c/cite>\u003c/figcaption>\u003c/figure>\n\u003cp>So Ralph Keeling predicts the annual summer dip won’t bring readings back down into the 390s, as it did in 2014 and 2015.\u003c/p>\n\u003cp>“Will daily values at Mauna Loa ever fall below 400 ppm again in our lifetimes?” Keeling asked. “I’m prepared to project that they won’t, making the current values the last time the Mauna Loa record will produce numbers in the 300s.”\u003c/p>\n\u003cp>Meanwhile the stubborn long-term climb caused by humans shows no sign of slackening.\u003c/p>\n\u003cp>\u003cstrong>Change Can Happen, But Are We Willing?\u003cbr>\n\u003c/strong>\u003cbr>\nIn the 1700s, before coal began to be burned for industrial processes, CO\u003csub>2\u003c/sub> was at about 280 ppm.\u003c/p>\n\u003cp>The long-term upward trend has never gone down since the Keeling measurements began. The only way to make the climb stop is to burn less carbon and, at the same time, fix more carbon. Burning less means changing our economic system severely and rapidly. It can be done, but the change will be profound.\u003c/p>\n\u003cfigure id=\"attachment_364991\" class=\"wp-caption alignright\" style=\"max-width: 492px\">\u003ca href=\"http://ww2.kqed.org/science/wp-content/uploads/sites/35/2015/11/CO2-since-1958.png\">\u003cimg loading=\"lazy\" decoding=\"async\" class=\" wp-image-364991\" src=\"http://ww2.kqed.org/science/wp-content/uploads/sites/35/2015/11/CO2-since-1958-800x480.png\" alt=\"Full record from Mauna Loa\" width=\"492\" height=\"295\" srcset=\"https://cdn.kqed.org/wp-content/uploads/sites/35/2015/11/CO2-since-1958-800x480.png 800w, https://cdn.kqed.org/wp-content/uploads/sites/35/2015/11/CO2-since-1958-400x240.png 400w, https://cdn.kqed.org/wp-content/uploads/sites/35/2015/11/CO2-since-1958-960x576.png 960w, https://cdn.kqed.org/wp-content/uploads/sites/35/2015/11/CO2-since-1958.png 1000w\" sizes=\"(max-width: 492px) 100vw, 492px\">\u003c/a>\u003cfigcaption class=\"wp-caption-text\">Rise in atmospheric CO2 at the Mauna Loa Observatory since March 1958. \u003ccite>(Scripps/UC San Diego)\u003c/cite>\u003c/figcaption>\u003c/figure>\n\u003cp>Fixing more carbon is a project with many options, most of which involve burying CO\u003csub>2\u003c/sub> underground. One promising frontier is working with the natural carbon cycle to increase the world’s biomass. Restoring the soil, by reforming our farming practices, could help turn the Keeling curve back toward 400 and below, once again. That, too, would be a profound change.\u003c/p>\n\u003cp>Eventually, geology will take care of the atmosphere through the \u003ci>really\u003c/i> long-term carbon cycle. First the ocean will stir excess CO\u003csub>2\u003c/sub> throughout its deepest waters. That will take on the order of 1,000 years.\u003c/p>\n\u003cp>Second, the erosion of rocks will fertilize the sea with dissolved carbon minerals, which plankton will use to make their microscopic shells, which will fall to the seafloor as the plankton die and be buried. It’s a roundabout system, but that’s how the Earth works. That will take many thousands of years.\u003c/p>\n\u003cp>\u003c/p>\n\u003cp>We probably can’t wait that long.\u003c/p>\n\n\u003c/div>\u003c/p>",
"attributes": {
"named": {},
"numeric": []
}
}
],
"link": "/science/364990/co2-earth-passes-into-uncharted-territory",
"authors": [
"6228"
],
"categories": [
"science_31",
"science_38"
],
"tags": [
"science_1852",
"science_1404",
"science_194",
"science_556"
],
"featImg": "science_365350",
"label": "science"
},
"science_355510": {
"type": "posts",
"id": "science_355510",
"meta": {
"index": "posts_1716263798",
"site": "science",
"id": "355510",
"score": null,
"sort": [
1447682437000
]
},
"guestAuthors": [],
"slug": "governor-brown-takes-climate-message-to-world-stage",
"title": "Governor Brown Takes Climate Message to World Stage",
"publishDate": 1447682437,
"format": "standard",
"headTitle": "Governor Brown Takes Climate Message to World Stage | KQED",
"labelTerm": {
"site": "science"
},
"content": "\u003cp>\u003cb>Listen to the story:\u003c/b>\u003cbr>\nhttp://www.kqed.org/.stream/anon/radio/science/2015/11/20151123ScienceJerryBrownclimatetalks.mp3\u003c/p>\n\u003cp>World leaders have vowed to go forward with a summit in Paris in two weeks, where they’ll be hashing out a much-anticipated agreement to combat climate change. And among the heads of state and dignitaries, you’ll also see California’s Governor Jerry Brown.\u003c/p>\n\u003cp>Brown will be making the case that what California does matters to the rest of world.\u003c/p>\n\u003cp>He’s been spearheading a separate international agreement to cut emissions – not with other countries, but among regional governments like states and provinces.\u003c/p>\n\u003cp>It’s the product of an international diplomatic tour Brown’s been on for the past year. He visited the United Nations, the Vatican and met with officials from China, India, Canada and Europe, to garner support for the deal.\u003c/p>\n\u003cp>[ad fullwidth]\u003c/p>\n\u003cp>“The world faces an existential threat,” he told Canadian leaders in July. “I believe the real source of climate change action comes from states and provinces.”\u003c/p>\n\u003cp>The reason Brown feels compelled to lead the charge? “Troglodytes.”\u003c/p>\n\u003caside class=\"pullquote alignright\">“Somebody has to wake up the country to the real danger.”\u003cbr>\n\u003ccite>Governor Jerry Brown\u003c/cite>\u003c/aside>\n\u003cp>That’s what the Governor has been calling climate change doubters. And when I caught up with him in an interview recently, he was clear about who he’s pointing the finger at.\u003c/p>\n\u003cp>“The Republican Congress and all the Republican candidates are in a very deep state of denial despite the vast, vast overwhelming scientific consensus,” he said.\u003c/p>\n\u003cp>Brown says that while a political stalemate in Washington D.C. is leaving a void, California is there to lead the way.\u003c/p>\n\u003cp>“Sea level rise, extreme weather events, drought – there’s real catastrophe on the way,” he said. “Somebody has to wake up the country to the real danger.”\u003c/p>\n\u003cp>\u003cstrong>Cooperating Across Borders\u003c/strong>\u003c/p>\n\u003cp>On Monday, Brown announced that with the latest additions to the \u003ca href=\"http://under2mou.org/\">Under 2 MOU\u003c/a> agreement that he co-founded, the total economies of “subnationals” signed on now exceed the GDP of the entire United States. Parties commit to either reduce greenhouse gas emissions 80 to 95 percent below 1990 levels by 2050 or achieve a per capita annual emission target of less than 2 metric tons by 2050. The name is a reference to the two degrees (Celsius) of warming that scientists say, if the world sticks to, would avoid the most serious impacts.\u003c/p>\n\u003cp>The regional governments have agreed to cut their emissions 80 percent or more by 2050. “That’s more than the nation-states,” Brown said. “They are far modest in their commitments.”\u003c/p>\n\u003cp>It’s not a binding promise to cut emissions, but the regions have agreed to cooperate on policy and technology ideas.\u003c/p>\n\u003cp>Whether the agreement sticks over the years remains to be seen. But Brown argues, when you add up all the signatories, they make up what would be the second largest economy in the world.\u003c/p>\n\u003cfigure id=\"attachment_357093\" class=\"wp-caption alignright\" style=\"max-width: 640px\">\u003ca href=\"http://ww2.kqed.org/science/wp-content/uploads/sites/35/2015/11/smudsolar.jpg\">\u003cimg loading=\"lazy\" decoding=\"async\" class=\"size-large wp-image-357093\" src=\"http://ww2.kqed.org/science/wp-content/uploads/sites/35/2015/11/smudsolar-1440x874.jpg\" alt=\"Workers install a solar farm outside Sacramento.\" width=\"640\" height=\"388\" srcset=\"https://cdn.kqed.org/wp-content/uploads/sites/35/2015/11/smudsolar-1440x874.jpg 1440w, https://cdn.kqed.org/wp-content/uploads/sites/35/2015/11/smudsolar-400x243.jpg 400w, https://cdn.kqed.org/wp-content/uploads/sites/35/2015/11/smudsolar-800x485.jpg 800w, https://cdn.kqed.org/wp-content/uploads/sites/35/2015/11/smudsolar-1920x1165.jpg 1920w, https://cdn.kqed.org/wp-content/uploads/sites/35/2015/11/smudsolar-1180x716.jpg 1180w, https://cdn.kqed.org/wp-content/uploads/sites/35/2015/11/smudsolar-960x582.jpg 960w\" sizes=\"(max-width: 640px) 100vw, 640px\">\u003c/a>\u003cfigcaption class=\"wp-caption-text\">Workers install a solar farm outside Sacramento. California’s goal is to reach 50 percent renewable energy by 2030. \u003ccite>(Sacramento Municipal Utility District)\u003c/cite>\u003c/figcaption>\u003c/figure>\n\u003cp>It’s a show of support that he thinks will galvanize momentum in Paris.\u003c/p>\n\u003cp>“We have to light the fire, if I can use that metaphor, putting as much pressure and support behind this global commitment,” he said. “As we know in Silicon Valley or Hollywood, California does set trends.”\u003c/p>\n\u003cp>“Governor Brown does feel that it is probably the most significant issue of our generation,” said Matt Rodriquez, California’s Secretary for Environmental Protection.\u003c/p>\n\u003cp>“I can tell you, I sometimes wish we did have a diplomatic core or a state department here,” he added.\u003c/p>\n\u003cp>Going it alone is something California is known for. Almost a decade ago, the state took on a landmark climate change goal under the state law AB 32, requiring a cut in emissions of about 30 percent by 2020.\u003c/p>\n\u003cp>\u003ca href=\"http://climatechange.ca.gov/\">The number of policies\u003c/a> under the law makes it the most ambitious in the country. Experts say to reach the state’s eventual goal of cutting emission 80 percent under 1990 levels by 2050, the state’s entire economy will be remade.\u003c/p>\n\u003cp>Record amounts of renewable energy are coming online to meet California’s renewable energy goals. Manufacturers and electric utilities are cutting their emissions, \u003ca href=\"http://ww2.kqed.org/quest/2012/11/09/cap-and-trade-101-how-californias-carbon-market-works/\">under a cap-and-trade system\u003c/a>.\u003c/p>\n\u003cp>Fuels that power cars and trucks are getting cleaner under the state’s low carbon fuel standard. And automakers are required to offer hundreds of thousands of clean cars for sale on the California market.\u003c/p>\n\u003cp>\u003cstrong>Facing the Critics\u003c/strong>\u003c/p>\n\u003cp>Today, California has more electric vehicles than any other state.\u003c/p>\n\u003cp>“I gotta tell you, I love the car,” said Jeff Stone, parking his all-electric Nissan Leaf at his office in Murrieta, California.\u003c/p>\n\u003cp>Stone is what you’d call an early adopter. This is his third electric car.\u003c/p>\n\u003cp>“I had a Tesla that I loved,” he said. “And then I had a Coda, one of the first electric cars on the market.”\u003c/p>\n\u003cfigure id=\"attachment_357097\" class=\"wp-caption alignright\" style=\"max-width: 448px\">\u003ca href=\"http://ww2.kqed.org/science/wp-content/uploads/sites/35/2015/11/chinaforum-web.jpg\">\u003cimg loading=\"lazy\" decoding=\"async\" class=\"size-full wp-image-357097\" src=\"http://ww2.kqed.org/science/wp-content/uploads/sites/35/2015/11/chinaforum-web.jpg\" alt=\"The Chinese province Sichuan signed Governor Brown's international climate agreement in September.\" width=\"448\" height=\"298\" srcset=\"https://cdn.kqed.org/wp-content/uploads/sites/35/2015/11/chinaforum-web.jpg 448w, https://cdn.kqed.org/wp-content/uploads/sites/35/2015/11/chinaforum-web-400x266.jpg 400w\" sizes=\"(max-width: 448px) 100vw, 448px\">\u003c/a>\u003cfigcaption class=\"wp-caption-text\">The Chinese province of Sichuan signed Governor Brown’s international climate agreement in September. \u003ccite>(Joe McHugh, California Highway Patrol)\u003c/cite>\u003c/figcaption>\u003c/figure>\n\u003cp>Stone is also a Republican state senator representing Riverside County and one of the climate skeptics Brown has been pointing a finger at.\u003c/p>\n\u003cp>Stone is not a fan of California’s go-it-alone approach.\u003c/p>\n\u003cp>“We represent about one percent or less of any contribution to global warming that happens, if it’s truly man-caused,” he said. “We can’t do it alone.”\u003c/p>\n\u003cp>He argues California’s many climate rules lead to higher energy costs and give the state a reputation for being un-friendly to business.\u003c/p>\n\u003cp>“I think you have business people who are throwing up their arms and they’re vacating the state,” Stone said.\u003c/p>\n\u003cp>It was a common refrain when the state legislature debated SB 350 this summer, a bill designed to raise the bar on California’s climate goals.\u003c/p>\n\u003cp>Under the law, the state will have to reach 50 percent renewable energy and improve building efficiency by 50 percent, both by 2030. But a \u003ca href=\"http://ww2.kqed.org/news/Democrats-strip-oil-goal-from-climate-legislation\">provision to cut California’s petroleum use\u003c/a> by 50 percent failed, spurred by oil industry-funded ads warning of job losses.\u003c/p>\n\u003cp>\u003cstrong>Thought Leader\u003c/strong>\u003c/p>\n\u003cp>Still, the Governor has answered back with a political trump card. While the state’s climate change policies have raised both gas and electricity prices by a few percent, they haven’t fulfilled predictions of economic ruin.\u003c/p>\n\u003cp>“None of them came true,” said Dan Kammen, a professor of energy at UC Berkeley.\u003c/p>\n\u003cp>“In fact, California’s economy grew faster than the national average,” he said. “So we benefited to some extent by having these environmental laws.”\u003c/p>\n\u003cp>[contextly_sidebar id=”NMeBiT2ggfM6JI2B0ZJUlaq5tTrOm1zL”]Kammen argues that setting that example is California’s real contribution to climate change.\u003c/p>\n\u003cp>“California’s the seventh biggest economy in the world,” he said. “It makes a big difference and it’s a big thought leader.”\u003c/p>\n\u003cp>The state acts as a testing ground for environmental policies, he says. Many of today’s national environmental standards, including building efficiency, appliance standards and car tailpipe emissions, were based on rules that California passed first.\u003c/p>\n\u003cp>“Getting a lead actor like California really helps the federal government see what the options are, see what the hurdles are likely to be,” Kammen said.\u003c/p>\n\u003cp>That trendsetting goes overseas, he says. Some of the Chinese provinces that are piloting cap-and-trade systems worked with California officials to design them.\u003c/p>\n\u003cp>Which means at the international climate talks, and Kammen has been to 11 of them, California comes up a lot. “We talk about California all the time,” he says.\u003c/p>\n\u003cp>[ad floatright]\u003c/p>\n\u003cp>Something he expects to continue, as California’s Governor heads off to Paris, hoping to make his mark on international discussions to slow the Earth’s steady warming.\u003c/p>\n\n",
"blocks": [],
"excerpt": "World leaders will be hashing out a climate change agreement in Paris, but Governor Brown is showing up with one in hand.",
"status": "publish",
"parent": 0,
"modified": 1725578307,
"stats": {
"hasAudio": true,
"hasVideo": false,
"hasChartOrMap": false,
"iframeSrcs": [],
"hasGoogleForm": false,
"hasGallery": false,
"hasHearkenModule": false,
"hasPolis": false,
"paragraphCount": 49,
"wordCount": 1377
},
"headData": {
"title": "Governor Brown Takes Climate Message to World Stage | KQED",
"description": "World leaders will be hashing out a climate change agreement in Paris, but Governor Brown is showing up with one in hand.",
"ogTitle": "",
"ogDescription": "",
"ogImgId": "",
"twTitle": "",
"twDescription": "",
"twImgId": "",
"schema": {
"@context": "https://schema.org",
"@type": "Article",
"headline": "Governor Brown Takes Climate Message to World Stage",
"datePublished": "2015-11-16T06:00:37-08:00",
"dateModified": "2024-09-05T16:18:27-07:00",
"image": "https://cdn.kqed.org/wp-content/uploads/2020/02/KQED-OG-Image@1x.png"
}
},
"sticky": false,
"path": "/science/355510/governor-brown-takes-climate-message-to-world-stage",
"audioUrl": "http://www.kqed.org/.stream/anon/radio/science/2015/11/20151123ScienceJerryBrownclimatetalks.mp3",
"audioDuration": null,
"audioTrackLength": null,
"parsedContent": [
{
"type": "contentString",
"content": "\u003cdiv class=\"post-body\">\u003cp>\u003cp>\u003cb>Listen to the story:\u003c/b>\u003cbr>\u003c/p>\u003c/div>",
"attributes": {
"named": {},
"numeric": []
}
},
{
"type": "component",
"content": "",
"name": "audioLink",
"attributes": {
"named": {
"src": "http://www.kqed.org/.stream/anon/radio/science/2015/11/20151123ScienceJerryBrownclimatetalks.mp3"
},
"numeric": []
}
},
{
"type": "contentString",
"content": "\u003cdiv class=\"post-body\">\u003cp>\u003cp>World leaders have vowed to go forward with a summit in Paris in two weeks, where they’ll be hashing out a much-anticipated agreement to combat climate change. And among the heads of state and dignitaries, you’ll also see California’s Governor Jerry Brown.\u003c/p>\n\u003cp>Brown will be making the case that what California does matters to the rest of world.\u003c/p>\n\u003cp>He’s been spearheading a separate international agreement to cut emissions – not with other countries, but among regional governments like states and provinces.\u003c/p>\n\u003cp>It’s the product of an international diplomatic tour Brown’s been on for the past year. He visited the United Nations, the Vatican and met with officials from China, India, Canada and Europe, to garner support for the deal.\u003c/p>\n\u003cp>\u003c/p>\u003c/div>",
"attributes": {
"named": {},
"numeric": []
}
},
{
"type": "component",
"content": "",
"name": "ad",
"attributes": {
"named": {
"label": "fullwidth"
},
"numeric": [
"fullwidth"
]
}
},
{
"type": "contentString",
"content": "\u003cdiv class=\"post-body\">\u003cp>\u003c/p>\n\u003cp>“The world faces an existential threat,” he told Canadian leaders in July. “I believe the real source of climate change action comes from states and provinces.”\u003c/p>\n\u003cp>The reason Brown feels compelled to lead the charge? “Troglodytes.”\u003c/p>\n\u003caside class=\"pullquote alignright\">“Somebody has to wake up the country to the real danger.”\u003cbr>\n\u003ccite>Governor Jerry Brown\u003c/cite>\u003c/aside>\n\u003cp>That’s what the Governor has been calling climate change doubters. And when I caught up with him in an interview recently, he was clear about who he’s pointing the finger at.\u003c/p>\n\u003cp>“The Republican Congress and all the Republican candidates are in a very deep state of denial despite the vast, vast overwhelming scientific consensus,” he said.\u003c/p>\n\u003cp>Brown says that while a political stalemate in Washington D.C. is leaving a void, California is there to lead the way.\u003c/p>\n\u003cp>“Sea level rise, extreme weather events, drought – there’s real catastrophe on the way,” he said. “Somebody has to wake up the country to the real danger.”\u003c/p>\n\u003cp>\u003cstrong>Cooperating Across Borders\u003c/strong>\u003c/p>\n\u003cp>On Monday, Brown announced that with the latest additions to the \u003ca href=\"http://under2mou.org/\">Under 2 MOU\u003c/a> agreement that he co-founded, the total economies of “subnationals” signed on now exceed the GDP of the entire United States. Parties commit to either reduce greenhouse gas emissions 80 to 95 percent below 1990 levels by 2050 or achieve a per capita annual emission target of less than 2 metric tons by 2050. The name is a reference to the two degrees (Celsius) of warming that scientists say, if the world sticks to, would avoid the most serious impacts.\u003c/p>\n\u003cp>The regional governments have agreed to cut their emissions 80 percent or more by 2050. “That’s more than the nation-states,” Brown said. “They are far modest in their commitments.”\u003c/p>\n\u003cp>It’s not a binding promise to cut emissions, but the regions have agreed to cooperate on policy and technology ideas.\u003c/p>\n\u003cp>Whether the agreement sticks over the years remains to be seen. But Brown argues, when you add up all the signatories, they make up what would be the second largest economy in the world.\u003c/p>\n\u003cfigure id=\"attachment_357093\" class=\"wp-caption alignright\" style=\"max-width: 640px\">\u003ca href=\"http://ww2.kqed.org/science/wp-content/uploads/sites/35/2015/11/smudsolar.jpg\">\u003cimg loading=\"lazy\" decoding=\"async\" class=\"size-large wp-image-357093\" src=\"http://ww2.kqed.org/science/wp-content/uploads/sites/35/2015/11/smudsolar-1440x874.jpg\" alt=\"Workers install a solar farm outside Sacramento.\" width=\"640\" height=\"388\" srcset=\"https://cdn.kqed.org/wp-content/uploads/sites/35/2015/11/smudsolar-1440x874.jpg 1440w, https://cdn.kqed.org/wp-content/uploads/sites/35/2015/11/smudsolar-400x243.jpg 400w, https://cdn.kqed.org/wp-content/uploads/sites/35/2015/11/smudsolar-800x485.jpg 800w, https://cdn.kqed.org/wp-content/uploads/sites/35/2015/11/smudsolar-1920x1165.jpg 1920w, https://cdn.kqed.org/wp-content/uploads/sites/35/2015/11/smudsolar-1180x716.jpg 1180w, https://cdn.kqed.org/wp-content/uploads/sites/35/2015/11/smudsolar-960x582.jpg 960w\" sizes=\"(max-width: 640px) 100vw, 640px\">\u003c/a>\u003cfigcaption class=\"wp-caption-text\">Workers install a solar farm outside Sacramento. California’s goal is to reach 50 percent renewable energy by 2030. \u003ccite>(Sacramento Municipal Utility District)\u003c/cite>\u003c/figcaption>\u003c/figure>\n\u003cp>It’s a show of support that he thinks will galvanize momentum in Paris.\u003c/p>\n\u003cp>“We have to light the fire, if I can use that metaphor, putting as much pressure and support behind this global commitment,” he said. “As we know in Silicon Valley or Hollywood, California does set trends.”\u003c/p>\n\u003cp>“Governor Brown does feel that it is probably the most significant issue of our generation,” said Matt Rodriquez, California’s Secretary for Environmental Protection.\u003c/p>\n\u003cp>“I can tell you, I sometimes wish we did have a diplomatic core or a state department here,” he added.\u003c/p>\n\u003cp>Going it alone is something California is known for. Almost a decade ago, the state took on a landmark climate change goal under the state law AB 32, requiring a cut in emissions of about 30 percent by 2020.\u003c/p>\n\u003cp>\u003ca href=\"http://climatechange.ca.gov/\">The number of policies\u003c/a> under the law makes it the most ambitious in the country. Experts say to reach the state’s eventual goal of cutting emission 80 percent under 1990 levels by 2050, the state’s entire economy will be remade.\u003c/p>\n\u003cp>Record amounts of renewable energy are coming online to meet California’s renewable energy goals. Manufacturers and electric utilities are cutting their emissions, \u003ca href=\"http://ww2.kqed.org/quest/2012/11/09/cap-and-trade-101-how-californias-carbon-market-works/\">under a cap-and-trade system\u003c/a>.\u003c/p>\n\u003cp>Fuels that power cars and trucks are getting cleaner under the state’s low carbon fuel standard. And automakers are required to offer hundreds of thousands of clean cars for sale on the California market.\u003c/p>\n\u003cp>\u003cstrong>Facing the Critics\u003c/strong>\u003c/p>\n\u003cp>Today, California has more electric vehicles than any other state.\u003c/p>\n\u003cp>“I gotta tell you, I love the car,” said Jeff Stone, parking his all-electric Nissan Leaf at his office in Murrieta, California.\u003c/p>\n\u003cp>Stone is what you’d call an early adopter. This is his third electric car.\u003c/p>\n\u003cp>“I had a Tesla that I loved,” he said. “And then I had a Coda, one of the first electric cars on the market.”\u003c/p>\n\u003cfigure id=\"attachment_357097\" class=\"wp-caption alignright\" style=\"max-width: 448px\">\u003ca href=\"http://ww2.kqed.org/science/wp-content/uploads/sites/35/2015/11/chinaforum-web.jpg\">\u003cimg loading=\"lazy\" decoding=\"async\" class=\"size-full wp-image-357097\" src=\"http://ww2.kqed.org/science/wp-content/uploads/sites/35/2015/11/chinaforum-web.jpg\" alt=\"The Chinese province Sichuan signed Governor Brown's international climate agreement in September.\" width=\"448\" height=\"298\" srcset=\"https://cdn.kqed.org/wp-content/uploads/sites/35/2015/11/chinaforum-web.jpg 448w, https://cdn.kqed.org/wp-content/uploads/sites/35/2015/11/chinaforum-web-400x266.jpg 400w\" sizes=\"(max-width: 448px) 100vw, 448px\">\u003c/a>\u003cfigcaption class=\"wp-caption-text\">The Chinese province of Sichuan signed Governor Brown’s international climate agreement in September. \u003ccite>(Joe McHugh, California Highway Patrol)\u003c/cite>\u003c/figcaption>\u003c/figure>\n\u003cp>Stone is also a Republican state senator representing Riverside County and one of the climate skeptics Brown has been pointing a finger at.\u003c/p>\n\u003cp>Stone is not a fan of California’s go-it-alone approach.\u003c/p>\n\u003cp>“We represent about one percent or less of any contribution to global warming that happens, if it’s truly man-caused,” he said. “We can’t do it alone.”\u003c/p>\n\u003cp>He argues California’s many climate rules lead to higher energy costs and give the state a reputation for being un-friendly to business.\u003c/p>\n\u003cp>“I think you have business people who are throwing up their arms and they’re vacating the state,” Stone said.\u003c/p>\n\u003cp>It was a common refrain when the state legislature debated SB 350 this summer, a bill designed to raise the bar on California’s climate goals.\u003c/p>\n\u003cp>Under the law, the state will have to reach 50 percent renewable energy and improve building efficiency by 50 percent, both by 2030. But a \u003ca href=\"http://ww2.kqed.org/news/Democrats-strip-oil-goal-from-climate-legislation\">provision to cut California’s petroleum use\u003c/a> by 50 percent failed, spurred by oil industry-funded ads warning of job losses.\u003c/p>\n\u003cp>\u003cstrong>Thought Leader\u003c/strong>\u003c/p>\n\u003cp>Still, the Governor has answered back with a political trump card. While the state’s climate change policies have raised both gas and electricity prices by a few percent, they haven’t fulfilled predictions of economic ruin.\u003c/p>\n\u003cp>“None of them came true,” said Dan Kammen, a professor of energy at UC Berkeley.\u003c/p>\n\u003cp>“In fact, California’s economy grew faster than the national average,” he said. “So we benefited to some extent by having these environmental laws.”\u003c/p>\n\u003cp>\u003c/p>\u003cp>\u003c/p>\u003cp>Kammen argues that setting that example is California’s real contribution to climate change.\u003c/p>\n\u003cp>“California’s the seventh biggest economy in the world,” he said. “It makes a big difference and it’s a big thought leader.”\u003c/p>\n\u003cp>The state acts as a testing ground for environmental policies, he says. Many of today’s national environmental standards, including building efficiency, appliance standards and car tailpipe emissions, were based on rules that California passed first.\u003c/p>\n\u003cp>“Getting a lead actor like California really helps the federal government see what the options are, see what the hurdles are likely to be,” Kammen said.\u003c/p>\n\u003cp>That trendsetting goes overseas, he says. Some of the Chinese provinces that are piloting cap-and-trade systems worked with California officials to design them.\u003c/p>\n\u003cp>Which means at the international climate talks, and Kammen has been to 11 of them, California comes up a lot. “We talk about California all the time,” he says.\u003c/p>\n\u003cp>\u003c/p>\u003c/div>",
"attributes": {
"named": {},
"numeric": []
}
},
{
"type": "component",
"content": "",
"name": "ad",
"attributes": {
"named": {
"label": "floatright"
},
"numeric": [
"floatright"
]
}
},
{
"type": "contentString",
"content": "\u003cdiv class=\"post-body\">\u003cp>\u003c/p>\n\u003cp>Something he expects to continue, as California’s Governor heads off to Paris, hoping to make his mark on international discussions to slow the Earth’s steady warming.\u003c/p>\n\n\u003c/div>\u003c/p>",
"attributes": {
"named": {},
"numeric": []
}
}
],
"link": "/science/355510/governor-brown-takes-climate-message-to-world-stage",
"authors": [
"239"
],
"categories": [
"science_31",
"science_33",
"science_35",
"science_40",
"science_43"
],
"tags": [
"science_121",
"science_194",
"science_101",
"science_140"
],
"featImg": "science_357088",
"label": "science"
},
"science_341056": {
"type": "posts",
"id": "science_341056",
"meta": {
"index": "posts_1716263798",
"site": "science",
"id": "341056",
"score": null,
"sort": [
1446732046000
]
},
"parent": 0,
"labelTerm": {
"site": "science"
},
"blocks": [],
"publishDate": 1446732046,
"format": "standard",
"title": "What's Left to Discover About Microbes? Pretty Much Everything",
"headTitle": "What’s Left to Discover About Microbes? Pretty Much Everything | KQED",
"content": "\u003cp>Last week a group of 48 scientists, in the prestigious journal Science, urged America to \u003ca href=\"http://www.sciencemag.org/content/350/6260/507.full\">launch a national project to study microbes\u003c/a>. The next day, eminent scientists commenting in Nature, a journal of like prestige, said \u003ca href=\"http://www.nature.com/news/microbiology-create-a-global-microbiome-effort-1.18636\">we should launch a \u003ci>worldwide\u003c/i> effort\u003c/a> to study microbes.\u003c/p>\n\u003caside class=\"pullquote alignright\">‘We will never escape our microbial cradle.’\u003ccite>David Montgomery and Anne Biklé\u003c/cite>\u003c/aside>\n\u003cp>This is not a farfetched idea. If you put all life on Earth upon a scale, the weight of microbes would exceed all the rest put together. Microbes are within us and around us. We cannot survive without them.\u003c/p>\n\u003cp>In “\u003ca href=\"http://books.wwnorton.com/books/The-Hidden-Half-of-Nature/\" target=\"_blank\" rel=\"noopener\">The Hidden Half of Nature\u003c/a>,” geologist David Montgomery and biologist Anne Biklé underscore the importance of microbes. “Consider the many microbial landscapes composing our bodies, from the river valley of our gut, to forests of hair, dry toenail deserts, and the skies of our eyes. These places have a multitude of interacting inhabitants and are as dynamic as any other ecosystem on Earth.”\u003c/p>\n\u003cp>\u003cb>Microbes: From Curiosities to Powerhouses\u003c/b>\u003c/p>\n\u003cp>The invisible world of microbes was unknown until the 1600s, when Antonie van Leeuwenhoek devised a powerful microscope. Whatever he put under its lens — rainwater, the plaque from his teeth, cheese — he found it teeming with “animalcules,” tiny living things.\u003c/p>\n\u003cp>[ad fullwidth]\u003c/p>\n\u003cp>In the 1800s, Louis Pasteur showed that microbes called yeasts are essential for fermenting wine and beer. He proved that microbes are responsible for souring milk and decomposing meat. Sterilization and isolation of pure microbial cultures were great advances in feeding the world.\u003c/p>\n\u003cfigure id=\"attachment_341360\" class=\"wp-caption alignleft\" style=\"max-width: 419px\">\u003ca href=\"http://ww2.kqed.org/science/wp-content/uploads/sites/35/2015/11/microbiome-study-1.jpg\">\u003cimg loading=\"lazy\" decoding=\"async\" class=\" wp-image-341360\" src=\"http://ww2.kqed.org/science/wp-content/uploads/sites/35/2015/11/microbiome-study-1-800x450.jpg\" alt=\"Microbiologist Amy Charkowski and graduate student Abdulah Harris observe the microscopic view of an alfalfa sprout root that has been experimentally contaminated with Salmonella. The microbes show up green or blue on the screen.\" width=\"419\" height=\"235\" srcset=\"https://cdn.kqed.org/wp-content/uploads/sites/35/2015/11/microbiome-study-1-800x450.jpg 800w, https://cdn.kqed.org/wp-content/uploads/sites/35/2015/11/microbiome-study-1-400x225.jpg 400w, https://cdn.kqed.org/wp-content/uploads/sites/35/2015/11/microbiome-study-1-960x540.jpg 960w, https://cdn.kqed.org/wp-content/uploads/sites/35/2015/11/microbiome-study-1.jpg 1000w\" sizes=\"(max-width: 419px) 100vw, 419px\">\u003c/a>\u003cfigcaption class=\"wp-caption-text\">Microbiologist Amy Charkowski of the University of Wisconsin-Madison and graduate student Abdulah Harris observe the microscopic view of an alfalfa sprout root that has been experimentally contaminated with Salmonella. The microbes show up green or blue on the screen. \u003ccite>(Scott Bauer/U.S. Dept Agriculture)\u003c/cite>\u003c/figcaption>\u003c/figure>\n\u003cp>Later we learned that other microbes have the power to cause disease. This time, sterile practices and isolation revolutionized medicine.\u003c/p>\n\u003cp>Given this history, many people think of microbes only as germs to be eradicated. But recent research shows that communities of diverse microbes form invisible ecosystems, called microbiomes, supporting the ecosystems of the visible world — forests, lakes, agricultural fields and us.\u003c/p>\n\u003cp>In my own field of geology, we’ve learned that microbes are crucial agents in weathering rocks, depositing ores and preserving fossils. We’ve learned that microbes, the oldest form of life, were responsible for putting oxygen in the atmosphere over 2 billion years ago. “We will never escape our microbial cradle,” Montgomery and Biklé write.\u003c/p>\n\u003cp>Everywhere we look, we find a dizzying expanse of microbial mystery. Our very life — soil productivity, human health, global climate and more — is intimately tied to this universe of microbiomes.\u003c/p>\n\u003cp>\u003cb>Studying Our ‘Microbial Cradle’\u003c/b>\u003c/p>\n\u003cp>We know as much about microbes today as we knew about the sky before telescopes. Our current tools for sequencing DNA, familiar for solving crimes and studying our ancestries, are the equivalent of Leeuwenhoek’s first microscope.\u003c/p>\n\u003cfigure id=\"attachment_341366\" class=\"wp-caption alignright\" style=\"max-width: 640px\">\u003ca href=\"http://ww2.kqed.org/science/wp-content/uploads/sites/35/2015/11/5927204872_5a6d669faf_o.jpg\">\u003cimg loading=\"lazy\" decoding=\"async\" class=\"size-full wp-image-341366\" src=\"http://ww2.kqed.org/science/wp-content/uploads/sites/35/2015/11/5927204872_5a6d669faf_o.jpg\" alt=\"This scanning electron micrograph shows MRSA, methicillin-resistant Staphylococcus aureus bacteria (the yellow, round items), killing and escaping from a human white cell. \" width=\"640\" height=\"611\" srcset=\"https://cdn.kqed.org/wp-content/uploads/sites/35/2015/11/5927204872_5a6d669faf_o.jpg 640w, https://cdn.kqed.org/wp-content/uploads/sites/35/2015/11/5927204872_5a6d669faf_o-400x382.jpg 400w, https://cdn.kqed.org/wp-content/uploads/sites/35/2015/11/5927204872_5a6d669faf_o-32x32.jpg 32w\" sizes=\"(max-width: 640px) 100vw, 640px\">\u003c/a>\u003cfigcaption class=\"wp-caption-text\">This scanning electron micrograph shows MRSA, methicillin-resistant Staphylococcus aureus bacteria (the yellow, round items), killing and escaping from a human white cell. \u003ccite>(NIAID)\u003c/cite>\u003c/figcaption>\u003c/figure>\n\u003cp>When we turn those tools upon ordinary soil, we find it swarming with genetic material, but we recognize less than 1 percent of it. The same is true of the microbiome inside the human gut. The same is true of seawater.\u003c/p>\n\u003cp>The authors of \u003ca href=\"http://www.sciencemag.org/content/350/6260/507.full\">the Science paper\u003c/a>, therefore, propose “an interdisciplinary Unified Microbiome Initiative to discover and advance tools to understand and harness the capabilities of Earth’s microbial ecosystems.”\u003c/p>\n\u003cp>For example, better technologies could tell us what specific genes do, sequence the DNA of individual microbes, decode the “chemical conversations” in microbial communities and experiment on lab-based microbiomes.\u003c/p>\n\u003cp>\u003cb>Improve Health, Replenish Soil\u003c/b>\u003c/p>\n\u003cp>It’s likely the first targets of this microbiome research will center on human health. Montgomery and Biklé say the proposed initiative will help us better understand “the unintended scrambling of the human microbiome through drugs like antibiotics, low-fiber diets, and other factors.”\u003c/p>\n\u003cp>Replenishing the world’s soil is another worthy target that can help us draw down the greenhouse gases from the atmosphere. The carbon sequestered in soils outweighs all the living mass in plants and animals. Thus increasing the organic matter in soil will rely on learning to work well with microbes.\u003c/p>\n\u003cp>Success in those fields will help us meet the greater challenge of the oceans. It’s a virtually infinite space filled with species we’ve barely begun to count, plus free-floating genes that can move between microbial species. It has evolved for billions of years. You could call the ocean Earth’s gut. As geology, biology and climatology converge in the study of the past and present ocean, microbiome studies will have a scientific payoff for centuries to come.\u003c/p>\n\u003cp>\u003c/p>\n\u003cp>“We and the planet will be a lot better off the sooner we embrace and work with, rather than against, microbiomes,” Montgomery and Biklé say. “It may be our best way yet of gaining headway on some of humanity’s long-standing conflicts with the natural world of which we are a part.”\u003c/p>\n\n",
"stats": {
"hasVideo": false,
"hasChartOrMap": false,
"hasAudio": false,
"hasPolis": false,
"wordCount": 884,
"hasGoogleForm": false,
"hasGallery": false,
"hasHearkenModule": false,
"iframeSrcs": [],
"paragraphCount": 22
},
"modified": 1704931087,
"excerpt": "Scientists call for a sustained, national program to explore and better understand the hidden world of microbes.",
"headData": {
"twImgId": "",
"twTitle": "",
"ogTitle": "",
"ogImgId": "",
"twDescription": "",
"description": "Scientists call for a sustained, national program to explore and better understand the hidden world of microbes.",
"title": "What's Left to Discover About Microbes? Pretty Much Everything | KQED",
"ogDescription": "",
"schema": {
"@context": "https://schema.org",
"@type": "Article",
"headline": "What's Left to Discover About Microbes? Pretty Much Everything",
"datePublished": "2015-11-05T06:00:46-08:00",
"dateModified": "2024-01-10T15:58:07-08:00",
"image": "https://cdn.kqed.org/wp-content/uploads/2020/02/KQED-OG-Image@1x.png"
}
},
"guestAuthors": [],
"slug": "whats-left-to-discover-about-microbes-pretty-much-everything",
"status": "publish",
"sticky": false,
"path": "/science/341056/whats-left-to-discover-about-microbes-pretty-much-everything",
"audioTrackLength": null,
"parsedContent": [
{
"type": "contentString",
"content": "\u003cdiv class=\"post-body\">\u003cp>\u003cp>Last week a group of 48 scientists, in the prestigious journal Science, urged America to \u003ca href=\"http://www.sciencemag.org/content/350/6260/507.full\">launch a national project to study microbes\u003c/a>. The next day, eminent scientists commenting in Nature, a journal of like prestige, said \u003ca href=\"http://www.nature.com/news/microbiology-create-a-global-microbiome-effort-1.18636\">we should launch a \u003ci>worldwide\u003c/i> effort\u003c/a> to study microbes.\u003c/p>\n\u003caside class=\"pullquote alignright\">‘We will never escape our microbial cradle.’\u003ccite>David Montgomery and Anne Biklé\u003c/cite>\u003c/aside>\n\u003cp>This is not a farfetched idea. If you put all life on Earth upon a scale, the weight of microbes would exceed all the rest put together. Microbes are within us and around us. We cannot survive without them.\u003c/p>\n\u003cp>In “\u003ca href=\"http://books.wwnorton.com/books/The-Hidden-Half-of-Nature/\" target=\"_blank\" rel=\"noopener\">The Hidden Half of Nature\u003c/a>,” geologist David Montgomery and biologist Anne Biklé underscore the importance of microbes. “Consider the many microbial landscapes composing our bodies, from the river valley of our gut, to forests of hair, dry toenail deserts, and the skies of our eyes. These places have a multitude of interacting inhabitants and are as dynamic as any other ecosystem on Earth.”\u003c/p>\n\u003cp>\u003cb>Microbes: From Curiosities to Powerhouses\u003c/b>\u003c/p>\n\u003cp>The invisible world of microbes was unknown until the 1600s, when Antonie van Leeuwenhoek devised a powerful microscope. Whatever he put under its lens — rainwater, the plaque from his teeth, cheese — he found it teeming with “animalcules,” tiny living things.\u003c/p>\n\u003cp>\u003c/p>\u003c/div>",
"attributes": {
"named": {},
"numeric": []
}
},
{
"type": "component",
"content": "",
"name": "ad",
"attributes": {
"named": {
"label": "fullwidth"
},
"numeric": [
"fullwidth"
]
}
},
{
"type": "contentString",
"content": "\u003cdiv class=\"post-body\">\u003cp>\u003c/p>\n\u003cp>In the 1800s, Louis Pasteur showed that microbes called yeasts are essential for fermenting wine and beer. He proved that microbes are responsible for souring milk and decomposing meat. Sterilization and isolation of pure microbial cultures were great advances in feeding the world.\u003c/p>\n\u003cfigure id=\"attachment_341360\" class=\"wp-caption alignleft\" style=\"max-width: 419px\">\u003ca href=\"http://ww2.kqed.org/science/wp-content/uploads/sites/35/2015/11/microbiome-study-1.jpg\">\u003cimg loading=\"lazy\" decoding=\"async\" class=\" wp-image-341360\" src=\"http://ww2.kqed.org/science/wp-content/uploads/sites/35/2015/11/microbiome-study-1-800x450.jpg\" alt=\"Microbiologist Amy Charkowski and graduate student Abdulah Harris observe the microscopic view of an alfalfa sprout root that has been experimentally contaminated with Salmonella. The microbes show up green or blue on the screen.\" width=\"419\" height=\"235\" srcset=\"https://cdn.kqed.org/wp-content/uploads/sites/35/2015/11/microbiome-study-1-800x450.jpg 800w, https://cdn.kqed.org/wp-content/uploads/sites/35/2015/11/microbiome-study-1-400x225.jpg 400w, https://cdn.kqed.org/wp-content/uploads/sites/35/2015/11/microbiome-study-1-960x540.jpg 960w, https://cdn.kqed.org/wp-content/uploads/sites/35/2015/11/microbiome-study-1.jpg 1000w\" sizes=\"(max-width: 419px) 100vw, 419px\">\u003c/a>\u003cfigcaption class=\"wp-caption-text\">Microbiologist Amy Charkowski of the University of Wisconsin-Madison and graduate student Abdulah Harris observe the microscopic view of an alfalfa sprout root that has been experimentally contaminated with Salmonella. The microbes show up green or blue on the screen. \u003ccite>(Scott Bauer/U.S. Dept Agriculture)\u003c/cite>\u003c/figcaption>\u003c/figure>\n\u003cp>Later we learned that other microbes have the power to cause disease. This time, sterile practices and isolation revolutionized medicine.\u003c/p>\n\u003cp>Given this history, many people think of microbes only as germs to be eradicated. But recent research shows that communities of diverse microbes form invisible ecosystems, called microbiomes, supporting the ecosystems of the visible world — forests, lakes, agricultural fields and us.\u003c/p>\n\u003cp>In my own field of geology, we’ve learned that microbes are crucial agents in weathering rocks, depositing ores and preserving fossils. We’ve learned that microbes, the oldest form of life, were responsible for putting oxygen in the atmosphere over 2 billion years ago. “We will never escape our microbial cradle,” Montgomery and Biklé write.\u003c/p>\n\u003cp>Everywhere we look, we find a dizzying expanse of microbial mystery. Our very life — soil productivity, human health, global climate and more — is intimately tied to this universe of microbiomes.\u003c/p>\n\u003cp>\u003cb>Studying Our ‘Microbial Cradle’\u003c/b>\u003c/p>\n\u003cp>We know as much about microbes today as we knew about the sky before telescopes. Our current tools for sequencing DNA, familiar for solving crimes and studying our ancestries, are the equivalent of Leeuwenhoek’s first microscope.\u003c/p>\n\u003cfigure id=\"attachment_341366\" class=\"wp-caption alignright\" style=\"max-width: 640px\">\u003ca href=\"http://ww2.kqed.org/science/wp-content/uploads/sites/35/2015/11/5927204872_5a6d669faf_o.jpg\">\u003cimg loading=\"lazy\" decoding=\"async\" class=\"size-full wp-image-341366\" src=\"http://ww2.kqed.org/science/wp-content/uploads/sites/35/2015/11/5927204872_5a6d669faf_o.jpg\" alt=\"This scanning electron micrograph shows MRSA, methicillin-resistant Staphylococcus aureus bacteria (the yellow, round items), killing and escaping from a human white cell. \" width=\"640\" height=\"611\" srcset=\"https://cdn.kqed.org/wp-content/uploads/sites/35/2015/11/5927204872_5a6d669faf_o.jpg 640w, https://cdn.kqed.org/wp-content/uploads/sites/35/2015/11/5927204872_5a6d669faf_o-400x382.jpg 400w, https://cdn.kqed.org/wp-content/uploads/sites/35/2015/11/5927204872_5a6d669faf_o-32x32.jpg 32w\" sizes=\"(max-width: 640px) 100vw, 640px\">\u003c/a>\u003cfigcaption class=\"wp-caption-text\">This scanning electron micrograph shows MRSA, methicillin-resistant Staphylococcus aureus bacteria (the yellow, round items), killing and escaping from a human white cell. \u003ccite>(NIAID)\u003c/cite>\u003c/figcaption>\u003c/figure>\n\u003cp>When we turn those tools upon ordinary soil, we find it swarming with genetic material, but we recognize less than 1 percent of it. The same is true of the microbiome inside the human gut. The same is true of seawater.\u003c/p>\n\u003cp>The authors of \u003ca href=\"http://www.sciencemag.org/content/350/6260/507.full\">the Science paper\u003c/a>, therefore, propose “an interdisciplinary Unified Microbiome Initiative to discover and advance tools to understand and harness the capabilities of Earth’s microbial ecosystems.”\u003c/p>\n\u003cp>For example, better technologies could tell us what specific genes do, sequence the DNA of individual microbes, decode the “chemical conversations” in microbial communities and experiment on lab-based microbiomes.\u003c/p>\n\u003cp>\u003cb>Improve Health, Replenish Soil\u003c/b>\u003c/p>\n\u003cp>It’s likely the first targets of this microbiome research will center on human health. Montgomery and Biklé say the proposed initiative will help us better understand “the unintended scrambling of the human microbiome through drugs like antibiotics, low-fiber diets, and other factors.”\u003c/p>\n\u003cp>Replenishing the world’s soil is another worthy target that can help us draw down the greenhouse gases from the atmosphere. The carbon sequestered in soils outweighs all the living mass in plants and animals. Thus increasing the organic matter in soil will rely on learning to work well with microbes.\u003c/p>\n\u003cp>Success in those fields will help us meet the greater challenge of the oceans. It’s a virtually infinite space filled with species we’ve barely begun to count, plus free-floating genes that can move between microbial species. It has evolved for billions of years. You could call the ocean Earth’s gut. As geology, biology and climatology converge in the study of the past and present ocean, microbiome studies will have a scientific payoff for centuries to come.\u003c/p>\n\u003cp>\u003c/p>\n\u003cp>“We and the planet will be a lot better off the sooner we embrace and work with, rather than against, microbiomes,” Montgomery and Biklé say. “It may be our best way yet of gaining headway on some of humanity’s long-standing conflicts with the natural world of which we are a part.”\u003c/p>\n\n\u003c/div>\u003c/p>",
"attributes": {
"named": {},
"numeric": []
}
}
],
"link": "/science/341056/whats-left-to-discover-about-microbes-pretty-much-everything",
"authors": [
"6228"
],
"categories": [
"science_30",
"science_31",
"science_38"
],
"tags": [
"science_194"
],
"featImg": "science_341359",
"label": "science"
},
"science_284657": {
"type": "posts",
"id": "science_284657",
"meta": {
"index": "posts_1716263798",
"site": "science",
"id": "284657",
"score": null,
"sort": [
1443635322000
]
},
"parent": 0,
"labelTerm": {
"site": "science"
},
"blocks": [],
"publishDate": 1443635322,
"format": "standard",
"title": "California Climate Change Policy: What's Coming Up",
"headTitle": "California Climate Change Policy: What’s Coming Up | KQED",
"content": "\u003cp>The Legislature may have scuttled the centerpiece of Gov. Jerry Brown’s climate change plans, but it still approved ambitious new environmental policies that will impact the economy and life of Californians.\u003c/p>\n\u003cp>“This is a long trek forward to change the very basis of our industrial economy,” Brown said last week. “And I think we’re making tremendous progress.”In coming years, the new \u003ca href=\"http://www.leginfo.ca.gov/pub/15-16/bill/sen/sb_0301-0350/sb_350_bill_20150911_enrolled.htm\" target=\"_blank\" rel=\"noopener\">legislation\u003c/a> means California’s homes and buildings are expected to use dramatically less electricity and the \u003ca href=\"http://calmatters.org/articles/california-pushes-forward-on-renewable-power/\">power grid will increase its share of renewable energy\u003c/a>. Brown also hopes to achieve much of what the Legislature rejected through \u003ca href=\"http://calmatters.org/articles/california-climate-change-policy-overview/\">executive orders and regulations\u003c/a>. That will mean more electric cars on the road and increased use of biofuels, as part of a far-reaching effort to slash greenhouse gas emissions.\u003c/p>\n\u003cp>In the legislative session that ended on Sept. 11, lawmakers halted a bill that would have mandated deep greenhouse gas emissions cuts by the year 2050. They also failed to extend the state’s carbon-limiting \u003ca href=\"http://calmatters.org/articles/cap-and-trade-is-california-a-leader-or-a-loner/\">cap-and-trade program\u003c/a>, which may otherwise expire in 2020.\u003c/p>\n\u003cp>Most contentious of all was a bid to \u003ca href=\"http://calmatters.org/articles/can-california-cut-gasoline-use-in-half-in-15-years-probably-not/\">slash petroleum use in motor vehicles in half by 2030\u003c/a>. That idea got dropped after the oil industry launched a \u003ca href=\"http://calmatters.org/articles/ad-blitz-heats-up-climate-change-fight/\">vigorous advertising campaign in opposition\u003c/a>, and some Democrats in the state Assembly shied away.\u003c/p>\n\u003cp>\u003cstrong>Landmark Measure Passed\u003c/strong>\u003c/p>\n\u003cp>[ad fullwidth]\u003c/p>\n\u003cp>Still, Brown and Senate President pro Tem \u003ca href=\"http://calmatters.org/articles/climate-soulmates/\">Kevin de León\u003c/a> (D-Los Angeles) will bring almost unparalleled accomplishments to a major international climate-change conference in Paris this December.\u003c/p>\n\u003cp>Lawmakers passed and sent to the governor a landmark measure, carried by de León, to require electric power providers to get half of their electricity from renewable sources by 2030 (currently they are required to get 33 percent by 2020). It’s a target that’s stricter than all but a few states. Brown is expected to sign the legislation by the Oct. 11 deadline.\u003c/p>\n\u003cp>The renewable energy goal means that electricity providers must invest in more wind farms and large-scale solar plants as well as new transmission infrastructure. Currently, the three major utilities in the state – Pacific Gas & Electric, Southern California Edison and San Diego Gas & Electric — each get more than 20 percent of their electricity from renewables.\u003c/p>\n\u003cp>The Public Utilities Commission has not yet studied how the 50 percent target might affect consumers’ electric rates. Terrie Prosper, a commission spokeswoman, said the marginal cost should be minimal “if new technologies like storage and electric vehicles can be effectively used to integrate renewable resources.”\u003c/p>\n\u003cp>The renewable energy bill also calls for new and existing buildings across the state to become, collectively, twice as energy efficient by 2030. This \u003ca href=\"http://docketpublic.energy.ca.gov/PublicDocuments/15-IEPR-05/TN205919_20150828T153953_Existing_Buildings_Energy_Efficiency_Action_Plan.pdf\" target=\"_blank\" rel=\"noopener\">means\u003c/a> that Californians can expect to get more information about their homes’ energy usage, a helpful tool for homebuyers among others. It is also likely to be easier to find and use incentives like rebates to make homes more efficient. Energy-use standards for electronic appliances may also continue to tighten.\u003c/p>\n\u003cp>“It is a very big goal,” said Dennis Murphy of the US Green Building Council’s California branch, who noted that the state already was far more energy-efficient than most of the nation. Churches, schools and office buildings will be affected as well as homes, he said.\u003c/p>\n\u003cp>The third leg of de León’s bill, known as Senate Bill 350, would have required the state to cut petroleum usage in motor vehicles in half by 2030. That portion got removed from the final bill. But Brown said last week that the California Air Resources Board, which would have taken charge of the petroleum mandate had it passed, would work toward a lower-petroleum future anyhow.\u003c/p>\n\u003cp>“The only thing we don’t have is a formal statement in law of a 50 percent goal,” Brown said. “But the ARB is committed to that 50 percent goal, and I am committed to backing them up.”\u003c/p>\n\u003cp>Last week, the air board readopted a major rule known as the low-carbon fuel standard that requires producers of transportation fuels such as gasoline and diesel to make their products 10 percent less carbon-intensive by 2020.\u003c/p>\n\u003cp>\u003cstrong>Executive Orders\u003cbr>\n\u003c/strong>\u003c/p>\n\u003cp>The air board is already planning for long-term greenhouse gas emissions cuts to comply with executive orders issued by Brown and his predecessor, former Gov. Arnold Schwarzenegger. The executive orders \u003ca href=\"http://calmatters.org/articles/how-hard-will-it-be-to-meet-2030-and-2050-greenhouse-gas-reduction-goals/\">require emissions reductions of 40 percent below 1990 levels by 2030 and 80 percent below 1990 levels by 2050\u003c/a>. These cuts will have impacts for many sectors, prompting industrial plants and even perhaps farms to cut their greenhouse gas output.\u003c/p>\n\u003cp>A bill would have codified those goals into law, which would preserve the goal in statute no matter who succeeds Brown as governor.\u003c/p>\n\u003cp>“It’s not really set in stone. It’s an executive order,” said Ethan Elkind, a climate expert affiliated with the laws schools of the University of California, Berkeley and UCLA. He added that some groups may not follow those orders the way they would legislation.\u003c/p>\n\u003cp>But assuming the air board crafts policies to comply with the executive orders, that should effectively mean a close to 50 percent cut in petroleum use, said Simon Mui of the Natural Resources Defense Council — on the order, in other words, of what de León and Brown originally outlined.\u003c/p>\n\u003cp>Indeed, despite Brown’s fury at the oil companies, the air board may not be able to enact petroleum cuts directly, in the absence of legislative action.\u003c/p>\n\u003cp>The Air Resources Board “has pretty broad authority over air emissions, but I don’t think that translates into a direct ability to reduce petroleum,” said Brian Cragg, an attorney with the San Francisco firm Goodin, MacBride, Squeri & Day. “They would have to try to find some tie to air emissions…that would result in a reduction.”\u003c/p>\n\u003cp>Air board spokesman Dave Clegern said in an e-mail that the agency does not comment on legislation. However, “broadly we would note that Senate Bill 350 did not expand ARB’s authority, nor was it a directive to create new regulations,” he said.\u003c/p>\n\u003cp>The major programs needed to meet the decarbonizing goals announced this year by the governor are already in place, Clegern said. The air board has crafted policies that include reducing the carbon content of fuels, regulating the emissions from cars and trucks, and rewarding automakers that sell electric vehicles to Californians. The board also runs the cap-and-trade program, which limits carbon across nearly the entire California economy.\u003c/p>\n\u003cp>The air board operates some of its key programs under a landmark piece of legislation passed in 2006, which sought to slash California’s greenhouse gas emissions to 1990 levels by 2020 — a \u003ca href=\"http://calmatters.org/articles/will-california-meet-its-2020-greenhouse-gas-reduction-goal/\">goal that state officials expect to meet in time\u003c/a>.\u003c/p>\n\u003cp>But the air board, which is overseen by a panel of gubernatorial appointees, is also likely to face increased scrutiny from both businesses and lawmakers as it embarks on more ambitious policies whose costs have yet to be determined, including those that affect petroleum. New \u003ca href=\"http://www.leginfo.ca.gov/pub/15-16/bill/asm/ab_1251-1300/ab_1288_bill_20150914_enrolled.htm\" target=\"_blank\" rel=\"noopener\">legislation\u003c/a>provides that the Senate and the Assembly will now each appoint one member of the agency.\u003c/p>\n\u003cp>“There’s going to be a lot more attention paid to what strategies that we have available, including, like, litigation, to be able to address [regulatory] decisions, if we don’t think they’re fair and balanced,” said Rob Lapsley, president of the California Business Roundtable.\u003c/p>\n\u003cp>[ad floatright]\u003c/p>\n\u003cp>Lawmakers, some of whom toyed with the idea of curbing the air board’s power during the recent session, will also take a more active role in the watching and overseeing the agency, Lapsley said.\u003c/p>\n\n",
"stats": {
"hasVideo": false,
"hasChartOrMap": false,
"hasAudio": false,
"hasPolis": false,
"wordCount": 1324,
"hasGoogleForm": false,
"hasGallery": false,
"hasHearkenModule": false,
"iframeSrcs": [],
"paragraphCount": 29
},
"modified": 1704931246,
"excerpt": "The Legislature may have scuttled the centerpiece of Gov. Jerry Brown’s climate change plans, but it still approved ambitious new policies.",
"headData": {
"twImgId": "",
"twTitle": "",
"ogTitle": "",
"ogImgId": "",
"twDescription": "",
"description": "The Legislature may have scuttled the centerpiece of Gov. Jerry Brown’s climate change plans, but it still approved ambitious new policies.",
"title": "California Climate Change Policy: What's Coming Up | KQED",
"ogDescription": "",
"schema": {
"@context": "https://schema.org",
"@type": "Article",
"headline": "California Climate Change Policy: What's Coming Up",
"datePublished": "2015-09-30T10:48:42-07:00",
"dateModified": "2024-01-10T16:00:46-08:00",
"image": "https://cdn.kqed.org/wp-content/uploads/2020/02/KQED-OG-Image@1x.png"
}
},
"guestAuthors": [],
"slug": "despite-setbacks-california-climate-policy-still-ambitious",
"status": "publish",
"nprByline": "Kate Galbraith\u003cbr>CALmatters",
"sticky": false,
"path": "/science/284657/despite-setbacks-california-climate-policy-still-ambitious",
"audioTrackLength": null,
"parsedContent": [
{
"type": "contentString",
"content": "\u003cdiv class=\"post-body\">\u003cp>\u003cp>The Legislature may have scuttled the centerpiece of Gov. Jerry Brown’s climate change plans, but it still approved ambitious new environmental policies that will impact the economy and life of Californians.\u003c/p>\n\u003cp>“This is a long trek forward to change the very basis of our industrial economy,” Brown said last week. “And I think we’re making tremendous progress.”In coming years, the new \u003ca href=\"http://www.leginfo.ca.gov/pub/15-16/bill/sen/sb_0301-0350/sb_350_bill_20150911_enrolled.htm\" target=\"_blank\" rel=\"noopener\">legislation\u003c/a> means California’s homes and buildings are expected to use dramatically less electricity and the \u003ca href=\"http://calmatters.org/articles/california-pushes-forward-on-renewable-power/\">power grid will increase its share of renewable energy\u003c/a>. Brown also hopes to achieve much of what the Legislature rejected through \u003ca href=\"http://calmatters.org/articles/california-climate-change-policy-overview/\">executive orders and regulations\u003c/a>. That will mean more electric cars on the road and increased use of biofuels, as part of a far-reaching effort to slash greenhouse gas emissions.\u003c/p>\n\u003cp>In the legislative session that ended on Sept. 11, lawmakers halted a bill that would have mandated deep greenhouse gas emissions cuts by the year 2050. They also failed to extend the state’s carbon-limiting \u003ca href=\"http://calmatters.org/articles/cap-and-trade-is-california-a-leader-or-a-loner/\">cap-and-trade program\u003c/a>, which may otherwise expire in 2020.\u003c/p>\n\u003cp>Most contentious of all was a bid to \u003ca href=\"http://calmatters.org/articles/can-california-cut-gasoline-use-in-half-in-15-years-probably-not/\">slash petroleum use in motor vehicles in half by 2030\u003c/a>. That idea got dropped after the oil industry launched a \u003ca href=\"http://calmatters.org/articles/ad-blitz-heats-up-climate-change-fight/\">vigorous advertising campaign in opposition\u003c/a>, and some Democrats in the state Assembly shied away.\u003c/p>\n\u003cp>\u003cstrong>Landmark Measure Passed\u003c/strong>\u003c/p>\n\u003cp>\u003c/p>\u003c/div>",
"attributes": {
"named": {},
"numeric": []
}
},
{
"type": "component",
"content": "",
"name": "ad",
"attributes": {
"named": {
"label": "fullwidth"
},
"numeric": [
"fullwidth"
]
}
},
{
"type": "contentString",
"content": "\u003cdiv class=\"post-body\">\u003cp>\u003c/p>\n\u003cp>Still, Brown and Senate President pro Tem \u003ca href=\"http://calmatters.org/articles/climate-soulmates/\">Kevin de León\u003c/a> (D-Los Angeles) will bring almost unparalleled accomplishments to a major international climate-change conference in Paris this December.\u003c/p>\n\u003cp>Lawmakers passed and sent to the governor a landmark measure, carried by de León, to require electric power providers to get half of their electricity from renewable sources by 2030 (currently they are required to get 33 percent by 2020). It’s a target that’s stricter than all but a few states. Brown is expected to sign the legislation by the Oct. 11 deadline.\u003c/p>\n\u003cp>The renewable energy goal means that electricity providers must invest in more wind farms and large-scale solar plants as well as new transmission infrastructure. Currently, the three major utilities in the state – Pacific Gas & Electric, Southern California Edison and San Diego Gas & Electric — each get more than 20 percent of their electricity from renewables.\u003c/p>\n\u003cp>The Public Utilities Commission has not yet studied how the 50 percent target might affect consumers’ electric rates. Terrie Prosper, a commission spokeswoman, said the marginal cost should be minimal “if new technologies like storage and electric vehicles can be effectively used to integrate renewable resources.”\u003c/p>\n\u003cp>The renewable energy bill also calls for new and existing buildings across the state to become, collectively, twice as energy efficient by 2030. This \u003ca href=\"http://docketpublic.energy.ca.gov/PublicDocuments/15-IEPR-05/TN205919_20150828T153953_Existing_Buildings_Energy_Efficiency_Action_Plan.pdf\" target=\"_blank\" rel=\"noopener\">means\u003c/a> that Californians can expect to get more information about their homes’ energy usage, a helpful tool for homebuyers among others. It is also likely to be easier to find and use incentives like rebates to make homes more efficient. Energy-use standards for electronic appliances may also continue to tighten.\u003c/p>\n\u003cp>“It is a very big goal,” said Dennis Murphy of the US Green Building Council’s California branch, who noted that the state already was far more energy-efficient than most of the nation. Churches, schools and office buildings will be affected as well as homes, he said.\u003c/p>\n\u003cp>The third leg of de León’s bill, known as Senate Bill 350, would have required the state to cut petroleum usage in motor vehicles in half by 2030. That portion got removed from the final bill. But Brown said last week that the California Air Resources Board, which would have taken charge of the petroleum mandate had it passed, would work toward a lower-petroleum future anyhow.\u003c/p>\n\u003cp>“The only thing we don’t have is a formal statement in law of a 50 percent goal,” Brown said. “But the ARB is committed to that 50 percent goal, and I am committed to backing them up.”\u003c/p>\n\u003cp>Last week, the air board readopted a major rule known as the low-carbon fuel standard that requires producers of transportation fuels such as gasoline and diesel to make their products 10 percent less carbon-intensive by 2020.\u003c/p>\n\u003cp>\u003cstrong>Executive Orders\u003cbr>\n\u003c/strong>\u003c/p>\n\u003cp>The air board is already planning for long-term greenhouse gas emissions cuts to comply with executive orders issued by Brown and his predecessor, former Gov. Arnold Schwarzenegger. The executive orders \u003ca href=\"http://calmatters.org/articles/how-hard-will-it-be-to-meet-2030-and-2050-greenhouse-gas-reduction-goals/\">require emissions reductions of 40 percent below 1990 levels by 2030 and 80 percent below 1990 levels by 2050\u003c/a>. These cuts will have impacts for many sectors, prompting industrial plants and even perhaps farms to cut their greenhouse gas output.\u003c/p>\n\u003cp>A bill would have codified those goals into law, which would preserve the goal in statute no matter who succeeds Brown as governor.\u003c/p>\n\u003cp>“It’s not really set in stone. It’s an executive order,” said Ethan Elkind, a climate expert affiliated with the laws schools of the University of California, Berkeley and UCLA. He added that some groups may not follow those orders the way they would legislation.\u003c/p>\n\u003cp>But assuming the air board crafts policies to comply with the executive orders, that should effectively mean a close to 50 percent cut in petroleum use, said Simon Mui of the Natural Resources Defense Council — on the order, in other words, of what de León and Brown originally outlined.\u003c/p>\n\u003cp>Indeed, despite Brown’s fury at the oil companies, the air board may not be able to enact petroleum cuts directly, in the absence of legislative action.\u003c/p>\n\u003cp>The Air Resources Board “has pretty broad authority over air emissions, but I don’t think that translates into a direct ability to reduce petroleum,” said Brian Cragg, an attorney with the San Francisco firm Goodin, MacBride, Squeri & Day. “They would have to try to find some tie to air emissions…that would result in a reduction.”\u003c/p>\n\u003cp>Air board spokesman Dave Clegern said in an e-mail that the agency does not comment on legislation. However, “broadly we would note that Senate Bill 350 did not expand ARB’s authority, nor was it a directive to create new regulations,” he said.\u003c/p>\n\u003cp>The major programs needed to meet the decarbonizing goals announced this year by the governor are already in place, Clegern said. The air board has crafted policies that include reducing the carbon content of fuels, regulating the emissions from cars and trucks, and rewarding automakers that sell electric vehicles to Californians. The board also runs the cap-and-trade program, which limits carbon across nearly the entire California economy.\u003c/p>\n\u003cp>The air board operates some of its key programs under a landmark piece of legislation passed in 2006, which sought to slash California’s greenhouse gas emissions to 1990 levels by 2020 — a \u003ca href=\"http://calmatters.org/articles/will-california-meet-its-2020-greenhouse-gas-reduction-goal/\">goal that state officials expect to meet in time\u003c/a>.\u003c/p>\n\u003cp>But the air board, which is overseen by a panel of gubernatorial appointees, is also likely to face increased scrutiny from both businesses and lawmakers as it embarks on more ambitious policies whose costs have yet to be determined, including those that affect petroleum. New \u003ca href=\"http://www.leginfo.ca.gov/pub/15-16/bill/asm/ab_1251-1300/ab_1288_bill_20150914_enrolled.htm\" target=\"_blank\" rel=\"noopener\">legislation\u003c/a>provides that the Senate and the Assembly will now each appoint one member of the agency.\u003c/p>\n\u003cp>“There’s going to be a lot more attention paid to what strategies that we have available, including, like, litigation, to be able to address [regulatory] decisions, if we don’t think they’re fair and balanced,” said Rob Lapsley, president of the California Business Roundtable.\u003c/p>\n\u003cp>\u003c/p>\u003c/div>",
"attributes": {
"named": {},
"numeric": []
}
},
{
"type": "component",
"content": "",
"name": "ad",
"attributes": {
"named": {
"label": "floatright"
},
"numeric": [
"floatright"
]
}
},
{
"type": "contentString",
"content": "\u003cdiv class=\"post-body\">\u003cp>\u003c/p>\n\u003cp>Lawmakers, some of whom toyed with the idea of curbing the air board’s power during the recent session, will also take a more active role in the watching and overseeing the agency, Lapsley said.\u003c/p>\n\n\u003c/div>\u003c/p>",
"attributes": {
"named": {},
"numeric": []
}
}
],
"link": "/science/284657/despite-setbacks-california-climate-policy-still-ambitious",
"authors": [
"byline_science_284657"
],
"categories": [
"science_31",
"science_40"
],
"tags": [
"science_194"
],
"featImg": "science_10732",
"label": "science"
},
"science_185601": {
"type": "posts",
"id": "science_185601",
"meta": {
"index": "posts_1716263798",
"site": "science",
"id": "185601",
"score": null,
"sort": [
1439584685000
]
},
"parent": 0,
"labelTerm": {
"site": "science"
},
"blocks": [],
"publishDate": 1439584685,
"format": "image",
"title": "It's Official: Don't Blame the Sun for Climate Change",
"headTitle": "It’s Official: Don’t Blame the Sun for Climate Change | KQED",
"content": "\u003cp>New information about the energy output of the sun appears to contradict the claim, made by climate skeptics, that the sun is responsible for global warming. That idea relied on apparent evidence showing a rise in solar activity since 1800. But \u003ca href=\"http://www.sidc.be/silso/\">newly revised data\u003c/a>, published in July, suggests instead that our yardstick of solar activity was warped. \u003c/p>\n\u003cp>Today scientists observe the sun 24 hours a day using \u003ca href=\"http://soho.nascom.nasa.gov/spaceweather/\">satellites in deep space\u003c/a> and solar telescopes on the ground. However, for historical data from before the 1980s, our best information on the activity of the sun has come from counting sunspots, a paper-and-pencil statistic determined by human eyes.\u003c/p>\n\u003cp>\u003cb>Sunspots and the Sunspot Number\u003c/b>\u003c/p>\n\u003cp>\u003ca href=\"http://www.swpc.noaa.gov/phenomena/sunspotssolar-cycle\">Sunspots\u003c/a> are peculiar magnetic storms on the sun’s surface that appear like dark spots in comparison to the blinding gas around them. Large sunspots can be seen with the naked eye (although that’s not advisable, since you could damage your eye). But scientific observations had to await the invention of the telescope in the early 1600s. Galileo, the first person to turn a telescope toward the sky, made many careful drawings of the sun with sunspots on it.\u003c/p>\n\u003cfigure id=\"attachment_186676\" class=\"wp-caption alignright\" style=\"max-width: 720px\">\u003ca href=\"http://ww2.kqed.org/science/wp-content/uploads/sites/35/2015/08/Galileo-sunspot.jpg\">\u003cimg loading=\"lazy\" decoding=\"async\" src=\"http://ww2.kqed.org/science/wp-content/uploads/sites/35/2015/08/Galileo-sunspot.jpg\" alt=\"Galileo sun drawing\" width=\"720\" height=\"720\" class=\"size-full wp-image-186676\" srcset=\"https://cdn.kqed.org/wp-content/uploads/sites/35/2015/08/Galileo-sunspot.jpg 720w, https://cdn.kqed.org/wp-content/uploads/sites/35/2015/08/Galileo-sunspot-400x400.jpg 400w, https://cdn.kqed.org/wp-content/uploads/sites/35/2015/08/Galileo-sunspot-32x32.jpg 32w, https://cdn.kqed.org/wp-content/uploads/sites/35/2015/08/Galileo-sunspot-64x64.jpg 64w, https://cdn.kqed.org/wp-content/uploads/sites/35/2015/08/Galileo-sunspot-96x96.jpg 96w, https://cdn.kqed.org/wp-content/uploads/sites/35/2015/08/Galileo-sunspot-128x128.jpg 128w, https://cdn.kqed.org/wp-content/uploads/sites/35/2015/08/Galileo-sunspot-75x75.jpg 75w\" sizes=\"(max-width: 720px) 100vw, 720px\">\u003c/a>\u003cfigcaption class=\"wp-caption-text\">Galileo made this drawing of the sun on June 23, 1613, showing sunspots. \u003ccite>(The Galileo Project/M. Kornmesser)\u003c/cite>\u003c/figcaption>\u003c/figure>\n\u003cp>Sunspot counting was formalized in the 1840s by a Swiss astronomer named Rudolf Wolf, who began tracking them daily at the Zurich Observatory. Scientists had just discovered the sun’s 11-year cycle in which sunspot activity waxes and wanes. Wolf saw the need for a long and consistent record of them, and extended the record back in time using earlier sunspot reports. Counting groups of sunspots as ten and each individual spot as one, he devised a simple number that he could easily update every day the sun was out.\u003c/p>\n\u003cp>[ad fullwidth]\u003c/p>\n\u003cp>The Wolf Sunspot Number, determined every day since Wolf’s time by a worldwide group of astronomers, has become a fundamental tool of climate science. Extending from the first telescope observations in 1610 to today, it’s the longest set of solar data in science. \u003c/p>\n\u003cp>\u003cb>Still Relevant Today\u003c/b>\u003c/p>\n\u003cp>It turns out sunspots are a fairly good index of the sun’s total energy output, and sunspot data are used for many purposes. Sunspot counts are a gauge of the sun’s long-term behavior, the speed of the solar wind in outer space and the strength of the sun’s magnetic field — a set of natural activities summed up as \u003ca href=\"http://www.swpc.noaa.gov/communities/space-weather-enthusiasts\">space weather\u003c/a>. \u003c/p>\n\u003cp>The sun’s energy output also affects the height of the atmosphere. An active sun heats up and expands the uppermost atmosphere, affecting low-flying satellites. The U.S. Air Force, which manages a fleet of satellites, is among the federal agencies keenly interested in all these topics. \u003c/p>\n\u003cfigure id=\"attachment_186677\" class=\"wp-caption alignleft\" style=\"max-width: 800px\">\u003ca href=\"http://ww2.kqed.org/science/wp-content/uploads/sites/35/2015/08/SGN-record.png\">\u003cimg loading=\"lazy\" decoding=\"async\" src=\"http://ww2.kqed.org/science/wp-content/uploads/sites/35/2015/08/SGN-record-800x340.png\" alt=\"Group Sunspot Number (not Wolf Sunspot Number)\" width=\"800\" height=\"340\" class=\"size-medium wp-image-186677\" srcset=\"https://cdn.kqed.org/wp-content/uploads/sites/35/2015/08/SGN-record-800x340.png 800w, https://cdn.kqed.org/wp-content/uploads/sites/35/2015/08/SGN-record-400x170.png 400w, https://cdn.kqed.org/wp-content/uploads/sites/35/2015/08/SGN-record-960x408.png 960w, https://cdn.kqed.org/wp-content/uploads/sites/35/2015/08/SGN-record.png 1000w\" sizes=\"(max-width: 800px) 100vw, 800px\">\u003c/a>\u003cfigcaption class=\"wp-caption-text\">Sunspot numbers for the last 400 years appear to show a recent rise in solar activity. The newly revised record eliminates this bulge. \u003ccite>(Global Warming Art Project)\u003c/cite>\u003c/figcaption>\u003c/figure>\n\u003cp>In researching Earth’s climate, sunspot numbers are the best tool we have to help correlate modern satellite data with other forms of evidence from the ancient and geological past. \u003c/p>\n\u003cp>Some climate scientists have used different versions of the sunspot record to argue that the sun has been growing more active since around 1800, entering what they call a Solar Grand Maximum. Skeptics of climate change have seized on this idea to downplay the role of greenhouse gases in global warming, a stand contrary to the universal consensus of the scientific community. But what if the sunspot number is at fault? \u003c/p>\n\u003cp>In July, a set of solar researchers issued a corrected sunspot record that erases the very concept of a Solar Grand Maximum. Instead the sun appears to have had a steady procession of 11-year cycles, modulated by longer cycles of roughly a century.\u003c/p>\n\u003cp>\u003cb>Problems With the Wolf Number\u003c/b>\u003c/p>\n\u003cp>After Wolf died in 1893, his successors at the Zurich Observatory continued counting the Wolf Sunspot Number. Today Sergio Cortesi, the fifth in line, carries on with this task at the Locarno Observatory, as he has since 1957. But like any observation that depends on human perceptions, the record collects subtle errors that must be detected and then corrected.\u003c/p>\n\u003cp>Today the sunspot number is overseen by \u003ca href=\"http://sidc.be/silso/home\">Sunspot Index and Long-term Solar Observations\u003c/a> (SILSO), a group at the Royal Observatory of Belgium. SILSO relies on a network of about 60 observers whose observations are carefully compared to Cortesi’s at the Locarno Observatory.\u003c/p>\n\u003cfigure id=\"attachment_186678\" class=\"wp-caption alignright\" style=\"max-width: 600px\">\u003ca href=\"http://ww2.kqed.org/science/wp-content/uploads/sites/35/2015/08/ISN-record.png\">\u003cimg loading=\"lazy\" decoding=\"async\" src=\"http://ww2.kqed.org/science/wp-content/uploads/sites/35/2015/08/ISN-record.png\" alt=\"Corrected Wolf Sunspot record\" width=\"600\" height=\"580\" class=\"size-full wp-image-186678\" srcset=\"https://cdn.kqed.org/wp-content/uploads/sites/35/2015/08/ISN-record.png 600w, https://cdn.kqed.org/wp-content/uploads/sites/35/2015/08/ISN-record-400x387.png 400w, https://cdn.kqed.org/wp-content/uploads/sites/35/2015/08/ISN-record-32x32.png 32w\" sizes=\"(max-width: 600px) 100vw, 600px\">\u003c/a>\u003cfigcaption class=\"wp-caption-text\">The new sunspot record shows no Grand Maximum since 1800. \u003ccite>(SILSO/Royal Observatory of Belgium)\u003c/cite>\u003c/figcaption>\u003c/figure>\n\u003cp>The push to clean up the record started when researchers revisited Wolf’s original data, adding thousands of observations that Wolf had not seen. For instance, Wolf had ignored much of the English-language literature. As they delved into the details, they uncovered enough errors and inconsistencies that it became clear a thorough housecleaning of the data was in order.\u003c/p>\n\u003cp>\u003cb>Fixing a Warped Foundation\u003c/b>\u003c/p>\n\u003cp>The research community gets nervous when someone tries to change one of its fundamental tools, like the \u003ca href=\"http://link.springer.com/article/10.1007/s00190-015-0844-y\">location of the Prime Meridian\u003c/a> or the \u003ca href=\"http://geology.about.com/od/controversies/a/aa022005a.htm\">geological time scale\u003c/a>. Consensus can be slow.\u003c/p>\n\u003cp>Stanford University astrophysicist \u003ca href=\"http://www.leif.org/research/\">Leif Svalgaard\u003c/a> has been a steady force behind reforming the sunspot number, bringing a task force of his scientific peers together at annual conferences for the last five years. \u003c/p>\n\u003cp>Svalgaard argues that the “daisy chain” of observers connecting Wolf to Cortesi is prone to accumulating error. For example, in a review of more than 1,000 solar drawings made by Johann Staudacher between 1749 and 1796, he found Wolf had undercounted the number of sunspot groups by 25 percent.\u003c/p>\n\u003cp>In making a fresh sunspot record, SILSO established a set of the most trustworthy “backbone” observers, those with long records and consistent techniques. And in July, SILSO formally ended the original sunspot number series and issued what it calls \u003ca href=\"http://www.sidc.be/silso/datafiles\">Sunspot Number version 2.0\u003c/a>. \u003c/p>\n\u003cp>\u003c/p>\n\u003cp>A special issue of the journal Solar Physics is in the works that will include dozens of papers, all properly peer-reviewed, to cement this step in scientific concrete. \u003c/p>\n\n",
"stats": {
"hasVideo": false,
"hasChartOrMap": false,
"hasAudio": false,
"hasPolis": false,
"wordCount": 1025,
"hasGoogleForm": false,
"hasGallery": false,
"hasHearkenModule": false,
"iframeSrcs": [],
"paragraphCount": 24
},
"modified": 1704931439,
"excerpt": "A careful cleanup of the 400-year record of sunspots shows the sun is not increasing its energy output.",
"headData": {
"twImgId": "",
"twTitle": "",
"ogTitle": "",
"ogImgId": "",
"twDescription": "",
"description": "A careful cleanup of the 400-year record of sunspots shows the sun is not increasing its energy output.",
"title": "It's Official: Don't Blame the Sun for Climate Change | KQED",
"ogDescription": "",
"schema": {
"@context": "https://schema.org",
"@type": "Article",
"headline": "It's Official: Don't Blame the Sun for Climate Change",
"datePublished": "2015-08-14T13:38:05-07:00",
"dateModified": "2024-01-10T16:03:59-08:00",
"image": "https://cdn.kqed.org/wp-content/uploads/2020/02/KQED-OG-Image@1x.png"
}
},
"guestAuthors": [],
"slug": "its-official-dont-blame-the-sun-for-climate-change",
"status": "publish",
"sticky": false,
"path": "/science/185601/its-official-dont-blame-the-sun-for-climate-change",
"audioTrackLength": null,
"parsedContent": [
{
"type": "contentString",
"content": "\u003cdiv class=\"post-body\">\u003cp>\u003cp>New information about the energy output of the sun appears to contradict the claim, made by climate skeptics, that the sun is responsible for global warming. That idea relied on apparent evidence showing a rise in solar activity since 1800. But \u003ca href=\"http://www.sidc.be/silso/\">newly revised data\u003c/a>, published in July, suggests instead that our yardstick of solar activity was warped. \u003c/p>\n\u003cp>Today scientists observe the sun 24 hours a day using \u003ca href=\"http://soho.nascom.nasa.gov/spaceweather/\">satellites in deep space\u003c/a> and solar telescopes on the ground. However, for historical data from before the 1980s, our best information on the activity of the sun has come from counting sunspots, a paper-and-pencil statistic determined by human eyes.\u003c/p>\n\u003cp>\u003cb>Sunspots and the Sunspot Number\u003c/b>\u003c/p>\n\u003cp>\u003ca href=\"http://www.swpc.noaa.gov/phenomena/sunspotssolar-cycle\">Sunspots\u003c/a> are peculiar magnetic storms on the sun’s surface that appear like dark spots in comparison to the blinding gas around them. Large sunspots can be seen with the naked eye (although that’s not advisable, since you could damage your eye). But scientific observations had to await the invention of the telescope in the early 1600s. Galileo, the first person to turn a telescope toward the sky, made many careful drawings of the sun with sunspots on it.\u003c/p>\n\u003cfigure id=\"attachment_186676\" class=\"wp-caption alignright\" style=\"max-width: 720px\">\u003ca href=\"http://ww2.kqed.org/science/wp-content/uploads/sites/35/2015/08/Galileo-sunspot.jpg\">\u003cimg loading=\"lazy\" decoding=\"async\" src=\"http://ww2.kqed.org/science/wp-content/uploads/sites/35/2015/08/Galileo-sunspot.jpg\" alt=\"Galileo sun drawing\" width=\"720\" height=\"720\" class=\"size-full wp-image-186676\" srcset=\"https://cdn.kqed.org/wp-content/uploads/sites/35/2015/08/Galileo-sunspot.jpg 720w, https://cdn.kqed.org/wp-content/uploads/sites/35/2015/08/Galileo-sunspot-400x400.jpg 400w, https://cdn.kqed.org/wp-content/uploads/sites/35/2015/08/Galileo-sunspot-32x32.jpg 32w, https://cdn.kqed.org/wp-content/uploads/sites/35/2015/08/Galileo-sunspot-64x64.jpg 64w, https://cdn.kqed.org/wp-content/uploads/sites/35/2015/08/Galileo-sunspot-96x96.jpg 96w, https://cdn.kqed.org/wp-content/uploads/sites/35/2015/08/Galileo-sunspot-128x128.jpg 128w, https://cdn.kqed.org/wp-content/uploads/sites/35/2015/08/Galileo-sunspot-75x75.jpg 75w\" sizes=\"(max-width: 720px) 100vw, 720px\">\u003c/a>\u003cfigcaption class=\"wp-caption-text\">Galileo made this drawing of the sun on June 23, 1613, showing sunspots. \u003ccite>(The Galileo Project/M. Kornmesser)\u003c/cite>\u003c/figcaption>\u003c/figure>\n\u003cp>Sunspot counting was formalized in the 1840s by a Swiss astronomer named Rudolf Wolf, who began tracking them daily at the Zurich Observatory. Scientists had just discovered the sun’s 11-year cycle in which sunspot activity waxes and wanes. Wolf saw the need for a long and consistent record of them, and extended the record back in time using earlier sunspot reports. Counting groups of sunspots as ten and each individual spot as one, he devised a simple number that he could easily update every day the sun was out.\u003c/p>\n\u003cp>\u003c/p>\u003c/div>",
"attributes": {
"named": {},
"numeric": []
}
},
{
"type": "component",
"content": "",
"name": "ad",
"attributes": {
"named": {
"label": "fullwidth"
},
"numeric": [
"fullwidth"
]
}
},
{
"type": "contentString",
"content": "\u003cdiv class=\"post-body\">\u003cp>\u003c/p>\n\u003cp>The Wolf Sunspot Number, determined every day since Wolf’s time by a worldwide group of astronomers, has become a fundamental tool of climate science. Extending from the first telescope observations in 1610 to today, it’s the longest set of solar data in science. \u003c/p>\n\u003cp>\u003cb>Still Relevant Today\u003c/b>\u003c/p>\n\u003cp>It turns out sunspots are a fairly good index of the sun’s total energy output, and sunspot data are used for many purposes. Sunspot counts are a gauge of the sun’s long-term behavior, the speed of the solar wind in outer space and the strength of the sun’s magnetic field — a set of natural activities summed up as \u003ca href=\"http://www.swpc.noaa.gov/communities/space-weather-enthusiasts\">space weather\u003c/a>. \u003c/p>\n\u003cp>The sun’s energy output also affects the height of the atmosphere. An active sun heats up and expands the uppermost atmosphere, affecting low-flying satellites. The U.S. Air Force, which manages a fleet of satellites, is among the federal agencies keenly interested in all these topics. \u003c/p>\n\u003cfigure id=\"attachment_186677\" class=\"wp-caption alignleft\" style=\"max-width: 800px\">\u003ca href=\"http://ww2.kqed.org/science/wp-content/uploads/sites/35/2015/08/SGN-record.png\">\u003cimg loading=\"lazy\" decoding=\"async\" src=\"http://ww2.kqed.org/science/wp-content/uploads/sites/35/2015/08/SGN-record-800x340.png\" alt=\"Group Sunspot Number (not Wolf Sunspot Number)\" width=\"800\" height=\"340\" class=\"size-medium wp-image-186677\" srcset=\"https://cdn.kqed.org/wp-content/uploads/sites/35/2015/08/SGN-record-800x340.png 800w, https://cdn.kqed.org/wp-content/uploads/sites/35/2015/08/SGN-record-400x170.png 400w, https://cdn.kqed.org/wp-content/uploads/sites/35/2015/08/SGN-record-960x408.png 960w, https://cdn.kqed.org/wp-content/uploads/sites/35/2015/08/SGN-record.png 1000w\" sizes=\"(max-width: 800px) 100vw, 800px\">\u003c/a>\u003cfigcaption class=\"wp-caption-text\">Sunspot numbers for the last 400 years appear to show a recent rise in solar activity. The newly revised record eliminates this bulge. \u003ccite>(Global Warming Art Project)\u003c/cite>\u003c/figcaption>\u003c/figure>\n\u003cp>In researching Earth’s climate, sunspot numbers are the best tool we have to help correlate modern satellite data with other forms of evidence from the ancient and geological past. \u003c/p>\n\u003cp>Some climate scientists have used different versions of the sunspot record to argue that the sun has been growing more active since around 1800, entering what they call a Solar Grand Maximum. Skeptics of climate change have seized on this idea to downplay the role of greenhouse gases in global warming, a stand contrary to the universal consensus of the scientific community. But what if the sunspot number is at fault? \u003c/p>\n\u003cp>In July, a set of solar researchers issued a corrected sunspot record that erases the very concept of a Solar Grand Maximum. Instead the sun appears to have had a steady procession of 11-year cycles, modulated by longer cycles of roughly a century.\u003c/p>\n\u003cp>\u003cb>Problems With the Wolf Number\u003c/b>\u003c/p>\n\u003cp>After Wolf died in 1893, his successors at the Zurich Observatory continued counting the Wolf Sunspot Number. Today Sergio Cortesi, the fifth in line, carries on with this task at the Locarno Observatory, as he has since 1957. But like any observation that depends on human perceptions, the record collects subtle errors that must be detected and then corrected.\u003c/p>\n\u003cp>Today the sunspot number is overseen by \u003ca href=\"http://sidc.be/silso/home\">Sunspot Index and Long-term Solar Observations\u003c/a> (SILSO), a group at the Royal Observatory of Belgium. SILSO relies on a network of about 60 observers whose observations are carefully compared to Cortesi’s at the Locarno Observatory.\u003c/p>\n\u003cfigure id=\"attachment_186678\" class=\"wp-caption alignright\" style=\"max-width: 600px\">\u003ca href=\"http://ww2.kqed.org/science/wp-content/uploads/sites/35/2015/08/ISN-record.png\">\u003cimg loading=\"lazy\" decoding=\"async\" src=\"http://ww2.kqed.org/science/wp-content/uploads/sites/35/2015/08/ISN-record.png\" alt=\"Corrected Wolf Sunspot record\" width=\"600\" height=\"580\" class=\"size-full wp-image-186678\" srcset=\"https://cdn.kqed.org/wp-content/uploads/sites/35/2015/08/ISN-record.png 600w, https://cdn.kqed.org/wp-content/uploads/sites/35/2015/08/ISN-record-400x387.png 400w, https://cdn.kqed.org/wp-content/uploads/sites/35/2015/08/ISN-record-32x32.png 32w\" sizes=\"(max-width: 600px) 100vw, 600px\">\u003c/a>\u003cfigcaption class=\"wp-caption-text\">The new sunspot record shows no Grand Maximum since 1800. \u003ccite>(SILSO/Royal Observatory of Belgium)\u003c/cite>\u003c/figcaption>\u003c/figure>\n\u003cp>The push to clean up the record started when researchers revisited Wolf’s original data, adding thousands of observations that Wolf had not seen. For instance, Wolf had ignored much of the English-language literature. As they delved into the details, they uncovered enough errors and inconsistencies that it became clear a thorough housecleaning of the data was in order.\u003c/p>\n\u003cp>\u003cb>Fixing a Warped Foundation\u003c/b>\u003c/p>\n\u003cp>The research community gets nervous when someone tries to change one of its fundamental tools, like the \u003ca href=\"http://link.springer.com/article/10.1007/s00190-015-0844-y\">location of the Prime Meridian\u003c/a> or the \u003ca href=\"http://geology.about.com/od/controversies/a/aa022005a.htm\">geological time scale\u003c/a>. Consensus can be slow.\u003c/p>\n\u003cp>Stanford University astrophysicist \u003ca href=\"http://www.leif.org/research/\">Leif Svalgaard\u003c/a> has been a steady force behind reforming the sunspot number, bringing a task force of his scientific peers together at annual conferences for the last five years. \u003c/p>\n\u003cp>Svalgaard argues that the “daisy chain” of observers connecting Wolf to Cortesi is prone to accumulating error. For example, in a review of more than 1,000 solar drawings made by Johann Staudacher between 1749 and 1796, he found Wolf had undercounted the number of sunspot groups by 25 percent.\u003c/p>\n\u003cp>In making a fresh sunspot record, SILSO established a set of the most trustworthy “backbone” observers, those with long records and consistent techniques. And in July, SILSO formally ended the original sunspot number series and issued what it calls \u003ca href=\"http://www.sidc.be/silso/datafiles\">Sunspot Number version 2.0\u003c/a>. \u003c/p>\n\u003cp>\u003c/p>\n\u003cp>A special issue of the journal Solar Physics is in the works that will include dozens of papers, all properly peer-reviewed, to cement this step in scientific concrete. \u003c/p>\n\n\u003c/div>\u003c/p>",
"attributes": {
"named": {},
"numeric": []
}
}
],
"link": "/science/185601/its-official-dont-blame-the-sun-for-climate-change",
"authors": [
"6228"
],
"categories": [
"science_28",
"science_31"
],
"tags": [
"science_194"
],
"featImg": "science_186675",
"label": "science"
},
"science_151663": {
"type": "posts",
"id": "science_151663",
"meta": {
"index": "posts_1716263798",
"site": "science",
"id": "151663",
"score": null,
"sort": [
1438228816000
]
},
"guestAuthors": [],
"slug": "californians-support-drought-measures-blame-global-warming-for-dry-times",
"title": "Californians Support Drought Measures, Blame Global Warming for Dry Times",
"publishDate": 1438228816,
"format": "standard",
"headTitle": "Californians Support Drought Measures, Blame Global Warming for Dry Times | KQED",
"labelTerm": {
"term": 1151,
"site": "science"
},
"content": "\u003cp>Californians continue to support state and local measures to save water, even if they’re not sure what conservation target they’re trying to hit.\u003c/p>\n\u003cp>That’s one impression from the latest drought polling by the Public Policy Institute of California, a nonpartisan research group in San Francisco.\u003c/p>\n\u003cp>In the \u003ca href=\"http://www.ppic.org/main/publication.asp?i=1159\">statewide survey\u003c/a> taken in mid-July, respondents (not surprisingly) cited — by an overwhelming margin — the drought and water supply as the most pressing environmental issue facing California. Fifty-eight percent chose the drought while no other concern, such as air and water pollution, cracked double digits.\u003c/p>\n\u003cp>Asked about Governor Jerry Brown’s \u003ca href=\"http://ww2.kqed.org/science/2015/05/04/state-passes-historic-water-conservation-rules/\">water restrictions\u003c/a>, which mandate a 25 percent statewide reduction in water use, a combined 82 percent of respondents said the target was either “the right amount” or not stringent enough. Only 11 percent said the mandate was too onerous.\u003c/p>\n\u003cfigure id=\"attachment_152112\" class=\"wp-caption alignnone\" style=\"max-width: 800px\">\u003ca href=\"http://ww2.kqed.org/science/wp-content/uploads/sites/35/2015/07/IMG_3502.jpg\">\u003cimg loading=\"lazy\" decoding=\"async\" class=\"size-medium wp-image-152112\" src=\"http://ww2.kqed.org/science/wp-content/uploads/sites/35/2015/07/IMG_3502-800x600.jpg\" alt='Watering that produces visible runoff (\"watering the sidewalk\") is prohibited under state drought rules.' width=\"800\" height=\"600\" srcset=\"https://cdn.kqed.org/wp-content/uploads/sites/35/2015/07/IMG_3502-800x600.jpg 800w, https://cdn.kqed.org/wp-content/uploads/sites/35/2015/07/IMG_3502-400x300.jpg 400w, https://cdn.kqed.org/wp-content/uploads/sites/35/2015/07/IMG_3502-1180x885.jpg 1180w, https://cdn.kqed.org/wp-content/uploads/sites/35/2015/07/IMG_3502-960x720.jpg 960w, https://cdn.kqed.org/wp-content/uploads/sites/35/2015/07/IMG_3502.jpg 1280w\" sizes=\"(max-width: 800px) 100vw, 800px\">\u003c/a>\u003cfigcaption class=\"wp-caption-text\">Watering that produces visible runoff (“watering the sidewalk”) is prohibited under state drought rules. \u003ccite>(Craig Miller)\u003c/cite>\u003c/figcaption>\u003c/figure>\n\u003cp>Locally the conservation \u003ca href=\"http://ww2.kqed.org/lowdown/2015/06/03/what-mandatory-water-cuts-in-cities-throughout-california-look-like-in-three-interactive-maps/\">mandates vary widely\u003c/a>, from a low of 4 percent required savings, all the way up to 36 percent, and a majority of respondents didn’t seem to know what local target they’ve been trying to reach. Sixty-four percent said they did not know what precise reduction their local water district has required of them.\u003c/p>\n\u003cp>[ad fullwidth]\u003c/p>\n\u003cp>That bit of dissonance brought a verbal shrug from the head of the trade group for the state’s municipal water agencies, who cited high awareness among homeowners, in particular.\u003c/p>\n\u003cp>“You can’t bat a thousand,” says Tim Quinn, executive director of the Association of California Water Agencies. “But we’re not doing too bad, I would argue.” Quinn says he thinks the conservation message is getting through.\u003c/p>\n\u003cp>“We have turned a corner this summer,” he says. “People in California got it and they’re taking those actions and saving a lot of water, which is the difference between gettin’ by and not gettin’ by.”\u003c/p>\n\u003cp>\u003cstrong>Climate Connection\u003c/strong>\u003c/p>\n\u003cp>In another significant finding, nearly two-thirds of Californians made a connection between the drought — now well into its fourth year — and the changing climate. Sixty-four percent polled said that “global warming has contributed to California’s current drought.”\u003c/p>\n\u003cp>The operative word there may be “contributed.” While some studies have concluded that climate change was not likely the key causal factor in the drought, it’s widely acknowledged that record-high temperatures — \u003ca href=\"http://ww2.kqed.org/science/2014/10/14/high-temps-intensified-california-drought/\">especially last year\u003c/a> — have worsened impacts from the dry weather.\u003c/p>\n\u003cp>Another lopsided majority of survey respondents — 84 percent — said they expected that global warming would lead to more droughts in the future.\u003c/p>\n\u003cp>\u003c/p>\n\u003cp>In a similarly timed \u003ca href=\"http://californiawaterfoundation.org/wp-content/uploads/2015/07/CA-Water-Foundation-Survey-Memo-7-29-15.pdf\">statewide poll\u003c/a> by the California Water Foundation, about half the respondents rated their concern over the drought as at least 90 on a scale of 100. And a majority said they’d support monthly “water fees” of as much as $4, to support projects to help ensure an adequate water supply.\u003c/p>\n\n",
"blocks": [],
"excerpt": "The drought eclipses all other environmental concerns by a wide margin -- and many say mandated water cuts aren't stringent enough.",
"status": "publish",
"parent": 0,
"modified": 1725578310,
"stats": {
"hasAudio": false,
"hasVideo": false,
"hasChartOrMap": false,
"iframeSrcs": [],
"hasGoogleForm": false,
"hasGallery": false,
"hasHearkenModule": false,
"hasPolis": false,
"paragraphCount": 15,
"wordCount": 526
},
"headData": {
"title": "Californians Support Drought Measures, Blame Global Warming for Dry Times | KQED",
"description": "The drought eclipses all other environmental concerns by a wide margin -- and many say mandated water cuts aren't stringent enough.",
"ogTitle": "",
"ogDescription": "",
"ogImgId": "",
"twTitle": "",
"twDescription": "",
"twImgId": "",
"schema": {
"@context": "https://schema.org",
"@type": "Article",
"headline": "Californians Support Drought Measures, Blame Global Warming for Dry Times",
"datePublished": "2015-07-29T21:00:16-07:00",
"dateModified": "2024-09-05T16:18:30-07:00",
"image": "https://cdn.kqed.org/wp-content/uploads/2020/02/KQED-OG-Image@1x.png"
}
},
"sticky": false,
"path": "/science/151663/californians-support-drought-measures-blame-global-warming-for-dry-times",
"audioTrackLength": null,
"parsedContent": [
{
"type": "contentString",
"content": "\u003cdiv class=\"post-body\">\u003cp>\u003cp>Californians continue to support state and local measures to save water, even if they’re not sure what conservation target they’re trying to hit.\u003c/p>\n\u003cp>That’s one impression from the latest drought polling by the Public Policy Institute of California, a nonpartisan research group in San Francisco.\u003c/p>\n\u003cp>In the \u003ca href=\"http://www.ppic.org/main/publication.asp?i=1159\">statewide survey\u003c/a> taken in mid-July, respondents (not surprisingly) cited — by an overwhelming margin — the drought and water supply as the most pressing environmental issue facing California. Fifty-eight percent chose the drought while no other concern, such as air and water pollution, cracked double digits.\u003c/p>\n\u003cp>Asked about Governor Jerry Brown’s \u003ca href=\"http://ww2.kqed.org/science/2015/05/04/state-passes-historic-water-conservation-rules/\">water restrictions\u003c/a>, which mandate a 25 percent statewide reduction in water use, a combined 82 percent of respondents said the target was either “the right amount” or not stringent enough. Only 11 percent said the mandate was too onerous.\u003c/p>\n\u003cfigure id=\"attachment_152112\" class=\"wp-caption alignnone\" style=\"max-width: 800px\">\u003ca href=\"http://ww2.kqed.org/science/wp-content/uploads/sites/35/2015/07/IMG_3502.jpg\">\u003cimg loading=\"lazy\" decoding=\"async\" class=\"size-medium wp-image-152112\" src=\"http://ww2.kqed.org/science/wp-content/uploads/sites/35/2015/07/IMG_3502-800x600.jpg\" alt='Watering that produces visible runoff (\"watering the sidewalk\") is prohibited under state drought rules.' width=\"800\" height=\"600\" srcset=\"https://cdn.kqed.org/wp-content/uploads/sites/35/2015/07/IMG_3502-800x600.jpg 800w, https://cdn.kqed.org/wp-content/uploads/sites/35/2015/07/IMG_3502-400x300.jpg 400w, https://cdn.kqed.org/wp-content/uploads/sites/35/2015/07/IMG_3502-1180x885.jpg 1180w, https://cdn.kqed.org/wp-content/uploads/sites/35/2015/07/IMG_3502-960x720.jpg 960w, https://cdn.kqed.org/wp-content/uploads/sites/35/2015/07/IMG_3502.jpg 1280w\" sizes=\"(max-width: 800px) 100vw, 800px\">\u003c/a>\u003cfigcaption class=\"wp-caption-text\">Watering that produces visible runoff (“watering the sidewalk”) is prohibited under state drought rules. \u003ccite>(Craig Miller)\u003c/cite>\u003c/figcaption>\u003c/figure>\n\u003cp>Locally the conservation \u003ca href=\"http://ww2.kqed.org/lowdown/2015/06/03/what-mandatory-water-cuts-in-cities-throughout-california-look-like-in-three-interactive-maps/\">mandates vary widely\u003c/a>, from a low of 4 percent required savings, all the way up to 36 percent, and a majority of respondents didn’t seem to know what local target they’ve been trying to reach. Sixty-four percent said they did not know what precise reduction their local water district has required of them.\u003c/p>\n\u003cp>\u003c/p>\u003c/div>",
"attributes": {
"named": {},
"numeric": []
}
},
{
"type": "component",
"content": "",
"name": "ad",
"attributes": {
"named": {
"label": "fullwidth"
},
"numeric": [
"fullwidth"
]
}
},
{
"type": "contentString",
"content": "\u003cdiv class=\"post-body\">\u003cp>\u003c/p>\n\u003cp>That bit of dissonance brought a verbal shrug from the head of the trade group for the state’s municipal water agencies, who cited high awareness among homeowners, in particular.\u003c/p>\n\u003cp>“You can’t bat a thousand,” says Tim Quinn, executive director of the Association of California Water Agencies. “But we’re not doing too bad, I would argue.” Quinn says he thinks the conservation message is getting through.\u003c/p>\n\u003cp>“We have turned a corner this summer,” he says. “People in California got it and they’re taking those actions and saving a lot of water, which is the difference between gettin’ by and not gettin’ by.”\u003c/p>\n\u003cp>\u003cstrong>Climate Connection\u003c/strong>\u003c/p>\n\u003cp>In another significant finding, nearly two-thirds of Californians made a connection between the drought — now well into its fourth year — and the changing climate. Sixty-four percent polled said that “global warming has contributed to California’s current drought.”\u003c/p>\n\u003cp>The operative word there may be “contributed.” While some studies have concluded that climate change was not likely the key causal factor in the drought, it’s widely acknowledged that record-high temperatures — \u003ca href=\"http://ww2.kqed.org/science/2014/10/14/high-temps-intensified-california-drought/\">especially last year\u003c/a> — have worsened impacts from the dry weather.\u003c/p>\n\u003cp>Another lopsided majority of survey respondents — 84 percent — said they expected that global warming would lead to more droughts in the future.\u003c/p>\n\u003cp>\u003c/p>\n\u003cp>In a similarly timed \u003ca href=\"http://californiawaterfoundation.org/wp-content/uploads/2015/07/CA-Water-Foundation-Survey-Memo-7-29-15.pdf\">statewide poll\u003c/a> by the California Water Foundation, about half the respondents rated their concern over the drought as at least 90 on a scale of 100. And a majority said they’d support monthly “water fees” of as much as $4, to support projects to help ensure an adequate water supply.\u003c/p>\n\n\u003c/div>\u003c/p>",
"attributes": {
"named": {},
"numeric": []
}
}
],
"link": "/science/151663/californians-support-drought-measures-blame-global-warming-for-dry-times",
"authors": [
"221"
],
"series": [
"science_1151"
],
"categories": [
"science_31",
"science_40",
"science_98"
],
"tags": [
"science_1622",
"science_194"
],
"featImg": "science_152115",
"label": "science_1151"
},
"science_139910": {
"type": "posts",
"id": "science_139910",
"meta": {
"index": "posts_1716263798",
"site": "science",
"id": "139910",
"score": null,
"sort": [
1438002027000
]
},
"parent": 0,
"labelTerm": {
"site": "science"
},
"blocks": [],
"publishDate": 1438002027,
"format": "audio",
"title": "How Do You Make Greener Fuel? Copy a Leaf",
"headTitle": "How Do You Make Greener Fuel? Copy a Leaf | KQED",
"content": "\u003cp>http://www.kqed.org/.stream/anon/radio/science/2015/07/20150727ScienceFrankenLeaf.mp3\u003cbr>\nThe fuel Californians burn getting around in cars and trucks is a big driver of climate change, accounting for more than a third of the carbon pollution the state puts out.\u003c/p>\n\u003cp>Researchers in Berkeley are hoping to reverse that trend that by making fuel that doesn’t come from oil or other fossil fuels. Instead, they’re turning to renewable and abundant materials, like sunlight and carbon dioxide.\u003c/p>\n\u003cp>Sound familiar? Green plants have already cracked the code of how to survive on light, carbon dioxide and water, through the process of photosynthesis.\u003c/p>\n\u003cp>“Nature has really given us a lot of things to be wowed and amazed by,” says \u003ca href=\"http://chemistry.berkeley.edu/faculty/chem/chris-chang\">Chris Chang\u003c/a>, a professor at the \u003ca href=\"http://www.berkeley.edu/\">University of California, Berkeley\u003c/a> and \u003ca href=\"http://www.lbl.gov/\">Lawrence Berkeley National Laboratory\u003c/a>. Even the lowly weeds growing outside his chemistry lab are an inspiration for this work.\u003c/p>\n\u003cfigure id=\"attachment_139911\" class=\"wp-caption alignright\" style=\"max-width: 640px\">\u003ca href=\"http://ww2.kqed.org/science/wp-content/uploads/sites/35/2015/07/chang.jpg\">\u003cimg loading=\"lazy\" decoding=\"async\" class=\"size-large wp-image-139911\" src=\"http://ww2.kqed.org/science/wp-content/uploads/sites/35/2015/07/chang-1440x1031.jpg\" alt='UC Berkeley scientist Chris Chang demonstrates his \"artificial leaf\" - living microbes that absorb energy from a solar panel.' width=\"640\" height=\"458\" srcset=\"https://cdn.kqed.org/wp-content/uploads/sites/35/2015/07/chang-1440x1031.jpg 1440w, https://cdn.kqed.org/wp-content/uploads/sites/35/2015/07/chang-400x286.jpg 400w, https://cdn.kqed.org/wp-content/uploads/sites/35/2015/07/chang-800x573.jpg 800w, https://cdn.kqed.org/wp-content/uploads/sites/35/2015/07/chang-1400x1003.jpg 1400w, https://cdn.kqed.org/wp-content/uploads/sites/35/2015/07/chang-1180x845.jpg 1180w, https://cdn.kqed.org/wp-content/uploads/sites/35/2015/07/chang-960x688.jpg 960w, https://cdn.kqed.org/wp-content/uploads/sites/35/2015/07/chang.jpg 1920w\" sizes=\"(max-width: 640px) 100vw, 640px\">\u003c/a>\u003cfigcaption class=\"wp-caption-text\">U.C. Berkeley scientist Chris Chang demonstrates his “artificial leaf” — living microbes that absorb energy from a solar panel. \u003ccite>(Lauren Sommer/KQED)\u003c/cite>\u003c/figcaption>\u003c/figure>\n\u003cp>“What we want to do is take that idea,” he says, “the idea of making something useful from water, carbon dioxide and light — things that are freely abundant, freely sustainable.”\u003c/p>\n\u003cp>[ad fullwidth]\u003c/p>\n\u003cp>It sounds simple, but scientists have spent decades trying to understand photosynthesis and copy it in the lab, in the hope that “artificial leaves” could one day make fuel for our cars, using carbon dioxide from the atmosphere.\u003c/p>\n\u003cp>Chang, along with his colleagues Peidong Yang and Michelle Chang, have come up with their \u003ca href=\"http://newscenter.lbl.gov/2015/04/16/major-advance-in-artificial-photosynthesis/\">own prototype\u003c/a>, but it looks nothing like a leaf.\u003c/p>\n\u003cp>“It’s essentially like a fancy cup,” he says, “and we have a broth, a soup, which has got bacteria or yeast.”\u003c/p>\n\u003cp>Microbes are good at making complex substances, Chang says. In your kitchen, they help make yogurt or \u003ca href=\"http://ww2.kqed.org/science/2014/02/11/science-of-beer-tapping-the-power-of-brewers-yeast/\">beer\u003c/a>. He and his colleagues bioengineered microbes, changing their DNA to make other things — like biodiesel or the chemicals that make up plastics.\u003c/p>\n\u003cp>“The first thing we ended up making was actually natural gas,” he says.\u003c/p>\n\u003cp>But the microbes don’t normally run on sunlight, like a plant does. Chang could capture sunlight with a small solar panel, but the bacteria wouldn’t be able to harvest the energy and use it on their own.\u003c/p>\n\u003caside class=\"pullquote alignright\">“This is sort of our Frankenstein-type of experiment, but if Frankenstein was solar-powered.”\u003cbr>\n\u003ccite>Chris Chang, U.C. Berkeley\u003c/cite>\u003c/aside>\n\u003cp>So, Chang and his colleagues built something that can transfer the energy to the microbes; they built it using nanotechnology. “Something that’s way too small to see,” he says. “Orders of magnitude thinner than a human hair.”\u003c/p>\n\u003cp>As small as the bacteria themselves — designed just for them.\u003c/p>\n\u003cp>“The bacteria are like Easter-egg shaped,” he says, “and then we have nanomaterials that sit like blades of grass, sort of sticking up.”\u003c/p>\n\u003cp>The bacteria sit within that “nanotech grass” and absorb the energy from the solar panel.\u003c/p>\n\u003cp>Essentially, Chang and his team electrified life.\u003c/p>\n\u003cp>“This is sort of our Frankenstein-type of experiment, but if Frankenstein was solar-powered,” he says.\u003c/p>\n\u003cp>The team’s Frankenstein solution was no simple feat. It took several labs of chemists and biologists, who don’t normally work together, to marry a living system with a man-made one. In early versions of the prototype, the nano-materials killed off the microbes.\u003c/p>\n\u003cfigure id=\"attachment_139913\" class=\"wp-caption alignleft\" style=\"max-width: 400px\">\u003ca href=\"http://ww2.kqed.org/science/wp-content/uploads/sites/35/2015/07/Peidong-Yang-figure-2-web.jpg\">\u003cimg loading=\"lazy\" decoding=\"async\" class=\"size-thumbnail wp-image-139913\" src=\"http://ww2.kqed.org/science/wp-content/uploads/sites/35/2015/07/Peidong-Yang-figure-2-web-400x434.jpg\" alt='Microbes absorb energy from a field of \"nanotech grass.\"' width=\"400\" height=\"434\" srcset=\"https://cdn.kqed.org/wp-content/uploads/sites/35/2015/07/Peidong-Yang-figure-2-web-400x434.jpg 400w, https://cdn.kqed.org/wp-content/uploads/sites/35/2015/07/Peidong-Yang-figure-2-web.jpg 666w\" sizes=\"(max-width: 400px) 100vw, 400px\">\u003c/a>\u003cfigcaption class=\"wp-caption-text\">Microbes absorb energy from a field of “nanotech grass.” \u003ccite>(Lawrence Berkeley National Lab)\u003c/cite>\u003c/figcaption>\u003c/figure>\n\u003cp>The research is still in the early stages and Chang says they’re working to double the efficiency of the system.\u003c/p>\n\u003cp>Ultimately, looking decades ahead, the hope is that jugs of these solar-powered microbes could sit in our garages, pumping out biodiesel for our cars.\u003c/p>\n\u003cp>“Photosynthesis is just an absolute marvel of nature,” says \u003ca href=\"http://solarfuelshub.org/personnel/harry-atwater.html\">Harry Atwater\u003c/a>, director of the \u003ca href=\"http://solarfuelshub.org/\">Joint Center for Artificial Photosynthesis\u003c/a> (JCAP). “So it offers a really powerful template and example for us to follow.”\u003c/p>\n\u003cp>JCAP is a collaboration of four California institutions, including Lawrence Berkeley National Lab, and was launched five years ago with $120 million from the federal Department of Energy. The goal is to use sunlight to make liquid fuels, which are used by the transportation industry because they’re more easily stored than electricity is.\u003c/p>\n\u003cp>“It’s very unlikely that anytime soon either you or I are going to take a flight on an electric-powered airplane,” he says.\u003c/p>\n\u003cp>The center is working on creating “artificial leaves” purely through man-made chemistry, unlike Chang’s system that uses living microbes. What it’ll cost to make the fuel, and what people will pay for it are both unknown. But Atwater hopes to create usable fuels at a large scale within a generation, a pace that would mirror the success of rooftop solar panels.\u003c/p>\n\u003cp>“I remember when I was a kid, the idea of a photovoltaic industry that would produce significant power seemed like a far-fetched idea,” he says. “So that’s the sort of thing that gives me ultimate and profound optimism.”\u003c/p>\n\u003cp>\u003c/p>\n\u003cp>And he says, copying green plants and turning carbon dioxide into fuel source, instead of a pollutant, would be a much-needed climate change solution.\u003c/p>\n\n",
"stats": {
"hasVideo": false,
"hasChartOrMap": false,
"hasAudio": true,
"hasPolis": false,
"wordCount": 918,
"hasGoogleForm": false,
"hasGallery": false,
"hasHearkenModule": false,
"iframeSrcs": [],
"paragraphCount": 27
},
"modified": 1704931520,
"excerpt": "For millennia, plants have made fuel out of sunlight and carbon dioxide. But it's not so easy to do in the lab.\r\n",
"headData": {
"twImgId": "",
"twTitle": "",
"ogTitle": "",
"ogImgId": "",
"twDescription": "",
"description": "For millennia, plants have made fuel out of sunlight and carbon dioxide. But it's not so easy to do in the lab.\r\n",
"title": "How Do You Make Greener Fuel? Copy a Leaf | KQED",
"ogDescription": "",
"schema": {
"@context": "https://schema.org",
"@type": "Article",
"headline": "How Do You Make Greener Fuel? Copy a Leaf",
"datePublished": "2015-07-27T06:00:27-07:00",
"dateModified": "2024-01-10T16:05:20-08:00",
"image": "https://cdn.kqed.org/wp-content/uploads/2020/02/KQED-OG-Image@1x.png"
}
},
"guestAuthors": [],
"slug": "how-do-you-make-greener-fuel-copy-a-leaf",
"status": "publish",
"sticky": false,
"path": "/science/139910/how-do-you-make-greener-fuel-copy-a-leaf",
"audioUrl": "http://www.kqed.org/.stream/anon/radio/science/2015/07/20150727ScienceFrankenLeaf.mp3",
"audioDuration": null,
"audioTrackLength": null,
"parsedContent": [
{
"type": "contentString",
"content": "\u003cdiv class=\"post-body\">\u003cp>\u003cp>http://www.kqed.org/.stream/anon/radio/science/2015/07/20150727ScienceFrankenLeaf.mp3\u003cbr>\nThe fuel Californians burn getting around in cars and trucks is a big driver of climate change, accounting for more than a third of the carbon pollution the state puts out.\u003c/p>\n\u003cp>Researchers in Berkeley are hoping to reverse that trend that by making fuel that doesn’t come from oil or other fossil fuels. Instead, they’re turning to renewable and abundant materials, like sunlight and carbon dioxide.\u003c/p>\n\u003cp>Sound familiar? Green plants have already cracked the code of how to survive on light, carbon dioxide and water, through the process of photosynthesis.\u003c/p>\n\u003cp>“Nature has really given us a lot of things to be wowed and amazed by,” says \u003ca href=\"http://chemistry.berkeley.edu/faculty/chem/chris-chang\">Chris Chang\u003c/a>, a professor at the \u003ca href=\"http://www.berkeley.edu/\">University of California, Berkeley\u003c/a> and \u003ca href=\"http://www.lbl.gov/\">Lawrence Berkeley National Laboratory\u003c/a>. Even the lowly weeds growing outside his chemistry lab are an inspiration for this work.\u003c/p>\n\u003cfigure id=\"attachment_139911\" class=\"wp-caption alignright\" style=\"max-width: 640px\">\u003ca href=\"http://ww2.kqed.org/science/wp-content/uploads/sites/35/2015/07/chang.jpg\">\u003cimg loading=\"lazy\" decoding=\"async\" class=\"size-large wp-image-139911\" src=\"http://ww2.kqed.org/science/wp-content/uploads/sites/35/2015/07/chang-1440x1031.jpg\" alt='UC Berkeley scientist Chris Chang demonstrates his \"artificial leaf\" - living microbes that absorb energy from a solar panel.' width=\"640\" height=\"458\" srcset=\"https://cdn.kqed.org/wp-content/uploads/sites/35/2015/07/chang-1440x1031.jpg 1440w, https://cdn.kqed.org/wp-content/uploads/sites/35/2015/07/chang-400x286.jpg 400w, https://cdn.kqed.org/wp-content/uploads/sites/35/2015/07/chang-800x573.jpg 800w, https://cdn.kqed.org/wp-content/uploads/sites/35/2015/07/chang-1400x1003.jpg 1400w, https://cdn.kqed.org/wp-content/uploads/sites/35/2015/07/chang-1180x845.jpg 1180w, https://cdn.kqed.org/wp-content/uploads/sites/35/2015/07/chang-960x688.jpg 960w, https://cdn.kqed.org/wp-content/uploads/sites/35/2015/07/chang.jpg 1920w\" sizes=\"(max-width: 640px) 100vw, 640px\">\u003c/a>\u003cfigcaption class=\"wp-caption-text\">U.C. Berkeley scientist Chris Chang demonstrates his “artificial leaf” — living microbes that absorb energy from a solar panel. \u003ccite>(Lauren Sommer/KQED)\u003c/cite>\u003c/figcaption>\u003c/figure>\n\u003cp>“What we want to do is take that idea,” he says, “the idea of making something useful from water, carbon dioxide and light — things that are freely abundant, freely sustainable.”\u003c/p>\n\u003cp>\u003c/p>\u003c/div>",
"attributes": {
"named": {},
"numeric": []
}
},
{
"type": "component",
"content": "",
"name": "ad",
"attributes": {
"named": {
"label": "fullwidth"
},
"numeric": [
"fullwidth"
]
}
},
{
"type": "contentString",
"content": "\u003cdiv class=\"post-body\">\u003cp>\u003c/p>\n\u003cp>It sounds simple, but scientists have spent decades trying to understand photosynthesis and copy it in the lab, in the hope that “artificial leaves” could one day make fuel for our cars, using carbon dioxide from the atmosphere.\u003c/p>\n\u003cp>Chang, along with his colleagues Peidong Yang and Michelle Chang, have come up with their \u003ca href=\"http://newscenter.lbl.gov/2015/04/16/major-advance-in-artificial-photosynthesis/\">own prototype\u003c/a>, but it looks nothing like a leaf.\u003c/p>\n\u003cp>“It’s essentially like a fancy cup,” he says, “and we have a broth, a soup, which has got bacteria or yeast.”\u003c/p>\n\u003cp>Microbes are good at making complex substances, Chang says. In your kitchen, they help make yogurt or \u003ca href=\"http://ww2.kqed.org/science/2014/02/11/science-of-beer-tapping-the-power-of-brewers-yeast/\">beer\u003c/a>. He and his colleagues bioengineered microbes, changing their DNA to make other things — like biodiesel or the chemicals that make up plastics.\u003c/p>\n\u003cp>“The first thing we ended up making was actually natural gas,” he says.\u003c/p>\n\u003cp>But the microbes don’t normally run on sunlight, like a plant does. Chang could capture sunlight with a small solar panel, but the bacteria wouldn’t be able to harvest the energy and use it on their own.\u003c/p>\n\u003caside class=\"pullquote alignright\">“This is sort of our Frankenstein-type of experiment, but if Frankenstein was solar-powered.”\u003cbr>\n\u003ccite>Chris Chang, U.C. Berkeley\u003c/cite>\u003c/aside>\n\u003cp>So, Chang and his colleagues built something that can transfer the energy to the microbes; they built it using nanotechnology. “Something that’s way too small to see,” he says. “Orders of magnitude thinner than a human hair.”\u003c/p>\n\u003cp>As small as the bacteria themselves — designed just for them.\u003c/p>\n\u003cp>“The bacteria are like Easter-egg shaped,” he says, “and then we have nanomaterials that sit like blades of grass, sort of sticking up.”\u003c/p>\n\u003cp>The bacteria sit within that “nanotech grass” and absorb the energy from the solar panel.\u003c/p>\n\u003cp>Essentially, Chang and his team electrified life.\u003c/p>\n\u003cp>“This is sort of our Frankenstein-type of experiment, but if Frankenstein was solar-powered,” he says.\u003c/p>\n\u003cp>The team’s Frankenstein solution was no simple feat. It took several labs of chemists and biologists, who don’t normally work together, to marry a living system with a man-made one. In early versions of the prototype, the nano-materials killed off the microbes.\u003c/p>\n\u003cfigure id=\"attachment_139913\" class=\"wp-caption alignleft\" style=\"max-width: 400px\">\u003ca href=\"http://ww2.kqed.org/science/wp-content/uploads/sites/35/2015/07/Peidong-Yang-figure-2-web.jpg\">\u003cimg loading=\"lazy\" decoding=\"async\" class=\"size-thumbnail wp-image-139913\" src=\"http://ww2.kqed.org/science/wp-content/uploads/sites/35/2015/07/Peidong-Yang-figure-2-web-400x434.jpg\" alt='Microbes absorb energy from a field of \"nanotech grass.\"' width=\"400\" height=\"434\" srcset=\"https://cdn.kqed.org/wp-content/uploads/sites/35/2015/07/Peidong-Yang-figure-2-web-400x434.jpg 400w, https://cdn.kqed.org/wp-content/uploads/sites/35/2015/07/Peidong-Yang-figure-2-web.jpg 666w\" sizes=\"(max-width: 400px) 100vw, 400px\">\u003c/a>\u003cfigcaption class=\"wp-caption-text\">Microbes absorb energy from a field of “nanotech grass.” \u003ccite>(Lawrence Berkeley National Lab)\u003c/cite>\u003c/figcaption>\u003c/figure>\n\u003cp>The research is still in the early stages and Chang says they’re working to double the efficiency of the system.\u003c/p>\n\u003cp>Ultimately, looking decades ahead, the hope is that jugs of these solar-powered microbes could sit in our garages, pumping out biodiesel for our cars.\u003c/p>\n\u003cp>“Photosynthesis is just an absolute marvel of nature,” says \u003ca href=\"http://solarfuelshub.org/personnel/harry-atwater.html\">Harry Atwater\u003c/a>, director of the \u003ca href=\"http://solarfuelshub.org/\">Joint Center for Artificial Photosynthesis\u003c/a> (JCAP). “So it offers a really powerful template and example for us to follow.”\u003c/p>\n\u003cp>JCAP is a collaboration of four California institutions, including Lawrence Berkeley National Lab, and was launched five years ago with $120 million from the federal Department of Energy. The goal is to use sunlight to make liquid fuels, which are used by the transportation industry because they’re more easily stored than electricity is.\u003c/p>\n\u003cp>“It’s very unlikely that anytime soon either you or I are going to take a flight on an electric-powered airplane,” he says.\u003c/p>\n\u003cp>The center is working on creating “artificial leaves” purely through man-made chemistry, unlike Chang’s system that uses living microbes. What it’ll cost to make the fuel, and what people will pay for it are both unknown. But Atwater hopes to create usable fuels at a large scale within a generation, a pace that would mirror the success of rooftop solar panels.\u003c/p>\n\u003cp>“I remember when I was a kid, the idea of a photovoltaic industry that would produce significant power seemed like a far-fetched idea,” he says. “So that’s the sort of thing that gives me ultimate and profound optimism.”\u003c/p>\n\u003cp>\u003c/p>\n\u003cp>And he says, copying green plants and turning carbon dioxide into fuel source, instead of a pollutant, would be a much-needed climate change solution.\u003c/p>\n\n\u003c/div>\u003c/p>",
"attributes": {
"named": {},
"numeric": []
}
}
],
"link": "/science/139910/how-do-you-make-greener-fuel-copy-a-leaf",
"authors": [
"239"
],
"categories": [
"science_46",
"science_30",
"science_29",
"science_31",
"science_33",
"science_89",
"science_35",
"science_40",
"science_43"
],
"tags": [
"science_1404",
"science_194",
"science_134"
],
"featImg": "science_139914",
"label": "science"
},
"science_27643": {
"type": "posts",
"id": "science_27643",
"meta": {
"index": "posts_1716263798",
"site": "science",
"id": "27643",
"score": null,
"sort": [
1425062027000
]
},
"parent": 0,
"labelTerm": {
"site": "science"
},
"blocks": [],
"publishDate": 1425062027,
"format": "aside",
"title": "The Greenhouse Effect Is Truly at Work, Observations Show",
"headTitle": "The Greenhouse Effect Is Truly at Work, Observations Show | KQED",
"content": "\u003cfigure id=\"attachment_27644\" class=\"wp-caption aligncenter\" style=\"max-width: 800px\">\u003ca href=\"http://ww2.kqed.org/science/wp-content/uploads/sites/35/2015/02/CO2trends.png\">\u003cimg loading=\"lazy\" decoding=\"async\" class=\"size-full wp-image-27644\" src=\"http://ww2.kqed.org/science/wp-content/uploads/sites/35/2015/02/CO2trends.png\" alt=\"Rising CO2 and rising greenhouse energy, 2000-2010\" width=\"800\" height=\"450\">\u003c/a>\u003cfigcaption class=\"wp-caption-text\">Graphs of energy trapped in the atmosphere due to extra CO\u003csub>2\u003c/sub>, as observed at the Southern Great Plains (SGP) and North Slope Alaska (NSA) sites. Red shows the CO\u003csub>2\u003c/sub> effect, gray shows the CO\u003csub>2\u003c/sub> concentrations and blue shows the trend of the CO\u003csub>2\u003c/sub> effect. (Lawrence Berkeley National Laboratory/Nature)\u003c/figcaption>\u003c/figure>\n\u003cp>Climate scientists have finally demonstrated that rising carbon dioxide in the air is trapping more of the sun’s heat. A \u003ca href=\"http://www.nature.com/nature/journal/vaop/ncurrent/full/nature14240.html\">paper published Wednesday\u003c/a> has used a decade of painstaking measurements to confirm the basic greenhouse mechanism of global warming beyond a reasonable doubt.\u003c/p>\n\u003cp>Physicists have foreseen greenhouse warming of the Earth since the 19th century, and the greenhouse effect is the foundation of climate-change science. This is accepted knowledge by now, but science is supposed to make really sure of things.\u003c/p>\n\u003cp>The game of science is unusually precise. Since it’s spring training season, I’ll use an analogy from baseball. A ballplayer can hit a home run by batting the ball over the outfield fence—that’s when we all start cheering (or groaning)—but the run is not formally recorded until the umpires see the batter step on each base, in the right order, and set foot on home plate. The ballplayer has to go through all the motions.\u003c/p>\n\u003cp>In climate science, it’s almost universally accepted that rising carbon dioxide (CO\u003csub>2\u003c/sub>) levels in the atmosphere are making the atmosphere warmer. That ball has been over the fence for many years now. But science has to go through all the motions.\u003c/p>\n\u003cp>[contextly_sidebar id=”oj2vZ9AgtEdUwds7jDURQccRXk5uNRoI”]\u003c/p>\n\u003cp>Greenhouse physics in the lab, many decades of weather observations and a wide range of computer models based on evidence from a million years of prehistory all support the scientific home run. But until now we haven’t gone through the motions for one question: Do we truly observe the mechanism for greenhouse warming on the ground, in the actual sunlight passing through the actual atmosphere?\u003c/p>\n\u003cp>[ad fullwidth]\u003c/p>\n\u003cp>This hasn’t been easy. Satellite observations show the top of the atmosphere, not the bottom where we live. Also, computer models are still models with many moving parts, and the measurements, whether from space or from the ground, are hard to make and subtle to interpret.\u003c/p>\n\u003cp>A team of six scientists led by \u003ca href=\"http://esd.lbl.gov/about/staff/danielfeldman/\">Daniel Feldman\u003c/a>, of \u003ca href=\"http://www.lbl.gov/\">Lawrence Berkeley National Lab\u003c/a>, used 11 years of ground observations to demonstrate that the 6 percent rise in levels of CO\u003csub>2\u003c/sub> since the year 2000 led to a 10 percent rise in CO\u003csub>2\u003c/sub>‘s share of the greenhouse effect, specifically the infrared energy kept within the blanket of the atmosphere. Their results were \u003ca href=\"http://www.nature.com/nature/journal/vaop/ncurrent/full/nature14240.html\">published Wednesday\u003c/a> in the journal \u003ci>Nature\u003c/i>.\u003c/p>\n\u003cp>The data came from U.S. Department of Energy observation sites in \u003ca href=\"http://www.arm.gov/sites/sgp\">Oklahoma\u003c/a> and \u003ca href=\"http://www.arm.gov/sites/nsa\">Alaska\u003c/a> where \u003ca href=\"http://www.arm.gov/instruments/aeri\">exquisitely sensitive instruments\u003c/a> watch the skies at a wide range of wavelengths.\u003c/p>\n\u003cp>The three most important greenhouse gases—water vapor, CO\u003csub>2\u003c/sub> and methane—absorb high-energy sunlight and re-emit it as long-wave infrared (heat) radiation, which is trapped underneath the atmosphere. Because each gas produces its own infrared “color” or blend of wavelengths, it’s possible to sort out their separate effects.\u003c/p>\n\u003cp>Feldman’s team used only data from clear skies, allowing them to ignore the weather. They made careful corrections for the temperature of the air and the instrument itself. And the length of the 11-year record allowed them to ignore seasonal ups and downs and extract a clean long-term trend at both sites, shown below.\u003c/p>\n\u003cp>Statistics are always crucial in a study like this. Feldman’s results passed their statistical tests with flying colors. According to the standards that scientists follow, these results are real and robust.\u003c/p>\n\u003cp>The CO\u003csub>2\u003c/sub> effect is small, but it’s relentless and it adds up as surely as compound interest rewards an investor. And CO\u003csub>2\u003c/sub> isn’t the end of the story—because warmer air holds more water vapor, any warming due to rising CO\u003csub>2\u003c/sub> is amplified about three times. (This is another reason why a change in CO\u003csub>2\u003c/sub> of just a few parts per million is so significant.)\u003c/p>\n\u003cp>The work of Feldman’s team also proves that direct, ground-based observations are now good enough to match the indirect, expensive satellite data we’ve relied on to understand global climate.\u003c/p>\n\u003cp>\u003c/p>\n\u003cp>Baseball also has the informal tradition of the “neighborhood play,” in which an infielder rushing to touch a base ahead of an oncoming runner may only sort-of touch it in the interest of avoiding injury, but still have the umpire rule the runner out. Climate change debaters will no longer have that analogy when they argue that after all these years the umpires have never definitively, formally ruled on the greenhouse effect.\u003c/p>\n\n",
"stats": {
"hasVideo": false,
"hasChartOrMap": false,
"hasAudio": false,
"hasPolis": false,
"wordCount": 811,
"hasGoogleForm": false,
"hasGallery": false,
"hasHearkenModule": false,
"iframeSrcs": [],
"paragraphCount": 17
},
"modified": 1704932211,
"excerpt": "A long record of atmospheric observations has put an \"official\" stamp on the foundation of climate-change science: the greenhouse effect really works the way we've always said it does.",
"headData": {
"twImgId": "",
"twTitle": "",
"ogTitle": "",
"ogImgId": "",
"twDescription": "",
"description": "A long record of atmospheric observations has put an "official" stamp on the foundation of climate-change science: the greenhouse effect really works the way we've always said it does.",
"title": "The Greenhouse Effect Is Truly at Work, Observations Show | KQED",
"ogDescription": "",
"schema": {
"@context": "https://schema.org",
"@type": "Article",
"headline": "The Greenhouse Effect Is Truly at Work, Observations Show",
"datePublished": "2015-02-27T10:33:47-08:00",
"dateModified": "2024-01-10T16:16:51-08:00",
"image": "https://cdn.kqed.org/wp-content/uploads/2020/02/KQED-OG-Image@1x.png"
}
},
"guestAuthors": [],
"slug": "the-greenhouse-effect-is-truly-in-effect-observations-show",
"status": "publish",
"sticky": false,
"path": "/science/27643/the-greenhouse-effect-is-truly-in-effect-observations-show",
"audioTrackLength": null,
"parsedContent": [
{
"type": "contentString",
"content": "\u003cdiv class=\"post-body\">\u003cp>\u003cfigure id=\"attachment_27644\" class=\"wp-caption aligncenter\" style=\"max-width: 800px\">\u003ca href=\"http://ww2.kqed.org/science/wp-content/uploads/sites/35/2015/02/CO2trends.png\">\u003cimg loading=\"lazy\" decoding=\"async\" class=\"size-full wp-image-27644\" src=\"http://ww2.kqed.org/science/wp-content/uploads/sites/35/2015/02/CO2trends.png\" alt=\"Rising CO2 and rising greenhouse energy, 2000-2010\" width=\"800\" height=\"450\">\u003c/a>\u003cfigcaption class=\"wp-caption-text\">Graphs of energy trapped in the atmosphere due to extra CO\u003csub>2\u003c/sub>, as observed at the Southern Great Plains (SGP) and North Slope Alaska (NSA) sites. Red shows the CO\u003csub>2\u003c/sub> effect, gray shows the CO\u003csub>2\u003c/sub> concentrations and blue shows the trend of the CO\u003csub>2\u003c/sub> effect. (Lawrence Berkeley National Laboratory/Nature)\u003c/figcaption>\u003c/figure>\n\u003cp>Climate scientists have finally demonstrated that rising carbon dioxide in the air is trapping more of the sun’s heat. A \u003ca href=\"http://www.nature.com/nature/journal/vaop/ncurrent/full/nature14240.html\">paper published Wednesday\u003c/a> has used a decade of painstaking measurements to confirm the basic greenhouse mechanism of global warming beyond a reasonable doubt.\u003c/p>\n\u003cp>Physicists have foreseen greenhouse warming of the Earth since the 19th century, and the greenhouse effect is the foundation of climate-change science. This is accepted knowledge by now, but science is supposed to make really sure of things.\u003c/p>\n\u003cp>The game of science is unusually precise. Since it’s spring training season, I’ll use an analogy from baseball. A ballplayer can hit a home run by batting the ball over the outfield fence—that’s when we all start cheering (or groaning)—but the run is not formally recorded until the umpires see the batter step on each base, in the right order, and set foot on home plate. The ballplayer has to go through all the motions.\u003c/p>\n\u003cp>In climate science, it’s almost universally accepted that rising carbon dioxide (CO\u003csub>2\u003c/sub>) levels in the atmosphere are making the atmosphere warmer. That ball has been over the fence for many years now. But science has to go through all the motions.\u003c/p>\n\u003cp>\u003c/p>\u003cp>\u003c/p>\u003cp>\u003c/p>\n\u003cp>Greenhouse physics in the lab, many decades of weather observations and a wide range of computer models based on evidence from a million years of prehistory all support the scientific home run. But until now we haven’t gone through the motions for one question: Do we truly observe the mechanism for greenhouse warming on the ground, in the actual sunlight passing through the actual atmosphere?\u003c/p>\n\u003cp>\u003c/p>\u003c/div>",
"attributes": {
"named": {},
"numeric": []
}
},
{
"type": "component",
"content": "",
"name": "ad",
"attributes": {
"named": {
"label": "fullwidth"
},
"numeric": [
"fullwidth"
]
}
},
{
"type": "contentString",
"content": "\u003cdiv class=\"post-body\">\u003cp>\u003c/p>\n\u003cp>This hasn’t been easy. Satellite observations show the top of the atmosphere, not the bottom where we live. Also, computer models are still models with many moving parts, and the measurements, whether from space or from the ground, are hard to make and subtle to interpret.\u003c/p>\n\u003cp>A team of six scientists led by \u003ca href=\"http://esd.lbl.gov/about/staff/danielfeldman/\">Daniel Feldman\u003c/a>, of \u003ca href=\"http://www.lbl.gov/\">Lawrence Berkeley National Lab\u003c/a>, used 11 years of ground observations to demonstrate that the 6 percent rise in levels of CO\u003csub>2\u003c/sub> since the year 2000 led to a 10 percent rise in CO\u003csub>2\u003c/sub>‘s share of the greenhouse effect, specifically the infrared energy kept within the blanket of the atmosphere. Their results were \u003ca href=\"http://www.nature.com/nature/journal/vaop/ncurrent/full/nature14240.html\">published Wednesday\u003c/a> in the journal \u003ci>Nature\u003c/i>.\u003c/p>\n\u003cp>The data came from U.S. Department of Energy observation sites in \u003ca href=\"http://www.arm.gov/sites/sgp\">Oklahoma\u003c/a> and \u003ca href=\"http://www.arm.gov/sites/nsa\">Alaska\u003c/a> where \u003ca href=\"http://www.arm.gov/instruments/aeri\">exquisitely sensitive instruments\u003c/a> watch the skies at a wide range of wavelengths.\u003c/p>\n\u003cp>The three most important greenhouse gases—water vapor, CO\u003csub>2\u003c/sub> and methane—absorb high-energy sunlight and re-emit it as long-wave infrared (heat) radiation, which is trapped underneath the atmosphere. Because each gas produces its own infrared “color” or blend of wavelengths, it’s possible to sort out their separate effects.\u003c/p>\n\u003cp>Feldman’s team used only data from clear skies, allowing them to ignore the weather. They made careful corrections for the temperature of the air and the instrument itself. And the length of the 11-year record allowed them to ignore seasonal ups and downs and extract a clean long-term trend at both sites, shown below.\u003c/p>\n\u003cp>Statistics are always crucial in a study like this. Feldman’s results passed their statistical tests with flying colors. According to the standards that scientists follow, these results are real and robust.\u003c/p>\n\u003cp>The CO\u003csub>2\u003c/sub> effect is small, but it’s relentless and it adds up as surely as compound interest rewards an investor. And CO\u003csub>2\u003c/sub> isn’t the end of the story—because warmer air holds more water vapor, any warming due to rising CO\u003csub>2\u003c/sub> is amplified about three times. (This is another reason why a change in CO\u003csub>2\u003c/sub> of just a few parts per million is so significant.)\u003c/p>\n\u003cp>The work of Feldman’s team also proves that direct, ground-based observations are now good enough to match the indirect, expensive satellite data we’ve relied on to understand global climate.\u003c/p>\n\u003cp>\u003c/p>\n\u003cp>Baseball also has the informal tradition of the “neighborhood play,” in which an infielder rushing to touch a base ahead of an oncoming runner may only sort-of touch it in the interest of avoiding injury, but still have the umpire rule the runner out. Climate change debaters will no longer have that analogy when they argue that after all these years the umpires have never definitively, formally ruled on the greenhouse effect.\u003c/p>\n\n\u003c/div>\u003c/p>",
"attributes": {
"named": {},
"numeric": []
}
}
],
"link": "/science/27643/the-greenhouse-effect-is-truly-in-effect-observations-show",
"authors": [
"6228"
],
"categories": [
"science_31"
],
"tags": [
"science_1404",
"science_194",
"science_306"
],
"featImg": "science_27644",
"label": "science"
},
"science_27409": {
"type": "posts",
"id": "science_27409",
"meta": {
"index": "posts_1716263798",
"site": "science",
"id": "27409",
"score": null,
"sort": [
1424451959000
]
},
"parent": 0,
"labelTerm": {
"site": "science"
},
"blocks": [],
"publishDate": 1424451959,
"format": "aside",
"title": "2015 Picks Up Where 2014 Record Heat Left Off",
"headTitle": "2015 Picks Up Where 2014 Record Heat Left Off | KQED",
"content": "\u003cfigure id=\"attachment_27417\" class=\"wp-caption alignleft\" style=\"max-width: 1024px\">\u003ca href=\"http://ww2.kqed.org/science/wp-content/uploads/sites/35/2015/02/drought-e1424450328699-1024x576.jpg\">\u003cimg loading=\"lazy\" decoding=\"async\" class=\"size-large wp-image-27417\" src=\"http://ww2.kqed.org/science/wp-content/uploads/sites/35/2015/02/drought-e1424450328699-1024x576.jpg\" alt=\"Corn plants struggle to survive in a drought-stricken farm field near Oakton, Indiana. The corn and soybean belt in the middle of the nation is experiencing one of the worst droughts in more than five decades. (Scott Olson/Getty Images)\" width=\"1024\" height=\"576\">\u003c/a>\u003cfigcaption class=\"wp-caption-text\">Corn plants struggle to survive in a drought-stricken farm field near Oakton, Indiana. The corn and soybean belt in the middle of the nation is experiencing one of the worst droughts in more than five decades.\u003cbr>(Scott Olson/Getty Images)\u003c/figcaption>\u003c/figure>\n\u003cp>\u003cstrong>By Andrea Thompson\u003c/strong>\u003cbr>\n\u003cstrong>\u003ca href=\"http://www.climatecentral.org/\">Climate Central\u003c/a>\u003c/strong>\u003c/p>\n\u003cp>The warmth that led 2014 to become the hottest year on record has continued into 2015, with last month ranking as the second-hottest January on record globally, the \u003ca href=\"http://www.ncdc.noaa.gov/sotc/global/2015/1\">National Oceanic and Atmospheric Administration\u003c/a> announced Thursday.\u003c/p>\n\u003cp>“I think it is safe to say that the warmth so far in 2015 really is a continuation of the warmth in 2014,” NOAA climatologist Jake Crouch said in an email.\u003c/p>\n\u003cp>The past month was 1.39°F above the 20th century average of 53.6°F, second only to 2007 in the agency’s records, which go back to 1880. The Japan Meteorological Agency had January 2015 tied with both January 2002 and 2007, while \u003ca href=\"http://data.giss.nasa.gov/gistemp/tabledata_v3/GLB.Ts.txt\">NASA data\u003c/a> put the month in a tie for third with 2002, behind 2007 as the hottest and 2005 and 2013 as the second hottest.\u003c/p>\n\u003cp>Different agencies handle global temperature data in slightly different ways, leading to small differences in monthly and yearly global temperature rankings.\u003c/p>\n\u003cp>[ad fullwidth]\u003c/p>\n\u003cp>All three agencies \u003ca href=\"http://www.climatecentral.org/news/a-broken-record-2014-hottest-year-18546\">ranked 2014 as the warmest year\u003c/a> on record by a slim margin, driven by the accumulation of heat-trapping greenhouse gases in the atmosphere. Nine of the 10 hottest years on record have all occurred in the 21st century, with the exception of the blockbuster El Nino year of 1998. There \u003ca href=\"http://www.climatecentral.org/news/2014-set-for-record-hot-record-cold-thing-of-the-past-18360\">hasn’t been a record cold year\u003c/a> set since 1911, while during the same period there have been 19 record-warm years, according to a Climate Central analysis.\u003c/p>\n\u003cp>[contextly_sidebar id=”yLG9ynkn9lCKKKkxlL4zBZteDo5NQJ9S”]\u003c/p>\n\u003cp>The 2014 mark was largely driven by considerable heat in the world’s oceans, as illustrated in the above graphic of sea surface temperatures \u003ca href=\"http://www.nnvl.noaa.gov/MediaDetail2.php?MediaID=1673&MediaTypeID=1\">released by NOAA\u003c/a>. The map shows that parts of the Pacific were the second warmest on record and the Indian Ocean was the third hottest since 1982.\u003c/p>\n\u003cp>“There’s a lot of warmth in the ocean,” NOAA climatologist Michelle L’Heureux said. Considering that the map shows such anomalous heat even compared to the past 30 or so years, when the signature of global warming had already emerged makes those rankings even more remarkable, she said.\u003c/p>\n\u003cp>The oceans on the whole were the third hottest on record for January 2015, according to NOAA. Record ocean warmth was seen off both coasts of North America; the hot waters off the West Coast has helped reinforce the unseasonably high temperatures and dry conditions in that part of the U.S.\u003c/p>\n\u003cp>Other ocean areas were much warmer than normal, though there were some cool spots, most notably in the North Atlantic between Greenland and Europe where record-cold sea surface temperatures were recorded.\u003c/p>\n\u003cp>How global temperatures shape up over the rest of the year remains to be seen, but the ocean tends to hang on to heat for much longer than land areas, which will keep temperatures elevated for awhile. And as \u003ca href=\"http://www.climatecentral.org/news/2015-begins-with-co2-above-400-ppm-mark-18534\">carbon dioxide\u003c/a> and other greenhouse gases continue to be emitted, the dice will be loaded to warmer and warmer years in the future.\u003c/p>\n\u003cp>\u003c/p>\n\u003cp>\u003ca href=\"http://www.climatecentral.org/\">Climate Central\u003c/a> \u003cem>is an independent organization that researches and reports on climate change.\u003c/em>\u003c/p>\n\n",
"stats": {
"hasVideo": false,
"hasChartOrMap": false,
"hasAudio": false,
"hasPolis": false,
"wordCount": 564,
"hasGoogleForm": false,
"hasGallery": false,
"hasHearkenModule": false,
"iframeSrcs": [],
"paragraphCount": 15
},
"modified": 1704932239,
"excerpt": "Last month was the second-hottest January on record globally, in a continuation of 2014's warmth.",
"headData": {
"twImgId": "",
"twTitle": "",
"ogTitle": "",
"ogImgId": "",
"twDescription": "",
"description": "Last month was the second-hottest January on record globally, in a continuation of 2014's warmth.",
"title": "2015 Picks Up Where 2014 Record Heat Left Off | KQED",
"ogDescription": "",
"schema": {
"@context": "https://schema.org",
"@type": "Article",
"headline": "2015 Picks Up Where 2014 Record Heat Left Off",
"datePublished": "2015-02-20T09:05:59-08:00",
"dateModified": "2024-01-10T16:17:19-08:00",
"image": "https://cdn.kqed.org/wp-content/uploads/2020/02/KQED-OG-Image@1x.png"
}
},
"guestAuthors": [],
"slug": "2015-picks-up-where-2014-record-heat-left-off",
"status": "publish",
"sticky": false,
"path": "/science/27409/2015-picks-up-where-2014-record-heat-left-off",
"audioTrackLength": null,
"parsedContent": [
{
"type": "contentString",
"content": "\u003cdiv class=\"post-body\">\u003cp>\u003cfigure id=\"attachment_27417\" class=\"wp-caption alignleft\" style=\"max-width: 1024px\">\u003ca href=\"http://ww2.kqed.org/science/wp-content/uploads/sites/35/2015/02/drought-e1424450328699-1024x576.jpg\">\u003cimg loading=\"lazy\" decoding=\"async\" class=\"size-large wp-image-27417\" src=\"http://ww2.kqed.org/science/wp-content/uploads/sites/35/2015/02/drought-e1424450328699-1024x576.jpg\" alt=\"Corn plants struggle to survive in a drought-stricken farm field near Oakton, Indiana. The corn and soybean belt in the middle of the nation is experiencing one of the worst droughts in more than five decades. (Scott Olson/Getty Images)\" width=\"1024\" height=\"576\">\u003c/a>\u003cfigcaption class=\"wp-caption-text\">Corn plants struggle to survive in a drought-stricken farm field near Oakton, Indiana. The corn and soybean belt in the middle of the nation is experiencing one of the worst droughts in more than five decades.\u003cbr>(Scott Olson/Getty Images)\u003c/figcaption>\u003c/figure>\n\u003cp>\u003cstrong>By Andrea Thompson\u003c/strong>\u003cbr>\n\u003cstrong>\u003ca href=\"http://www.climatecentral.org/\">Climate Central\u003c/a>\u003c/strong>\u003c/p>\n\u003cp>The warmth that led 2014 to become the hottest year on record has continued into 2015, with last month ranking as the second-hottest January on record globally, the \u003ca href=\"http://www.ncdc.noaa.gov/sotc/global/2015/1\">National Oceanic and Atmospheric Administration\u003c/a> announced Thursday.\u003c/p>\n\u003cp>“I think it is safe to say that the warmth so far in 2015 really is a continuation of the warmth in 2014,” NOAA climatologist Jake Crouch said in an email.\u003c/p>\n\u003cp>The past month was 1.39°F above the 20th century average of 53.6°F, second only to 2007 in the agency’s records, which go back to 1880. The Japan Meteorological Agency had January 2015 tied with both January 2002 and 2007, while \u003ca href=\"http://data.giss.nasa.gov/gistemp/tabledata_v3/GLB.Ts.txt\">NASA data\u003c/a> put the month in a tie for third with 2002, behind 2007 as the hottest and 2005 and 2013 as the second hottest.\u003c/p>\n\u003cp>Different agencies handle global temperature data in slightly different ways, leading to small differences in monthly and yearly global temperature rankings.\u003c/p>\n\u003cp>\u003c/p>\u003c/div>",
"attributes": {
"named": {},
"numeric": []
}
},
{
"type": "component",
"content": "",
"name": "ad",
"attributes": {
"named": {
"label": "fullwidth"
},
"numeric": [
"fullwidth"
]
}
},
{
"type": "contentString",
"content": "\u003cdiv class=\"post-body\">\u003cp>\u003c/p>\n\u003cp>All three agencies \u003ca href=\"http://www.climatecentral.org/news/a-broken-record-2014-hottest-year-18546\">ranked 2014 as the warmest year\u003c/a> on record by a slim margin, driven by the accumulation of heat-trapping greenhouse gases in the atmosphere. Nine of the 10 hottest years on record have all occurred in the 21st century, with the exception of the blockbuster El Nino year of 1998. There \u003ca href=\"http://www.climatecentral.org/news/2014-set-for-record-hot-record-cold-thing-of-the-past-18360\">hasn’t been a record cold year\u003c/a> set since 1911, while during the same period there have been 19 record-warm years, according to a Climate Central analysis.\u003c/p>\n\u003cp>\u003c/p>\u003cp>\u003c/p>\u003cp>\u003c/p>\n\u003cp>The 2014 mark was largely driven by considerable heat in the world’s oceans, as illustrated in the above graphic of sea surface temperatures \u003ca href=\"http://www.nnvl.noaa.gov/MediaDetail2.php?MediaID=1673&MediaTypeID=1\">released by NOAA\u003c/a>. The map shows that parts of the Pacific were the second warmest on record and the Indian Ocean was the third hottest since 1982.\u003c/p>\n\u003cp>“There’s a lot of warmth in the ocean,” NOAA climatologist Michelle L’Heureux said. Considering that the map shows such anomalous heat even compared to the past 30 or so years, when the signature of global warming had already emerged makes those rankings even more remarkable, she said.\u003c/p>\n\u003cp>The oceans on the whole were the third hottest on record for January 2015, according to NOAA. Record ocean warmth was seen off both coasts of North America; the hot waters off the West Coast has helped reinforce the unseasonably high temperatures and dry conditions in that part of the U.S.\u003c/p>\n\u003cp>Other ocean areas were much warmer than normal, though there were some cool spots, most notably in the North Atlantic between Greenland and Europe where record-cold sea surface temperatures were recorded.\u003c/p>\n\u003cp>How global temperatures shape up over the rest of the year remains to be seen, but the ocean tends to hang on to heat for much longer than land areas, which will keep temperatures elevated for awhile. And as \u003ca href=\"http://www.climatecentral.org/news/2015-begins-with-co2-above-400-ppm-mark-18534\">carbon dioxide\u003c/a> and other greenhouse gases continue to be emitted, the dice will be loaded to warmer and warmer years in the future.\u003c/p>\n\u003cp>\u003c/p>\n\u003cp>\u003ca href=\"http://www.climatecentral.org/\">Climate Central\u003c/a> \u003cem>is an independent organization that researches and reports on climate change.\u003c/em>\u003c/p>\n\n\u003c/div>\u003c/p>",
"attributes": {
"named": {},
"numeric": []
}
}
],
"link": "/science/27409/2015-picks-up-where-2014-record-heat-left-off",
"authors": [
"6387"
],
"categories": [
"science_31"
],
"tags": [
"science_194",
"science_64",
"science_5175",
"science_3811"
],
"featImg": "science_27417",
"label": "science"
},
"science_27188": {
"type": "posts",
"id": "science_27188",
"meta": {
"index": "posts_1716263798",
"site": "science",
"id": "27188",
"score": null,
"sort": [
1423768735000
]
},
"parent": 0,
"labelTerm": {
"site": "science",
"term": 1151
},
"blocks": [],
"publishDate": 1423768735,
"format": "aside",
"title": "New Study: Global Warming Will Bring Megadroughts to the West",
"headTitle": "New Study: Global Warming Will Bring Megadroughts to the West | KQED",
"content": "\u003cfigure id=\"attachment_27189\" class=\"wp-caption aligncenter\" style=\"max-width: 800px\">\u003ca href=\"http://ww2.kqed.org/science/wp-content/uploads/sites/35/2015/02/Ten-century-drought.png\">\u003cimg loading=\"lazy\" decoding=\"async\" class=\"size-full wp-image-27189\" src=\"http://ww2.kqed.org/science/wp-content/uploads/sites/35/2015/02/Ten-century-drought.png\" alt=\"11 centuries of drought\" width=\"800\" height=\"450\">\u003c/a>\u003cfigcaption class=\"wp-caption-text\">Drought conditions during the last thousand years (brown line), along with projected conditions for the rest of this century, point to unprecedented megadroughts. Details of this graph are shown below. (All images Cook/AAAS)\u003c/figcaption>\u003c/figure>\n\u003cp>Scientists taking a hard look at America’s climate future foresee long-lasting droughts later in this century unlike any in the last thousand years. The primary blame belongs to global warming from human activities, according to a \u003ca href=\"http://advances.sciencemag.org/content/1/1/e1400082\">study released today\u003c/a> in the new open-access journal \u003ci>Science Advances\u003c/i>.\u003c/p>\n\u003cp>Climate forecasts for the whole globe are well established. The scientific community accepts that when you consider the planet as a single pixel, adding carbon dioxide to the atmosphere inevitably makes the world hotter.\u003c/p>\n\u003cp>However, climate forecasts for smaller regions of the world– like individual continents– are more of a cutting-edge exercise. Models differ and uncertainties are important. But in this new study a team of three climate scientists—Benjamin Cook (NASA), Toby Ault (Lamont-Doherty Earth Observatory) and Jason Smerdon (Cornell)—made regional forecasts that project intense drying in two large parts of the U.S.: the Central Plains and the Southwest.\u003c/p>\n\u003cp>Cook’s team started by taking a group of 17 leading computer climate models and running simulations of the climate from 1931 through 2099 that include rising average temperatures. They generated two alternative futures: 1) a “business-as-usual” simulation in which nothing much changes in our global greenhouse gas emissions; and 2) a more moderate scenario in which we make some progress in shrinking emissions.\u003c/p>\n\u003cp>They asked the models specifically to predict the level of moisture in the soil in the Central Plains and the Southwest. They used three different measures, including the \u003ca href=\"http://www.drought.gov/drought/content/products-current-drought-and-monitoring-drought-indicators/palmer-drought-severity-index\">Palmer Drought Severity Index\u003c/a>. The PDSI is used by many agencies and is a common target in modeling studies. (After three years of scant rains, the Bay Area is sitting at \u003ca href=\"http://www1.ncdc.noaa.gov/pub/data/cmb/drought/recovery/current/curr-pmdi.gif\">a PDSI value below –4, or extreme drought\u003c/a>.)\u003c/p>\n\u003cp>[ad fullwidth]\u003c/p>\n\u003cp>Cook’s team ran the models a thousand times and determined the statistically best results, the so-called Monte Carlo technique. The results are consistent: more heat and greater evaporation mean less water in the soil. For the second half of this century, the results point to a state of unrelenting severe drought.\u003c/p>\n\u003cfigure id=\"attachment_27191\" class=\"wp-caption aligncenter\" style=\"max-width: 450px\">\u003ca href=\"http://ww2.kqed.org/science/wp-content/uploads/sites/35/2015/02/PDSI-NorthAmerica.png\">\u003cimg loading=\"lazy\" decoding=\"async\" class=\"size-full wp-image-27191\" src=\"http://ww2.kqed.org/science/wp-content/uploads/sites/35/2015/02/PDSI-NorthAmerica.png\" alt=\"North American projected PDSI\" width=\"450\" height=\"278\">\u003c/a>\u003cfigcaption class=\"wp-caption-text\">PDSI levels for the whole period 2050 to 2099 under the business-as-usual scenario. Dashed lines outline the Central Plains and Southwest regions that were modeled for the \u003ci>Science Advances\u003c/i> study. Note that the Southwest region includes California.\u003c/figcaption>\u003c/figure>\n\u003cp>Their next step was to compare their 21st-century forecasts to the climate record of the past. For that they took the North American Drought Atlas (\u003ca href=\"http://iridl.ldeo.columbia.edu/SOURCES/.LDEO/.TRL/.NADA2004/.pdsi-atlas.html\">NADA\u003c/a>), a well-regarded record of summer droughts based on tree rings that goes back 2000 years and translates directly to PDSI numbers.\u003c/p>\n\u003cp>Here are the results for the Southwest region since about 1750—approximately the historical record. The tree-ring record shows that the upcoming droughts would greatly exceed anything in the historical record. Note that California is part of this region.\u003c/p>\n\u003cfigure id=\"attachment_27190\" class=\"wp-caption aligncenter\" style=\"max-width: 500px\">\u003ca href=\"http://ww2.kqed.org/science/wp-content/uploads/sites/35/2015/02/southwest-droughtcurve.png\">\u003cimg loading=\"lazy\" decoding=\"async\" class=\"size-full wp-image-27190\" src=\"http://ww2.kqed.org/science/wp-content/uploads/sites/35/2015/02/southwest-droughtcurve.png\" alt=\"Projected drought for the Southwest\" width=\"500\" height=\"426\">\u003c/a>\u003cfigcaption class=\"wp-caption-text\">Forecasted drought in the Southwest in terms of PDSI (red) and two other measures of soil moisture (blue and green), compared with the NADA tree-ring record (brown) since 1750. The gray zone is the range of the 17 different climate models used.\u003c/figcaption>\u003c/figure>\n\u003cp>The comparison for the Central Plains region is similar. Here it’s interesting to note that in the mid-1800s, just before settlement began, this part of the West was known as the “Great American Desert.” The study’s projections show the area is likely to return to that state and then get worse.\u003c/p>\n\u003cfigure id=\"attachment_27192\" class=\"wp-caption aligncenter\" style=\"max-width: 500px\">\u003ca href=\"http://ww2.kqed.org/science/wp-content/uploads/sites/35/2015/02/midwest-droughtcurve.png\">\u003cimg loading=\"lazy\" decoding=\"async\" class=\"size-full wp-image-27192\" src=\"http://ww2.kqed.org/science/wp-content/uploads/sites/35/2015/02/midwest-droughtcurve.png\" alt=\"Projected drought for the Central Plains\" width=\"500\" height=\"428\">\u003c/a>\u003cfigcaption class=\"wp-caption-text\">Forecasted drought in the Central Plains region compared with the tree-ring record.\u003c/figcaption>\u003c/figure>\n\u003cp>Cook’s team looked farther back in time, and compared their 21st-century forecasts against the last thousand years of the tree-ring drought record. That record is our best gauge of natural variation, how much the climate swings back and forth on its own. The graph, at the top of this post, shows a future state of persistent drought exceeding everything in the last millennium.\u003c/p>\n\u003cp>Severe “megadroughts” have happened in the past that lasted 10 years or longer. The authors fix the odds of one at about 12% during historical time. For the second half of this century, though, they put the chances of a megadrought at 80% or greater.\u003c/p>\n\u003cp>“Our results,” they conclude, “point to a markedly drier future that falls far outside the contemporary experience of natural and human systems in Western North America.” Because we already pump more water out of the ground than the rains put back, the outlook is grim under business as usual and “nearly identical,” they say, under the more moderate scenario. It doesn’t take much thought to realize the changes that may be in store for the residents and ecosystems of these areas.\u003c/p>\n\u003cp>\u003c/p>\n\u003cp>Look for \u003ca href=\"http://advances.sciencemag.org/content/1/1/e1400082\">this paper, which is publicly readable\u003c/a>, to be discussed wherever climate change is debated. The beauty of open-access science like this is that it helps keep arguments focused and gives everyone the chance to consult the evidence for themselves.\u003c/p>\n\n",
"stats": {
"hasVideo": false,
"hasChartOrMap": false,
"hasAudio": false,
"hasPolis": false,
"wordCount": 873,
"hasGoogleForm": false,
"hasGallery": false,
"hasHearkenModule": false,
"iframeSrcs": [],
"paragraphCount": 15
},
"modified": 1704932281,
"excerpt": "Our best climate models, combined with our best climate records, foresee at least a century of profound drought in the Midwest and Southwest.",
"headData": {
"twImgId": "",
"twTitle": "",
"ogTitle": "",
"ogImgId": "",
"twDescription": "",
"description": "Our best climate models, combined with our best climate records, foresee at least a century of profound drought in the Midwest and Southwest.",
"title": "New Study: Global Warming Will Bring Megadroughts to the West | KQED",
"ogDescription": "",
"schema": {
"@context": "https://schema.org",
"@type": "Article",
"headline": "New Study: Global Warming Will Bring Megadroughts to the West",
"datePublished": "2015-02-12T11:18:55-08:00",
"dateModified": "2024-01-10T16:18:01-08:00",
"image": "https://cdn.kqed.org/wp-content/uploads/2020/02/KQED-OG-Image@1x.png"
}
},
"guestAuthors": [],
"slug": "new-study-global-warming-will-bring-megadroughts-to-the-west",
"status": "publish",
"sticky": false,
"path": "/science/27188/new-study-global-warming-will-bring-megadroughts-to-the-west",
"audioTrackLength": null,
"parsedContent": [
{
"type": "contentString",
"content": "\u003cdiv class=\"post-body\">\u003cp>\u003cfigure id=\"attachment_27189\" class=\"wp-caption aligncenter\" style=\"max-width: 800px\">\u003ca href=\"http://ww2.kqed.org/science/wp-content/uploads/sites/35/2015/02/Ten-century-drought.png\">\u003cimg loading=\"lazy\" decoding=\"async\" class=\"size-full wp-image-27189\" src=\"http://ww2.kqed.org/science/wp-content/uploads/sites/35/2015/02/Ten-century-drought.png\" alt=\"11 centuries of drought\" width=\"800\" height=\"450\">\u003c/a>\u003cfigcaption class=\"wp-caption-text\">Drought conditions during the last thousand years (brown line), along with projected conditions for the rest of this century, point to unprecedented megadroughts. Details of this graph are shown below. (All images Cook/AAAS)\u003c/figcaption>\u003c/figure>\n\u003cp>Scientists taking a hard look at America’s climate future foresee long-lasting droughts later in this century unlike any in the last thousand years. The primary blame belongs to global warming from human activities, according to a \u003ca href=\"http://advances.sciencemag.org/content/1/1/e1400082\">study released today\u003c/a> in the new open-access journal \u003ci>Science Advances\u003c/i>.\u003c/p>\n\u003cp>Climate forecasts for the whole globe are well established. The scientific community accepts that when you consider the planet as a single pixel, adding carbon dioxide to the atmosphere inevitably makes the world hotter.\u003c/p>\n\u003cp>However, climate forecasts for smaller regions of the world– like individual continents– are more of a cutting-edge exercise. Models differ and uncertainties are important. But in this new study a team of three climate scientists—Benjamin Cook (NASA), Toby Ault (Lamont-Doherty Earth Observatory) and Jason Smerdon (Cornell)—made regional forecasts that project intense drying in two large parts of the U.S.: the Central Plains and the Southwest.\u003c/p>\n\u003cp>Cook’s team started by taking a group of 17 leading computer climate models and running simulations of the climate from 1931 through 2099 that include rising average temperatures. They generated two alternative futures: 1) a “business-as-usual” simulation in which nothing much changes in our global greenhouse gas emissions; and 2) a more moderate scenario in which we make some progress in shrinking emissions.\u003c/p>\n\u003cp>They asked the models specifically to predict the level of moisture in the soil in the Central Plains and the Southwest. They used three different measures, including the \u003ca href=\"http://www.drought.gov/drought/content/products-current-drought-and-monitoring-drought-indicators/palmer-drought-severity-index\">Palmer Drought Severity Index\u003c/a>. The PDSI is used by many agencies and is a common target in modeling studies. (After three years of scant rains, the Bay Area is sitting at \u003ca href=\"http://www1.ncdc.noaa.gov/pub/data/cmb/drought/recovery/current/curr-pmdi.gif\">a PDSI value below –4, or extreme drought\u003c/a>.)\u003c/p>\n\u003cp>\u003c/p>\u003c/div>",
"attributes": {
"named": {},
"numeric": []
}
},
{
"type": "component",
"content": "",
"name": "ad",
"attributes": {
"named": {
"label": "fullwidth"
},
"numeric": [
"fullwidth"
]
}
},
{
"type": "contentString",
"content": "\u003cdiv class=\"post-body\">\u003cp>\u003c/p>\n\u003cp>Cook’s team ran the models a thousand times and determined the statistically best results, the so-called Monte Carlo technique. The results are consistent: more heat and greater evaporation mean less water in the soil. For the second half of this century, the results point to a state of unrelenting severe drought.\u003c/p>\n\u003cfigure id=\"attachment_27191\" class=\"wp-caption aligncenter\" style=\"max-width: 450px\">\u003ca href=\"http://ww2.kqed.org/science/wp-content/uploads/sites/35/2015/02/PDSI-NorthAmerica.png\">\u003cimg loading=\"lazy\" decoding=\"async\" class=\"size-full wp-image-27191\" src=\"http://ww2.kqed.org/science/wp-content/uploads/sites/35/2015/02/PDSI-NorthAmerica.png\" alt=\"North American projected PDSI\" width=\"450\" height=\"278\">\u003c/a>\u003cfigcaption class=\"wp-caption-text\">PDSI levels for the whole period 2050 to 2099 under the business-as-usual scenario. Dashed lines outline the Central Plains and Southwest regions that were modeled for the \u003ci>Science Advances\u003c/i> study. Note that the Southwest region includes California.\u003c/figcaption>\u003c/figure>\n\u003cp>Their next step was to compare their 21st-century forecasts to the climate record of the past. For that they took the North American Drought Atlas (\u003ca href=\"http://iridl.ldeo.columbia.edu/SOURCES/.LDEO/.TRL/.NADA2004/.pdsi-atlas.html\">NADA\u003c/a>), a well-regarded record of summer droughts based on tree rings that goes back 2000 years and translates directly to PDSI numbers.\u003c/p>\n\u003cp>Here are the results for the Southwest region since about 1750—approximately the historical record. The tree-ring record shows that the upcoming droughts would greatly exceed anything in the historical record. Note that California is part of this region.\u003c/p>\n\u003cfigure id=\"attachment_27190\" class=\"wp-caption aligncenter\" style=\"max-width: 500px\">\u003ca href=\"http://ww2.kqed.org/science/wp-content/uploads/sites/35/2015/02/southwest-droughtcurve.png\">\u003cimg loading=\"lazy\" decoding=\"async\" class=\"size-full wp-image-27190\" src=\"http://ww2.kqed.org/science/wp-content/uploads/sites/35/2015/02/southwest-droughtcurve.png\" alt=\"Projected drought for the Southwest\" width=\"500\" height=\"426\">\u003c/a>\u003cfigcaption class=\"wp-caption-text\">Forecasted drought in the Southwest in terms of PDSI (red) and two other measures of soil moisture (blue and green), compared with the NADA tree-ring record (brown) since 1750. The gray zone is the range of the 17 different climate models used.\u003c/figcaption>\u003c/figure>\n\u003cp>The comparison for the Central Plains region is similar. Here it’s interesting to note that in the mid-1800s, just before settlement began, this part of the West was known as the “Great American Desert.” The study’s projections show the area is likely to return to that state and then get worse.\u003c/p>\n\u003cfigure id=\"attachment_27192\" class=\"wp-caption aligncenter\" style=\"max-width: 500px\">\u003ca href=\"http://ww2.kqed.org/science/wp-content/uploads/sites/35/2015/02/midwest-droughtcurve.png\">\u003cimg loading=\"lazy\" decoding=\"async\" class=\"size-full wp-image-27192\" src=\"http://ww2.kqed.org/science/wp-content/uploads/sites/35/2015/02/midwest-droughtcurve.png\" alt=\"Projected drought for the Central Plains\" width=\"500\" height=\"428\">\u003c/a>\u003cfigcaption class=\"wp-caption-text\">Forecasted drought in the Central Plains region compared with the tree-ring record.\u003c/figcaption>\u003c/figure>\n\u003cp>Cook’s team looked farther back in time, and compared their 21st-century forecasts against the last thousand years of the tree-ring drought record. That record is our best gauge of natural variation, how much the climate swings back and forth on its own. The graph, at the top of this post, shows a future state of persistent drought exceeding everything in the last millennium.\u003c/p>\n\u003cp>Severe “megadroughts” have happened in the past that lasted 10 years or longer. The authors fix the odds of one at about 12% during historical time. For the second half of this century, though, they put the chances of a megadrought at 80% or greater.\u003c/p>\n\u003cp>“Our results,” they conclude, “point to a markedly drier future that falls far outside the contemporary experience of natural and human systems in Western North America.” Because we already pump more water out of the ground than the rains put back, the outlook is grim under business as usual and “nearly identical,” they say, under the more moderate scenario. It doesn’t take much thought to realize the changes that may be in store for the residents and ecosystems of these areas.\u003c/p>\n\u003cp>\u003c/p>\n\u003cp>Look for \u003ca href=\"http://advances.sciencemag.org/content/1/1/e1400082\">this paper, which is publicly readable\u003c/a>, to be discussed wherever climate change is debated. The beauty of open-access science like this is that it helps keep arguments focused and gives everyone the chance to consult the evidence for themselves.\u003c/p>\n\n\u003c/div>\u003c/p>",
"attributes": {
"named": {},
"numeric": []
}
}
],
"link": "/science/27188/new-study-global-warming-will-bring-megadroughts-to-the-west",
"authors": [
"6228"
],
"series": [
"science_1151"
],
"categories": [
"science_31"
],
"tags": [
"science_194",
"science_572",
"science_556"
],
"featImg": "science_27189",
"label": "science_1151"
},
"science_26347": {
"type": "posts",
"id": "science_26347",
"meta": {
"index": "posts_1716263798",
"site": "science",
"id": "26347",
"score": null,
"sort": [
1421432835000
]
},
"parent": 0,
"labelTerm": {
"site": "science"
},
"blocks": [],
"publishDate": 1421432835,
"format": "aside",
"title": "It's Official: 2014 Was The Hottest Year on Record, NOAA Says",
"headTitle": "It’s Official: 2014 Was The Hottest Year on Record, NOAA Says | KQED",
"content": "\u003cp>http://www.youtube.com/watch?v=WtPkFBbJLMg\u003cbr>\n\u003cstrong>By \u003ca href=\"http://www.npr.org/people/348764934/eyder-peralta\">Eyder Peralta\u003c/a>\u003c/strong>\u003cbr>\n\u003cstrong> NPR\u003c/strong>\u003c/p>\n\u003cp>It’s official: 2014 was the hottest year on record.\u003c/p>\n\u003cp>The National Oceanic and Atmospheric Administration’s National Climatic Data Center crunched the numbers and \u003ca href=\"http://www.ncdc.noaa.gov/sotc/global/2014/13\">came to this conclusion\u003c/a>:\u003c/p>\n\u003cp>“The year 2014 was the warmest year across global land and ocean surfaces since records began in 1880. The annually-averaged temperature was 0.69°C (1.24°F) above the 20th century average of 13.9°C (57.0°F), easily breaking the previous records of 2005 and 2010 by 0.04°C (0.07°F). This also marks the 38th consecutive year (since 1977) that the yearly global temperature was above average. Including 2014, 9 of the 10 warmest years in the 135-year period of record have occurred in the 21st century. 1998 currently ranks as the fourth warmest year on record.”\u003c/p>\n\u003cp>\u003ca href=\"http://www.npr.org/blogs/thetwo-way/2014/12/04/368533781/2014-to-be-warmest-year-on-record-u-n-weather-agency-says\">We’ve been expecting this news since December\u003c/a>, but NOAA has now made it official.\u003c/p>\n\u003cp>[ad fullwidth]\u003c/p>\n\u003cp>Here’s a good graphic that tells you how temperatures fared globally in relation to a 1981-2010 average:\u003c/p>\n\u003cp>\u003ca href=\"http://ww2.kqed.org/science/wp-content/uploads/sites/35/2015/01/NOAA-image.gif\">\u003cimg loading=\"lazy\" decoding=\"async\" class=\"alignright wp-image-26350 size-full\" src=\"http://ww2.kqed.org/science/wp-content/uploads/sites/35/2015/01/NOAA-image.gif\" alt=\"NOAA image\" width=\"800\" height=\"619\">\u003c/a>\u003c/p>\n\u003cp>\u003cem>Editor’s Note: Federal climate scientists \u003ca href=\"http://ww2.kqed.org/science/2015/01/08/2014-californias-warmest-year-on-record/\">confirmed last week\u003c/a> that 2014 was California’s \u003ca href=\"http://www.ncdc.noaa.gov/temp-and-precip/climatological-rankings/index.php?periods%5B%5D=ytd¶meter=tavg&state=4&div=0&month=12&year=2014#ranks-form\">warmest year on record\u003c/a>, clocking in at 4.1 degrees higher than the 20th century average. \u003c/em>\u003c/p>\n\u003cp>Among western states, Alaska, Arizona and Nevada also had their warmest year on record. Scientists say the warm weather made California’s \u003ca href=\"http://ww2.kqed.org/science/2014/10/14/high-temps-intensified-california-drought/\">already withering drought even worse\u003c/a> through evaporation, transpiration (the water taken up by plants) and warm overnight lows that melted snow more quickly.\u003c/p>\n\u003cp>\u003c/p>\n\u003cp>Last year’s warm temperatures made air pollution worse in the San Joaquin Valley, where doctors saw more people with asthma and respiratory infections. The record temperatures also \u003ca href=\"http://ww2.kqed.org/science/audio/parched-california-wildlife-suffers-in-drought/\">shrank wetlands and warmed streams\u003c/a> where salmon spawn. Fishermen expect many salmon eggs will die, as they need cold water (ideally 56 degrees or less) to survive.\u003c/p>\n\n",
"stats": {
"hasVideo": false,
"hasChartOrMap": false,
"hasAudio": false,
"hasPolis": false,
"wordCount": 323,
"hasGoogleForm": false,
"hasGallery": false,
"hasHearkenModule": false,
"iframeSrcs": [],
"paragraphCount": 11
},
"modified": 1704932388,
"excerpt": "The annually-averaged temperature was 1.24 degrees Fahrenheit over the 20th century average, and easily broke the records set in 2005 and 2010.",
"headData": {
"twImgId": "",
"twTitle": "",
"ogTitle": "",
"ogImgId": "",
"twDescription": "",
"description": "The annually-averaged temperature was 1.24 degrees Fahrenheit over the 20th century average, and easily broke the records set in 2005 and 2010.",
"title": "It's Official: 2014 Was The Hottest Year on Record, NOAA Says | KQED",
"ogDescription": "",
"schema": {
"@context": "https://schema.org",
"@type": "Article",
"headline": "It's Official: 2014 Was The Hottest Year on Record, NOAA Says",
"datePublished": "2015-01-16T10:27:15-08:00",
"dateModified": "2024-01-10T16:19:48-08:00",
"image": "https://cdn.kqed.org/wp-content/uploads/2020/02/KQED-OG-Image@1x.png"
}
},
"guestAuthors": [],
"slug": "its-official-2014-was-the-hottest-year-on-record-noaa-says",
"status": "publish",
"sticky": false,
"path": "/science/26347/its-official-2014-was-the-hottest-year-on-record-noaa-says",
"audioTrackLength": null,
"parsedContent": [
{
"type": "contentString",
"content": "\u003cdiv class=\"post-body\">\u003cp>\u003cp>http://www.youtube.com/watch?v=WtPkFBbJLMg\u003cbr>\n\u003cstrong>By \u003ca href=\"http://www.npr.org/people/348764934/eyder-peralta\">Eyder Peralta\u003c/a>\u003c/strong>\u003cbr>\n\u003cstrong> NPR\u003c/strong>\u003c/p>\n\u003cp>It’s official: 2014 was the hottest year on record.\u003c/p>\n\u003cp>The National Oceanic and Atmospheric Administration’s National Climatic Data Center crunched the numbers and \u003ca href=\"http://www.ncdc.noaa.gov/sotc/global/2014/13\">came to this conclusion\u003c/a>:\u003c/p>\n\u003cp>“The year 2014 was the warmest year across global land and ocean surfaces since records began in 1880. The annually-averaged temperature was 0.69°C (1.24°F) above the 20th century average of 13.9°C (57.0°F), easily breaking the previous records of 2005 and 2010 by 0.04°C (0.07°F). This also marks the 38th consecutive year (since 1977) that the yearly global temperature was above average. Including 2014, 9 of the 10 warmest years in the 135-year period of record have occurred in the 21st century. 1998 currently ranks as the fourth warmest year on record.”\u003c/p>\n\u003cp>\u003ca href=\"http://www.npr.org/blogs/thetwo-way/2014/12/04/368533781/2014-to-be-warmest-year-on-record-u-n-weather-agency-says\">We’ve been expecting this news since December\u003c/a>, but NOAA has now made it official.\u003c/p>\n\u003cp>\u003c/p>\u003c/div>",
"attributes": {
"named": {},
"numeric": []
}
},
{
"type": "component",
"content": "",
"name": "ad",
"attributes": {
"named": {
"label": "fullwidth"
},
"numeric": [
"fullwidth"
]
}
},
{
"type": "contentString",
"content": "\u003cdiv class=\"post-body\">\u003cp>\u003c/p>\n\u003cp>Here’s a good graphic that tells you how temperatures fared globally in relation to a 1981-2010 average:\u003c/p>\n\u003cp>\u003ca href=\"http://ww2.kqed.org/science/wp-content/uploads/sites/35/2015/01/NOAA-image.gif\">\u003cimg loading=\"lazy\" decoding=\"async\" class=\"alignright wp-image-26350 size-full\" src=\"http://ww2.kqed.org/science/wp-content/uploads/sites/35/2015/01/NOAA-image.gif\" alt=\"NOAA image\" width=\"800\" height=\"619\">\u003c/a>\u003c/p>\n\u003cp>\u003cem>Editor’s Note: Federal climate scientists \u003ca href=\"http://ww2.kqed.org/science/2015/01/08/2014-californias-warmest-year-on-record/\">confirmed last week\u003c/a> that 2014 was California’s \u003ca href=\"http://www.ncdc.noaa.gov/temp-and-precip/climatological-rankings/index.php?periods%5B%5D=ytd¶meter=tavg&state=4&div=0&month=12&year=2014#ranks-form\">warmest year on record\u003c/a>, clocking in at 4.1 degrees higher than the 20th century average. \u003c/em>\u003c/p>\n\u003cp>Among western states, Alaska, Arizona and Nevada also had their warmest year on record. Scientists say the warm weather made California’s \u003ca href=\"http://ww2.kqed.org/science/2014/10/14/high-temps-intensified-california-drought/\">already withering drought even worse\u003c/a> through evaporation, transpiration (the water taken up by plants) and warm overnight lows that melted snow more quickly.\u003c/p>\n\u003cp>\u003c/p>\n\u003cp>Last year’s warm temperatures made air pollution worse in the San Joaquin Valley, where doctors saw more people with asthma and respiratory infections. The record temperatures also \u003ca href=\"http://ww2.kqed.org/science/audio/parched-california-wildlife-suffers-in-drought/\">shrank wetlands and warmed streams\u003c/a> where salmon spawn. Fishermen expect many salmon eggs will die, as they need cold water (ideally 56 degrees or less) to survive.\u003c/p>\n\n\u003c/div>\u003c/p>",
"attributes": {
"named": {},
"numeric": []
}
}
],
"link": "/science/26347/its-official-2014-was-the-hottest-year-on-record-noaa-says",
"authors": [
"6387"
],
"categories": [
"science_31",
"science_35"
],
"tags": [
"science_194",
"science_64",
"science_556",
"science_5182"
],
"featImg": "science_26350",
"label": "science"
},
"science_26317": {
"type": "posts",
"id": "science_26317",
"meta": {
"index": "posts_1716263798",
"site": "science",
"id": "26317",
"score": null,
"sort": [
1421355228000
]
},
"parent": 0,
"labelTerm": {},
"blocks": [],
"publishDate": 1421355228,
"format": "aside",
"title": "New Climate Research Suggests Acceleration of Sea Level Rise",
"headTitle": "New Climate Research Suggests Acceleration of Sea Level Rise | KQED",
"content": "\u003cfigure id=\"attachment_26318\" class=\"wp-caption aligncenter\" style=\"max-width: 800px\">\u003ca href=\"http://ww2.kqed.org/science/wp-content/uploads/sites/35/2015/01/SF-tide-gauges.jpg\">\u003cimg loading=\"lazy\" decoding=\"async\" src=\"http://ww2.kqed.org/science/wp-content/uploads/sites/35/2015/01/SF-tide-gauges.jpg\" alt=\"San Francisco tide gauges\" width=\"800\" height=\"450\" class=\"size-full wp-image-26318\">\u003c/a>\u003cfigcaption class=\"wp-caption-text\">Tide gauges at the Brannan Steet Wharf, San Francisco. Sea level is the result of a complex set of forces and influences on land, on the seafloor and in the water between them. Estimating sea level rise from imperfect data is a scientific challenge that may progress through more sophisticated statistics. (\u003ca href=\"https://www.flickr.com/photos/daver6/\">Dave R\u003c/a>/\u003ca href=\"https://creativecommons.org/licenses/by-nc/2.0/\">CC-BY-NC\u003c/a>)\u003c/figcaption>\u003c/figure>\n\u003cp>A reassessment of historical data suggests that compared to previous estimates, the world’s sea level rose more slowly during the 20th century—and is rising faster now.\u003c/p>\n\u003cp>Sea level is one of those things that grows more complex with closer scrunity. \u003ca href=\"http://isites.harvard.edu/icb/icb.do?keyword=k92805\" target=\"_blank\" rel=\"noopener\">Jerry Mitrovica\u003c/a>, a researcher at Harvard, tells his audiences to step way back and think of sea level only as the distance between the seafloor and the sea surface. Both of those end points are known to move up or down (relative to the Earth’s center) for reasons that have little to do with the actual amount of water between them. Sea level science is the task of untangling all of those reasons and measuring their precise effects on where the water sits against a particular piece of shoreline.\u003c/p>\n\u003cp>Here’s a partial list of the things known to affect sea level. The position of the seafloor may change, just like the land, because of erosion or deposition of sediment. The weight of ice caps pushes the Earth’s crust downward while the surrounding crust rises, like an air mattress in a swimming pool when a child climbs aboard it—and the reverse happens when the ice melts. The land near the sea may rise or fall with human-caused changes like groundwater pumping, or as sediments naturally compact. Finally, different parts of the Earth’s crust rise, fall and move sideways with the activities of plate tectonics.\u003c/p>\n\u003cp>The amount of water in the sea itself may increase or decrease as rivers (and reservoirs) rise and fall, and as ice caps grow and shrink. At the same time, the density of seawater changes with its temperature. \u003c/p>\n\u003cp>The surface of the sea itself is changeable. Persistent weather patterns and oceanic currents pile up water in some places and pull it down in others. The water surface is extremely sensitive to the gravity of everything around it—the moon and sun create its well-known tides, and the gravity of large ice caps adds a slight gathering force to the seas around them that disappears as the ice melts. \u003c/p>\n\u003cp>[ad fullwidth]\u003c/p>\n\u003cp>In measuring all of this, we rely today on historical records from tide gauges in many coastal cities as well as contemporary, broad-scale data from satellites. The old tide records are a noisy, imperfect data set with limited coverage on the map and time gaps of missing measurements. Each point of data has various degrees of uncertainty, some of them poorly known. For instance, building a new harbor near an old tide gauge can change how the water acts around it. (Satellite orbits, and the system that tracks them, are prone to their own set of uncertainties.) \u003c/p>\n\u003cp>\u003c!-- iframe plugin v.4.3 wordpress.org/plugins/iframe/ -->\u003cbr>\n\u003ciframe loading=\"lazy\" src=\"http://science.kqed.org/quest/video/science-on-the-spot-watching-the-tides/?embed=1\" height=\"359\" width=\"639\" frameborder=\"0\" scrolling=\"no\" class=\"iframe-class\">\u003c/iframe>\u003c/p>\n\u003cp>\u003cem>Video: QUEST’s “\u003ca href=\"Watching%20the%20Tides\" target=\"_blank\" rel=\"noopener\">Watching the Tides\u003c/a>” from its Science on the SPOT series. \u003c/em>\u003c/p>\n\u003cp>The task of scientists is to zero in on these error sources and learn how to correct them, with a view toward approaching as closely as possible a clean clear truth. It’s a two-sided task. One side is getting better data, and the other side is making better mathematical models to fit against the data. \u003c/p>\n\u003cp>The most widely accepted studies of tide-gauge records have said that 20th century sea levels rose, on average, between 1.6 and 1.9 millimeters per year. This is fine, except that it’s about one-third greater than the sum of its parts—the various factors I mentioned. The budget of causes and effects is not closed.\u003c/p>\n\u003cp>\u003ca href=\"http://www.nature.com/nature/journal/vaop/ncurrent/full/nature14093.html\">In the latest issue of \u003ci>Nature\u003c/i>\u003c/a>, three climate researchers from Rutgers University and Mitrovica took a new statistical approach to the tide-gauge data from the last century. Called Kalman filtering, it handles a noisy data record by giving more weight to the most trustworthy evidence. (Kalman filtering is spreading across Earth science, offering a new look at many old problems.) It uses the mathematical sea level models to help correct the tide-gauge data.\u003c/p>\n\u003cp>The team’s results put 20th century sea level rise at about 1.2 mm/yr, right where the models say it should be. This may or may not be a comforting coincidence, and other researchers will want to check the results themselves in their own ways. It bolsters what the big climate reports from the IPCC have been saying about rising sea level.\u003c/p>\n\u003cp>On the other hand, the \u003ci>Nature\u003c/i> analysis confirms that more recent sea level rise, as estimated from satellite data, is also correct—and since 1990, the sea has been rising much faster than the 20th century average. That is, the sea level curve, graphed through time, looks more like the “hockey stick” of global air temperature. If the Kalman approach is repeated and more widely accepted, the truth looks more inconvenient than ever.\u003c/p>\n\u003cp>\u003c/p>\n\u003cp>\u003cstrong>PS:\u003c/strong> Sea level researchers extend their work into the geologic past, too. The Pliocene Epoch, 3 million years ago, is the last time in Earth history that atmospheric CO\u003csub>2\u003c/sub> was as high as today, and in the \u003ca href=\"http://sealevelstudy.org/sea-change-science/whats-sea-change-science/pliomax-sites/southeast-u.s\">Pliomax project\u003c/a> Mitrovica is gathering evidence from the eastern U.S. about that ancient time.\u003c/p>\n\n",
"stats": {
"hasVideo": false,
"hasChartOrMap": false,
"hasAudio": false,
"hasPolis": false,
"wordCount": 917,
"hasGoogleForm": false,
"hasGallery": false,
"hasHearkenModule": false,
"iframeSrcs": [],
"paragraphCount": 16
},
"modified": 1704932392,
"excerpt": "A reassessment of historical data suggests that compared to previous estimates, the world's sea level rose more slowly during the 20th century—and is rising faster now.",
"headData": {
"twImgId": "",
"twTitle": "",
"ogTitle": "",
"ogImgId": "",
"twDescription": "",
"description": "A reassessment of historical data suggests that compared to previous estimates, the world's sea level rose more slowly during the 20th century—and is rising faster now.",
"title": "New Climate Research Suggests Acceleration of Sea Level Rise | KQED",
"ogDescription": "",
"schema": {
"@context": "https://schema.org",
"@type": "Article",
"headline": "New Climate Research Suggests Acceleration of Sea Level Rise",
"datePublished": "2015-01-15T12:53:48-08:00",
"dateModified": "2024-01-10T16:19:52-08:00",
"image": "https://cdn.kqed.org/wp-content/uploads/2020/02/KQED-OG-Image@1x.png"
}
},
"guestAuthors": [],
"slug": "new-climate-research-suggests-acceleration-of-sea-level-rise",
"status": "publish",
"sourceUrl": "https://ww2.kqed.org/science/",
"sticky": false,
"source": "KQED Science",
"path": "/science/26317/new-climate-research-suggests-acceleration-of-sea-level-rise",
"audioTrackLength": null,
"parsedContent": [
{
"type": "contentString",
"content": "\u003cdiv class=\"post-body\">\u003cp>\u003cfigure id=\"attachment_26318\" class=\"wp-caption aligncenter\" style=\"max-width: 800px\">\u003ca href=\"http://ww2.kqed.org/science/wp-content/uploads/sites/35/2015/01/SF-tide-gauges.jpg\">\u003cimg loading=\"lazy\" decoding=\"async\" src=\"http://ww2.kqed.org/science/wp-content/uploads/sites/35/2015/01/SF-tide-gauges.jpg\" alt=\"San Francisco tide gauges\" width=\"800\" height=\"450\" class=\"size-full wp-image-26318\">\u003c/a>\u003cfigcaption class=\"wp-caption-text\">Tide gauges at the Brannan Steet Wharf, San Francisco. Sea level is the result of a complex set of forces and influences on land, on the seafloor and in the water between them. Estimating sea level rise from imperfect data is a scientific challenge that may progress through more sophisticated statistics. (\u003ca href=\"https://www.flickr.com/photos/daver6/\">Dave R\u003c/a>/\u003ca href=\"https://creativecommons.org/licenses/by-nc/2.0/\">CC-BY-NC\u003c/a>)\u003c/figcaption>\u003c/figure>\n\u003cp>A reassessment of historical data suggests that compared to previous estimates, the world’s sea level rose more slowly during the 20th century—and is rising faster now.\u003c/p>\n\u003cp>Sea level is one of those things that grows more complex with closer scrunity. \u003ca href=\"http://isites.harvard.edu/icb/icb.do?keyword=k92805\" target=\"_blank\" rel=\"noopener\">Jerry Mitrovica\u003c/a>, a researcher at Harvard, tells his audiences to step way back and think of sea level only as the distance between the seafloor and the sea surface. Both of those end points are known to move up or down (relative to the Earth’s center) for reasons that have little to do with the actual amount of water between them. Sea level science is the task of untangling all of those reasons and measuring their precise effects on where the water sits against a particular piece of shoreline.\u003c/p>\n\u003cp>Here’s a partial list of the things known to affect sea level. The position of the seafloor may change, just like the land, because of erosion or deposition of sediment. The weight of ice caps pushes the Earth’s crust downward while the surrounding crust rises, like an air mattress in a swimming pool when a child climbs aboard it—and the reverse happens when the ice melts. The land near the sea may rise or fall with human-caused changes like groundwater pumping, or as sediments naturally compact. Finally, different parts of the Earth’s crust rise, fall and move sideways with the activities of plate tectonics.\u003c/p>\n\u003cp>The amount of water in the sea itself may increase or decrease as rivers (and reservoirs) rise and fall, and as ice caps grow and shrink. At the same time, the density of seawater changes with its temperature. \u003c/p>\n\u003cp>The surface of the sea itself is changeable. Persistent weather patterns and oceanic currents pile up water in some places and pull it down in others. The water surface is extremely sensitive to the gravity of everything around it—the moon and sun create its well-known tides, and the gravity of large ice caps adds a slight gathering force to the seas around them that disappears as the ice melts. \u003c/p>\n\u003cp>\u003c/p>\u003c/div>",
"attributes": {
"named": {},
"numeric": []
}
},
{
"type": "component",
"content": "",
"name": "ad",
"attributes": {
"named": {
"label": "fullwidth"
},
"numeric": [
"fullwidth"
]
}
},
{
"type": "contentString",
"content": "\u003cdiv class=\"post-body\">\u003cp>\u003c/p>\n\u003cp>In measuring all of this, we rely today on historical records from tide gauges in many coastal cities as well as contemporary, broad-scale data from satellites. The old tide records are a noisy, imperfect data set with limited coverage on the map and time gaps of missing measurements. Each point of data has various degrees of uncertainty, some of them poorly known. For instance, building a new harbor near an old tide gauge can change how the water acts around it. (Satellite orbits, and the system that tracks them, are prone to their own set of uncertainties.) \u003c/p>\n\u003cp>\u003c!-- iframe plugin v.4.3 wordpress.org/plugins/iframe/ -->\u003cbr>\n\u003ciframe loading=\"lazy\" src=\"http://science.kqed.org/quest/video/science-on-the-spot-watching-the-tides/?embed=1\" height=\"359\" width=\"639\" frameborder=\"0\" scrolling=\"no\" class=\"iframe-class\">\u003c/iframe>\u003c/p>\n\u003cp>\u003cem>Video: QUEST’s “\u003ca href=\"Watching%20the%20Tides\" target=\"_blank\" rel=\"noopener\">Watching the Tides\u003c/a>” from its Science on the SPOT series. \u003c/em>\u003c/p>\n\u003cp>The task of scientists is to zero in on these error sources and learn how to correct them, with a view toward approaching as closely as possible a clean clear truth. It’s a two-sided task. One side is getting better data, and the other side is making better mathematical models to fit against the data. \u003c/p>\n\u003cp>The most widely accepted studies of tide-gauge records have said that 20th century sea levels rose, on average, between 1.6 and 1.9 millimeters per year. This is fine, except that it’s about one-third greater than the sum of its parts—the various factors I mentioned. The budget of causes and effects is not closed.\u003c/p>\n\u003cp>\u003ca href=\"http://www.nature.com/nature/journal/vaop/ncurrent/full/nature14093.html\">In the latest issue of \u003ci>Nature\u003c/i>\u003c/a>, three climate researchers from Rutgers University and Mitrovica took a new statistical approach to the tide-gauge data from the last century. Called Kalman filtering, it handles a noisy data record by giving more weight to the most trustworthy evidence. (Kalman filtering is spreading across Earth science, offering a new look at many old problems.) It uses the mathematical sea level models to help correct the tide-gauge data.\u003c/p>\n\u003cp>The team’s results put 20th century sea level rise at about 1.2 mm/yr, right where the models say it should be. This may or may not be a comforting coincidence, and other researchers will want to check the results themselves in their own ways. It bolsters what the big climate reports from the IPCC have been saying about rising sea level.\u003c/p>\n\u003cp>On the other hand, the \u003ci>Nature\u003c/i> analysis confirms that more recent sea level rise, as estimated from satellite data, is also correct—and since 1990, the sea has been rising much faster than the 20th century average. That is, the sea level curve, graphed through time, looks more like the “hockey stick” of global air temperature. If the Kalman approach is repeated and more widely accepted, the truth looks more inconvenient than ever.\u003c/p>\n\u003cp>\u003c/p>\n\u003cp>\u003cstrong>PS:\u003c/strong> Sea level researchers extend their work into the geologic past, too. The Pliocene Epoch, 3 million years ago, is the last time in Earth history that atmospheric CO\u003csub>2\u003c/sub> was as high as today, and in the \u003ca href=\"http://sealevelstudy.org/sea-change-science/whats-sea-change-science/pliomax-sites/southeast-u.s\">Pliomax project\u003c/a> Mitrovica is gathering evidence from the eastern U.S. about that ancient time.\u003c/p>\n\n\u003c/div>\u003c/p>",
"attributes": {
"named": {},
"numeric": []
}
}
],
"link": "/science/26317/new-climate-research-suggests-acceleration-of-sea-level-rise",
"authors": [
"6228"
],
"series": [
"science_2625"
],
"categories": [
"science_31",
"science_38"
],
"tags": [
"science_194",
"science_206"
],
"featImg": "science_26318",
"label": "source_science_26317"
}
},
"podcastsReducer": {
"isFetching": false,
"fetchFailed": false,
"hasFetched": false,
"podcasts": {}
},
"radioProgramsReducer": {
"isFetching": false,
"fetchFailed": false,
"hasFetched": false,
"radioPrograms": {}
},
"radioSearchSegmentsReducer": {},
"programsReducer": {
"all-things-considered": {
"id": "all-things-considered",
"title": "All Things Considered",
"info": "Every weekday, \u003cem>All Things Considered\u003c/em> hosts Robert Siegel, Audie Cornish, Ari Shapiro, and Kelly McEvers present the program's trademark mix of news, interviews, commentaries, reviews, and offbeat features. Michel Martin hosts on the weekends.",
"airtime": "MON-FRI 1pm-2pm, 4:30pm-6:30pm\u003cbr />SAT-SUN 5pm-6pm",
"imageSrc": "https://cdn.kqed.org/wp-content/uploads/2024/04/All-Things-Considered-Podcast-Tile-360x360-1.jpg",
"officialWebsiteLink": "https://www.npr.org/programs/all-things-considered/",
"meta": {
"site": "news",
"source": "npr"
},
"link": "/radio/program/all-things-considered"
},
"american-suburb-podcast": {
"id": "american-suburb-podcast",
"title": "American Suburb: The Podcast",
"tagline": "The flip side of gentrification, told through one town",
"info": "Gentrification is changing cities across America, forcing people from neighborhoods they have long called home. Call them the displaced. Now those priced out of the Bay Area are looking for a better life in an unlikely place. American Suburb follows this migration to one California town along the Delta, 45 miles from San Francisco. But is this once sleepy suburb ready for them?",
"imageSrc": "https://cdn.kqed.org/wp-content/uploads/2024/04/American-Suburb-Podcast-Tile-703x703-1.jpg",
"officialWebsiteLink": "/news/series/american-suburb-podcast",
"meta": {
"site": "news",
"source": "kqed",
"order": 19
},
"link": "/news/series/american-suburb-podcast/",
"subscribe": {
"npr": "https://rpb3r.app.goo.gl/RBrW",
"apple": "https://itunes.apple.com/WebObjects/MZStore.woa/wa/viewPodcast?mt=2&id=1287748328",
"tuneIn": "https://tunein.com/radio/American-Suburb-p1086805/",
"rss": "https://ww2.kqed.org/news/series/american-suburb-podcast/feed/podcast",
"google": "https://podcasts.google.com/feed/aHR0cHM6Ly9mZWVkcy5tZWdhcGhvbmUuZm0vS1FJTkMzMDExODgxNjA5"
}
},
"baycurious": {
"id": "baycurious",
"title": "Bay Curious",
"tagline": "Exploring the Bay Area, one question at a time",
"info": "KQED’s new podcast, Bay Curious, gets to the bottom of the mysteries — both profound and peculiar — that give the Bay Area its unique identity. And we’ll do it with your help! You ask the questions. You decide what Bay Curious investigates. And you join us on the journey to find the answers.",
"imageSrc": "https://cdn.kqed.org/wp-content/uploads/2024/04/Bay-Curious-Podcast-Tile-703x703-1.jpg",
"imageAlt": "KQED Bay Curious",
"officialWebsiteLink": "/news/series/baycurious",
"meta": {
"site": "news",
"source": "kqed",
"order": 3
},
"link": "/podcasts/baycurious",
"subscribe": {
"apple": "https://podcasts.apple.com/us/podcast/bay-curious/id1172473406",
"npr": "https://www.npr.org/podcasts/500557090/bay-curious",
"rss": "https://ww2.kqed.org/news/category/bay-curious-podcast/feed/podcast",
"amazon": "https://music.amazon.com/podcasts/9a90d476-aa04-455d-9a4c-0871ed6216d4/bay-curious",
"stitcher": "https://www.stitcher.com/podcast/kqed/bay-curious",
"spotify": "https://open.spotify.com/show/6O76IdmhixfijmhTZLIJ8k"
}
},
"bbc-world-service": {
"id": "bbc-world-service",
"title": "BBC World Service",
"info": "The day's top stories from BBC News compiled twice daily in the week, once at weekends.",
"airtime": "MON-FRI 9pm-10pm, TUE-FRI 1am-2am",
"imageSrc": "https://cdn.kqed.org/wp-content/uploads/2024/04/BBC-World-Service-Podcast-Tile-360x360-1.jpg",
"officialWebsiteLink": "https://www.bbc.co.uk/sounds/play/live:bbc_world_service",
"meta": {
"site": "news",
"source": "BBC World Service"
},
"link": "/radio/program/bbc-world-service",
"subscribe": {
"apple": "https://itunes.apple.com/us/podcast/global-news-podcast/id135067274?mt=2",
"tuneIn": "https://tunein.com/radio/BBC-World-Service-p455581/",
"rss": "https://podcasts.files.bbci.co.uk/p02nq0gn.rss"
}
},
"californiareport": {
"id": "californiareport",
"title": "The California Report",
"tagline": "California, day by day",
"info": "KQED’s statewide radio news program providing daily coverage of issues, trends and public policy decisions.",
"imageSrc": "https://cdn.kqed.org/wp-content/uploads/2024/04/The-California-Report-Podcast-Tile-703x703-1.jpg",
"imageAlt": "KQED The California Report",
"officialWebsiteLink": "/californiareport",
"meta": {
"site": "news",
"source": "kqed",
"order": 8
},
"link": "/californiareport",
"subscribe": {
"apple": "https://podcasts.apple.com/us/podcast/kqeds-the-california-report/id79681292",
"amazon": "https://music.amazon.com/podcasts/26099305-72af-4542-9dde-ac1807fe36d5/kqed-s-the-california-report",
"npr": "https://www.npr.org/podcasts/432285393/the-california-report",
"stitcher": "https://www.stitcher.com/podcast/kqedfm-kqeds-the-california-report-podcast-8838",
"rss": "https://ww2.kqed.org/news/tag/tcram/feed/podcast"
}
},
"californiareportmagazine": {
"id": "californiareportmagazine",
"title": "The California Report Magazine",
"tagline": "Your state, your stories",
"info": "Every week, The California Report Magazine takes you on a road trip for the ears: to visit the places and meet the people who make California unique. The in-depth storytelling podcast from the California Report.",
"airtime": "FRI 4:30pm-5pm, 6:30pm-7pm, 11pm-11:30pm",
"imageSrc": "https://cdn.kqed.org/wp-content/uploads/2024/04/The-California-Report-Magazine-Podcast-Tile-703x703-1.jpg",
"imageAlt": "KQED The California Report Magazine",
"officialWebsiteLink": "/californiareportmagazine",
"meta": {
"site": "news",
"source": "kqed",
"order": 10
},
"link": "/californiareportmagazine",
"subscribe": {
"apple": "https://podcasts.apple.com/us/podcast/the-california-report-magazine/id1314750545",
"google": "https://podcasts.google.com/feed/aHR0cHM6Ly9mZWVkcy5tZWdhcGhvbmUuZm0vS1FJTkM3NjkwNjk1OTAz",
"npr": "https://www.npr.org/podcasts/564733126/the-california-report-magazine",
"stitcher": "https://www.stitcher.com/podcast/kqed/the-california-report-magazine",
"rss": "https://ww2.kqed.org/news/tag/tcrmag/feed/podcast"
}
},
"city-arts": {
"id": "city-arts",
"title": "City Arts & Lectures",
"info": "A one-hour radio program to hear celebrated writers, artists and thinkers address contemporary ideas and values, often discussing the creative process. Please note: tapes or transcripts are not available",
"imageSrc": "https://ww2.kqed.org/radio/wp-content/uploads/sites/50/2018/05/cityartsandlecture-300x300.jpg",
"officialWebsiteLink": "https://www.cityarts.net/",
"airtime": "SUN 1pm-2pm, TUE 10pm, WED 1am",
"meta": {
"site": "news",
"source": "City Arts & Lectures"
},
"link": "https://www.cityarts.net",
"subscribe": {
"tuneIn": "https://tunein.com/radio/City-Arts-and-Lectures-p692/",
"rss": "https://www.cityarts.net/feed/"
}
},
"closealltabs": {
"id": "closealltabs",
"title": "Close All Tabs",
"tagline": "Your irreverent guide to the trends redefining our world",
"info": "Close All Tabs breaks down how digital culture shapes our world through thoughtful insights and irreverent humor.",
"imageSrc": "https://cdn.kqed.org/wp-content/uploads/2025/02/CAT_2_Tile-scaled.jpg",
"imageAlt": "KQED Close All Tabs",
"officialWebsiteLink": "/podcasts/closealltabs",
"meta": {
"site": "news",
"source": "kqed",
"order": 1
},
"link": "/podcasts/closealltabs",
"subscribe": {
"apple": "https://podcasts.apple.com/us/podcast/close-all-tabs/id214663465",
"rss": "https://feeds.megaphone.fm/KQINC6993880386",
"amazon": "https://music.amazon.com/podcasts/92d9d4ac-67a3-4eed-b10a-fb45d45b1ef2/close-all-tabs",
"spotify": "https://open.spotify.com/show/6LAJFHnGK1pYXYzv6SIol6?si=deb0cae19813417c"
}
},
"code-switch-life-kit": {
"id": "code-switch-life-kit",
"title": "Code Switch / Life Kit",
"info": "\u003cem>Code Switch\u003c/em>, which listeners will hear in the first part of the hour, has fearless and much-needed conversations about race. Hosted by journalists of color, the show tackles the subject of race head-on, exploring how it impacts every part of society — from politics and pop culture to history, sports and more.\u003cbr />\u003cbr />\u003cem>Life Kit\u003c/em>, which will be in the second part of the hour, guides you through spaces and feelings no one prepares you for — from finances to mental health, from workplace microaggressions to imposter syndrome, from relationships to parenting. The show features experts with real world experience and shares their knowledge. Because everyone needs a little help being human.\u003cbr />\u003cbr />\u003ca href=\"https://www.npr.org/podcasts/510312/codeswitch\">\u003cem>Code Switch\u003c/em> offical site and podcast\u003c/a>\u003cbr />\u003ca href=\"https://www.npr.org/lifekit\">\u003cem>Life Kit\u003c/em> offical site and podcast\u003c/a>\u003cbr />",
"airtime": "SUN 9pm-10pm",
"imageSrc": "https://cdn.kqed.org/wp-content/uploads/2024/04/Code-Switch-Life-Kit-Podcast-Tile-360x360-1.jpg",
"meta": {
"site": "radio",
"source": "npr"
},
"link": "/radio/program/code-switch-life-kit",
"subscribe": {
"apple": "https://podcasts.apple.com/podcast/1112190608?mt=2&at=11l79Y&ct=nprdirectory",
"google": "https://podcasts.google.com/feed/aHR0cHM6Ly93d3cubnByLm9yZy9yc3MvcG9kY2FzdC5waHA_aWQ9NTEwMzEy",
"spotify": "https://open.spotify.com/show/3bExJ9JQpkwNhoHvaIIuyV",
"rss": "https://feeds.npr.org/510312/podcast.xml"
}
},
"commonwealth-club": {
"id": "commonwealth-club",
"title": "Commonwealth Club of California Podcast",
"info": "The Commonwealth Club of California is the nation's oldest and largest public affairs forum. As a non-partisan forum, The Club brings to the public airwaves diverse viewpoints on important topics. The Club's weekly radio broadcast - the oldest in the U.S., dating back to 1924 - is carried across the nation on public radio stations and is now podcasting. Our website archive features audio of our recent programs, as well as selected speeches from our long and distinguished history. This podcast feed is usually updated twice a week and is always un-edited.",
"airtime": "THU 10pm, FRI 1am",
"imageSrc": "https://cdn.kqed.org/wp-content/uploads/2024/04/Commonwealth-Club-Podcast-Tile-360x360-1.jpg",
"officialWebsiteLink": "https://www.commonwealthclub.org/podcasts",
"meta": {
"site": "news",
"source": "Commonwealth Club of California"
},
"link": "/radio/program/commonwealth-club",
"subscribe": {
"apple": "https://itunes.apple.com/us/podcast/commonwealth-club-of-california-podcast/id976334034?mt=2",
"google": "https://podcasts.google.com/feed/aHR0cDovL3d3dy5jb21tb253ZWFsdGhjbHViLm9yZy9hdWRpby9wb2RjYXN0L3dlZWtseS54bWw",
"tuneIn": "https://tunein.com/radio/Commonwealth-Club-of-California-p1060/"
}
},
"forum": {
"id": "forum",
"title": "Forum",
"tagline": "The conversation starts here",
"info": "KQED’s live call-in program discussing local, state, national and international issues, as well as in-depth interviews.",
"airtime": "MON-FRI 9am-11am, 10pm-11pm",
"imageSrc": "https://cdn.kqed.org/wp-content/uploads/2024/04/Forum-Podcast-Tile-703x703-1.jpg",
"imageAlt": "KQED Forum with Mina Kim and Alexis Madrigal",
"officialWebsiteLink": "/forum",
"meta": {
"site": "news",
"source": "kqed",
"order": 9
},
"link": "/forum",
"subscribe": {
"apple": "https://podcasts.apple.com/us/podcast/kqeds-forum/id73329719",
"google": "https://podcasts.google.com/feed/aHR0cHM6Ly9mZWVkcy5tZWdhcGhvbmUuZm0vS1FJTkM5NTU3MzgxNjMz",
"npr": "https://www.npr.org/podcasts/432307980/forum",
"stitcher": "https://www.stitcher.com/podcast/kqedfm-kqeds-forum-podcast",
"rss": "https://feeds.megaphone.fm/KQINC9557381633"
}
},
"freakonomics-radio": {
"id": "freakonomics-radio",
"title": "Freakonomics Radio",
"info": "Freakonomics Radio is a one-hour award-winning podcast and public-radio project hosted by Stephen Dubner, with co-author Steve Levitt as a regular guest. It is produced in partnership with WNYC.",
"imageSrc": "https://ww2.kqed.org/news/wp-content/uploads/sites/10/2018/05/freakonomicsRadio.png",
"officialWebsiteLink": "http://freakonomics.com/",
"airtime": "SUN 1am-2am, SAT 3pm-4pm",
"meta": {
"site": "radio",
"source": "WNYC"
},
"link": "/radio/program/freakonomics-radio",
"subscribe": {
"npr": "https://rpb3r.app.goo.gl/4s8b",
"apple": "https://itunes.apple.com/us/podcast/freakonomics-radio/id354668519",
"tuneIn": "https://tunein.com/podcasts/WNYC-Podcasts/Freakonomics-Radio-p272293/",
"rss": "https://feeds.feedburner.com/freakonomicsradio"
}
},
"fresh-air": {
"id": "fresh-air",
"title": "Fresh Air",
"info": "Hosted by Terry Gross, \u003cem>Fresh Air from WHYY\u003c/em> is the Peabody Award-winning weekday magazine of contemporary arts and issues. One of public radio's most popular programs, Fresh Air features intimate conversations with today's biggest luminaries.",
"airtime": "MON-FRI 7pm-8pm",
"imageSrc": "https://cdn.kqed.org/wp-content/uploads/2024/04/Fresh-Air-Podcast-Tile-360x360-1.jpg",
"officialWebsiteLink": "https://www.npr.org/programs/fresh-air/",
"meta": {
"site": "radio",
"source": "npr"
},
"link": "/radio/program/fresh-air",
"subscribe": {
"npr": "https://rpb3r.app.goo.gl/4s8b",
"apple": "https://itunes.apple.com/WebObjects/MZStore.woa/wa/viewPodcast?s=143441&mt=2&id=214089682&at=11l79Y&ct=nprdirectory",
"tuneIn": "https://tunein.com/radio/Fresh-Air-p17/",
"rss": "https://feeds.npr.org/381444908/podcast.xml"
}
},
"here-and-now": {
"id": "here-and-now",
"title": "Here & Now",
"info": "A live production of NPR and WBUR Boston, in collaboration with stations across the country, Here & Now reflects the fluid world of news as it's happening in the middle of the day, with timely, in-depth news, interviews and conversation. Hosted by Robin Young, Jeremy Hobson and Tonya Mosley.",
"airtime": "MON-THU 11am-12pm",
"imageSrc": "https://cdn.kqed.org/wp-content/uploads/2024/04/Here-And-Now-Podcast-Tile-360x360-1.jpg",
"officialWebsiteLink": "http://www.wbur.org/hereandnow",
"meta": {
"site": "news",
"source": "npr"
},
"link": "/radio/program/here-and-now",
"subsdcribe": {
"apple": "https://itunes.apple.com/WebObjects/MZStore.woa/wa/viewPodcast?mt=2&id=426698661",
"tuneIn": "https://tunein.com/radio/Here--Now-p211/",
"rss": "https://feeds.npr.org/510051/podcast.xml"
}
},
"hidden-brain": {
"id": "hidden-brain",
"title": "Hidden Brain",
"info": "Shankar Vedantam uses science and storytelling to reveal the unconscious patterns that drive human behavior, shape our choices and direct our relationships.",
"imageSrc": "https://ww2.kqed.org/radio/wp-content/uploads/sites/50/2018/05/hiddenbrain.jpg",
"officialWebsiteLink": "https://www.npr.org/series/423302056/hidden-brain",
"airtime": "SUN 7pm-8pm",
"meta": {
"site": "news",
"source": "NPR"
},
"link": "/radio/program/hidden-brain",
"subscribe": {
"apple": "https://itunes.apple.com/us/podcast/hidden-brain/id1028908750?mt=2",
"tuneIn": "https://tunein.com/podcasts/Science-Podcasts/Hidden-Brain-p787503/",
"rss": "https://feeds.npr.org/510308/podcast.xml"
}
},
"how-i-built-this": {
"id": "how-i-built-this",
"title": "How I Built This with Guy Raz",
"info": "Guy Raz dives into the stories behind some of the world's best known companies. How I Built This weaves a narrative journey about innovators, entrepreneurs and idealists—and the movements they built.",
"imageSrc": "https://ww2.kqed.org/news/wp-content/uploads/sites/10/2018/05/howIBuiltThis.png",
"officialWebsiteLink": "https://www.npr.org/podcasts/510313/how-i-built-this",
"airtime": "SUN 7:30pm-8pm",
"meta": {
"site": "news",
"source": "npr"
},
"link": "/radio/program/how-i-built-this",
"subscribe": {
"npr": "https://rpb3r.app.goo.gl/3zxy",
"apple": "https://itunes.apple.com/us/podcast/how-i-built-this-with-guy-raz/id1150510297?mt=2",
"tuneIn": "https://tunein.com/podcasts/Arts--Culture-Podcasts/How-I-Built-This-p910896/",
"rss": "https://feeds.npr.org/510313/podcast.xml"
}
},
"hyphenacion": {
"id": "hyphenacion",
"title": "Hyphenación",
"tagline": "Where conversation and cultura meet",
"info": "What kind of no sabo word is Hyphenación? For us, it’s about living within a hyphenation. Like being a third-gen Mexican-American from the Texas border now living that Bay Area Chicano life. Like Xorje! Each week we bring together a couple of hyphenated Latinos to talk all about personal life choices: family, careers, relationships, belonging … everything is on the table. ",
"imageSrc": "https://cdn.kqed.org/wp-content/uploads/2025/03/Hyphenacion_FinalAssets_PodcastTile.png",
"imageAlt": "KQED Hyphenación",
"officialWebsiteLink": "/podcasts/hyphenacion",
"meta": {
"site": "news",
"source": "kqed",
"order": 15
},
"link": "/podcasts/hyphenacion",
"subscribe": {
"apple": "https://podcasts.apple.com/us/podcast/hyphenaci%C3%B3n/id1191591838",
"spotify": "https://open.spotify.com/show/2p3Fifq96nw9BPcmFdIq0o?si=39209f7b25774f38",
"youtube": "https://www.youtube.com/c/kqedarts",
"amazon": "https://music.amazon.com/podcasts/6c3dd23c-93fb-4aab-97ba-1725fa6315f1/hyphenaci%C3%B3n",
"rss": "https://feeds.megaphone.fm/KQINC2275451163"
}
},
"jerrybrown": {
"id": "jerrybrown",
"title": "The Political Mind of Jerry Brown",
"tagline": "Lessons from a lifetime in politics",
"info": "The Political Mind of Jerry Brown brings listeners the wisdom of the former Governor, Mayor, and presidential candidate. Scott Shafer interviewed Brown for more than 40 hours, covering the former governor's life and half-century in the political game – and Brown has some lessons he'd like to share. ",
"imageSrc": "https://cdn.kqed.org/wp-content/uploads/2024/04/The-Political-Mind-of-Jerry-Brown-Podcast-Tile-703x703-1.jpg",
"imageAlt": "KQED The Political Mind of Jerry Brown",
"officialWebsiteLink": "/podcasts/jerrybrown",
"meta": {
"site": "news",
"source": "kqed",
"order": 18
},
"link": "/podcasts/jerrybrown",
"subscribe": {
"npr": "https://www.npr.org/podcasts/790253322/the-political-mind-of-jerry-brown",
"apple": "https://itunes.apple.com/us/podcast/id1492194549",
"rss": "https://ww2.kqed.org/news/series/jerrybrown/feed/podcast/",
"tuneIn": "http://tun.in/pjGcK",
"stitcher": "https://www.stitcher.com/podcast/kqed/the-political-mind-of-jerry-brown",
"spotify": "https://open.spotify.com/show/54C1dmuyFyKMFttY6X2j6r?si=K8SgRCoISNK6ZbjpXrX5-w",
"amazon": "https://music.amazon.com/podcasts/44420f75-3b0e-4301-ab3b-16da6b09e543/the-political-mind-of-jerry-brown"
}
},
"latino-usa": {
"id": "latino-usa",
"title": "Latino USA",
"airtime": "MON 1am-2am, SUN 6pm-7pm",
"info": "Latino USA, the radio journal of news and culture, is the only national, English-language radio program produced from a Latino perspective.",
"imageSrc": "https://ww2.kqed.org/radio/wp-content/uploads/sites/50/2018/04/latinoUsa.jpg",
"officialWebsiteLink": "http://latinousa.org/",
"meta": {
"site": "news",
"source": "npr"
},
"link": "/radio/program/latino-usa",
"subscribe": {
"npr": "https://rpb3r.app.goo.gl/xtTd",
"apple": "https://itunes.apple.com/WebObjects/MZStore.woa/wa/viewPodcast?s=143441&mt=2&id=79681317&at=11l79Y&ct=nprdirectory",
"tuneIn": "https://tunein.com/radio/Latino-USA-p621/",
"rss": "https://feeds.npr.org/510016/podcast.xml"
}
},
"marketplace": {
"id": "marketplace",
"title": "Marketplace",
"info": "Our flagship program, helmed by Kai Ryssdal, examines what the day in money delivered, through stories, conversations, newsworthy numbers and more. Updated Monday through Friday at about 3:30 p.m. PT.",
"airtime": "MON-FRI 4pm-4:30pm, MON-WED 6:30pm-7pm",
"imageSrc": "https://cdn.kqed.org/wp-content/uploads/2024/04/Marketplace-Podcast-Tile-360x360-1.jpg",
"officialWebsiteLink": "https://www.marketplace.org/",
"meta": {
"site": "news",
"source": "American Public Media"
},
"link": "/radio/program/marketplace",
"subscribe": {
"apple": "https://itunes.apple.com/WebObjects/MZStore.woa/wa/viewPodcast?s=143441&mt=2&id=201853034&at=11l79Y&ct=nprdirectory",
"tuneIn": "https://tunein.com/radio/APM-Marketplace-p88/",
"rss": "https://feeds.publicradio.org/public_feeds/marketplace-pm/rss/rss"
}
},
"masters-of-scale": {
"id": "masters-of-scale",
"title": "Masters of Scale",
"info": "Masters of Scale is an original podcast in which LinkedIn co-founder and Greylock Partner Reid Hoffman sets out to describe and prove theories that explain how great entrepreneurs take their companies from zero to a gazillion in ingenious fashion.",
"airtime": "Every other Wednesday June 12 through October 16 at 8pm (repeats Thursdays at 2am)",
"imageSrc": "https://cdn.kqed.org/wp-content/uploads/2024/04/Masters-of-Scale-Podcast-Tile-360x360-1.jpg",
"officialWebsiteLink": "https://mastersofscale.com/",
"meta": {
"site": "radio",
"source": "WaitWhat"
},
"link": "/radio/program/masters-of-scale",
"subscribe": {
"apple": "http://mastersofscale.app.link/",
"rss": "https://rss.art19.com/masters-of-scale"
}
},
"mindshift": {
"id": "mindshift",
"title": "MindShift",
"tagline": "A podcast about the future of learning and how we raise our kids",
"info": "The MindShift podcast explores the innovations in education that are shaping how kids learn. Hosts Ki Sung and Katrina Schwartz introduce listeners to educators, researchers, parents and students who are developing effective ways to improve how kids learn. We cover topics like how fed-up administrators are developing surprising tactics to deal with classroom disruptions; how listening to podcasts are helping kids develop reading skills; the consequences of overparenting; and why interdisciplinary learning can engage students on all ends of the traditional achievement spectrum. This podcast is part of the MindShift education site, a division of KQED News. KQED is an NPR/PBS member station based in San Francisco. You can also visit the MindShift website for episodes and supplemental blog posts or tweet us \u003ca href=\"https://twitter.com/MindShiftKQED\">@MindShiftKQED\u003c/a> or visit us at \u003ca href=\"/mindshift\">MindShift.KQED.org\u003c/a>",
"imageSrc": "https://cdn.kqed.org/wp-content/uploads/2024/04/Mindshift-Podcast-Tile-703x703-1.jpg",
"imageAlt": "KQED MindShift: How We Will Learn",
"officialWebsiteLink": "/mindshift/",
"meta": {
"site": "news",
"source": "kqed",
"order": 12
},
"link": "/podcasts/mindshift",
"subscribe": {
"apple": "https://podcasts.apple.com/us/podcast/mindshift-podcast/id1078765985",
"google": "https://podcasts.google.com/feed/aHR0cHM6Ly9mZWVkcy5tZWdhcGhvbmUuZm0vS1FJTkM1NzY0NjAwNDI5",
"npr": "https://www.npr.org/podcasts/464615685/mind-shift-podcast",
"stitcher": "https://www.stitcher.com/podcast/kqed/stories-teachers-share",
"spotify": "https://open.spotify.com/show/0MxSpNYZKNprFLCl7eEtyx"
}
},
"morning-edition": {
"id": "morning-edition",
"title": "Morning Edition",
"info": "\u003cem>Morning Edition\u003c/em> takes listeners around the country and the world with multi-faceted stories and commentaries every weekday. Hosts Steve Inskeep, David Greene and Rachel Martin bring you the latest breaking news and features to prepare you for the day.",
"airtime": "MON-FRI 3am-9am",
"imageSrc": "https://cdn.kqed.org/wp-content/uploads/2024/04/Morning-Edition-Podcast-Tile-360x360-1.jpg",
"officialWebsiteLink": "https://www.npr.org/programs/morning-edition/",
"meta": {
"site": "news",
"source": "npr"
},
"link": "/radio/program/morning-edition"
},
"onourwatch": {
"id": "onourwatch",
"title": "On Our Watch",
"tagline": "Deeply-reported investigative journalism",
"info": "For decades, the process for how police police themselves has been inconsistent – if not opaque. In some states, like California, these proceedings were completely hidden. After a new police transparency law unsealed scores of internal affairs files, our reporters set out to examine these cases and the shadow world of police discipline. On Our Watch brings listeners into the rooms where officers are questioned and witnesses are interrogated to find out who this system is really protecting. Is it the officers, or the public they've sworn to serve?",
"imageSrc": "https://cdn.kqed.org/wp-content/uploads/2024/04/On-Our-Watch-Podcast-Tile-703x703-1.jpg",
"imageAlt": "On Our Watch from NPR and KQED",
"officialWebsiteLink": "/podcasts/onourwatch",
"meta": {
"site": "news",
"source": "kqed",
"order": 11
},
"link": "/podcasts/onourwatch",
"subscribe": {
"apple": "https://podcasts.apple.com/podcast/id1567098962",
"google": "https://podcasts.google.com/feed/aHR0cHM6Ly9mZWVkcy5ucHIub3JnLzUxMDM2MC9wb2RjYXN0LnhtbD9zYz1nb29nbGVwb2RjYXN0cw",
"npr": "https://rpb3r.app.goo.gl/onourwatch",
"spotify": "https://open.spotify.com/show/0OLWoyizopu6tY1XiuX70x",
"tuneIn": "https://tunein.com/radio/On-Our-Watch-p1436229/",
"stitcher": "https://www.stitcher.com/show/on-our-watch",
"rss": "https://feeds.npr.org/510360/podcast.xml"
}
},
"on-the-media": {
"id": "on-the-media",
"title": "On The Media",
"info": "Our weekly podcast explores how the media 'sausage' is made, casts an incisive eye on fluctuations in the marketplace of ideas, and examines threats to the freedom of information and expression in America and abroad. For one hour a week, the show tries to lift the veil from the process of \"making media,\" especially news media, because it's through that lens that we see the world and the world sees us",
"airtime": "SUN 2pm-3pm, MON 12am-1am",
"imageSrc": "https://ww2.kqed.org/radio/wp-content/uploads/sites/50/2018/04/onTheMedia.png",
"officialWebsiteLink": "https://www.wnycstudios.org/shows/otm",
"meta": {
"site": "news",
"source": "wnyc"
},
"link": "/radio/program/on-the-media",
"subscribe": {
"apple": "https://itunes.apple.com/us/podcast/on-the-media/id73330715?mt=2",
"tuneIn": "https://tunein.com/radio/On-the-Media-p69/",
"rss": "http://feeds.wnyc.org/onthemedia"
}
},
"pbs-newshour": {
"id": "pbs-newshour",
"title": "PBS NewsHour",
"info": "Analysis, background reports and updates from the PBS NewsHour putting today's news in context.",
"airtime": "MON-FRI 3pm-4pm",
"imageSrc": "https://cdn.kqed.org/wp-content/uploads/2024/04/PBS-News-Hour-Podcast-Tile-360x360-1.jpg",
"officialWebsiteLink": "https://www.pbs.org/newshour/",
"meta": {
"site": "news",
"source": "pbs"
},
"link": "/radio/program/pbs-newshour",
"subscribe": {
"apple": "https://itunes.apple.com/us/podcast/pbs-newshour-full-show/id394432287?mt=2",
"tuneIn": "https://tunein.com/radio/PBS-NewsHour---Full-Show-p425698/",
"rss": "https://www.pbs.org/newshour/feeds/rss/podcasts/show"
}
},
"perspectives": {
"id": "perspectives",
"title": "Perspectives",
"tagline": "KQED's series of daily listener commentaries since 1991",
"info": "KQED's series of daily listener commentaries since 1991.",
"imageSrc": "https://cdn.kqed.org/wp-content/uploads/2025/01/Perspectives_Tile_Final.jpg",
"imageAlt": "KQED Perspectives",
"officialWebsiteLink": "/perspectives/",
"meta": {
"site": "radio",
"source": "kqed",
"order": 14
},
"link": "/perspectives",
"subscribe": {
"apple": "https://podcasts.apple.com/us/podcast/id73801135",
"npr": "https://www.npr.org/podcasts/432309616/perspectives",
"rss": "https://ww2.kqed.org/perspectives/category/perspectives/feed/",
"google": "https://podcasts.google.com/feed/aHR0cHM6Ly93dzIua3FlZC5vcmcvcGVyc3BlY3RpdmVzL2NhdGVnb3J5L3BlcnNwZWN0aXZlcy9mZWVkLw"
}
},
"planet-money": {
"id": "planet-money",
"title": "Planet Money",
"info": "The economy explained. Imagine you could call up a friend and say, Meet me at the bar and tell me what's going on with the economy. Now imagine that's actually a fun evening.",
"airtime": "SUN 3pm-4pm",
"imageSrc": "https://ww2.kqed.org/radio/wp-content/uploads/sites/50/2018/04/planetmoney.jpg",
"officialWebsiteLink": "https://www.npr.org/sections/money/",
"meta": {
"site": "news",
"source": "npr"
},
"link": "/radio/program/planet-money",
"subscribe": {
"npr": "https://rpb3r.app.goo.gl/M4f5",
"apple": "https://itunes.apple.com/us/podcast/planet-money/id290783428?mt=2",
"tuneIn": "https://tunein.com/podcasts/Business--Economics-Podcasts/Planet-Money-p164680/",
"rss": "https://feeds.npr.org/510289/podcast.xml"
}
},
"politicalbreakdown": {
"id": "politicalbreakdown",
"title": "Political Breakdown",
"tagline": "Politics from a personal perspective",
"info": "Political Breakdown is a new series that explores the political intersection of California and the nation. Each week hosts Scott Shafer and Marisa Lagos are joined with a new special guest to unpack politics -- with personality — and offer an insider’s glimpse at how politics happens.",
"airtime": "THU 6:30pm-7pm",
"imageSrc": "https://cdn.kqed.org/wp-content/uploads/2024/04/Political-Breakdown-2024-Podcast-Tile-703x703-1.jpg",
"imageAlt": "KQED Political Breakdown",
"officialWebsiteLink": "/podcasts/politicalbreakdown",
"meta": {
"site": "radio",
"source": "kqed",
"order": 5
},
"link": "/podcasts/politicalbreakdown",
"subscribe": {
"apple": "https://podcasts.apple.com/us/podcast/political-breakdown/id1327641087",
"amazon": "https://music.amazon.com/podcasts/e0c2d153-ad36-4c8d-901d-f1da6a724824/political-breakdown",
"npr": "https://www.npr.org/podcasts/572155894/political-breakdown",
"stitcher": "https://www.stitcher.com/podcast/kqed/political-breakdown",
"spotify": "https://open.spotify.com/show/07RVyIjIdk2WDuVehvBMoN",
"rss": "https://ww2.kqed.org/news/tag/political-breakdown/feed/podcast"
}
},
"possible": {
"id": "possible",
"title": "Possible",
"info": "Possible is hosted by entrepreneur Reid Hoffman and writer Aria Finger. Together in Possible, Hoffman and Finger lead enlightening discussions about building a brighter collective future. The show features interviews with visionary guests like Trevor Noah, Sam Altman and Janette Sadik-Khan. Possible paints an optimistic portrait of the world we can create through science, policy, business, art and our shared humanity. It asks: What if everything goes right for once? How can we get there? Each episode also includes a short fiction story generated by advanced AI GPT-4, serving as a thought-provoking springboard to speculate how humanity could leverage technology for good.",
"airtime": "SUN 2pm",
"imageSrc": "https://cdn.kqed.org/wp-content/uploads/2024/04/Possible-Podcast-Tile-360x360-1.jpg",
"officialWebsiteLink": "https://www.possible.fm/",
"meta": {
"site": "news",
"source": "Possible"
},
"link": "/radio/program/possible",
"subscribe": {
"apple": "https://podcasts.apple.com/us/podcast/possible/id1677184070",
"spotify": "https://open.spotify.com/show/730YpdUSNlMyPQwNnyjp4k"
}
},
"pri-the-world": {
"id": "pri-the-world",
"title": "PRI's The World: Latest Edition",
"info": "Each weekday, host Marco Werman and his team of producers bring you the world's most interesting stories in an hour of radio that reminds us just how small our planet really is.",
"airtime": "MON-FRI 2pm-3pm",
"imageSrc": "https://cdn.kqed.org/wp-content/uploads/2024/04/The-World-Podcast-Tile-360x360-1.jpg",
"officialWebsiteLink": "https://www.pri.org/programs/the-world",
"meta": {
"site": "news",
"source": "PRI"
},
"link": "/radio/program/pri-the-world",
"subscribe": {
"apple": "https://itunes.apple.com/us/podcast/pris-the-world-latest-edition/id278196007?mt=2",
"tuneIn": "https://tunein.com/podcasts/News--Politics-Podcasts/PRIs-The-World-p24/",
"rss": "http://feeds.feedburner.com/pri/theworld"
}
},
"radiolab": {
"id": "radiolab",
"title": "Radiolab",
"info": "A two-time Peabody Award-winner, Radiolab is an investigation told through sounds and stories, and centered around one big idea. In the Radiolab world, information sounds like music and science and culture collide. Hosted by Jad Abumrad and Robert Krulwich, the show is designed for listeners who demand skepticism, but appreciate wonder. WNYC Studios is the producer of other leading podcasts including Freakonomics Radio, Death, Sex & Money, On the Media and many more.",
"airtime": "SUN 12am-1am, SAT 2pm-3pm",
"imageSrc": "https://ww2.kqed.org/radio/wp-content/uploads/sites/50/2018/04/radiolab1400.png",
"officialWebsiteLink": "https://www.wnycstudios.org/shows/radiolab/",
"meta": {
"site": "science",
"source": "WNYC"
},
"link": "/radio/program/radiolab",
"subscribe": {
"apple": "https://itunes.apple.com/us/podcast/radiolab/id152249110?mt=2",
"tuneIn": "https://tunein.com/radio/RadioLab-p68032/",
"rss": "https://feeds.wnyc.org/radiolab"
}
},
"reveal": {
"id": "reveal",
"title": "Reveal",
"info": "Created by The Center for Investigative Reporting and PRX, Reveal is public radios first one-hour weekly radio show and podcast dedicated to investigative reporting. Credible, fact based and without a partisan agenda, Reveal combines the power and artistry of driveway moment storytelling with data-rich reporting on critically important issues. The result is stories that inform and inspire, arming our listeners with information to right injustices, hold the powerful accountable and improve lives.Reveal is hosted by Al Letson and showcases the award-winning work of CIR and newsrooms large and small across the nation. In a radio and podcast market crowded with choices, Reveal focuses on important and often surprising stories that illuminate the world for our listeners.",
"airtime": "SAT 4pm-5pm",
"imageSrc": "https://ww2.kqed.org/radio/wp-content/uploads/sites/50/2018/04/reveal300px.png",
"officialWebsiteLink": "https://www.revealnews.org/episodes/",
"meta": {
"site": "news",
"source": "npr"
},
"link": "/radio/program/reveal",
"subscribe": {
"apple": "https://itunes.apple.com/us/podcast/reveal/id886009669",
"tuneIn": "https://tunein.com/radio/Reveal-p679597/",
"rss": "http://feeds.revealradio.org/revealpodcast"
}
},
"rightnowish": {
"id": "rightnowish",
"title": "Rightnowish",
"tagline": "Art is where you find it",
"info": "Rightnowish digs into life in the Bay Area right now… ish. Journalist Pendarvis Harshaw takes us to galleries painted on the sides of liquor stores in West Oakland. We'll dance in warehouses in the Bayview, make smoothies with kids in South Berkeley, and listen to classical music in a 1984 Cutlass Supreme in Richmond. Every week, Pen talks to movers and shakers about how the Bay Area shapes what they create, and how they shape the place we call home.",
"imageSrc": "https://cdn.kqed.org/wp-content/uploads/2024/04/Rightnowish-Podcast-Tile-500x500-1.jpg",
"imageAlt": "KQED Rightnowish with Pendarvis Harshaw",
"officialWebsiteLink": "/podcasts/rightnowish",
"meta": {
"site": "arts",
"source": "kqed",
"order": 16
},
"link": "/podcasts/rightnowish",
"subscribe": {
"npr": "https://www.npr.org/podcasts/721590300/rightnowish",
"rss": "https://ww2.kqed.org/arts/programs/rightnowish/feed/podcast",
"apple": "https://podcasts.apple.com/us/podcast/rightnowish/id1482187648",
"stitcher": "https://www.stitcher.com/podcast/kqed/rightnowish",
"google": "https://podcasts.google.com/feed/aHR0cHM6Ly9mZWVkcy5tZWdhcGhvbmUuZm0vS1FJTkMxMjU5MTY3NDc4",
"spotify": "https://open.spotify.com/show/7kEJuafTzTVan7B78ttz1I"
}
},
"science-friday": {
"id": "science-friday",
"title": "Science Friday",
"info": "Science Friday is a weekly science talk show, broadcast live over public radio stations nationwide. Each week, the show focuses on science topics that are in the news and tries to bring an educated, balanced discussion to bear on the scientific issues at hand. Panels of expert guests join host Ira Flatow, a veteran science journalist, to discuss science and to take questions from listeners during the call-in portion of the program.",
"airtime": "FRI 11am-1pm",
"imageSrc": "https://cdn.kqed.org/wp-content/uploads/2024/04/Science-Friday-Podcast-Tile-360x360-1.jpg",
"officialWebsiteLink": "https://www.wnycstudios.org/shows/science-friday",
"meta": {
"site": "news",
"source": "npr"
},
"link": "/radio/program/science-friday",
"subscribe": {
"apple": "https://itunes.apple.com/WebObjects/MZStore.woa/wa/viewPodcast?s=143441&mt=2&id=73329284&at=11l79Y&ct=nprdirectory",
"tuneIn": "https://tunein.com/radio/Science-Friday-p394/",
"rss": "http://feeds.wnyc.org/science-friday"
}
},
"snap-judgment": {
"id": "snap-judgment",
"title": "Snap Judgment",
"tagline": "Real stories with killer beats",
"info": "The Snap Judgment radio show and podcast mixes real stories with killer beats to produce cinematic, dramatic radio. Snap's musical brand of storytelling dares listeners to see the world through the eyes of another. This is storytelling... with a BEAT!! Snap first aired on public radio stations nationwide in July 2010. Today, Snap Judgment airs on over 450 public radio stations and is brought to the airwaves by KQED & PRX.",
"airtime": "SAT 1pm-2pm, 9pm-10pm",
"imageSrc": "https://cdn.kqed.org/wp-content/uploads/2024/05/Snap-Judgment-Podcast-Tile-703x703-1.jpg",
"imageAlt": "KQED Snap Judgment",
"officialWebsiteLink": "https://snapjudgment.org",
"meta": {
"site": "arts",
"source": "kqed",
"order": 4
},
"link": "https://snapjudgment.org",
"subscribe": {
"apple": "https://podcasts.apple.com/us/podcast/snap-judgment/id283657561",
"npr": "https://www.npr.org/podcasts/449018144/snap-judgment",
"stitcher": "https://www.pandora.com/podcast/snap-judgment/PC:241?source=stitcher-sunset",
"spotify": "https://open.spotify.com/show/3Cct7ZWmxHNAtLgBTqjC5v",
"rss": "https://snap.feed.snapjudgment.org/"
}
},
"soldout": {
"id": "soldout",
"title": "SOLD OUT: Rethinking Housing in America",
"tagline": "A new future for housing",
"info": "Sold Out: Rethinking Housing in America",
"imageSrc": "https://cdn.kqed.org/wp-content/uploads/2024/04/Sold-Out-Podcast-Tile-703x703-1.jpg",
"imageAlt": "KQED Sold Out: Rethinking Housing in America",
"officialWebsiteLink": "/podcasts/soldout",
"meta": {
"site": "news",
"source": "kqed",
"order": 13
},
"link": "/podcasts/soldout",
"subscribe": {
"npr": "https://www.npr.org/podcasts/911586047/s-o-l-d-o-u-t-a-new-future-for-housing",
"apple": "https://podcasts.apple.com/us/podcast/introducing-sold-out-rethinking-housing-in-america/id1531354937",
"rss": "https://feeds.megaphone.fm/soldout",
"spotify": "https://open.spotify.com/show/38dTBSk2ISFoPiyYNoKn1X",
"stitcher": "https://www.stitcher.com/podcast/kqed/sold-out-rethinking-housing-in-america",
"tunein": "https://tunein.com/radio/SOLD-OUT-Rethinking-Housing-in-America-p1365871/"
}
},
"spooked": {
"id": "spooked",
"title": "Spooked",
"tagline": "True-life supernatural stories",
"info": "",
"imageSrc": "https://cdn.kqed.org/wp-content/uploads/2024/10/Spooked-Podcast-Tile-703x703-1.jpg",
"imageAlt": "KQED Spooked",
"officialWebsiteLink": "https://spookedpodcast.org/",
"meta": {
"site": "news",
"source": "kqed",
"order": 7
},
"link": "https://spookedpodcast.org/",
"subscribe": {
"apple": "https://podcasts.apple.com/us/podcast/spooked/id1279361017",
"npr": "https://www.npr.org/podcasts/549547848/snap-judgment-presents-spooked",
"spotify": "https://open.spotify.com/show/76571Rfl3m7PLJQZKQIGCT",
"rss": "https://feeds.simplecast.com/TBotaapn"
}
},
"tech-nation": {
"id": "tech-nation",
"title": "Tech Nation Radio Podcast",
"info": "Tech Nation is a weekly public radio program, hosted by Dr. Moira Gunn. Founded in 1993, it has grown from a simple interview show to a multi-faceted production, featuring conversations with noted technology and science leaders, and a weekly science and technology-related commentary.",
"airtime": "FRI 10pm",
"imageSrc": "https://cdn.kqed.org/wp-content/uploads/2024/04/Tech-Nation-Radio-Podcast-Tile-360x360-1.jpg",
"officialWebsiteLink": "http://technation.podomatic.com/",
"meta": {
"site": "science",
"source": "Tech Nation Media"
},
"link": "/radio/program/tech-nation",
"subscribe": {
"rss": "https://technation.podomatic.com/rss2.xml"
}
},
"ted-radio-hour": {
"id": "ted-radio-hour",
"title": "TED Radio Hour",
"info": "The TED Radio Hour is a journey through fascinating ideas, astonishing inventions, fresh approaches to old problems, and new ways to think and create.",
"airtime": "SUN 3pm-4pm, SAT 10pm-11pm",
"imageSrc": "https://ww2.kqed.org/radio/wp-content/uploads/sites/50/2018/04/tedRadioHour.jpg",
"officialWebsiteLink": "https://www.npr.org/programs/ted-radio-hour/?showDate=2018-06-22",
"meta": {
"site": "news",
"source": "npr"
},
"link": "/radio/program/ted-radio-hour",
"subscribe": {
"npr": "https://rpb3r.app.goo.gl/8vsS",
"apple": "https://itunes.apple.com/WebObjects/MZStore.woa/wa/viewPodcast?s=143441&mt=2&id=523121474&at=11l79Y&ct=nprdirectory",
"tuneIn": "https://tunein.com/radio/TED-Radio-Hour-p418021/",
"rss": "https://feeds.npr.org/510298/podcast.xml"
}
},
"thebay": {
"id": "thebay",
"title": "The Bay",
"tagline": "Local news to keep you rooted",
"info": "Host Devin Katayama walks you through the biggest story of the day with reporters and newsmakers.",
"imageSrc": "https://cdn.kqed.org/wp-content/uploads/2024/04/The-Bay-Podcast-Tile-703x703-1.jpg",
"imageAlt": "KQED The Bay",
"officialWebsiteLink": "/podcasts/thebay",
"meta": {
"site": "radio",
"source": "kqed",
"order": 2
},
"link": "/podcasts/thebay",
"subscribe": {
"apple": "https://podcasts.apple.com/us/podcast/the-bay/id1350043452",
"amazon": "https://music.amazon.com/podcasts/d800ea4c-7a2c-42f2-b861-edaf78a5db0b/the-bay",
"npr": "https://www.npr.org/podcasts/586725995/the-bay",
"stitcher": "https://www.stitcher.com/podcast/kqed/the-bay",
"spotify": "https://open.spotify.com/show/4BIKBKIujizLHlIlBNaAqQ",
"rss": "https://feeds.megaphone.fm/KQINC8259786327"
}
},
"thelatest": {
"id": "thelatest",
"title": "The Latest",
"tagline": "Trusted local news in real time",
"info": "",
"imageSrc": "https://cdn.kqed.org/wp-content/uploads/2025/05/The-Latest-2025-Podcast-Tile-703x703-1.jpg",
"imageAlt": "KQED The Latest",
"officialWebsiteLink": "/thelatest",
"meta": {
"site": "news",
"source": "kqed",
"order": 6
},
"link": "/thelatest",
"subscribe": {
"apple": "https://podcasts.apple.com/us/podcast/the-latest-from-kqed/id1197721799",
"npr": "https://www.npr.org/podcasts/1257949365/the-latest-from-k-q-e-d",
"spotify": "https://open.spotify.com/show/5KIIXMgM9GTi5AepwOYvIZ?si=bd3053fec7244dba",
"rss": "https://feeds.megaphone.fm/KQINC9137121918"
}
},
"theleap": {
"id": "theleap",
"title": "The Leap",
"tagline": "What if you closed your eyes, and jumped?",
"info": "Stories about people making dramatic, risky changes, told by award-winning public radio reporter Judy Campbell.",
"imageSrc": "https://cdn.kqed.org/wp-content/uploads/2024/04/The-Leap-Podcast-Tile-703x703-1.jpg",
"imageAlt": "KQED The Leap",
"officialWebsiteLink": "/podcasts/theleap",
"meta": {
"site": "news",
"source": "kqed",
"order": 17
},
"link": "/podcasts/theleap",
"subscribe": {
"apple": "https://podcasts.apple.com/us/podcast/the-leap/id1046668171",
"npr": "https://www.npr.org/podcasts/447248267/the-leap",
"stitcher": "https://www.stitcher.com/podcast/kqed/the-leap",
"spotify": "https://open.spotify.com/show/3sSlVHHzU0ytLwuGs1SD1U",
"rss": "https://ww2.kqed.org/news/programs/the-leap/feed/podcast"
}
},
"the-moth-radio-hour": {
"id": "the-moth-radio-hour",
"title": "The Moth Radio Hour",
"info": "Since its launch in 1997, The Moth has presented thousands of true stories, told live and without notes, to standing-room-only crowds worldwide. Moth storytellers stand alone, under a spotlight, with only a microphone and a roomful of strangers. The storyteller and the audience embark on a high-wire act of shared experience which is both terrifying and exhilarating. Since 2008, The Moth podcast has featured many of our favorite stories told live on Moth stages around the country. For information on all of our programs and live events, visit themoth.org.",
"airtime": "SAT 8pm-9pm and SUN 11am-12pm",
"imageSrc": "https://ww2.kqed.org/radio/wp-content/uploads/sites/50/2018/04/theMoth.jpg",
"officialWebsiteLink": "https://themoth.org/",
"meta": {
"site": "arts",
"source": "prx"
},
"link": "/radio/program/the-moth-radio-hour",
"subscribe": {
"apple": "https://itunes.apple.com/us/podcast/the-moth-podcast/id275699983?mt=2",
"tuneIn": "https://tunein.com/radio/The-Moth-p273888/",
"rss": "http://feeds.themoth.org/themothpodcast"
}
},
"the-new-yorker-radio-hour": {
"id": "the-new-yorker-radio-hour",
"title": "The New Yorker Radio Hour",
"info": "The New Yorker Radio Hour is a weekly program presented by the magazine's editor, David Remnick, and produced by WNYC Studios and The New Yorker. Each episode features a diverse mix of interviews, profiles, storytelling, and an occasional burst of humor inspired by the magazine, and shaped by its writers, artists, and editors. This isn't a radio version of a magazine, but something all its own, reflecting the rich possibilities of audio storytelling and conversation. Theme music for the show was composed and performed by Merrill Garbus of tUnE-YArDs.",
"airtime": "SAT 10am-11am",
"imageSrc": "https://cdn.kqed.org/wp-content/uploads/2024/04/The-New-Yorker-Podcast-Tile-360x360-1.jpg",
"officialWebsiteLink": "https://www.wnycstudios.org/shows/tnyradiohour",
"meta": {
"site": "arts",
"source": "WNYC"
},
"link": "/radio/program/the-new-yorker-radio-hour",
"subscribe": {
"apple": "https://itunes.apple.com/us/podcast/id1050430296",
"tuneIn": "https://tunein.com/podcasts/WNYC-Podcasts/New-Yorker-Radio-Hour-p803804/",
"rss": "https://feeds.feedburner.com/newyorkerradiohour"
}
},
"the-sam-sanders-show": {
"id": "the-sam-sanders-show",
"title": "The Sam Sanders Show",
"info": "One of public radio's most dynamic voices, Sam Sanders helped launch The NPR Politics Podcast and hosted NPR's hit show It's Been A Minute. Now, the award-winning host returns with something brand new, The Sam Sanders Show. Every week, Sam Sanders and friends dig into the culture that shapes our lives: what's driving the biggest trends, how artists really think, and even the memes you can't stop scrolling past. Sam is beloved for his way of unpacking the world and bringing you up close to fresh currents and engaging conversations. The Sam Sanders Show is smart, funny and always a good time.",
"airtime": "FRI 12-1pm AND SAT 11am-12pm",
"imageSrc": "https://cdn.kqed.org/wp-content/uploads/2025/11/The-Sam-Sanders-Show-Podcast-Tile-400x400-1.jpg",
"officialWebsiteLink": "https://www.kcrw.com/shows/the-sam-sanders-show/latest",
"meta": {
"site": "arts",
"source": "KCRW"
},
"link": "https://www.kcrw.com/shows/the-sam-sanders-show/latest",
"subscribe": {
"rss": "https://feed.cdnstream1.com/zjb/feed/download/ac/28/59/ac28594c-e1d0-4231-8728-61865cdc80e8.xml"
}
},
"the-splendid-table": {
"id": "the-splendid-table",
"title": "The Splendid Table",
"info": "\u003cem>The Splendid Table\u003c/em> hosts our nation's conversations about cooking, sustainability and food culture.",
"imageSrc": "https://cdn.kqed.org/wp-content/uploads/2024/04/The-Splendid-Table-Podcast-Tile-360x360-1.jpg",
"officialWebsiteLink": "https://www.splendidtable.org/",
"airtime": "SUN 10-11 pm",
"meta": {
"site": "radio",
"source": "npr"
},
"link": "/radio/program/the-splendid-table"
},
"this-american-life": {
"id": "this-american-life",
"title": "This American Life",
"info": "This American Life is a weekly public radio show, heard by 2.2 million people on more than 500 stations. Another 2.5 million people download the weekly podcast. It is hosted by Ira Glass, produced in collaboration with Chicago Public Media, delivered to stations by PRX The Public Radio Exchange, and has won all of the major broadcasting awards.",
"airtime": "SAT 12pm-1pm, 7pm-8pm",
"imageSrc": "https://ww2.kqed.org/radio/wp-content/uploads/sites/50/2018/04/thisAmericanLife.png",
"officialWebsiteLink": "https://www.thisamericanlife.org/",
"meta": {
"site": "news",
"source": "wbez"
},
"link": "/radio/program/this-american-life",
"subscribe": {
"apple": "https://itunes.apple.com/WebObjects/MZStore.woa/wa/viewPodcast?s=143441&mt=2&id=201671138&at=11l79Y&ct=nprdirectory",
"rss": "https://www.thisamericanlife.org/podcast/rss.xml"
}
},
"tinydeskradio": {
"id": "tinydeskradio",
"title": "Tiny Desk Radio",
"info": "We're bringing the best of Tiny Desk to the airwaves, only on public radio.",
"airtime": "SUN 8pm and SAT 9pm",
"imageSrc": "https://cdn.kqed.org/wp-content/uploads/2025/04/300x300-For-Member-Station-Logo-Tiny-Desk-Radio-@2x.png",
"officialWebsiteLink": "https://www.npr.org/series/g-s1-52030/tiny-desk-radio",
"meta": {
"site": "news",
"source": "npr"
},
"link": "/radio/program/tinydeskradio",
"subscribe": {
"rss": "https://feeds.npr.org/g-s1-52030/rss.xml"
}
},
"wait-wait-dont-tell-me": {
"id": "wait-wait-dont-tell-me",
"title": "Wait Wait... Don't Tell Me!",
"info": "Peter Sagal and Bill Kurtis host the weekly NPR News quiz show alongside some of the best and brightest news and entertainment personalities.",
"airtime": "SUN 10am-11am, SAT 11am-12pm, SAT 6pm-7pm",
"imageSrc": "https://cdn.kqed.org/wp-content/uploads/2024/04/Wait-Wait-Podcast-Tile-300x300-1.jpg",
"officialWebsiteLink": "https://www.npr.org/programs/wait-wait-dont-tell-me/",
"meta": {
"site": "news",
"source": "npr"
},
"link": "/radio/program/wait-wait-dont-tell-me",
"subscribe": {
"npr": "https://rpb3r.app.goo.gl/Xogv",
"apple": "https://itunes.apple.com/WebObjects/MZStore.woa/wa/viewPodcast?s=143441&mt=2&id=121493804&at=11l79Y&ct=nprdirectory",
"tuneIn": "https://tunein.com/radio/Wait-Wait-Dont-Tell-Me-p46/",
"rss": "https://feeds.npr.org/344098539/podcast.xml"
}
},
"weekend-edition-saturday": {
"id": "weekend-edition-saturday",
"title": "Weekend Edition Saturday",
"info": "Weekend Edition Saturday wraps up the week's news and offers a mix of analysis and features on a wide range of topics, including arts, sports, entertainment, and human interest stories. The two-hour program is hosted by NPR's Peabody Award-winning Scott Simon.",
"airtime": "SAT 5am-10am",
"imageSrc": "https://cdn.kqed.org/wp-content/uploads/2024/04/Weekend-Edition-Podcast-Tile-360x360-1.jpg",
"officialWebsiteLink": "https://www.npr.org/programs/weekend-edition-saturday/",
"meta": {
"site": "news",
"source": "npr"
},
"link": "/radio/program/weekend-edition-saturday"
},
"weekend-edition-sunday": {
"id": "weekend-edition-sunday",
"title": "Weekend Edition Sunday",
"info": "Weekend Edition Sunday features interviews with newsmakers, artists, scientists, politicians, musicians, writers, theologians and historians. The program has covered news events from Nelson Mandela's 1990 release from a South African prison to the capture of Saddam Hussein.",
"airtime": "SUN 5am-10am",
"imageSrc": "https://cdn.kqed.org/wp-content/uploads/2024/04/Weekend-Edition-Podcast-Tile-360x360-1.jpg",
"officialWebsiteLink": "https://www.npr.org/programs/weekend-edition-sunday/",
"meta": {
"site": "news",
"source": "npr"
},
"link": "/radio/program/weekend-edition-sunday"
}
},
"racesReducer": {},
"racesGenElectionReducer": {},
"racesGenElection2026Reducer": {},
"radioSchedulesReducer": {},
"listsReducer": {
"posts/science?tag=climate-change": {
"isFetching": false,
"latestQuery": {
"from": 600,
"size": 12
},
"vitalsOnly": false,
"totalRequested": 12,
"isLoading": false,
"isLoadingMore": true,
"total": {
"value": 634,
"relation": "eq"
},
"items": [
"science_364990",
"science_355510",
"science_341056",
"science_284657",
"science_185601",
"science_151663",
"science_139910",
"science_27643",
"science_27409",
"science_27188",
"science_26347",
"science_26317"
],
"complete": true
}
},
"recallGuideReducer": {
"intros": {},
"policy": {},
"candidates": {}
},
"savedArticleReducer": {
"articles": [],
"status": {}
},
"newslettersReducer": {
"isFetching": false,
"fetchFailed": false,
"hasFetched": false,
"newsletters": {},
"isSubscribing": false,
"isUnsubscribing": false,
"subscribedNewsletters": {}
},
"termsReducer": {
"about": {
"name": "About",
"type": "terms",
"id": "about",
"slug": "about",
"link": "/about",
"taxonomy": "site"
},
"arts": {
"name": "Arts & Culture",
"grouping": [
"arts",
"pop",
"trulyca"
],
"description": "KQED Arts provides daily in-depth coverage of the Bay Area's music, art, film, performing arts, literature and arts news, as well as cultural commentary and criticism.",
"type": "terms",
"id": "arts",
"slug": "arts",
"link": "/arts",
"taxonomy": "site"
},
"artschool": {
"name": "Art School",
"parent": "arts",
"type": "terms",
"id": "artschool",
"slug": "artschool",
"link": "/artschool",
"taxonomy": "site"
},
"bayareabites": {
"name": "KQED food",
"grouping": [
"food",
"bayareabites",
"checkplease"
],
"parent": "food",
"type": "terms",
"id": "bayareabites",
"slug": "bayareabites",
"link": "/food",
"taxonomy": "site"
},
"bayareahiphop": {
"name": "Bay Area Hiphop",
"type": "terms",
"id": "bayareahiphop",
"slug": "bayareahiphop",
"link": "/bayareahiphop",
"taxonomy": "site"
},
"campaign21": {
"name": "Campaign 21",
"type": "terms",
"id": "campaign21",
"slug": "campaign21",
"link": "/campaign21",
"taxonomy": "site"
},
"careers": {
"name": "Careers",
"type": "terms",
"id": "careers",
"slug": "careers",
"link": "/careers",
"taxonomy": "site"
},
"checkplease": {
"name": "KQED food",
"grouping": [
"food",
"bayareabites",
"checkplease"
],
"parent": "food",
"type": "terms",
"id": "checkplease",
"slug": "checkplease",
"link": "/food",
"taxonomy": "site"
},
"education": {
"name": "Education",
"grouping": [
"education"
],
"type": "terms",
"id": "education",
"slug": "education",
"link": "/education",
"taxonomy": "site"
},
"elections": {
"name": "Elections",
"type": "terms",
"id": "elections",
"slug": "elections",
"link": "/elections",
"taxonomy": "site"
},
"events": {
"name": "Events",
"type": "terms",
"id": "events",
"slug": "events",
"link": "/events",
"taxonomy": "site"
},
"event": {
"name": "Event",
"alias": "events",
"type": "terms",
"id": "event",
"slug": "event",
"link": "/event",
"taxonomy": "site"
},
"filmschoolshorts": {
"name": "Film School Shorts",
"type": "terms",
"id": "filmschoolshorts",
"slug": "filmschoolshorts",
"link": "/filmschoolshorts",
"taxonomy": "site"
},
"food": {
"name": "KQED food",
"grouping": [
"food",
"bayareabites",
"checkplease"
],
"type": "terms",
"id": "food",
"slug": "food",
"link": "/food",
"taxonomy": "site"
},
"forum": {
"name": "Forum",
"relatedContentQuery": "posts/forum?",
"parent": "news",
"type": "terms",
"id": "forum",
"slug": "forum",
"link": "/forum",
"taxonomy": "site"
},
"futureofyou": {
"name": "Future of You",
"grouping": [
"science",
"futureofyou"
],
"parent": "science",
"type": "terms",
"id": "futureofyou",
"slug": "futureofyou",
"link": "/futureofyou",
"taxonomy": "site"
},
"jpepinheart": {
"name": "KQED food",
"relatedContentQuery": "posts/food,bayareabites,checkplease",
"parent": "food",
"type": "terms",
"id": "jpepinheart",
"slug": "jpepinheart",
"link": "/food",
"taxonomy": "site"
},
"liveblog": {
"name": "Live Blog",
"type": "terms",
"id": "liveblog",
"slug": "liveblog",
"link": "/liveblog",
"taxonomy": "site"
},
"livetv": {
"name": "Live TV",
"parent": "tv",
"type": "terms",
"id": "livetv",
"slug": "livetv",
"link": "/livetv",
"taxonomy": "site"
},
"lowdown": {
"name": "The Lowdown",
"relatedContentQuery": "posts/lowdown?",
"parent": "news",
"type": "terms",
"id": "lowdown",
"slug": "lowdown",
"link": "/lowdown",
"taxonomy": "site"
},
"mindshift": {
"name": "Mindshift",
"parent": "news",
"description": "MindShift explores the future of education by highlighting the innovative – and sometimes counterintuitive – ways educators and parents are helping all children succeed.",
"type": "terms",
"id": "mindshift",
"slug": "mindshift",
"link": "/mindshift",
"taxonomy": "site"
},
"news": {
"name": "News",
"grouping": [
"news",
"forum"
],
"type": "terms",
"id": "news",
"slug": "news",
"link": "/news",
"taxonomy": "site"
},
"newsletters": {
"name": "newsletters",
"type": "terms",
"id": "newsletters",
"slug": "newsletters",
"link": "/newsletters",
"taxonomy": "site"
},
"perspectives": {
"name": "Perspectives",
"parent": "radio",
"type": "terms",
"id": "perspectives",
"slug": "perspectives",
"link": "/perspectives",
"taxonomy": "site"
},
"podcasts": {
"name": "Podcasts",
"type": "terms",
"id": "podcasts",
"slug": "podcasts",
"link": "/podcasts",
"taxonomy": "site"
},
"pop": {
"name": "Pop",
"parent": "arts",
"type": "terms",
"id": "pop",
"slug": "pop",
"link": "/pop",
"taxonomy": "site"
},
"pressroom": {
"name": "Pressroom",
"type": "terms",
"id": "pressroom",
"slug": "pressroom",
"link": "/pressroom",
"taxonomy": "site"
},
"quest": {
"name": "Quest",
"parent": "science",
"type": "terms",
"id": "quest",
"slug": "quest",
"link": "/quest",
"taxonomy": "site"
},
"radio": {
"name": "Radio",
"grouping": [
"forum",
"perspectives"
],
"description": "Listen to KQED Public Radio – home of Forum and The California Report – on 88.5 FM in San Francisco, 89.3 FM in Sacramento, 88.3 FM in Santa Rosa and 88.1 FM in Martinez.",
"type": "terms",
"id": "radio",
"slug": "radio",
"link": "/radio",
"taxonomy": "site"
},
"root": {
"name": "KQED",
"image": "https://ww2.kqed.org/app/uploads/2020/02/KQED-OG-Image@1x.png",
"imageWidth": 1200,
"imageHeight": 630,
"headData": {
"title": "KQED | News, Radio, Podcasts, TV | Public Media for Northern California",
"description": "KQED provides public radio, television, and independent reporting on issues that matter to the Bay Area. We’re the NPR and PBS member station for Northern California."
},
"type": "terms",
"id": "root",
"slug": "root",
"link": "/root",
"taxonomy": "site"
},
"science": {
"name": "Science",
"grouping": [
"science",
"futureofyou"
],
"description": "KQED Science brings you award-winning science and environment coverage from the Bay Area and beyond.",
"type": "terms",
"id": "science",
"slug": "science",
"link": "/science",
"taxonomy": "site"
},
"stateofhealth": {
"name": "State of Health",
"parent": "science",
"type": "terms",
"id": "stateofhealth",
"slug": "stateofhealth",
"link": "/stateofhealth",
"taxonomy": "site"
},
"support": {
"name": "Support",
"type": "terms",
"id": "support",
"slug": "support",
"link": "/support",
"taxonomy": "site"
},
"thedolist": {
"name": "The Do List",
"parent": "arts",
"type": "terms",
"id": "thedolist",
"slug": "thedolist",
"link": "/thedolist",
"taxonomy": "site"
},
"trulyca": {
"name": "Truly CA",
"grouping": [
"arts",
"pop",
"trulyca"
],
"parent": "arts",
"type": "terms",
"id": "trulyca",
"slug": "trulyca",
"link": "/trulyca",
"taxonomy": "site"
},
"tv": {
"name": "TV",
"type": "terms",
"id": "tv",
"slug": "tv",
"link": "/tv",
"taxonomy": "site"
},
"voterguide": {
"name": "Voter Guide",
"parent": "elections",
"alias": "elections",
"type": "terms",
"id": "voterguide",
"slug": "voterguide",
"link": "/voterguide",
"taxonomy": "site"
},
"guiaelectoral": {
"name": "Guia Electoral",
"parent": "elections",
"alias": "elections",
"type": "terms",
"id": "guiaelectoral",
"slug": "guiaelectoral",
"link": "/guiaelectoral",
"taxonomy": "site"
},
"science_tag_climate-change": {
"isLoading": true
},
"science_194": {
"type": "terms",
"id": "science_194",
"meta": {
"index": "terms_1716263798",
"site": "science",
"id": "194",
"found": true
},
"relationships": {},
"featImg": null,
"name": "climate change",
"description": null,
"taxonomy": "tag",
"headData": {
"twImgId": null,
"twTitle": null,
"ogTitle": null,
"ogImgId": null,
"twDescription": null,
"description": null,
"title": "climate change Archives | KQED Science",
"ogDescription": null
},
"ttid": 198,
"slug": "climate-change",
"isLoading": false,
"link": "/science/tag/climate-change"
},
"source_science_26317": {
"type": "terms",
"id": "source_science_26317",
"meta": {
"override": true
},
"name": "KQED Science",
"link": "https://ww2.kqed.org/science/",
"isLoading": false
},
"science_31": {
"type": "terms",
"id": "science_31",
"meta": {
"index": "terms_1716263798",
"site": "science",
"id": "31",
"found": true
},
"relationships": {},
"featImg": null,
"name": "Climate",
"description": null,
"taxonomy": "category",
"headData": {
"twImgId": null,
"twTitle": null,
"ogTitle": null,
"ogImgId": null,
"twDescription": null,
"description": null,
"title": "Climate Archives | KQED Science",
"ogDescription": null
},
"ttid": 33,
"slug": "climate",
"isLoading": false,
"link": "/science/category/climate"
},
"science_38": {
"type": "terms",
"id": "science_38",
"meta": {
"index": "terms_1716263798",
"site": "science",
"id": "38",
"found": true
},
"relationships": {},
"featImg": null,
"name": "Geology",
"description": null,
"taxonomy": "category",
"headData": {
"twImgId": null,
"twTitle": null,
"ogTitle": null,
"ogImgId": null,
"twDescription": null,
"description": null,
"title": "Geology Archives | KQED Science",
"ogDescription": null
},
"ttid": 40,
"slug": "geology",
"isLoading": false,
"link": "/science/category/geology"
},
"science_1852": {
"type": "terms",
"id": "science_1852",
"meta": {
"index": "terms_1716263798",
"site": "science",
"id": "1852",
"found": true
},
"relationships": {},
"featImg": null,
"name": "atmosphere",
"description": null,
"taxonomy": "tag",
"headData": {
"twImgId": null,
"twTitle": null,
"ogTitle": null,
"ogImgId": null,
"twDescription": null,
"description": null,
"title": "atmosphere Archives | KQED Science",
"ogDescription": null
},
"ttid": 1863,
"slug": "atmosphere",
"isLoading": false,
"link": "/science/tag/atmosphere"
},
"science_1404": {
"type": "terms",
"id": "science_1404",
"meta": {
"index": "terms_1716263798",
"site": "science",
"id": "1404",
"found": true
},
"relationships": {},
"featImg": null,
"name": "carbon dioxide",
"description": null,
"taxonomy": "tag",
"headData": {
"twImgId": null,
"twTitle": null,
"ogTitle": null,
"ogImgId": null,
"twDescription": null,
"description": null,
"title": "carbon dioxide Archives | KQED Science",
"ogDescription": null
},
"ttid": 1413,
"slug": "carbon-dioxide",
"isLoading": false,
"link": "/science/tag/carbon-dioxide"
},
"science_556": {
"type": "terms",
"id": "science_556",
"meta": {
"index": "terms_1716263798",
"site": "science",
"id": "556",
"found": true
},
"relationships": {},
"featImg": null,
"name": "global warming",
"description": null,
"taxonomy": "tag",
"headData": {
"twImgId": null,
"twTitle": null,
"ogTitle": null,
"ogImgId": null,
"twDescription": null,
"description": null,
"title": "global warming Archives | KQED Science",
"ogDescription": null
},
"ttid": 562,
"slug": "global-warming",
"isLoading": false,
"link": "/science/tag/global-warming"
},
"science_33": {
"type": "terms",
"id": "science_33",
"meta": {
"index": "terms_1716263798",
"site": "science",
"id": "33",
"found": true
},
"relationships": {},
"featImg": null,
"name": "Energy",
"description": null,
"taxonomy": "category",
"headData": {
"twImgId": null,
"twTitle": null,
"ogTitle": null,
"ogImgId": null,
"twDescription": null,
"description": null,
"title": "Energy Archives | KQED Science",
"ogDescription": null
},
"ttid": 35,
"slug": "energy",
"isLoading": false,
"link": "/science/category/energy"
},
"science_35": {
"type": "terms",
"id": "science_35",
"meta": {
"index": "terms_1716263798",
"site": "science",
"id": "35",
"found": true
},
"relationships": {},
"featImg": null,
"name": "Environment",
"description": null,
"taxonomy": "category",
"headData": {
"twImgId": null,
"twTitle": null,
"ogTitle": null,
"ogImgId": null,
"twDescription": null,
"description": null,
"title": "Environment Archives | KQED Science",
"ogDescription": null
},
"ttid": 37,
"slug": "environment",
"isLoading": false,
"link": "/science/category/environment"
},
"science_40": {
"type": "terms",
"id": "science_40",
"meta": {
"index": "terms_1716263798",
"site": "science",
"id": "40",
"found": true
},
"relationships": {},
"featImg": null,
"name": "News",
"description": null,
"taxonomy": "category",
"headData": {
"twImgId": null,
"twTitle": null,
"ogTitle": null,
"ogImgId": null,
"twDescription": null,
"description": null,
"title": "News Archives | KQED Science",
"ogDescription": null
},
"ttid": 42,
"slug": "news",
"isLoading": false,
"link": "/science/category/news"
},
"science_43": {
"type": "terms",
"id": "science_43",
"meta": {
"index": "terms_1716263798",
"site": "science",
"id": "43",
"found": true
},
"relationships": {},
"featImg": null,
"name": "Radio",
"description": null,
"taxonomy": "category",
"headData": {
"twImgId": null,
"twTitle": null,
"ogTitle": null,
"ogImgId": null,
"twDescription": null,
"description": null,
"title": "Radio Archives | KQED Science",
"ogDescription": null
},
"ttid": 45,
"slug": "radio",
"isLoading": false,
"link": "/science/category/radio"
},
"science_121": {
"type": "terms",
"id": "science_121",
"meta": {
"index": "terms_1716263798",
"site": "science",
"id": "121",
"found": true
},
"relationships": {},
"featImg": null,
"name": "cap and trade",
"description": null,
"taxonomy": "tag",
"headData": {
"twImgId": null,
"twTitle": null,
"ogTitle": null,
"ogImgId": null,
"twDescription": null,
"description": null,
"title": "cap and trade Archives | KQED Science",
"ogDescription": null
},
"ttid": 125,
"slug": "cap-and-trade",
"isLoading": false,
"link": "/science/tag/cap-and-trade"
},
"science_101": {
"type": "terms",
"id": "science_101",
"meta": {
"index": "terms_1716263798",
"site": "science",
"id": "101",
"found": true
},
"relationships": {},
"featImg": null,
"name": "Jerry Brown",
"description": null,
"taxonomy": "tag",
"headData": {
"twImgId": null,
"twTitle": null,
"ogTitle": null,
"ogImgId": null,
"twDescription": null,
"description": null,
"title": "Jerry Brown Archives | KQED Science",
"ogDescription": null
},
"ttid": 105,
"slug": "jerry-brown",
"isLoading": false,
"link": "/science/tag/jerry-brown"
},
"science_140": {
"type": "terms",
"id": "science_140",
"meta": {
"index": "terms_1716263798",
"site": "science",
"id": "140",
"found": true
},
"relationships": {},
"featImg": null,
"name": "renewable energy",
"description": null,
"taxonomy": "tag",
"headData": {
"twImgId": null,
"twTitle": null,
"ogTitle": null,
"ogImgId": null,
"twDescription": null,
"description": null,
"title": "renewable energy Archives | KQED Science",
"ogDescription": null
},
"ttid": 144,
"slug": "renewable-energy",
"isLoading": false,
"link": "/science/tag/renewable-energy"
},
"science_30": {
"type": "terms",
"id": "science_30",
"meta": {
"index": "terms_1716263798",
"site": "science",
"id": "30",
"found": true
},
"relationships": {},
"featImg": null,
"name": "Biology",
"description": null,
"taxonomy": "category",
"headData": {
"twImgId": null,
"twTitle": null,
"ogTitle": null,
"ogImgId": null,
"twDescription": null,
"description": null,
"title": "Biology Archives | KQED Science",
"ogDescription": null
},
"ttid": 32,
"slug": "biology",
"isLoading": false,
"link": "/science/category/biology"
},
"science_28": {
"type": "terms",
"id": "science_28",
"meta": {
"index": "terms_1716263798",
"site": "science",
"id": "28",
"found": true
},
"relationships": {},
"featImg": null,
"name": "Astronomy",
"description": "Explore the universe with KQED Science! Dive into the latest astronomy news, discover celestial events, and unravel the mysteries of outer space.",
"taxonomy": "category",
"headData": {
"twImgId": null,
"twTitle": null,
"ogTitle": null,
"ogImgId": null,
"twDescription": null,
"description": "Explore the universe with KQED Science! Dive into the latest astronomy news, discover celestial events, and unravel the mysteries of outer space.",
"title": "Astronomy Articles | KQED Science",
"ogDescription": null
},
"ttid": 30,
"slug": "astronomy",
"isLoading": false,
"link": "/science/category/astronomy"
},
"science_1151": {
"type": "terms",
"id": "science_1151",
"meta": {
"index": "terms_1716263798",
"site": "science",
"id": "1151",
"found": true
},
"relationships": {},
"featImg": null,
"name": "Drought Watch",
"description": "\u003cem>What California's reservoirs look like right now (From KQED's \u003ca href=\"http://ww2.kqed.org/lowdown/\">The Lowdown\u003c/a>)\u003c/em>\r\n\r\n[iframe src=\"http://kroodsma.com/KQED/water-supply-master/public/map.html\" width=\"640\" height=\"720\" frameborder=\"0\" scrolling=\"no\"]\r\n\r\n\u003cem>We’re collecting all of our California drought coverage here, starting with the current state of the drought, then providing the \u003ca href=\"#background\">background\u003c/a> and rounding up \u003ca href=\"#river\">all the stories\u003c/a> we’ve produced.\u003c/em>\r\n\r\n\u003cstrong>Relief at Last\r\n\u003c/strong>\r\n\r\nIn early April, after more than five years of the most withering drought on record, California Governor Jerry Brown finally lifted the emergency drought order he issued in January of 2014. By that time, the record-setting winter of 2016-17 had removed all doubt that the drought was over, though concerns over depleted groundwater levels still remain. According to the \u003ca href=\"http://droughtmonitor.unl.edu/\" target=\"_blank\">U.S. Drought Monitor\u003c/a>, less than 10 percent of California remains in “moderate drought” — compared to nearly 100 percent of the state a year ago.\r\n\r\n[http_redir]",
"taxonomy": "series",
"headData": {
"twImgId": null,
"twTitle": null,
"ogTitle": null,
"ogImgId": null,
"twDescription": null,
"description": "What California's reservoirs look like right now (From KQED's The Lowdown) [iframe src=\"http://kroodsma.com/KQED/water-supply-master/public/map.html\" width=\"640\" height=\"720\" frameborder=\"0\" scrolling=\"no\"] We’re collecting all of our California drought coverage here, starting with the current state of the drought, then providing the background and rounding up all the stories we’ve produced. Relief at Last In early April, after more than five years of the most withering drought on record, California Governor Jerry Brown finally lifted the emergency drought order he issued in January of 2014. By that time, the record-setting winter of 2016-17 had removed all doubt that the drought was over, though concerns over depleted groundwater levels still remain. According to the U.S. Drought Monitor, less than 10 percent of California remains in “moderate drought” — compared to nearly 100 percent of the state a year ago. [http_redir]",
"title": "Drought Watch Archives | KQED Science",
"ogDescription": null
},
"ttid": 1160,
"slug": "california-drought-watch",
"isLoading": false,
"link": "/science/series/california-drought-watch"
},
"science_98": {
"type": "terms",
"id": "science_98",
"meta": {
"index": "terms_1716263798",
"site": "science",
"id": "98",
"found": true
},
"relationships": {},
"featImg": null,
"name": "Water",
"description": null,
"taxonomy": "category",
"headData": {
"twImgId": null,
"twTitle": null,
"ogTitle": null,
"ogImgId": null,
"twDescription": null,
"description": null,
"title": "Water Archives | KQED Science",
"ogDescription": null
},
"ttid": 102,
"slug": "water",
"isLoading": false,
"link": "/science/category/water"
},
"science_1622": {
"type": "terms",
"id": "science_1622",
"meta": {
"index": "terms_1716263798",
"site": "science",
"id": "1622",
"found": true
},
"relationships": {},
"featImg": null,
"name": "California drought",
"description": null,
"taxonomy": "tag",
"headData": {
"twImgId": null,
"twTitle": null,
"ogTitle": null,
"ogImgId": null,
"twDescription": null,
"description": null,
"title": "California drought Archives | KQED Science",
"ogDescription": null
},
"ttid": 1631,
"slug": "california-drought",
"isLoading": false,
"link": "/science/tag/california-drought"
},
"science_46": {
"type": "terms",
"id": "science_46",
"meta": {
"index": "terms_1716263798",
"site": "science",
"id": "46",
"found": true
},
"relationships": {},
"featImg": null,
"name": "Audio",
"description": null,
"taxonomy": "category",
"headData": {
"twImgId": null,
"twTitle": null,
"ogTitle": null,
"ogImgId": null,
"twDescription": null,
"description": null,
"title": "Audio Archives | KQED Science",
"ogDescription": null
},
"ttid": 48,
"slug": "audio",
"isLoading": false,
"link": "/science/category/audio"
},
"science_29": {
"type": "terms",
"id": "science_29",
"meta": {
"index": "terms_1716263798",
"site": "science",
"id": "29",
"found": true
},
"relationships": {},
"featImg": null,
"name": "Chemistry",
"description": null,
"taxonomy": "category",
"headData": {
"twImgId": null,
"twTitle": null,
"ogTitle": null,
"ogImgId": null,
"twDescription": null,
"description": null,
"title": "Chemistry Archives | KQED Science",
"ogDescription": null
},
"ttid": 31,
"slug": "chemistry",
"isLoading": false,
"link": "/science/category/chemistry"
},
"science_89": {
"type": "terms",
"id": "science_89",
"meta": {
"index": "terms_1716263798",
"site": "science",
"id": "89",
"found": true
},
"relationships": {},
"featImg": null,
"name": "Engineering",
"description": null,
"taxonomy": "category",
"headData": {
"twImgId": null,
"twTitle": null,
"ogTitle": null,
"ogImgId": null,
"twDescription": null,
"description": null,
"title": "Engineering Archives | KQED Science",
"ogDescription": null
},
"ttid": 92,
"slug": "engineering",
"isLoading": false,
"link": "/science/category/engineering"
},
"science_134": {
"type": "terms",
"id": "science_134",
"meta": {
"index": "terms_1716263798",
"site": "science",
"id": "134",
"found": true
},
"relationships": {},
"featImg": null,
"name": "energy",
"description": null,
"taxonomy": "tag",
"headData": {
"twImgId": null,
"twTitle": null,
"ogTitle": null,
"ogImgId": null,
"twDescription": null,
"description": null,
"title": "energy Archives | KQED Science",
"ogDescription": null
},
"ttid": 138,
"slug": "energy-2",
"isLoading": false,
"link": "/science/tag/energy-2"
},
"science_306": {
"type": "terms",
"id": "science_306",
"meta": {
"index": "terms_1716263798",
"site": "science",
"id": "306",
"found": true
},
"relationships": {},
"featImg": null,
"name": "greenhouse gases",
"description": null,
"taxonomy": "tag",
"headData": {
"twImgId": null,
"twTitle": null,
"ogTitle": null,
"ogImgId": null,
"twDescription": null,
"description": null,
"title": "greenhouse gases Archives | KQED Science",
"ogDescription": null
},
"ttid": 311,
"slug": "greenhouse-gases",
"isLoading": false,
"link": "/science/tag/greenhouse-gases"
},
"science_64": {
"type": "terms",
"id": "science_64",
"meta": {
"index": "terms_1716263798",
"site": "science",
"id": "64",
"found": true
},
"relationships": {},
"featImg": null,
"name": "full-image",
"description": null,
"taxonomy": "tag",
"headData": {
"twImgId": null,
"twTitle": null,
"ogTitle": null,
"ogImgId": null,
"twDescription": null,
"description": null,
"title": "full-image Archives | KQED Science",
"ogDescription": null
},
"ttid": 67,
"slug": "full-image",
"isLoading": false,
"link": "/science/tag/full-image"
},
"science_5175": {
"type": "terms",
"id": "science_5175",
"meta": {
"index": "terms_1716263798",
"site": "science",
"id": "5175",
"found": true
},
"relationships": {},
"featImg": null,
"name": "NASA",
"description": null,
"taxonomy": "tag",
"headData": {
"twImgId": null,
"twTitle": null,
"ogTitle": null,
"ogImgId": null,
"twDescription": null,
"description": null,
"title": "NASA Archives | KQED Science",
"ogDescription": null
},
"ttid": 5175,
"slug": "nasa",
"isLoading": false,
"link": "/science/tag/nasa"
},
"science_3811": {
"type": "terms",
"id": "science_3811",
"meta": {
"index": "terms_1716263798",
"site": "science",
"id": "3811",
"found": true
},
"relationships": {},
"featImg": null,
"name": "notheat",
"description": null,
"taxonomy": "tag",
"headData": {
"twImgId": null,
"twTitle": null,
"ogTitle": null,
"ogImgId": null,
"twDescription": null,
"description": null,
"title": "notheat Archives | KQED Science",
"ogDescription": null
},
"ttid": 3811,
"slug": "notheat",
"isLoading": false,
"link": "/science/tag/notheat"
},
"science_572": {
"type": "terms",
"id": "science_572",
"meta": {
"index": "terms_1716263798",
"site": "science",
"id": "572",
"found": true
},
"relationships": {},
"featImg": null,
"name": "drought",
"description": null,
"taxonomy": "tag",
"headData": {
"twImgId": null,
"twTitle": null,
"ogTitle": null,
"ogImgId": null,
"twDescription": null,
"description": null,
"title": "drought Archives | KQED Science",
"ogDescription": null
},
"ttid": 578,
"slug": "drought",
"isLoading": false,
"link": "/science/tag/drought"
},
"science_5182": {
"type": "terms",
"id": "science_5182",
"meta": {
"index": "terms_1716263798",
"site": "science",
"id": "5182",
"found": true
},
"relationships": {},
"featImg": null,
"name": "NOAA",
"description": null,
"taxonomy": "tag",
"headData": {
"twImgId": null,
"twTitle": null,
"ogTitle": null,
"ogImgId": null,
"twDescription": null,
"description": null,
"title": "NOAA Archives | KQED Science",
"ogDescription": null
},
"ttid": 5182,
"slug": "noaa",
"isLoading": false,
"link": "/science/tag/noaa"
},
"science_2625": {
"type": "terms",
"id": "science_2625",
"meta": {
"index": "terms_1716263798",
"site": "science",
"id": "2625",
"found": true
},
"relationships": {},
"featImg": null,
"name": "PBS and the BBC present 'Big Blue Live'",
"description": "[caption id=\"attachment_149123\" align=\"aligncenter\" width=\"800\"] (Craig Miller/KQED)[/caption]\r\n\r\nFrom breaching humpback whales to fuzzy sea otters, great white sharks, kelp forests and an underwater canyon deeper than the Grand Canyon, Monterey Bay is one of the world's most amazing ocean destinations. In an unprecedented collaboration, PBS and the BBC presented \"\u003ca href=\"http://www.pbs.org/big-blue-live/home/\">Big Blue Live\u003c/a>,\" a three-night live broadcast that aired on KQED 9 at 8 pm Aug. 31 to Sept. 2, 2015 and featured the majestic marine life of Monterey Bay. \r\n\r\nAnchored from open-air studios at the Monterey Bay Aquarium and aboard research ships on the bay, scientists, filmmakers and other experts came together to document the extraordinary rejuvenation of the once-endangered and now thriving ecosystem of the Monterey Bay National Marine Sanctuary for viewers in the United States and Europe. Over the past decade, KQED has told many of the stories of this remarkable area on television, radio and the web.\r\n\r\nAlthough the Big Blue Live event is now over, you can \u003ca href=\"http://video.kqed.org/program/big-blue-live/\">watch all 3 episodes online through the entire month of September\u003c/a>:\r\n\r\nFeatured Stories",
"taxonomy": "series",
"headData": {
"twImgId": null,
"twTitle": null,
"ogTitle": null,
"ogImgId": null,
"twDescription": null,
"description": "[caption id=\"attachment_149123\" align=\"aligncenter\" width=\"800\"] (Craig Miller/KQED)[/caption] From breaching humpback whales to fuzzy sea otters, great white sharks, kelp forests and an underwater canyon deeper than the Grand Canyon, Monterey Bay is one of the world's most amazing ocean destinations. In an unprecedented collaboration, PBS and the BBC presented \"Big Blue Live,\" a three-night live broadcast that aired on KQED 9 at 8 pm Aug. 31 to Sept. 2, 2015 and featured the majestic marine life of Monterey Bay. Anchored from open-air studios at the Monterey Bay Aquarium and aboard research ships on the bay, scientists, filmmakers and other experts came together to document the extraordinary rejuvenation of the once-endangered and now thriving ecosystem of the Monterey Bay National Marine Sanctuary for viewers in the United States and Europe. Over the past decade, KQED has told many of the stories of this remarkable area on television, radio and the web. Although the Big Blue Live event is now over, you can watch all 3 episodes online through the entire month of September: Featured Stories",
"title": "PBS and the BBC present 'Big Blue Live' Archives | KQED Science",
"ogDescription": null
},
"ttid": 2637,
"slug": "big-blue-live",
"isLoading": false,
"link": "/science/series/big-blue-live"
},
"science_206": {
"type": "terms",
"id": "science_206",
"meta": {
"index": "terms_1716263798",
"site": "science",
"id": "206",
"found": true
},
"relationships": {},
"featImg": null,
"name": "sea level rise",
"description": null,
"taxonomy": "tag",
"headData": {
"twImgId": null,
"twTitle": null,
"ogTitle": null,
"ogImgId": null,
"twDescription": null,
"description": null,
"title": "sea level rise Archives | KQED Science",
"ogDescription": null
},
"ttid": 210,
"slug": "sea-level-rise",
"isLoading": false,
"link": "/science/tag/sea-level-rise"
}
},
"userPermissionsReducer": {
"wpLoggedIn": false
},
"eventsReducer": {},
"fssReducer": {},
"tvDailyScheduleReducer": {},
"tvWeeklyScheduleReducer": {},
"tvPrimetimeScheduleReducer": {},
"tvMonthlyScheduleReducer": {},
"userAccountReducer": {
"user": {
"email": null,
"emailStatus": "EMAIL_UNVALIDATED",
"loggedStatus": "LOGGED_OUT",
"loggingChecked": false,
"articles": [],
"firstName": null,
"lastName": null,
"phoneNumber": null,
"fetchingMembership": false,
"membershipError": false,
"memberships": [
{
"id": null,
"startDate": null,
"firstName": null,
"lastName": null,
"familyNumber": null,
"memberNumber": null,
"memberSince": null,
"expirationDate": null,
"pfsEligible": false,
"isSustaining": false,
"membershipLevel": "Prospect",
"membershipStatus": "Non Member",
"lastGiftDate": null,
"renewalDate": null,
"lastDonationAmount": null
}
]
},
"authModal": {
"isOpen": false,
"view": "LANDING_VIEW"
},
"error": null
},
"youthMediaReducer": {},
"checkPleaseReducer": {
"filterData": {
"region": {
"key": "Restaurant Region",
"filters": [
"Any Region"
]
},
"cuisine": {
"key": "Restaurant Cuisine",
"filters": [
"Any Cuisine"
]
}
},
"restaurantDataById": {},
"restaurantIdsSorted": [],
"error": null
},
"userAgentReducer": {
"userAgent": "Mozilla/5.0 AppleWebKit/537.36 (KHTML, like Gecko; compatible; ClaudeBot/1.0; +claudebot@anthropic.com)",
"isBot": true
},
"requestOutcomesReducer": {
"notFound": []
}
}