window.__IS_SSR__=true
window.__INITIAL_STATE__={
"attachmentsReducer": {
"audio_0": {
"type": "attachments",
"id": "audio_0",
"imgSizes": {
"kqedFullSize": {
"file": "https://ww2.kqed.org/news/wp-content/themes/KQED-unified/img/audio_bgs/background0.jpg"
}
}
},
"audio_1": {
"type": "attachments",
"id": "audio_1",
"imgSizes": {
"kqedFullSize": {
"file": "https://ww2.kqed.org/news/wp-content/themes/KQED-unified/img/audio_bgs/background1.jpg"
}
}
},
"audio_2": {
"type": "attachments",
"id": "audio_2",
"imgSizes": {
"kqedFullSize": {
"file": "https://ww2.kqed.org/news/wp-content/themes/KQED-unified/img/audio_bgs/background2.jpg"
}
}
},
"audio_3": {
"type": "attachments",
"id": "audio_3",
"imgSizes": {
"kqedFullSize": {
"file": "https://ww2.kqed.org/news/wp-content/themes/KQED-unified/img/audio_bgs/background3.jpg"
}
}
},
"audio_4": {
"type": "attachments",
"id": "audio_4",
"imgSizes": {
"kqedFullSize": {
"file": "https://ww2.kqed.org/news/wp-content/themes/KQED-unified/img/audio_bgs/background4.jpg"
}
}
},
"placeholder": {
"type": "attachments",
"id": "placeholder",
"imgSizes": {
"thumbnail": {
"file": "https://cdn.kqed.org/wp-content/uploads/2024/12/KQED-Default-Image-816638274-2000x1333-1-160x107.jpg",
"width": 160,
"height": 107,
"mimeType": "image/jpeg"
},
"medium": {
"file": "https://cdn.kqed.org/wp-content/uploads/2024/12/KQED-Default-Image-816638274-2000x1333-1-800x533.jpg",
"width": 800,
"height": 533,
"mimeType": "image/jpeg"
},
"medium_large": {
"file": "https://cdn.kqed.org/wp-content/uploads/2024/12/KQED-Default-Image-816638274-2000x1333-1-768x512.jpg",
"width": 768,
"height": 512,
"mimeType": "image/jpeg"
},
"large": {
"file": "https://cdn.kqed.org/wp-content/uploads/2024/12/KQED-Default-Image-816638274-2000x1333-1-1020x680.jpg",
"width": 1020,
"height": 680,
"mimeType": "image/jpeg"
},
"1536x1536": {
"file": "https://cdn.kqed.org/wp-content/uploads/2024/12/KQED-Default-Image-816638274-2000x1333-1-1536x1024.jpg",
"width": 1536,
"height": 1024,
"mimeType": "image/jpeg"
},
"fd-lrg": {
"file": "https://cdn.kqed.org/wp-content/uploads/2024/12/KQED-Default-Image-816638274-2000x1333-1-1536x1024.jpg",
"width": 1536,
"height": 1024,
"mimeType": "image/jpeg"
},
"fd-med": {
"file": "https://cdn.kqed.org/wp-content/uploads/2024/12/KQED-Default-Image-816638274-2000x1333-1-1020x680.jpg",
"width": 1020,
"height": 680,
"mimeType": "image/jpeg"
},
"fd-sm": {
"file": "https://cdn.kqed.org/wp-content/uploads/2024/12/KQED-Default-Image-816638274-2000x1333-1-800x533.jpg",
"width": 800,
"height": 533,
"mimeType": "image/jpeg"
},
"post-thumbnail": {
"file": "https://cdn.kqed.org/wp-content/uploads/2024/12/KQED-Default-Image-816638274-2000x1333-1-672x372.jpg",
"width": 672,
"height": 372,
"mimeType": "image/jpeg"
},
"twentyfourteen-full-width": {
"file": "https://cdn.kqed.org/wp-content/uploads/2024/12/KQED-Default-Image-816638274-2000x1333-1-1038x576.jpg",
"width": 1038,
"height": 576,
"mimeType": "image/jpeg"
},
"xxsmall": {
"file": "https://cdn.kqed.org/wp-content/uploads/2024/12/KQED-Default-Image-816638274-2000x1333-1-160x107.jpg",
"width": 160,
"height": 107,
"mimeType": "image/jpeg"
},
"xsmall": {
"file": "https://cdn.kqed.org/wp-content/uploads/2024/12/KQED-Default-Image-816638274-2000x1333-1-672x372.jpg",
"width": 672,
"height": 372,
"mimeType": "image/jpeg"
},
"small": {
"file": "https://cdn.kqed.org/wp-content/uploads/2024/12/KQED-Default-Image-816638274-2000x1333-1-672x372.jpg",
"width": 672,
"height": 372,
"mimeType": "image/jpeg"
},
"xlarge": {
"file": "https://cdn.kqed.org/wp-content/uploads/2024/12/KQED-Default-Image-816638274-2000x1333-1-1020x680.jpg",
"width": 1020,
"height": 680,
"mimeType": "image/jpeg"
},
"full-width": {
"file": "https://cdn.kqed.org/wp-content/uploads/2024/12/KQED-Default-Image-816638274-2000x1333-1-1920x1280.jpg",
"width": 1920,
"height": 1280,
"mimeType": "image/jpeg"
},
"guest-author-32": {
"file": "https://cdn.kqed.org/wp-content/uploads/2025/01/KQED-Default-Image-816638274-1333x1333-1-160x160.jpg",
"width": 32,
"height": 32,
"mimeType": "image/jpeg"
},
"guest-author-50": {
"file": "https://cdn.kqed.org/wp-content/uploads/2025/01/KQED-Default-Image-816638274-1333x1333-1-160x160.jpg",
"width": 50,
"height": 50,
"mimeType": "image/jpeg"
},
"guest-author-64": {
"file": "https://cdn.kqed.org/wp-content/uploads/2025/01/KQED-Default-Image-816638274-1333x1333-1-160x160.jpg",
"width": 64,
"height": 64,
"mimeType": "image/jpeg"
},
"guest-author-96": {
"file": "https://cdn.kqed.org/wp-content/uploads/2025/01/KQED-Default-Image-816638274-1333x1333-1-160x160.jpg",
"width": 96,
"height": 96,
"mimeType": "image/jpeg"
},
"guest-author-128": {
"file": "https://cdn.kqed.org/wp-content/uploads/2025/01/KQED-Default-Image-816638274-1333x1333-1-160x160.jpg",
"width": 128,
"height": 128,
"mimeType": "image/jpeg"
},
"detail": {
"file": "https://cdn.kqed.org/wp-content/uploads/2025/01/KQED-Default-Image-816638274-1333x1333-1-160x160.jpg",
"width": 160,
"height": 160,
"mimeType": "image/jpeg"
},
"kqedFullSize": {
"file": "https://cdn.kqed.org/wp-content/uploads/2024/12/KQED-Default-Image-816638274-2000x1333-1.jpg",
"width": 2000,
"height": 1333
}
}
},
"science_893165": {
"type": "attachments",
"id": "science_893165",
"meta": {
"index": "attachments_1716263798",
"site": "science",
"id": "893165",
"found": true
},
"parent": 846701,
"imgSizes": {
"twentyfourteen-full-width": {
"file": "https://ww2.kqed.org/app/uploads/sites/35/2016/08/IMG_0631-1038x576.jpg",
"width": 1038,
"mimeType": "image/jpeg",
"height": 576
},
"thumbnail": {
"file": "https://ww2.kqed.org/app/uploads/sites/35/2016/08/IMG_0631-400x300.jpg",
"width": 400,
"mimeType": "image/jpeg",
"height": 300
},
"fd-sm": {
"file": "https://ww2.kqed.org/app/uploads/sites/35/2016/08/IMG_0631-960x720.jpg",
"width": 960,
"mimeType": "image/jpeg",
"height": 720
},
"post-thumbnail": {
"file": "https://ww2.kqed.org/app/uploads/sites/35/2016/08/IMG_0631-672x372.jpg",
"width": 672,
"mimeType": "image/jpeg",
"height": 372
},
"kqedFullSize": {
"file": "https://ww2.kqed.org/app/uploads/sites/35/2016/08/IMG_0631.jpg",
"width": 2000,
"height": 1500
},
"large": {
"file": "https://ww2.kqed.org/app/uploads/sites/35/2016/08/IMG_0631-1440x1080.jpg",
"width": 1440,
"mimeType": "image/jpeg",
"height": 1080
},
"guest-author-50": {
"file": "https://ww2.kqed.org/app/uploads/sites/35/2016/08/IMG_0631-50x50.jpg",
"width": 50,
"mimeType": "image/jpeg",
"height": 50
},
"guest-author-96": {
"file": "https://ww2.kqed.org/app/uploads/sites/35/2016/08/IMG_0631-96x96.jpg",
"width": 96,
"mimeType": "image/jpeg",
"height": 96
},
"medium": {
"file": "https://ww2.kqed.org/app/uploads/sites/35/2016/08/IMG_0631-800x600.jpg",
"width": 800,
"mimeType": "image/jpeg",
"height": 600
},
"guest-author-64": {
"file": "https://ww2.kqed.org/app/uploads/sites/35/2016/08/IMG_0631-64x64.jpg",
"width": 64,
"mimeType": "image/jpeg",
"height": 64
},
"guest-author-32": {
"file": "https://ww2.kqed.org/app/uploads/sites/35/2016/08/IMG_0631-32x32.jpg",
"width": 32,
"mimeType": "image/jpeg",
"height": 32
},
"fd-lrg": {
"file": "https://ww2.kqed.org/app/uploads/sites/35/2016/08/IMG_0631-1920x1440.jpg",
"width": 1920,
"mimeType": "image/jpeg",
"height": 1440
},
"fd-med": {
"file": "https://ww2.kqed.org/app/uploads/sites/35/2016/08/IMG_0631-1180x885.jpg",
"width": 1180,
"mimeType": "image/jpeg",
"height": 885
},
"detail": {
"file": "https://ww2.kqed.org/app/uploads/sites/35/2016/08/IMG_0631-150x150.jpg",
"width": 150,
"mimeType": "image/jpeg",
"height": 150
},
"medium_large": {
"file": "https://ww2.kqed.org/app/uploads/sites/35/2016/08/IMG_0631-768x576.jpg",
"width": 768,
"mimeType": "image/jpeg",
"height": 576
},
"guest-author-128": {
"file": "https://ww2.kqed.org/app/uploads/sites/35/2016/08/IMG_0631-128x128.jpg",
"width": 128,
"mimeType": "image/jpeg",
"height": 128
}
},
"publishDate": 1470162514,
"modified": 1470162576,
"caption": "Urban water conservation fell off in June, compared to the same month last year.",
"description": "Urban water conservation fell off in June, compared to the same month last year.",
"title": "IMG_0631",
"credit": "Craig Miller/KQED",
"status": "inherit",
"isLoading": false,
"fetchFailed": false
},
"science_884445": {
"type": "attachments",
"id": "science_884445",
"meta": {
"index": "attachments_1716263798",
"site": "science",
"id": "884445",
"found": true
},
"parent": 884418,
"imgSizes": {
"twentyfourteen-full-width": {
"file": "https://ww2.kqed.org/app/uploads/sites/35/2016/07/28213236340_5a1b0430b6_k-1038x576.jpg",
"width": 1038,
"mimeType": "image/jpeg",
"height": 576
},
"thumbnail": {
"file": "https://ww2.kqed.org/app/uploads/sites/35/2016/07/28213236340_5a1b0430b6_k-400x267.jpg",
"width": 400,
"mimeType": "image/jpeg",
"height": 267
},
"fd-sm": {
"file": "https://ww2.kqed.org/app/uploads/sites/35/2016/07/28213236340_5a1b0430b6_k-960x640.jpg",
"width": 960,
"mimeType": "image/jpeg",
"height": 640
},
"post-thumbnail": {
"file": "https://ww2.kqed.org/app/uploads/sites/35/2016/07/28213236340_5a1b0430b6_k-672x372.jpg",
"width": 672,
"mimeType": "image/jpeg",
"height": 372
},
"kqedFullSize": {
"file": "https://ww2.kqed.org/app/uploads/sites/35/2016/07/28213236340_5a1b0430b6_k.jpg",
"width": 2048,
"height": 1365
},
"large": {
"file": "https://ww2.kqed.org/app/uploads/sites/35/2016/07/28213236340_5a1b0430b6_k-1440x960.jpg",
"width": 1440,
"mimeType": "image/jpeg",
"height": 960
},
"guest-author-50": {
"file": "https://ww2.kqed.org/app/uploads/sites/35/2016/07/28213236340_5a1b0430b6_k-50x50.jpg",
"width": 50,
"mimeType": "image/jpeg",
"height": 50
},
"guest-author-96": {
"file": "https://ww2.kqed.org/app/uploads/sites/35/2016/07/28213236340_5a1b0430b6_k-96x96.jpg",
"width": 96,
"mimeType": "image/jpeg",
"height": 96
},
"medium": {
"file": "https://ww2.kqed.org/app/uploads/sites/35/2016/07/28213236340_5a1b0430b6_k-800x533.jpg",
"width": 800,
"mimeType": "image/jpeg",
"height": 533
},
"guest-author-64": {
"file": "https://ww2.kqed.org/app/uploads/sites/35/2016/07/28213236340_5a1b0430b6_k-64x64.jpg",
"width": 64,
"mimeType": "image/jpeg",
"height": 64
},
"guest-author-32": {
"file": "https://ww2.kqed.org/app/uploads/sites/35/2016/07/28213236340_5a1b0430b6_k-32x32.jpg",
"width": 32,
"mimeType": "image/jpeg",
"height": 32
},
"fd-lrg": {
"file": "https://ww2.kqed.org/app/uploads/sites/35/2016/07/28213236340_5a1b0430b6_k-1920x1280.jpg",
"width": 1920,
"mimeType": "image/jpeg",
"height": 1280
},
"fd-med": {
"file": "https://ww2.kqed.org/app/uploads/sites/35/2016/07/28213236340_5a1b0430b6_k-1180x786.jpg",
"width": 1180,
"mimeType": "image/jpeg",
"height": 786
},
"detail": {
"file": "https://ww2.kqed.org/app/uploads/sites/35/2016/07/28213236340_5a1b0430b6_k-150x150.jpg",
"width": 150,
"mimeType": "image/jpeg",
"height": 150
},
"medium_large": {
"file": "https://ww2.kqed.org/app/uploads/sites/35/2016/07/28213236340_5a1b0430b6_k-768x512.jpg",
"width": 768,
"mimeType": "image/jpeg",
"height": 512
},
"guest-author-128": {
"file": "https://ww2.kqed.org/app/uploads/sites/35/2016/07/28213236340_5a1b0430b6_k-128x128.jpg",
"width": 128,
"mimeType": "image/jpeg",
"height": 128
}
},
"publishDate": 1469833626,
"modified": 1469833773,
"caption": "The Sand Fire in Santa Clarita.",
"description": null,
"title": "28213236340_5a1b0430b6_k",
"credit": "\u003ca href=\"https://www.flickr.com/photos/kevinmgill/28213236340/in/photolist-Kstmvm-JwGj9y-KtbGHn-Jvz38q-KqrdBa-JZ7dej-KhayK2/\">Kevin Gill/flickr\u003c/a>",
"status": "inherit",
"isLoading": false,
"fetchFailed": false
},
"science_881997": {
"type": "attachments",
"id": "science_881997",
"meta": {
"index": "attachments_1716263798",
"site": "science",
"id": "881997",
"found": true
},
"parent": 881900,
"imgSizes": {
"twentyfourteen-full-width": {
"file": "https://ww2.kqed.org/app/uploads/sites/35/2016/07/SierraOAP_1859-1038x576.jpeg",
"width": 1038,
"mimeType": "image/jpeg",
"height": 576
},
"thumbnail": {
"file": "https://ww2.kqed.org/app/uploads/sites/35/2016/07/SierraOAP_1859-400x300.jpeg",
"width": 400,
"mimeType": "image/jpeg",
"height": 300
},
"fd-sm": {
"file": "https://ww2.kqed.org/app/uploads/sites/35/2016/07/SierraOAP_1859-960x720.jpeg",
"width": 960,
"mimeType": "image/jpeg",
"height": 720
},
"post-thumbnail": {
"file": "https://ww2.kqed.org/app/uploads/sites/35/2016/07/SierraOAP_1859-672x372.jpeg",
"width": 672,
"mimeType": "image/jpeg",
"height": 372
},
"kqedFullSize": {
"file": "https://ww2.kqed.org/app/uploads/sites/35/2016/07/SierraOAP_1859-e1469741938789.jpeg",
"width": 2000,
"height": 1500
},
"large": {
"file": "https://ww2.kqed.org/app/uploads/sites/35/2016/07/SierraOAP_1859-1440x1080.jpeg",
"width": 1440,
"mimeType": "image/jpeg",
"height": 1080
},
"guest-author-50": {
"file": "https://ww2.kqed.org/app/uploads/sites/35/2016/07/SierraOAP_1859-50x50.jpeg",
"width": 50,
"mimeType": "image/jpeg",
"height": 50
},
"guest-author-96": {
"file": "https://ww2.kqed.org/app/uploads/sites/35/2016/07/SierraOAP_1859-96x96.jpeg",
"width": 96,
"mimeType": "image/jpeg",
"height": 96
},
"medium": {
"file": "https://ww2.kqed.org/app/uploads/sites/35/2016/07/SierraOAP_1859-800x600.jpeg",
"width": 800,
"mimeType": "image/jpeg",
"height": 600
},
"guest-author-64": {
"file": "https://ww2.kqed.org/app/uploads/sites/35/2016/07/SierraOAP_1859-64x64.jpeg",
"width": 64,
"mimeType": "image/jpeg",
"height": 64
},
"guest-author-32": {
"file": "https://ww2.kqed.org/app/uploads/sites/35/2016/07/SierraOAP_1859-32x32.jpeg",
"width": 32,
"mimeType": "image/jpeg",
"height": 32
},
"fd-lrg": {
"file": "https://ww2.kqed.org/app/uploads/sites/35/2016/07/SierraOAP_1859-1920x1440.jpeg",
"width": 1920,
"mimeType": "image/jpeg",
"height": 1440
},
"fd-med": {
"file": "https://ww2.kqed.org/app/uploads/sites/35/2016/07/SierraOAP_1859-1180x885.jpeg",
"width": 1180,
"mimeType": "image/jpeg",
"height": 885
},
"detail": {
"file": "https://ww2.kqed.org/app/uploads/sites/35/2016/07/SierraOAP_1859-150x150.jpeg",
"width": 150,
"mimeType": "image/jpeg",
"height": 150
},
"medium_large": {
"file": "https://ww2.kqed.org/app/uploads/sites/35/2016/07/SierraOAP_1859-768x576.jpeg",
"width": 768,
"mimeType": "image/jpeg",
"height": 576
},
"guest-author-128": {
"file": "https://ww2.kqed.org/app/uploads/sites/35/2016/07/SierraOAP_1859-128x128.jpeg",
"width": 128,
"mimeType": "image/jpeg",
"height": 128
}
},
"publishDate": 1469741913,
"modified": 1469753597,
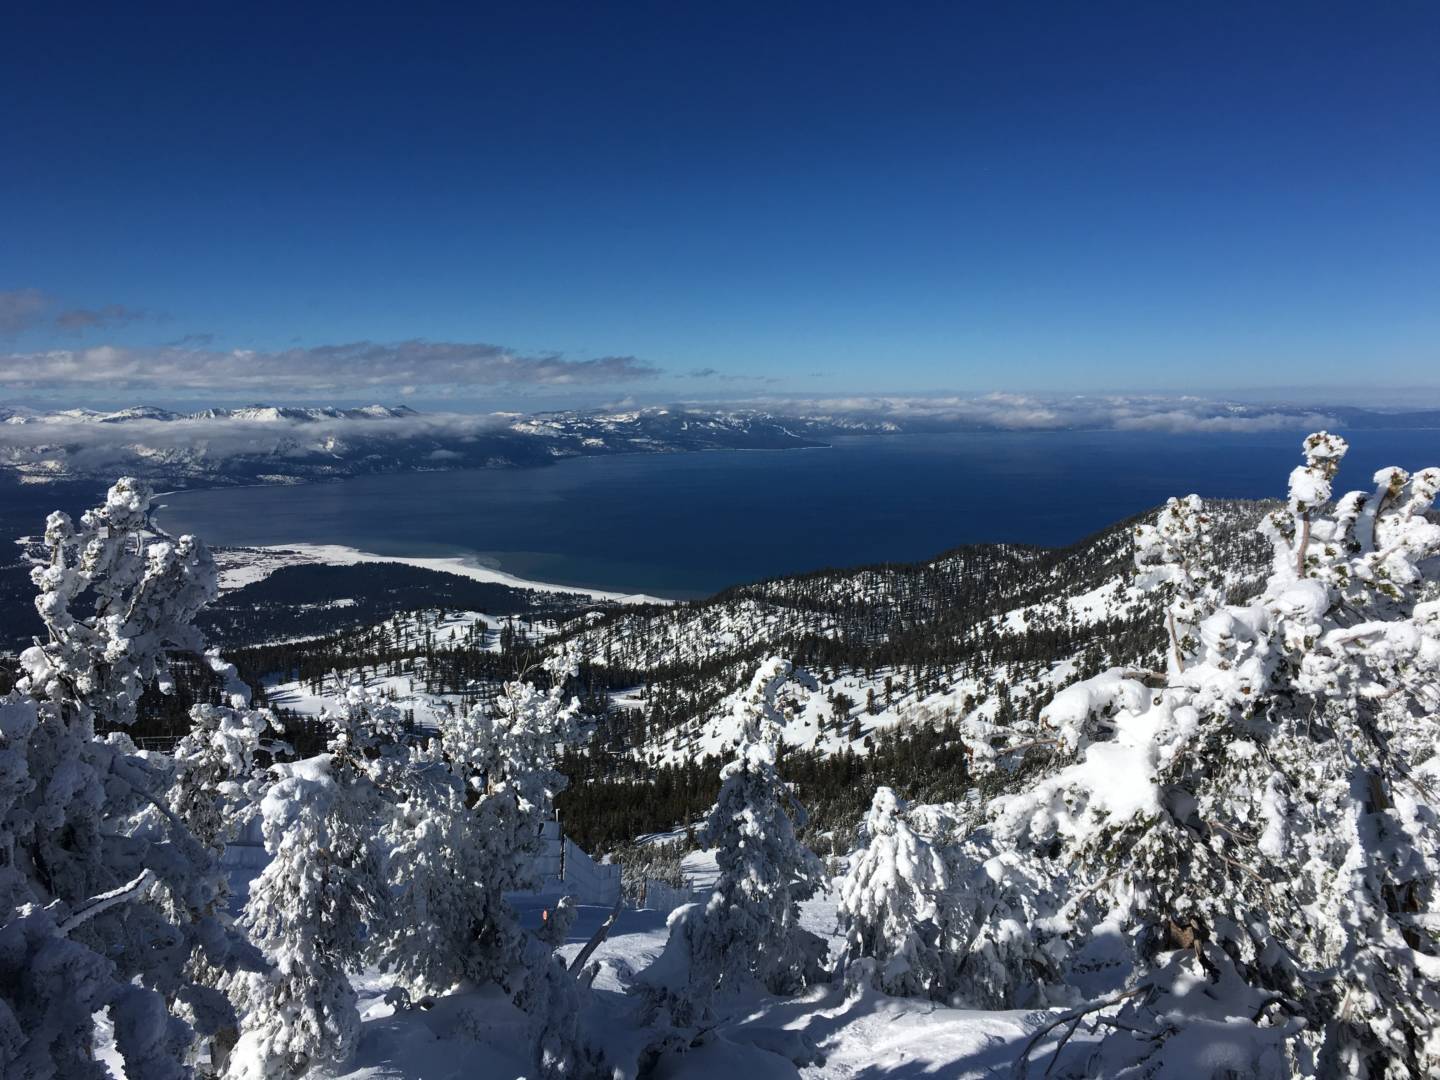
"caption": "As scientists have long predicted, more winter precipitation at Lake Tahoe is falling as rain, rather than snow.",
"description": "As scientists have long predicted, more winter precipitation at Lake Tahoe is falling as rain, rather than snow.",
"title": "SierraOAP_1859",
"credit": "Olivia Allen-Price/KQED",
"status": "inherit",
"isLoading": false,
"fetchFailed": false
},
"science_863271": {
"type": "attachments",
"id": "science_863271",
"meta": {
"index": "attachments_1716263798",
"site": "science",
"id": "863271",
"found": true
},
"parent": 863270,
"imgSizes": {
"twentyfourteen-full-width": {
"file": "https://ww2.kqed.org/app/uploads/sites/35/2016/07/APTOPIXCloningGiantTrees-bc52c-1038x576.jpg",
"width": 1038,
"mimeType": "image/jpeg",
"height": 576
},
"thumbnail": {
"file": "https://ww2.kqed.org/app/uploads/sites/35/2016/07/APTOPIXCloningGiantTrees-bc52c-400x271.jpg",
"width": 400,
"mimeType": "image/jpeg",
"height": 271
},
"fd-sm": {
"file": "https://ww2.kqed.org/app/uploads/sites/35/2016/07/APTOPIXCloningGiantTrees-bc52c-960x649.jpg",
"width": 960,
"mimeType": "image/jpeg",
"height": 649
},
"post-thumbnail": {
"file": "https://ww2.kqed.org/app/uploads/sites/35/2016/07/APTOPIXCloningGiantTrees-bc52c-672x372.jpg",
"width": 672,
"mimeType": "image/jpeg",
"height": 372
},
"kqedFullSize": {
"file": "https://ww2.kqed.org/app/uploads/sites/35/2016/07/APTOPIXCloningGiantTrees-bc52c.jpg",
"width": 1484,
"height": 1004
},
"large": {
"file": "https://ww2.kqed.org/app/uploads/sites/35/2016/07/APTOPIXCloningGiantTrees-bc52c-1440x974.jpg",
"width": 1440,
"mimeType": "image/jpeg",
"height": 974
},
"guest-author-50": {
"file": "https://ww2.kqed.org/app/uploads/sites/35/2016/07/APTOPIXCloningGiantTrees-bc52c-50x50.jpg",
"width": 50,
"mimeType": "image/jpeg",
"height": 50
},
"guest-author-96": {
"file": "https://ww2.kqed.org/app/uploads/sites/35/2016/07/APTOPIXCloningGiantTrees-bc52c-96x96.jpg",
"width": 96,
"mimeType": "image/jpeg",
"height": 96
},
"medium": {
"file": "https://ww2.kqed.org/app/uploads/sites/35/2016/07/APTOPIXCloningGiantTrees-bc52c-800x541.jpg",
"width": 800,
"mimeType": "image/jpeg",
"height": 541
},
"guest-author-64": {
"file": "https://ww2.kqed.org/app/uploads/sites/35/2016/07/APTOPIXCloningGiantTrees-bc52c-64x64.jpg",
"width": 64,
"mimeType": "image/jpeg",
"height": 64
},
"guest-author-32": {
"file": "https://ww2.kqed.org/app/uploads/sites/35/2016/07/APTOPIXCloningGiantTrees-bc52c-32x32.jpg",
"width": 32,
"mimeType": "image/jpeg",
"height": 32
},
"fd-med": {
"file": "https://ww2.kqed.org/app/uploads/sites/35/2016/07/APTOPIXCloningGiantTrees-bc52c-1180x798.jpg",
"width": 1180,
"mimeType": "image/jpeg",
"height": 798
},
"detail": {
"file": "https://ww2.kqed.org/app/uploads/sites/35/2016/07/APTOPIXCloningGiantTrees-bc52c-150x150.jpg",
"width": 150,
"mimeType": "image/jpeg",
"height": 150
},
"medium_large": {
"file": "https://ww2.kqed.org/app/uploads/sites/35/2016/07/APTOPIXCloningGiantTrees-bc52c-768x520.jpg",
"width": 768,
"mimeType": "image/jpeg",
"height": 520
},
"guest-author-128": {
"file": "https://ww2.kqed.org/app/uploads/sites/35/2016/07/APTOPIXCloningGiantTrees-bc52c-128x128.jpg",
"width": 128,
"mimeType": "image/jpeg",
"height": 128
}
},
"publishDate": 1469050528,
"modified": 1469050998,
"caption": " arborist Jim Clark inches up a giant sequoia to collect new growth from its canopy in the southern Sierra Nevada near Camp Nelson, Calif.",
"description": " arborist Jim Clark inches up a giant sequoia to collect new growth from its canopy in the southern Sierra Nevada near Camp Nelson, Calif.",
"title": "APTOPIXCloningGiantTrees-bc52c",
"credit": "Scott Smith/AP",
"status": "inherit",
"isLoading": false,
"fetchFailed": false
},
"science_860501": {
"type": "attachments",
"id": "science_860501",
"meta": {
"index": "attachments_1716263798",
"site": "science",
"id": "860501",
"found": true
},
"parent": 860496,
"imgSizes": {
"twentyfourteen-full-width": {
"file": "https://ww2.kqed.org/app/uploads/sites/35/2016/07/8670911441_374efd4745_k-1-1038x576.jpg",
"width": 1038,
"mimeType": "image/jpeg",
"height": 576
},
"thumbnail": {
"file": "https://ww2.kqed.org/app/uploads/sites/35/2016/07/8670911441_374efd4745_k-1-400x267.jpg",
"width": 400,
"mimeType": "image/jpeg",
"height": 267
},
"fd-sm": {
"file": "https://ww2.kqed.org/app/uploads/sites/35/2016/07/8670911441_374efd4745_k-1-960x640.jpg",
"width": 960,
"mimeType": "image/jpeg",
"height": 640
},
"post-thumbnail": {
"file": "https://ww2.kqed.org/app/uploads/sites/35/2016/07/8670911441_374efd4745_k-1-672x372.jpg",
"width": 672,
"mimeType": "image/jpeg",
"height": 372
},
"kqedFullSize": {
"file": "https://ww2.kqed.org/app/uploads/sites/35/2016/07/8670911441_374efd4745_k-1.jpg",
"width": 2048,
"height": 1365
},
"large": {
"file": "https://ww2.kqed.org/app/uploads/sites/35/2016/07/8670911441_374efd4745_k-1-1440x960.jpg",
"width": 1440,
"mimeType": "image/jpeg",
"height": 960
},
"guest-author-50": {
"file": "https://ww2.kqed.org/app/uploads/sites/35/2016/07/8670911441_374efd4745_k-1-50x50.jpg",
"width": 50,
"mimeType": "image/jpeg",
"height": 50
},
"guest-author-96": {
"file": "https://ww2.kqed.org/app/uploads/sites/35/2016/07/8670911441_374efd4745_k-1-96x96.jpg",
"width": 96,
"mimeType": "image/jpeg",
"height": 96
},
"medium": {
"file": "https://ww2.kqed.org/app/uploads/sites/35/2016/07/8670911441_374efd4745_k-1-800x533.jpg",
"width": 800,
"mimeType": "image/jpeg",
"height": 533
},
"guest-author-64": {
"file": "https://ww2.kqed.org/app/uploads/sites/35/2016/07/8670911441_374efd4745_k-1-64x64.jpg",
"width": 64,
"mimeType": "image/jpeg",
"height": 64
},
"guest-author-32": {
"file": "https://ww2.kqed.org/app/uploads/sites/35/2016/07/8670911441_374efd4745_k-1-32x32.jpg",
"width": 32,
"mimeType": "image/jpeg",
"height": 32
},
"fd-lrg": {
"file": "https://ww2.kqed.org/app/uploads/sites/35/2016/07/8670911441_374efd4745_k-1-1920x1280.jpg",
"width": 1920,
"mimeType": "image/jpeg",
"height": 1280
},
"fd-med": {
"file": "https://ww2.kqed.org/app/uploads/sites/35/2016/07/8670911441_374efd4745_k-1-1180x786.jpg",
"width": 1180,
"mimeType": "image/jpeg",
"height": 786
},
"detail": {
"file": "https://ww2.kqed.org/app/uploads/sites/35/2016/07/8670911441_374efd4745_k-1-150x150.jpg",
"width": 150,
"mimeType": "image/jpeg",
"height": 150
},
"medium_large": {
"file": "https://ww2.kqed.org/app/uploads/sites/35/2016/07/8670911441_374efd4745_k-1-768x512.jpg",
"width": 768,
"mimeType": "image/jpeg",
"height": 512
},
"guest-author-128": {
"file": "https://ww2.kqed.org/app/uploads/sites/35/2016/07/8670911441_374efd4745_k-1-128x128.jpg",
"width": 128,
"mimeType": "image/jpeg",
"height": 128
}
},
"publishDate": 1468951206,
"modified": 1468951387,
"caption": "Stove Pipe Wells, California.",
"description": null,
"title": "8670911441_374efd4745_k",
"credit": "Thomas Hawk/flickr",
"status": "inherit",
"isLoading": false,
"fetchFailed": false
},
"science_858149": {
"type": "attachments",
"id": "science_858149",
"meta": {
"index": "attachments_1716263798",
"site": "science",
"id": "858149",
"found": true
},
"parent": 858143,
"imgSizes": {
"twentyfourteen-full-width": {
"file": "https://ww2.kqed.org/app/uploads/sites/35/2016/07/atmosphericRiver_NASA-1024x576.jpg",
"width": 1024,
"mimeType": "image/jpeg",
"height": 576
},
"thumbnail": {
"file": "https://ww2.kqed.org/app/uploads/sites/35/2016/07/atmosphericRiver_NASA-e1468865301186-400x235.jpg",
"width": 400,
"mimeType": "image/jpeg",
"height": 235
},
"fd-sm": {
"file": "https://ww2.kqed.org/app/uploads/sites/35/2016/07/atmosphericRiver_NASA-960x540.jpg",
"width": 960,
"mimeType": "image/jpeg",
"height": 540
},
"post-thumbnail": {
"file": "https://ww2.kqed.org/app/uploads/sites/35/2016/07/atmosphericRiver_NASA-e1468865301186-672x372.jpg",
"width": 672,
"mimeType": "image/jpeg",
"height": 372
},
"kqedFullSize": {
"file": "https://ww2.kqed.org/app/uploads/sites/35/2016/07/atmosphericRiver_NASA-e1468865301186.jpg",
"width": 849,
"height": 499
},
"guest-author-50": {
"file": "https://ww2.kqed.org/app/uploads/sites/35/2016/07/atmosphericRiver_NASA-e1468865301186-50x50.jpg",
"width": 50,
"mimeType": "image/jpeg",
"height": 50
},
"guest-author-96": {
"file": "https://ww2.kqed.org/app/uploads/sites/35/2016/07/atmosphericRiver_NASA-e1468865301186-96x96.jpg",
"width": 96,
"mimeType": "image/jpeg",
"height": 96
},
"medium": {
"file": "https://ww2.kqed.org/app/uploads/sites/35/2016/07/atmosphericRiver_NASA-e1468865301186-800x470.jpg",
"width": 800,
"mimeType": "image/jpeg",
"height": 470
},
"guest-author-64": {
"file": "https://ww2.kqed.org/app/uploads/sites/35/2016/07/atmosphericRiver_NASA-e1468865301186-64x64.jpg",
"width": 64,
"mimeType": "image/jpeg",
"height": 64
},
"guest-author-32": {
"file": "https://ww2.kqed.org/app/uploads/sites/35/2016/07/atmosphericRiver_NASA-e1468865301186-32x32.jpg",
"width": 32,
"mimeType": "image/jpeg",
"height": 32
},
"detail": {
"file": "https://ww2.kqed.org/app/uploads/sites/35/2016/07/atmosphericRiver_NASA-e1468865301186-150x150.jpg",
"width": 150,
"mimeType": "image/jpeg",
"height": 150
},
"medium_large": {
"file": "https://ww2.kqed.org/app/uploads/sites/35/2016/07/atmosphericRiver_NASA-e1468865301186-768x451.jpg",
"width": 768,
"mimeType": "image/jpeg",
"height": 451
},
"guest-author-128": {
"file": "https://ww2.kqed.org/app/uploads/sites/35/2016/07/atmosphericRiver_NASA-e1468865301186-128x128.jpg",
"width": 128,
"mimeType": "image/jpeg",
"height": 128
}
},
"publishDate": 1468865248,
"modified": 1468865274,
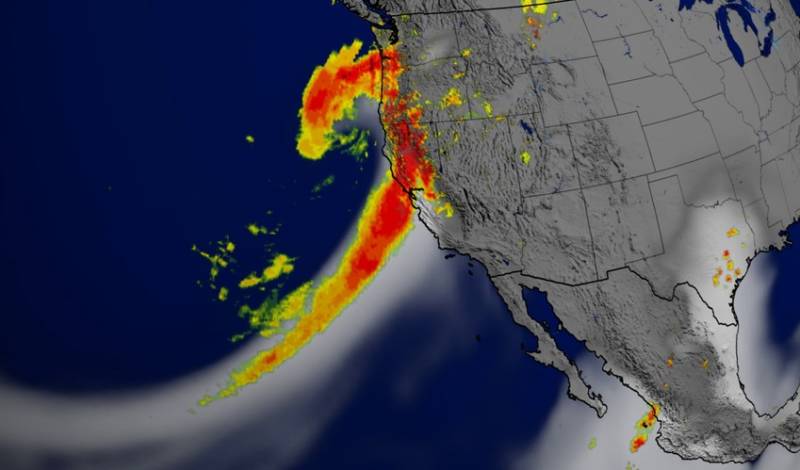
"caption": "This satellite image shows an atmospheric river that reached California in December 2014.",
"description": null,
"title": "atmosphericRiver_NASA",
"credit": "NASA",
"status": "inherit",
"isLoading": false,
"fetchFailed": false
},
"science_851000": {
"type": "attachments",
"id": "science_851000",
"meta": {
"index": "attachments_1716263798",
"site": "science",
"id": "851000",
"found": true
},
"parent": 850997,
"imgSizes": {
"thumbnail": {
"file": "https://ww2.kqed.org/app/uploads/sites/35/2016/07/iceberg-400x300.jpg",
"width": 400,
"mimeType": "image/jpeg",
"height": 300
},
"post-thumbnail": {
"file": "https://ww2.kqed.org/app/uploads/sites/35/2016/07/iceberg-672x372.jpg",
"width": 672,
"mimeType": "image/jpeg",
"height": 372
},
"kqedFullSize": {
"file": "https://ww2.kqed.org/app/uploads/sites/35/2016/07/iceberg.jpg",
"width": 720,
"height": 540
},
"guest-author-50": {
"file": "https://ww2.kqed.org/app/uploads/sites/35/2016/07/iceberg-50x50.jpg",
"width": 50,
"mimeType": "image/jpeg",
"height": 50
},
"guest-author-96": {
"file": "https://ww2.kqed.org/app/uploads/sites/35/2016/07/iceberg-96x96.jpg",
"width": 96,
"mimeType": "image/jpeg",
"height": 96
},
"guest-author-64": {
"file": "https://ww2.kqed.org/app/uploads/sites/35/2016/07/iceberg-64x64.jpg",
"width": 64,
"mimeType": "image/jpeg",
"height": 64
},
"detail": {
"file": "https://ww2.kqed.org/app/uploads/sites/35/2016/07/iceberg-150x150.jpg",
"width": 150,
"mimeType": "image/jpeg",
"height": 150
},
"guest-author-32": {
"file": "https://ww2.kqed.org/app/uploads/sites/35/2016/07/iceberg-32x32.jpg",
"width": 32,
"mimeType": "image/jpeg",
"height": 32
},
"guest-author-128": {
"file": "https://ww2.kqed.org/app/uploads/sites/35/2016/07/iceberg-128x128.jpg",
"width": 128,
"mimeType": "image/jpeg",
"height": 128
}
},
"publishDate": 1468604904,
"modified": 1468604934,
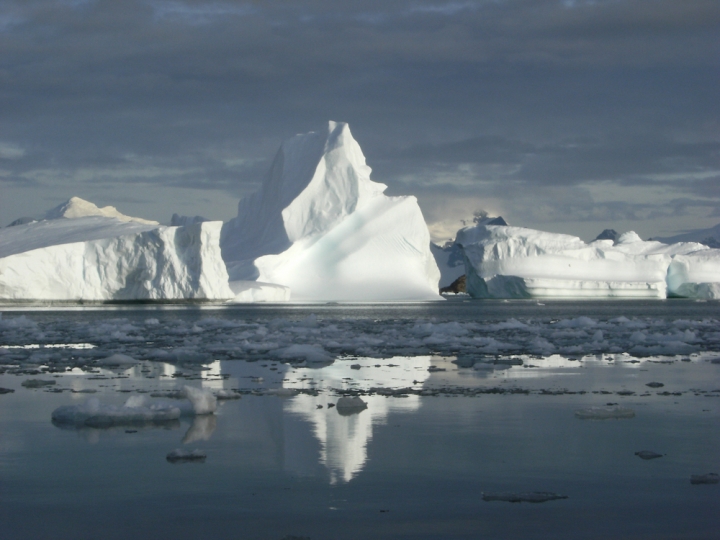
"caption": "Icebergs that have newly calved from glacier fronts in Marguerite Bay on the west coast of the Antarctic Peninsula.",
"description": null,
"title": "iceberg",
"credit": "Alison Cook",
"status": "inherit",
"isLoading": false,
"fetchFailed": false
},
"science_848477": {
"type": "attachments",
"id": "science_848477",
"meta": {
"index": "attachments_1716263798",
"site": "science",
"id": "848477",
"found": true
},
"parent": 848472,
"imgSizes": {
"twentyfourteen-full-width": {
"file": "https://ww2.kqed.org/app/uploads/sites/35/2016/07/RS2765_SolarCrew2054-e1468519415628-1038x576.jpg",
"width": 1038,
"mimeType": "image/jpeg",
"height": 576
},
"thumbnail": {
"file": "https://ww2.kqed.org/app/uploads/sites/35/2016/07/RS2765_SolarCrew2054-e1468519415628-400x267.jpg",
"width": 400,
"mimeType": "image/jpeg",
"height": 267
},
"fd-sm": {
"file": "https://ww2.kqed.org/app/uploads/sites/35/2016/07/RS2765_SolarCrew2054-e1468519415628-960x640.jpg",
"width": 960,
"mimeType": "image/jpeg",
"height": 640
},
"post-thumbnail": {
"file": "https://ww2.kqed.org/app/uploads/sites/35/2016/07/RS2765_SolarCrew2054-e1468519415628-672x372.jpg",
"width": 672,
"mimeType": "image/jpeg",
"height": 372
},
"kqedFullSize": {
"file": "https://ww2.kqed.org/app/uploads/sites/35/2016/07/RS2765_SolarCrew2054-e1468519415628.jpg",
"width": 3871,
"height": 2582
},
"large": {
"file": "https://ww2.kqed.org/app/uploads/sites/35/2016/07/RS2765_SolarCrew2054-e1468519415628-1440x960.jpg",
"width": 1440,
"mimeType": "image/jpeg",
"height": 960
},
"guest-author-50": {
"file": "https://ww2.kqed.org/app/uploads/sites/35/2016/07/RS2765_SolarCrew2054-e1468519415628-50x50.jpg",
"width": 50,
"mimeType": "image/jpeg",
"height": 50
},
"guest-author-96": {
"file": "https://ww2.kqed.org/app/uploads/sites/35/2016/07/RS2765_SolarCrew2054-e1468519415628-96x96.jpg",
"width": 96,
"mimeType": "image/jpeg",
"height": 96
},
"medium": {
"file": "https://ww2.kqed.org/app/uploads/sites/35/2016/07/RS2765_SolarCrew2054-e1468519415628-800x534.jpg",
"width": 800,
"mimeType": "image/jpeg",
"height": 534
},
"guest-author-64": {
"file": "https://ww2.kqed.org/app/uploads/sites/35/2016/07/RS2765_SolarCrew2054-e1468519415628-64x64.jpg",
"width": 64,
"mimeType": "image/jpeg",
"height": 64
},
"guest-author-32": {
"file": "https://ww2.kqed.org/app/uploads/sites/35/2016/07/RS2765_SolarCrew2054-e1468519415628-32x32.jpg",
"width": 32,
"mimeType": "image/jpeg",
"height": 32
},
"fd-lrg": {
"file": "https://ww2.kqed.org/app/uploads/sites/35/2016/07/RS2765_SolarCrew2054-e1468519415628-1920x1281.jpg",
"width": 1920,
"mimeType": "image/jpeg",
"height": 1281
},
"fd-med": {
"file": "https://ww2.kqed.org/app/uploads/sites/35/2016/07/RS2765_SolarCrew2054-e1468519415628-1180x787.jpg",
"width": 1180,
"mimeType": "image/jpeg",
"height": 787
},
"detail": {
"file": "https://ww2.kqed.org/app/uploads/sites/35/2016/07/RS2765_SolarCrew2054-e1468519415628-150x150.jpg",
"width": 150,
"mimeType": "image/jpeg",
"height": 150
},
"medium_large": {
"file": "https://ww2.kqed.org/app/uploads/sites/35/2016/07/RS2765_SolarCrew2054-e1468519415628-768x512.jpg",
"width": 768,
"mimeType": "image/jpeg",
"height": 512
},
"guest-author-128": {
"file": "https://ww2.kqed.org/app/uploads/sites/35/2016/07/RS2765_SolarCrew2054-e1468519415628-128x128.jpg",
"width": 128,
"mimeType": "image/jpeg",
"height": 128
}
},
"publishDate": 1468519357,
"modified": 1468519584,
"caption": "As states develop more wind and solar power, carbon emissions have been falling, according to a new report released Wednesday.",
"description": null,
"title": "RS2765_SolarCrew2054",
"credit": "Craig Miller/KQED",
"status": "inherit",
"isLoading": false,
"fetchFailed": false
},
"science_846071": {
"type": "attachments",
"id": "science_846071",
"meta": {
"index": "attachments_1716263798",
"site": "science",
"id": "846071",
"found": true
},
"parent": 845966,
"imgSizes": {
"twentyfourteen-full-width": {
"file": "https://ww2.kqed.org/app/uploads/sites/35/2016/07/RS1570_heatwavepower120120813-1038x576.jpg",
"width": 1038,
"mimeType": "image/jpeg",
"height": 576
},
"thumbnail": {
"file": "https://ww2.kqed.org/app/uploads/sites/35/2016/07/RS1570_heatwavepower120120813-400x269.jpg",
"width": 400,
"mimeType": "image/jpeg",
"height": 269
},
"fd-sm": {
"file": "https://ww2.kqed.org/app/uploads/sites/35/2016/07/RS1570_heatwavepower120120813-960x645.jpg",
"width": 960,
"mimeType": "image/jpeg",
"height": 645
},
"post-thumbnail": {
"file": "https://ww2.kqed.org/app/uploads/sites/35/2016/07/RS1570_heatwavepower120120813-672x372.jpg",
"width": 672,
"mimeType": "image/jpeg",
"height": 372
},
"kqedFullSize": {
"file": "https://ww2.kqed.org/app/uploads/sites/35/2016/07/RS1570_heatwavepower120120813.jpg",
"width": 2100,
"height": 1411
},
"large": {
"file": "https://ww2.kqed.org/app/uploads/sites/35/2016/07/RS1570_heatwavepower120120813-1440x968.jpg",
"width": 1440,
"mimeType": "image/jpeg",
"height": 968
},
"guest-author-50": {
"file": "https://ww2.kqed.org/app/uploads/sites/35/2016/07/RS1570_heatwavepower120120813-50x50.jpg",
"width": 50,
"mimeType": "image/jpeg",
"height": 50
},
"guest-author-96": {
"file": "https://ww2.kqed.org/app/uploads/sites/35/2016/07/RS1570_heatwavepower120120813-96x96.jpg",
"width": 96,
"mimeType": "image/jpeg",
"height": 96
},
"medium": {
"file": "https://ww2.kqed.org/app/uploads/sites/35/2016/07/RS1570_heatwavepower120120813-800x538.jpg",
"width": 800,
"mimeType": "image/jpeg",
"height": 538
},
"guest-author-64": {
"file": "https://ww2.kqed.org/app/uploads/sites/35/2016/07/RS1570_heatwavepower120120813-64x64.jpg",
"width": 64,
"mimeType": "image/jpeg",
"height": 64
},
"guest-author-32": {
"file": "https://ww2.kqed.org/app/uploads/sites/35/2016/07/RS1570_heatwavepower120120813-32x32.jpg",
"width": 32,
"mimeType": "image/jpeg",
"height": 32
},
"fd-lrg": {
"file": "https://ww2.kqed.org/app/uploads/sites/35/2016/07/RS1570_heatwavepower120120813-1920x1290.jpg",
"width": 1920,
"mimeType": "image/jpeg",
"height": 1290
},
"fd-med": {
"file": "https://ww2.kqed.org/app/uploads/sites/35/2016/07/RS1570_heatwavepower120120813-1180x793.jpg",
"width": 1180,
"mimeType": "image/jpeg",
"height": 793
},
"detail": {
"file": "https://ww2.kqed.org/app/uploads/sites/35/2016/07/RS1570_heatwavepower120120813-150x150.jpg",
"width": 150,
"mimeType": "image/jpeg",
"height": 150
},
"medium_large": {
"file": "https://ww2.kqed.org/app/uploads/sites/35/2016/07/RS1570_heatwavepower120120813-768x516.jpg",
"width": 768,
"mimeType": "image/jpeg",
"height": 516
},
"guest-author-128": {
"file": "https://ww2.kqed.org/app/uploads/sites/35/2016/07/RS1570_heatwavepower120120813-128x128.jpg",
"width": 128,
"mimeType": "image/jpeg",
"height": 128
}
},
"publishDate": 1468430364,
"modified": 1468430446,
"caption": "The hot noonday sun shines through power lines in Redondo Beach, California. ",
"description": null,
"title": "The hot noonday sun shines through power lines as",
"credit": "Gerard Burkhart/AFP/Getty Images",
"status": "inherit",
"isLoading": false,
"fetchFailed": false
},
"science_841350": {
"type": "attachments",
"id": "science_841350",
"meta": {
"index": "attachments_1716263798",
"site": "science",
"id": "841350",
"found": true
},
"parent": 841345,
"imgSizes": {
"twentyfourteen-full-width": {
"file": "https://ww2.kqed.org/app/uploads/sites/35/2016/07/RS14681_04-01-15-Snow_Survey_2-1-1038x576.jpg",
"width": 1038,
"mimeType": "image/jpeg",
"height": 576
},
"thumbnail": {
"file": "https://ww2.kqed.org/app/uploads/sites/35/2016/07/RS14681_04-01-15-Snow_Survey_2-1-400x267.jpg",
"width": 400,
"mimeType": "image/jpeg",
"height": 267
},
"fd-sm": {
"file": "https://ww2.kqed.org/app/uploads/sites/35/2016/07/RS14681_04-01-15-Snow_Survey_2-1-960x641.jpg",
"width": 960,
"mimeType": "image/jpeg",
"height": 641
},
"post-thumbnail": {
"file": "https://ww2.kqed.org/app/uploads/sites/35/2016/07/RS14681_04-01-15-Snow_Survey_2-1-672x372.jpg",
"width": 672,
"mimeType": "image/jpeg",
"height": 372
},
"kqedFullSize": {
"file": "https://ww2.kqed.org/app/uploads/sites/35/2016/07/RS14681_04-01-15-Snow_Survey_2-1.jpg",
"width": 1440,
"height": 961
},
"large": {
"file": "https://ww2.kqed.org/app/uploads/sites/35/2016/07/RS14681_04-01-15-Snow_Survey_2-1-1440x961.jpg",
"width": 1440,
"mimeType": "image/jpeg",
"height": 961
},
"guest-author-50": {
"file": "https://ww2.kqed.org/app/uploads/sites/35/2016/07/RS14681_04-01-15-Snow_Survey_2-1-50x50.jpg",
"width": 50,
"mimeType": "image/jpeg",
"height": 50
},
"guest-author-96": {
"file": "https://ww2.kqed.org/app/uploads/sites/35/2016/07/RS14681_04-01-15-Snow_Survey_2-1-96x96.jpg",
"width": 96,
"mimeType": "image/jpeg",
"height": 96
},
"medium": {
"file": "https://ww2.kqed.org/app/uploads/sites/35/2016/07/RS14681_04-01-15-Snow_Survey_2-1-800x534.jpg",
"width": 800,
"mimeType": "image/jpeg",
"height": 534
},
"guest-author-64": {
"file": "https://ww2.kqed.org/app/uploads/sites/35/2016/07/RS14681_04-01-15-Snow_Survey_2-1-64x64.jpg",
"width": 64,
"mimeType": "image/jpeg",
"height": 64
},
"guest-author-32": {
"file": "https://ww2.kqed.org/app/uploads/sites/35/2016/07/RS14681_04-01-15-Snow_Survey_2-1-32x32.jpg",
"width": 32,
"mimeType": "image/jpeg",
"height": 32
},
"fd-med": {
"file": "https://ww2.kqed.org/app/uploads/sites/35/2016/07/RS14681_04-01-15-Snow_Survey_2-1-1180x787.jpg",
"width": 1180,
"mimeType": "image/jpeg",
"height": 787
},
"detail": {
"file": "https://ww2.kqed.org/app/uploads/sites/35/2016/07/RS14681_04-01-15-Snow_Survey_2-1-150x150.jpg",
"width": 150,
"mimeType": "image/jpeg",
"height": 150
},
"medium_large": {
"file": "https://ww2.kqed.org/app/uploads/sites/35/2016/07/RS14681_04-01-15-Snow_Survey_2-1-768x513.jpg",
"width": 768,
"mimeType": "image/jpeg",
"height": 513
},
"guest-author-128": {
"file": "https://ww2.kqed.org/app/uploads/sites/35/2016/07/RS14681_04-01-15-Snow_Survey_2-1-128x128.jpg",
"width": 128,
"mimeType": "image/jpeg",
"height": 128
}
},
"publishDate": 1468267044,
"modified": 1468267271,
"caption": "Gov. Jerry Brown speaking at a snow survey in 2015, when the California Department of Water Resources \nobserved below-normal precipitation during unusually warm weather.",
"description": null,
"title": "RS14681_04-01-15-Snow_Survey_2 (1)",
"credit": "Florence Low/California Dept. of Water Resources",
"status": "inherit",
"isLoading": false,
"fetchFailed": false
},
"science_841021": {
"type": "attachments",
"id": "science_841021",
"meta": {
"index": "attachments_1716263798",
"site": "science",
"id": "841021",
"found": true
},
"parent": 841018,
"imgSizes": {
"thumbnail": {
"file": "https://ww2.kqed.org/app/uploads/sites/35/2016/07/ocean_CC-400x225.jpg",
"width": 400,
"mimeType": "image/jpeg",
"height": 225
},
"post-thumbnail": {
"file": "https://ww2.kqed.org/app/uploads/sites/35/2016/07/ocean_CC-672x372.jpg",
"width": 672,
"mimeType": "image/jpeg",
"height": 372
},
"kqedFullSize": {
"file": "https://ww2.kqed.org/app/uploads/sites/35/2016/07/ocean_CC.jpg",
"width": 720,
"height": 405
},
"guest-author-50": {
"file": "https://ww2.kqed.org/app/uploads/sites/35/2016/07/ocean_CC-50x50.jpg",
"width": 50,
"mimeType": "image/jpeg",
"height": 50
},
"guest-author-96": {
"file": "https://ww2.kqed.org/app/uploads/sites/35/2016/07/ocean_CC-96x96.jpg",
"width": 96,
"mimeType": "image/jpeg",
"height": 96
},
"guest-author-64": {
"file": "https://ww2.kqed.org/app/uploads/sites/35/2016/07/ocean_CC-64x64.jpg",
"width": 64,
"mimeType": "image/jpeg",
"height": 64
},
"detail": {
"file": "https://ww2.kqed.org/app/uploads/sites/35/2016/07/ocean_CC-150x150.jpg",
"width": 150,
"mimeType": "image/jpeg",
"height": 150
},
"guest-author-32": {
"file": "https://ww2.kqed.org/app/uploads/sites/35/2016/07/ocean_CC-32x32.jpg",
"width": 32,
"mimeType": "image/jpeg",
"height": 32
},
"guest-author-128": {
"file": "https://ww2.kqed.org/app/uploads/sites/35/2016/07/ocean_CC-128x128.jpg",
"width": 128,
"mimeType": "image/jpeg",
"height": 128
}
},
"publishDate": 1468255850,
"modified": 1468255886,
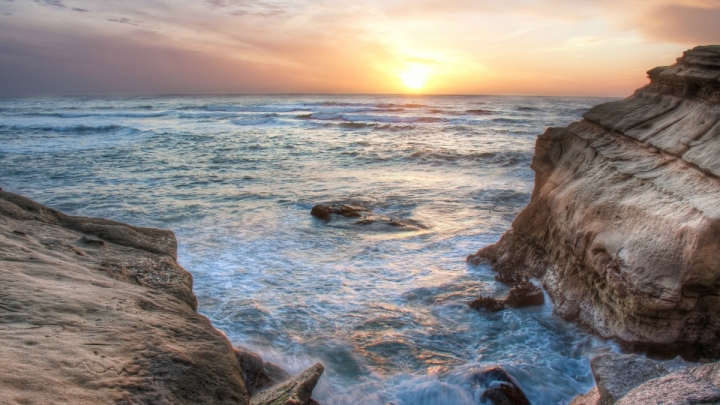
"caption": "A southern Californian coastline.\n",
"description": null,
"title": "ocean_CC",
"credit": "Chad McDonald/Flickr",
"status": "inherit",
"isLoading": false,
"fetchFailed": false
},
"science_841009": {
"type": "attachments",
"id": "science_841009",
"meta": {
"index": "attachments_1716263798",
"site": "science",
"id": "841009",
"found": true
},
"parent": 841008,
"imgSizes": {
"twentyfourteen-full-width": {
"file": "https://ww2.kqed.org/app/uploads/sites/35/2016/07/clouds_enl-b6713f46b01e7ee19ef39787e6d605398c536545-1038x576.jpg",
"width": 1038,
"mimeType": "image/jpeg",
"height": 576
},
"thumbnail": {
"file": "https://ww2.kqed.org/app/uploads/sites/35/2016/07/clouds_enl-b6713f46b01e7ee19ef39787e6d605398c536545-400x266.jpg",
"width": 400,
"mimeType": "image/jpeg",
"height": 266
},
"fd-sm": {
"file": "https://ww2.kqed.org/app/uploads/sites/35/2016/07/clouds_enl-b6713f46b01e7ee19ef39787e6d605398c536545-960x639.jpg",
"width": 960,
"mimeType": "image/jpeg",
"height": 639
},
"post-thumbnail": {
"file": "https://ww2.kqed.org/app/uploads/sites/35/2016/07/clouds_enl-b6713f46b01e7ee19ef39787e6d605398c536545-672x372.jpg",
"width": 672,
"mimeType": "image/jpeg",
"height": 372
},
"kqedFullSize": {
"file": "https://ww2.kqed.org/app/uploads/sites/35/2016/07/clouds_enl-b6713f46b01e7ee19ef39787e6d605398c536545.jpg",
"width": 1800,
"height": 1198
},
"large": {
"file": "https://ww2.kqed.org/app/uploads/sites/35/2016/07/clouds_enl-b6713f46b01e7ee19ef39787e6d605398c536545-1440x958.jpg",
"width": 1440,
"mimeType": "image/jpeg",
"height": 958
},
"guest-author-50": {
"file": "https://ww2.kqed.org/app/uploads/sites/35/2016/07/clouds_enl-b6713f46b01e7ee19ef39787e6d605398c536545-50x50.jpg",
"width": 50,
"mimeType": "image/jpeg",
"height": 50
},
"guest-author-96": {
"file": "https://ww2.kqed.org/app/uploads/sites/35/2016/07/clouds_enl-b6713f46b01e7ee19ef39787e6d605398c536545-96x96.jpg",
"width": 96,
"mimeType": "image/jpeg",
"height": 96
},
"medium": {
"file": "https://ww2.kqed.org/app/uploads/sites/35/2016/07/clouds_enl-b6713f46b01e7ee19ef39787e6d605398c536545-800x532.jpg",
"width": 800,
"mimeType": "image/jpeg",
"height": 532
},
"guest-author-64": {
"file": "https://ww2.kqed.org/app/uploads/sites/35/2016/07/clouds_enl-b6713f46b01e7ee19ef39787e6d605398c536545-64x64.jpg",
"width": 64,
"mimeType": "image/jpeg",
"height": 64
},
"guest-author-32": {
"file": "https://ww2.kqed.org/app/uploads/sites/35/2016/07/clouds_enl-b6713f46b01e7ee19ef39787e6d605398c536545-32x32.jpg",
"width": 32,
"mimeType": "image/jpeg",
"height": 32
},
"fd-med": {
"file": "https://ww2.kqed.org/app/uploads/sites/35/2016/07/clouds_enl-b6713f46b01e7ee19ef39787e6d605398c536545-1180x785.jpg",
"width": 1180,
"mimeType": "image/jpeg",
"height": 785
},
"detail": {
"file": "https://ww2.kqed.org/app/uploads/sites/35/2016/07/clouds_enl-b6713f46b01e7ee19ef39787e6d605398c536545-150x150.jpg",
"width": 150,
"mimeType": "image/jpeg",
"height": 150
},
"medium_large": {
"file": "https://ww2.kqed.org/app/uploads/sites/35/2016/07/clouds_enl-b6713f46b01e7ee19ef39787e6d605398c536545-768x511.jpg",
"width": 768,
"mimeType": "image/jpeg",
"height": 511
},
"guest-author-128": {
"file": "https://ww2.kqed.org/app/uploads/sites/35/2016/07/clouds_enl-b6713f46b01e7ee19ef39787e6d605398c536545-128x128.jpg",
"width": 128,
"mimeType": "image/jpeg",
"height": 128
}
},
"publishDate": 1468254051,
"modified": 1468254182,
"caption": "About 70 percent of Earth is covered by clouds at any given moment. Their interaction with climate isn't easy to study, scientists say; these shape-shifters move quickly.",
"description": null,
"title": "About 70 percent of Earth is covered by clouds at any given moment. Their interaction with climate isn't easy to study, scientists say; these shape-shifters move quickly.",
"credit": "NOAA/Flickr",
"status": "inherit",
"isLoading": false,
"fetchFailed": false
}
},
"audioPlayerReducer": {
"postId": "stream_live",
"isPaused": true,
"isPlaying": false,
"pfsActive": false,
"pledgeModalIsOpen": true,
"playerDrawerIsOpen": false,
"liveAudioPlayStartedAt": 0,
"liveAudioPlayContext": ""
},
"authorsReducer": {
"byline_science_884418": {
"type": "authors",
"id": "byline_science_884418",
"meta": {
"override": true
},
"slug": "byline_science_884418",
"name": "Bobby Magill\u003c/br>Climate Central",
"isLoading": false
},
"byline_science_863270": {
"type": "authors",
"id": "byline_science_863270",
"meta": {
"override": true
},
"slug": "byline_science_863270",
"name": "Scott Smith/AP",
"isLoading": false
},
"byline_science_860496": {
"type": "authors",
"id": "byline_science_860496",
"meta": {
"override": true
},
"slug": "byline_science_860496",
"name": "Andrea Thompson\u003c/br>Climate Central",
"isLoading": false
},
"byline_science_858143": {
"type": "authors",
"id": "byline_science_858143",
"meta": {
"override": true
},
"slug": "byline_science_858143",
"name": "Matt Weiser\u003c/br>Water Deeply",
"isLoading": false
},
"byline_science_850997": {
"type": "authors",
"id": "byline_science_850997",
"meta": {
"override": true
},
"slug": "byline_science_850997",
"name": "Andrea Thompson\u003c/br>Climate Central",
"isLoading": false
},
"byline_science_848472": {
"type": "authors",
"id": "byline_science_848472",
"meta": {
"override": true
},
"slug": "byline_science_848472",
"name": "Bobby Magaill\u003c/br>Climate Central",
"isLoading": false
},
"byline_science_845966": {
"type": "authors",
"id": "byline_science_845966",
"meta": {
"override": true
},
"slug": "byline_science_845966",
"name": "Climate Central",
"isLoading": false
},
"byline_science_841345": {
"type": "authors",
"id": "byline_science_841345",
"meta": {
"override": true
},
"slug": "byline_science_841345",
"name": "Ellen Knickmeyer\u003c/br>Associated Press",
"isLoading": false
},
"byline_science_841018": {
"type": "authors",
"id": "byline_science_841018",
"meta": {
"override": true
},
"slug": "byline_science_841018",
"name": "John Upton\u003c/br>Climate Central",
"isLoading": false
},
"byline_science_841008": {
"type": "authors",
"id": "byline_science_841008",
"meta": {
"override": true
},
"slug": "byline_science_841008",
"name": "Nell Greenfieldboyce\u003c/br>NPR",
"isLoading": false
},
"cmiller": {
"type": "authors",
"id": "221",
"meta": {
"index": "authors_1716337520",
"id": "221",
"found": true
},
"name": "Craig Miller",
"firstName": "Craig",
"lastName": "Miller",
"slug": "cmiller",
"email": "craig@voxterra.net",
"display_author_email": false,
"staff_mastheads": [
"science"
],
"title": "Editor Emeritus, Science",
"bio": "Craig is a former KQED Science editor, specializing in weather, climate, water & energy issues, with a little seismology thrown in just to shake things up. Prior to that, he launched and led the station's award-winning multimedia project, Climate Watch. Craig is also an accomplished writer/producer of television documentaries, with a focus on natural resource issues.",
"avatar": "https://secure.gravatar.com/avatar/b91661df645e001a9cafe0861fa685f9?s=600&d=blank&r=g",
"twitter": "voxterra",
"facebook": null,
"instagram": null,
"linkedin": null,
"sites": [
{
"site": "news",
"roles": [
"author"
]
},
{
"site": "futureofyou",
"roles": [
"editor"
]
},
{
"site": "stateofhealth",
"roles": [
"author"
]
},
{
"site": "science",
"roles": [
"editor"
]
},
{
"site": "quest",
"roles": [
"editor"
]
}
],
"headData": {
"title": "Craig Miller | KQED",
"description": "Editor Emeritus, Science",
"ogImgSrc": "https://secure.gravatar.com/avatar/b91661df645e001a9cafe0861fa685f9?s=600&d=blank&r=g",
"twImgSrc": "https://secure.gravatar.com/avatar/b91661df645e001a9cafe0861fa685f9?s=600&d=blank&r=g"
},
"isLoading": false,
"link": "/author/cmiller"
}
},
"pagesReducer": {
"science_category_climate": {
"type": "terms",
"id": "science_31",
"meta": {
"index": "terms_1716263798",
"site": "science",
"id": "31",
"score": 11.06203
},
"featImg": null,
"name": "Climate",
"description": null,
"taxonomy": "category",
"headData": {
"twImgId": null,
"twTitle": null,
"ogTitle": null,
"ogImgId": null,
"twDescription": null,
"description": null,
"title": "Climate Archives | KQED Science",
"ogDescription": null
},
"ttid": 33,
"slug": "climate",
"isLoading": false,
"title": "Climate",
"pageMeta": {
"site": "science",
"WpPageTemplate": "page-topic-editorial",
"currentPage": 98
},
"blocks": [
{
"blockName": "kqed/post-list",
"attrs": {
"layout": "cardArticle2",
"query": "posts/science?category=climate",
"seeMore": false,
"paginated": true,
"page": 98
}
},
{
"blockName": "kqed/ad"
}
]
}
},
"pfsSessionReducer": {},
"postsReducer": {
"stream_live": {
"type": "live",
"id": "stream_live",
"audioUrl": "https://streams.kqed.org/kqedradio",
"title": "Live Stream",
"excerpt": "Live Stream information currently unavailable.",
"link": "/radio",
"featImg": "",
"label": {
"name": "KQED Live",
"link": "/"
}
},
"stream_kqedNewscast": {
"type": "posts",
"id": "stream_kqedNewscast",
"audioUrl": "https://www.kqed.org/.stream/anon/radio/RDnews/newscast.mp3?_=1",
"title": "KQED Newscast",
"featImg": "",
"label": {
"name": "88.5 FM",
"link": "/"
}
},
"science_846701": {
"type": "posts",
"id": "science_846701",
"meta": {
"index": "posts_1716263798",
"site": "science",
"id": "846701",
"score": null,
"sort": [
1470162694000
]
},
"parent": 0,
"labelTerm": {
"site": "science",
"term": 1151
},
"blocks": [],
"publishDate": 1470162694,
"format": "standard",
"title": "Water Conservation Wanes in California as Most Mandatory Restrictions End",
"headTitle": "Water Conservation Wanes in California as Most Mandatory Restrictions End | KQED",
"content": "\u003cp>It appears that California water suppliers have by and large abandoned mandatory water conservation — and it may be showing up in the latest monthly statistics on water saving in the state.\u003c/p>\n\u003cp>According to the State Water Resources Control Board, urban customers reduced water use by 21.5 percent in June, compared to the benchmark year of 2013. That’s down from 27.5 percent savings a year ago, when statewide mandatory controls were in place. Savings were down even more compared to May of this year.\u003c/p>\n\u003cp>After months of state-imposed compulsory conservation levels, local water agencies are now setting their own marks — and setting the bar extremely low. While state regulators continue to review the numbers reported to them by local agencies, KQED has surveyed major water suppliers in the Bay Area and Sacramento region and most of them have set their compulsory savings targets at (drum roll, please)…zero.\u003c/p>\n\u003ch2>California Water Agencies’ New Conservation Standards\u003c/h2>\n\u003cp>\u003cb> After state-imposed quotas expired in May, local agencies have come up with their own numbers: overwhelmingly zero. (Largest Bay Area suppliers shown.)\u003c/b>\u003c/p>\n\u003cdiv class=\"sharedaddy show-for-medium-up\">\u003cimg loading=\"lazy\" decoding=\"async\" src=\"http://ww2.kqed.org/science/wp-content/uploads/sites/35/2016/08/Water_numbers_desktop.png\" alt=\"Water_numbers_desktop\" width=\"1730\" height=\"1780\" class=\"aligncenter size-full wp-image-895956\" srcset=\"https://cdn.kqed.org/wp-content/uploads/sites/35/2016/08/Water_numbers_desktop.png 1730w, https://cdn.kqed.org/wp-content/uploads/sites/35/2016/08/Water_numbers_desktop-400x412.png 400w, https://cdn.kqed.org/wp-content/uploads/sites/35/2016/08/Water_numbers_desktop-800x823.png 800w, https://cdn.kqed.org/wp-content/uploads/sites/35/2016/08/Water_numbers_desktop-768x790.png 768w, https://cdn.kqed.org/wp-content/uploads/sites/35/2016/08/Water_numbers_desktop-1440x1482.png 1440w, https://cdn.kqed.org/wp-content/uploads/sites/35/2016/08/Water_numbers_desktop-1180x1214.png 1180w, https://cdn.kqed.org/wp-content/uploads/sites/35/2016/08/Water_numbers_desktop-960x988.png 960w, https://cdn.kqed.org/wp-content/uploads/sites/35/2016/08/Water_numbers_desktop-32x32.png 32w, https://cdn.kqed.org/wp-content/uploads/sites/35/2016/08/Water_numbers_desktop-50x50.png 50w\" sizes=\"(max-width: 1730px) 100vw, 1730px\">\u003c/div>\n\u003cdiv class=\"show-for-small-only\">\u003cimg loading=\"lazy\" decoding=\"async\" src=\"http://ww2.kqed.org/science/wp-content/uploads/sites/35/2016/08/Water_numbers_mobile.png\" alt=\"Water_numbers_mobile\" width=\"750\" height=\"1334\" class=\"aligncenter size-full wp-image-895958\" srcset=\"https://cdn.kqed.org/wp-content/uploads/sites/35/2016/08/Water_numbers_mobile.png 750w, https://cdn.kqed.org/wp-content/uploads/sites/35/2016/08/Water_numbers_mobile-400x711.png 400w\" sizes=\"(max-width: 750px) 100vw, 750px\">\u003c/div>\n\u003cp> \u003c/p>\n\u003cp>[ad fullwidth]\u003c/p>\n\u003cp>\u003cstrong>‘Round’ Numbers\u003c/strong>\u003c/p>\n\u003cp>Northern California’s largest urban supplier, the East Bay Municipal Utility District, had been required to cut water use 16 percent compared to the benchmark year of 2013. Its new self-determined target: zero. The Contra Costa Water District likewise moved its goal posts from 25 percent to zero. The same goes for the City of Sacramento. The Marin Municipal Water District ratcheted back from 20 to zero, Alameda County from 16 to zero, and well, you get the idea.\u003c/p>\n\u003cp>Even in Southern California, where severe drought conditions persist, the story is largely the same. The state’s biggest retailer of urban water, the Los Angeles Dept. of Water and Power had been operating under a 14 percent conservation order. Its new tier: zero.\u003c/p>\n\u003cp>So far, state regulators have stopped short of saying publicly that this isn’t what they had in mind when they decided to stop assigning water savings “tiers” and allow local officials to come up with their own numbers — especially since state water managers continue to emphasize that the drought is not over, and may well worsen in the months to come.\u003c/p>\n\u003cp>“Some relaxation of conservation in light of the relief we got last winter and other supply conditions is appropriate and expected,” said water board chair Felicia Marcus in a statement. “Abandonment of conservation is not.”\u003c/p>\n\u003cp>\u003cstrong>Pushback From Locals\u003c/strong>\u003c/p>\n\u003cp>Water managers have long argued that they are in a better position than Sacramento to know the level of water cutbacks that local conditions demand. And state regulators largely agree, which is why they’ve handed control back to the locals.\u003c/p>\n\u003cp>The State Water Board prescribed the formula used to calculate the local quotas. Agencies were to assume that the next three years resembled the last three in terms of drought and water demand. Any shortage (in percentage terms) at the end of those three imaginary years was to become the new local conservation mark. Water Board officials have taken pains to point out that they will closely monitor the new system and that if it does not work to their satisfaction, they are prepared to return to a system of state-assigned quotas.\u003c/p>\n\u003cp>Many local water managers say they remain committed to conservation with voluntary measures. Jennifer Burke, deputy director of water and engineering resources with the City of Santa Rosa, tells KQED that the city is “committed to water conservation and will continue to offer our many programs, tips and tools as well as continuing to implement water waste prohibitions,” an apparent reference to the handful of water restrictions made permanent by the governor earlier this year. But Santa Rosa has also reset its compulsory conservation mark to zero.\u003c/p>\n\u003cp>The state-imposed “tiers,” as they were called, never went down well with local water suppliers, as selling less water meant a direct hit to their revenues. It’s estimated that over the past year, local water agencies collectively \u003ca href=\"http://www.sacbee.com/news/state/california/water-and-drought/article89747342.html\">lost hundreds of millions\u003c/a> of dollars under the state-imposed cutbacks.\u003c/p>\n\u003cp>\u003c/p>\n\u003cp>Those suppliers might have to rethink their revenue models given the \u003ca href=\"http://www.ppic.org/main/publication_show.asp?i=1108\">long-term trends\u003c/a>. A recent analysis by the nonpartisan Public Policy Institute of California shows that overall water use is declining even as the state’s population grows.\u003c/p>\n\n",
"stats": {
"hasVideo": false,
"hasChartOrMap": false,
"hasAudio": false,
"hasPolis": false,
"wordCount": 747,
"hasGoogleForm": false,
"hasGallery": false,
"hasHearkenModule": false,
"iframeSrcs": [],
"paragraphCount": 17
},
"modified": 1704929827,
"excerpt": "Now that local water agencies are setting their own conservation quotas, the results are underwhelming.",
"headData": {
"twImgId": "",
"twTitle": "",
"ogTitle": "",
"ogImgId": "",
"twDescription": "",
"description": "Now that local water agencies are setting their own conservation quotas, the results are underwhelming.",
"title": "Water Conservation Wanes in California as Most Mandatory Restrictions End | KQED",
"ogDescription": "",
"schema": {
"@context": "https://schema.org",
"@type": "Article",
"headline": "Water Conservation Wanes in California as Most Mandatory Restrictions End",
"datePublished": "2016-08-02T11:31:34-07:00",
"dateModified": "2024-01-10T15:37:07-08:00",
"image": "https://cdn.kqed.org/wp-content/uploads/2020/02/KQED-OG-Image@1x.png"
}
},
"guestAuthors": [],
"slug": "water-conservation-wanes-in-california-as-most-mandatory-restrictions-end",
"status": "publish",
"sticky": false,
"path": "/science/846701/water-conservation-wanes-in-california-as-most-mandatory-restrictions-end",
"audioTrackLength": null,
"parsedContent": [
{
"type": "contentString",
"content": "\u003cdiv class=\"post-body\">\u003cp>\u003cp>It appears that California water suppliers have by and large abandoned mandatory water conservation — and it may be showing up in the latest monthly statistics on water saving in the state.\u003c/p>\n\u003cp>According to the State Water Resources Control Board, urban customers reduced water use by 21.5 percent in June, compared to the benchmark year of 2013. That’s down from 27.5 percent savings a year ago, when statewide mandatory controls were in place. Savings were down even more compared to May of this year.\u003c/p>\n\u003cp>After months of state-imposed compulsory conservation levels, local water agencies are now setting their own marks — and setting the bar extremely low. While state regulators continue to review the numbers reported to them by local agencies, KQED has surveyed major water suppliers in the Bay Area and Sacramento region and most of them have set their compulsory savings targets at (drum roll, please)…zero.\u003c/p>\n\u003ch2>California Water Agencies’ New Conservation Standards\u003c/h2>\n\u003cp>\u003cb> After state-imposed quotas expired in May, local agencies have come up with their own numbers: overwhelmingly zero. (Largest Bay Area suppliers shown.)\u003c/b>\u003c/p>\n\u003cdiv class=\"sharedaddy show-for-medium-up\">\u003cimg loading=\"lazy\" decoding=\"async\" src=\"http://ww2.kqed.org/science/wp-content/uploads/sites/35/2016/08/Water_numbers_desktop.png\" alt=\"Water_numbers_desktop\" width=\"1730\" height=\"1780\" class=\"aligncenter size-full wp-image-895956\" srcset=\"https://cdn.kqed.org/wp-content/uploads/sites/35/2016/08/Water_numbers_desktop.png 1730w, https://cdn.kqed.org/wp-content/uploads/sites/35/2016/08/Water_numbers_desktop-400x412.png 400w, https://cdn.kqed.org/wp-content/uploads/sites/35/2016/08/Water_numbers_desktop-800x823.png 800w, https://cdn.kqed.org/wp-content/uploads/sites/35/2016/08/Water_numbers_desktop-768x790.png 768w, https://cdn.kqed.org/wp-content/uploads/sites/35/2016/08/Water_numbers_desktop-1440x1482.png 1440w, https://cdn.kqed.org/wp-content/uploads/sites/35/2016/08/Water_numbers_desktop-1180x1214.png 1180w, https://cdn.kqed.org/wp-content/uploads/sites/35/2016/08/Water_numbers_desktop-960x988.png 960w, https://cdn.kqed.org/wp-content/uploads/sites/35/2016/08/Water_numbers_desktop-32x32.png 32w, https://cdn.kqed.org/wp-content/uploads/sites/35/2016/08/Water_numbers_desktop-50x50.png 50w\" sizes=\"(max-width: 1730px) 100vw, 1730px\">\u003c/div>\n\u003cdiv class=\"show-for-small-only\">\u003cimg loading=\"lazy\" decoding=\"async\" src=\"http://ww2.kqed.org/science/wp-content/uploads/sites/35/2016/08/Water_numbers_mobile.png\" alt=\"Water_numbers_mobile\" width=\"750\" height=\"1334\" class=\"aligncenter size-full wp-image-895958\" srcset=\"https://cdn.kqed.org/wp-content/uploads/sites/35/2016/08/Water_numbers_mobile.png 750w, https://cdn.kqed.org/wp-content/uploads/sites/35/2016/08/Water_numbers_mobile-400x711.png 400w\" sizes=\"(max-width: 750px) 100vw, 750px\">\u003c/div>\n\u003cp> \u003c/p>\n\u003cp>\u003c/p>\u003c/div>",
"attributes": {
"named": {},
"numeric": []
}
},
{
"type": "component",
"content": "",
"name": "ad",
"attributes": {
"named": {
"label": "fullwidth"
},
"numeric": [
"fullwidth"
]
}
},
{
"type": "contentString",
"content": "\u003cdiv class=\"post-body\">\u003cp>\u003c/p>\n\u003cp>\u003cstrong>‘Round’ Numbers\u003c/strong>\u003c/p>\n\u003cp>Northern California’s largest urban supplier, the East Bay Municipal Utility District, had been required to cut water use 16 percent compared to the benchmark year of 2013. Its new self-determined target: zero. The Contra Costa Water District likewise moved its goal posts from 25 percent to zero. The same goes for the City of Sacramento. The Marin Municipal Water District ratcheted back from 20 to zero, Alameda County from 16 to zero, and well, you get the idea.\u003c/p>\n\u003cp>Even in Southern California, where severe drought conditions persist, the story is largely the same. The state’s biggest retailer of urban water, the Los Angeles Dept. of Water and Power had been operating under a 14 percent conservation order. Its new tier: zero.\u003c/p>\n\u003cp>So far, state regulators have stopped short of saying publicly that this isn’t what they had in mind when they decided to stop assigning water savings “tiers” and allow local officials to come up with their own numbers — especially since state water managers continue to emphasize that the drought is not over, and may well worsen in the months to come.\u003c/p>\n\u003cp>“Some relaxation of conservation in light of the relief we got last winter and other supply conditions is appropriate and expected,” said water board chair Felicia Marcus in a statement. “Abandonment of conservation is not.”\u003c/p>\n\u003cp>\u003cstrong>Pushback From Locals\u003c/strong>\u003c/p>\n\u003cp>Water managers have long argued that they are in a better position than Sacramento to know the level of water cutbacks that local conditions demand. And state regulators largely agree, which is why they’ve handed control back to the locals.\u003c/p>\n\u003cp>The State Water Board prescribed the formula used to calculate the local quotas. Agencies were to assume that the next three years resembled the last three in terms of drought and water demand. Any shortage (in percentage terms) at the end of those three imaginary years was to become the new local conservation mark. Water Board officials have taken pains to point out that they will closely monitor the new system and that if it does not work to their satisfaction, they are prepared to return to a system of state-assigned quotas.\u003c/p>\n\u003cp>Many local water managers say they remain committed to conservation with voluntary measures. Jennifer Burke, deputy director of water and engineering resources with the City of Santa Rosa, tells KQED that the city is “committed to water conservation and will continue to offer our many programs, tips and tools as well as continuing to implement water waste prohibitions,” an apparent reference to the handful of water restrictions made permanent by the governor earlier this year. But Santa Rosa has also reset its compulsory conservation mark to zero.\u003c/p>\n\u003cp>The state-imposed “tiers,” as they were called, never went down well with local water suppliers, as selling less water meant a direct hit to their revenues. It’s estimated that over the past year, local water agencies collectively \u003ca href=\"http://www.sacbee.com/news/state/california/water-and-drought/article89747342.html\">lost hundreds of millions\u003c/a> of dollars under the state-imposed cutbacks.\u003c/p>\n\u003cp>\u003c/p>\n\u003cp>Those suppliers might have to rethink their revenue models given the \u003ca href=\"http://www.ppic.org/main/publication_show.asp?i=1108\">long-term trends\u003c/a>. A recent analysis by the nonpartisan Public Policy Institute of California shows that overall water use is declining even as the state’s population grows.\u003c/p>\n\n\u003c/div>\u003c/p>",
"attributes": {
"named": {},
"numeric": []
}
}
],
"link": "/science/846701/water-conservation-wanes-in-california-as-most-mandatory-restrictions-end",
"authors": [
"221"
],
"series": [
"science_1151"
],
"categories": [
"science_31",
"science_40",
"science_43",
"science_98"
],
"tags": [
"science_1622",
"science_876"
],
"featImg": "science_893165",
"label": "science_1151"
},
"science_884418": {
"type": "posts",
"id": "science_884418",
"meta": {
"index": "posts_1716263798",
"site": "science",
"id": "884418",
"score": null,
"sort": [
1469834083000
]
},
"parent": 0,
"labelTerm": {},
"blocks": [],
"publishDate": 1469834083,
"format": "standard",
"title": "Climate Change Signs Seen in California Wildfires",
"headTitle": "Climate Change Signs Seen in California Wildfires | KQED",
"content": "\u003cp>Reports this week from the \u003ca href=\"http://www.latimes.com/local/lanow/la-me-ln-sand-fire-santa-clarita-20160725-snap-story.html\">front lines\u003c/a> of the Sand Fire in Southern California painted the scene as apocalyptic. The drought-fueled blaze was explosive, fast-moving and devastating, burning through 38,000 acres in the Santa Clarita Valley and forcing the evacuation of more than 10,000 homes.\u003c/p>\n\u003caside class=\"pullquote alignright\">‘Climate change has exacerbated naturally occurring droughts, and therefore fuel conditions.’\u003ccite>Robert Field, NASA\u003c/cite>\u003c/aside>\n\u003cp>If the state’s wildfire season holds true to forecasts, the \u003ca href=\"http://inciweb.nwcg.gov/incident/4878/\">Sand Fire\u003c/a> will be one of many catastrophic wildfires to scorch drought-stricken forests and shrublands across California this year. So far, only one wildfire has been larger — the 48,019-acre \u003ca href=\"http://inciweb.nwcg.gov/incident/4806/\">Erskine Fire\u003c/a>, which started in June in the Sierra Nevada Mountains and destroyed 250 homes and buildings.\u003c/p>\n\u003cp>None of the fires have been among the worst or largest wildfires the state has seen in recent years, but they’re part of a dire global warming-fueled trend toward larger, more frequent and intense wildfires. The number of blazes on public lands across the West has increased 500 percent since the late 1970s, said \u003ca href=\"http://www.ucmerced.edu/content/leroy-westerling\">LeRoy Westerling\u003c/a>, a professor studying climate and wildfire at the University of California-Merced.\u003c/p>\n\u003cp>The outlook this summer is sobering: Wildland fire potential for most of coastal California and the Sierra Nevada Mountains is above normal and is expected to remain that way through October, \u003ca href=\"http://www.predictiveservices.nifc.gov/outlooks/monthly_seasonal_outlook.pdf\">according to\u003c/a> the National Interagency Fire Center.\u003c/p>\n\u003cp>The wildfire forecast follows a major heat wave in California, where the temperatures soared above 120°F (48.9°C) in some parts of Southern California. The region is seeing a \u003ca href=\"http://www.climatecentral.org/news/seasonal-temperature-trends-united-states-20040\">significant warming trend\u003c/a>. Each decade since 1970, average summer temperatures \u003ca href=\"http://www.climatecentral.org/news/seasonal-temperature-trends-united-states-20040\">have warmed\u003c/a> about 0.45°F (0.25°C).\u003c/p>\n\u003cp>[ad fullwidth]\u003c/p>\n\u003cp>The worst of the fire season in Southern California may be yet to come, said \u003ca href=\"https://saffordlab.wordpress.com/people-2/\">Hugh Safford\u003c/a>, a U.S. Forest Service ecologist based in Vallejo.\u003c/p>\n\u003cp>“The most dangerous fire conditions occur from the end of September to December, when Santa Ana winds from the desert interact with the driest fuels of the season after five to six months of drying,” he said. “I would expect an active fire season, and critical conditions in the fall.”\u003c/p>\n\u003cp>Westerling said 140,000 acres have burned across Southern California this year — a figure that amounts to nearly four times the five-year average for annual acreage burned in an entire wildfire season in the region.\u003c/p>\n\u003cp>Global warming’s fingerprints can be clearly seen on this year’s fire season in California, where the state’s extreme drought is entering its fifth year and record-breaking heat has baked the region.\u003c/p>\n\u003cp>“Climate change has exacerbated naturally occurring droughts, and therefore fuel conditions,” said Robert Field, a research scientist at NASA’s Goddard Institute for Space Studies.\u003c/p>\n\u003cp>The worse the drought, the more of a tinderbox forests become.\u003c/p>\n\u003cp>“Higher temperatures exacerbate the drought by increasing evaporation and transpiration,” Westerling said. “Drier conditions mean highly flammable (wildfire) fuels. Drier conditions and high temperatures drive more extreme fire behavior.”\u003c/p>\n\u003cp>Southern California fire conditions today are already bad as firefighters attempt to contain the Sand Fire and battle the \u003ca href=\"http://inciweb.nwcg.gov/incident/4888/\">Soberanes Fire\u003c/a>, which has \u003ca href=\"http://ww2.kqed.org/news/2016/07/29/soberanes-fire-containment-update/\">burned more than 31,000 acres\u003c/a> south of Monterey since the fire started on July 22.\u003c/p>\n\u003cp>The Sand Fire, burning in mountainous shrubland known as chaparral, has surprised wildfire scientists because of the speed with which it scorched the slopes north of Los Angeles. It’s an example of how climate change affects the way wildfires burn.\u003c/p>\n\u003cp>“Chaparral always burns at high intensity, but the mean size of chaparral fires has been growing,” Safford said. “We haven’t seen much change in the severity of these fires, but they are getting bigger on average, which may be due to drought-driven shrub mortality.”\u003c/p>\n\u003cp>Dead and dry trees do a lot to \u003ca href=\"http://www.climatecentral.org/news/california-firefighters-wrangling-with-dead-trees-20471\">help fires spread\u003c/a>, he said.\u003c/p>\n\u003cp>“This last factor results in fire embers that are cast far ahead of the flaming front and leads to faster fire growth and more difficult control,” Safford said.\u003c/p>\n\u003cp>\u003c/p>\n\u003cp>\u003ca href=\"http://www.climatecentral.org/\">\u003cspan style=\"font-weight: 400\">Climate Central\u003c/span>\u003c/a> \u003ci>\u003cspan style=\"font-weight: 400\">is an independent organization that researches and reports on climate change.\u003c/span>\u003c/i>\u003c/p>\n\n",
"stats": {
"hasVideo": false,
"hasChartOrMap": false,
"hasAudio": false,
"hasPolis": false,
"wordCount": 707,
"hasGoogleForm": false,
"hasGallery": false,
"hasHearkenModule": false,
"iframeSrcs": [],
"paragraphCount": 20
},
"modified": 1704929838,
"excerpt": "This year's California wildfire season shows signs of influence from climate change.",
"headData": {
"twImgId": "",
"twTitle": "",
"ogTitle": "",
"ogImgId": "",
"twDescription": "",
"description": "This year's California wildfire season shows signs of influence from climate change.",
"title": "Climate Change Signs Seen in California Wildfires | KQED",
"ogDescription": "",
"schema": {
"@context": "https://schema.org",
"@type": "Article",
"headline": "Climate Change Signs Seen in California Wildfires",
"datePublished": "2016-07-29T16:14:43-07:00",
"dateModified": "2024-01-10T15:37:18-08:00",
"image": "https://cdn.kqed.org/wp-content/uploads/2020/02/KQED-OG-Image@1x.png"
}
},
"guestAuthors": [],
"slug": "climate-change-signs-seen-in-california-wildfires",
"status": "publish",
"sourceUrl": "http://www.climatecentral.org/",
"nprByline": "Bobby Magill\u003c/br>Climate Central",
"sticky": false,
"source": "Climate Central",
"path": "/science/884418/climate-change-signs-seen-in-california-wildfires",
"audioTrackLength": null,
"parsedContent": [
{
"type": "contentString",
"content": "\u003cdiv class=\"post-body\">\u003cp>\u003cp>Reports this week from the \u003ca href=\"http://www.latimes.com/local/lanow/la-me-ln-sand-fire-santa-clarita-20160725-snap-story.html\">front lines\u003c/a> of the Sand Fire in Southern California painted the scene as apocalyptic. The drought-fueled blaze was explosive, fast-moving and devastating, burning through 38,000 acres in the Santa Clarita Valley and forcing the evacuation of more than 10,000 homes.\u003c/p>\n\u003caside class=\"pullquote alignright\">‘Climate change has exacerbated naturally occurring droughts, and therefore fuel conditions.’\u003ccite>Robert Field, NASA\u003c/cite>\u003c/aside>\n\u003cp>If the state’s wildfire season holds true to forecasts, the \u003ca href=\"http://inciweb.nwcg.gov/incident/4878/\">Sand Fire\u003c/a> will be one of many catastrophic wildfires to scorch drought-stricken forests and shrublands across California this year. So far, only one wildfire has been larger — the 48,019-acre \u003ca href=\"http://inciweb.nwcg.gov/incident/4806/\">Erskine Fire\u003c/a>, which started in June in the Sierra Nevada Mountains and destroyed 250 homes and buildings.\u003c/p>\n\u003cp>None of the fires have been among the worst or largest wildfires the state has seen in recent years, but they’re part of a dire global warming-fueled trend toward larger, more frequent and intense wildfires. The number of blazes on public lands across the West has increased 500 percent since the late 1970s, said \u003ca href=\"http://www.ucmerced.edu/content/leroy-westerling\">LeRoy Westerling\u003c/a>, a professor studying climate and wildfire at the University of California-Merced.\u003c/p>\n\u003cp>The outlook this summer is sobering: Wildland fire potential for most of coastal California and the Sierra Nevada Mountains is above normal and is expected to remain that way through October, \u003ca href=\"http://www.predictiveservices.nifc.gov/outlooks/monthly_seasonal_outlook.pdf\">according to\u003c/a> the National Interagency Fire Center.\u003c/p>\n\u003cp>The wildfire forecast follows a major heat wave in California, where the temperatures soared above 120°F (48.9°C) in some parts of Southern California. The region is seeing a \u003ca href=\"http://www.climatecentral.org/news/seasonal-temperature-trends-united-states-20040\">significant warming trend\u003c/a>. Each decade since 1970, average summer temperatures \u003ca href=\"http://www.climatecentral.org/news/seasonal-temperature-trends-united-states-20040\">have warmed\u003c/a> about 0.45°F (0.25°C).\u003c/p>\n\u003cp>\u003c/p>\u003c/div>",
"attributes": {
"named": {},
"numeric": []
}
},
{
"type": "component",
"content": "",
"name": "ad",
"attributes": {
"named": {
"label": "fullwidth"
},
"numeric": [
"fullwidth"
]
}
},
{
"type": "contentString",
"content": "\u003cdiv class=\"post-body\">\u003cp>\u003c/p>\n\u003cp>The worst of the fire season in Southern California may be yet to come, said \u003ca href=\"https://saffordlab.wordpress.com/people-2/\">Hugh Safford\u003c/a>, a U.S. Forest Service ecologist based in Vallejo.\u003c/p>\n\u003cp>“The most dangerous fire conditions occur from the end of September to December, when Santa Ana winds from the desert interact with the driest fuels of the season after five to six months of drying,” he said. “I would expect an active fire season, and critical conditions in the fall.”\u003c/p>\n\u003cp>Westerling said 140,000 acres have burned across Southern California this year — a figure that amounts to nearly four times the five-year average for annual acreage burned in an entire wildfire season in the region.\u003c/p>\n\u003cp>Global warming’s fingerprints can be clearly seen on this year’s fire season in California, where the state’s extreme drought is entering its fifth year and record-breaking heat has baked the region.\u003c/p>\n\u003cp>“Climate change has exacerbated naturally occurring droughts, and therefore fuel conditions,” said Robert Field, a research scientist at NASA’s Goddard Institute for Space Studies.\u003c/p>\n\u003cp>The worse the drought, the more of a tinderbox forests become.\u003c/p>\n\u003cp>“Higher temperatures exacerbate the drought by increasing evaporation and transpiration,” Westerling said. “Drier conditions mean highly flammable (wildfire) fuels. Drier conditions and high temperatures drive more extreme fire behavior.”\u003c/p>\n\u003cp>Southern California fire conditions today are already bad as firefighters attempt to contain the Sand Fire and battle the \u003ca href=\"http://inciweb.nwcg.gov/incident/4888/\">Soberanes Fire\u003c/a>, which has \u003ca href=\"http://ww2.kqed.org/news/2016/07/29/soberanes-fire-containment-update/\">burned more than 31,000 acres\u003c/a> south of Monterey since the fire started on July 22.\u003c/p>\n\u003cp>The Sand Fire, burning in mountainous shrubland known as chaparral, has surprised wildfire scientists because of the speed with which it scorched the slopes north of Los Angeles. It’s an example of how climate change affects the way wildfires burn.\u003c/p>\n\u003cp>“Chaparral always burns at high intensity, but the mean size of chaparral fires has been growing,” Safford said. “We haven’t seen much change in the severity of these fires, but they are getting bigger on average, which may be due to drought-driven shrub mortality.”\u003c/p>\n\u003cp>Dead and dry trees do a lot to \u003ca href=\"http://www.climatecentral.org/news/california-firefighters-wrangling-with-dead-trees-20471\">help fires spread\u003c/a>, he said.\u003c/p>\n\u003cp>“This last factor results in fire embers that are cast far ahead of the flaming front and leads to faster fire growth and more difficult control,” Safford said.\u003c/p>\n\u003cp>\u003c/p>\n\u003cp>\u003ca href=\"http://www.climatecentral.org/\">\u003cspan style=\"font-weight: 400\">Climate Central\u003c/span>\u003c/a> \u003ci>\u003cspan style=\"font-weight: 400\">is an independent organization that researches and reports on climate change.\u003c/span>\u003c/i>\u003c/p>\n\n\u003c/div>\u003c/p>",
"attributes": {
"named": {},
"numeric": []
}
}
],
"link": "/science/884418/climate-change-signs-seen-in-california-wildfires",
"authors": [
"byline_science_884418"
],
"categories": [
"science_31",
"science_35",
"science_40"
],
"tags": [
"science_194",
"science_113"
],
"featImg": "science_884445",
"label": "source_science_884418"
},
"science_881900": {
"type": "posts",
"id": "science_881900",
"meta": {
"index": "posts_1716263798",
"site": "science",
"id": "881900",
"score": null,
"sort": [
1469748897000
]
},
"parent": 0,
"labelTerm": {
"site": "science",
"term": 1151
},
"blocks": [],
"publishDate": 1469748897,
"format": "standard",
"title": "Warming at Alarming Rate, Lake Tahoe Reflects Rapid Sierra Climate Change",
"headTitle": "Warming at Alarming Rate, Lake Tahoe Reflects Rapid Sierra Climate Change | KQED",
"content": "\u003cp>Lake Tahoe is showing some severe impacts from the changing climate.\u003c/p>\n\u003cp>Indicators released Thursday in the annual “\u003ca href=\"http://terc.ucdavis.edu/\" target=\"_blank\" rel=\"noopener\">State of the Lake\u003c/a>” report packed a few surprises, even for scientists.\u003c/p>\n\u003cp>For one thing, the lake has been warming faster than ever recorded. In 2015 the lake’s average temperature rose 0.48 degrees Fahrenheit — and over the last four years, the rise was 15 times faster than the lake’s historic warming rate.\u003c/p>\n\u003cp>“That came as a surprise to me,” says Geoffrey Schladow, a UC Davis freshwater scientist and lead author of the report.\u003c/p>\n\u003cp>Given the enormous volume of Lake Tahoe, Schladow is struck by how quickly it warmed. Schladow says if you took the full volume of water in Tahoe and spread it out over California, it would cover the state in 15 inches of water.\u003c/p>\n\u003cp>[ad fullwidth]\u003c/p>\n\u003cp>“That’s a lot of water,” he notes. “We’re not saying that it’s going to keep increasing at that rate, but the fact that it can change so quickly is disturbing.”\u003c/p>\n\u003caside class=\"pullquote alignright\">‘The fact that it can change so quickly is disturbing.’\u003ccite>Geoffrey Schladow, UC Davis freshwater scientist\u003c/cite>\u003c/aside>\n\u003cp>Even more disturbing to scientists is how all this warming has affected the lake’s ability to mix its own waters, a natural process that is thermally driven. The warm winters have stunted that process, meaning that oxygen-rich surface water is not making it to the lake bottom, depriving fish and other life forms of oxygen. Scientists routinely measure how deep the mixing occurs — the deeper, the healthier for the lake — and last year’s level was 262 feet, the most shallow ever recorded. Tahoe’s maximum depth is more than 1600 feet.\u003c/p>\n\u003cp>“What we’re seeing now is that the climate and the weather are starting to affect the lake more directly,” says Schladow, who notes that Tahoe is only a mirror held up to the rest of the state; if this critical mixing process is shutting down in Tahoe, it’s doubtless happening in other lakes around the West.\u003c/p>\n\u003cfigure id=\"attachment_882001\" class=\"wp-caption aligncenter\" style=\"max-width: 716px\">\u003cimg loading=\"lazy\" decoding=\"async\" class=\"size-full wp-image-882001\" src=\"http://ww2.kqed.org/science/wp-content/uploads/sites/35/2016/07/sotl_2016_snow_as_precipitation_ver1605263-716x429.jpg\" alt=\"The long-term trend at Lake Tahoe -- and elsewhere in the Sierra -- is for more rain and less snow, which affects the state's water supply.\" width=\"716\" height=\"429\" srcset=\"https://cdn.kqed.org/wp-content/uploads/sites/35/2016/07/sotl_2016_snow_as_precipitation_ver1605263-716x429.jpg 716w, https://cdn.kqed.org/wp-content/uploads/sites/35/2016/07/sotl_2016_snow_as_precipitation_ver1605263-716x429-400x240.jpg 400w\" sizes=\"(max-width: 716px) 100vw, 716px\">\u003cfigcaption class=\"wp-caption-text\">The long-term trend at Lake Tahoe — and elsewhere in the Sierra — is for more rain and less snow, which affects the state’s water supply. \u003ccite>(UC Davis)\u003c/cite>\u003c/figcaption>\u003c/figure>\n\u003cp>\u003c/p>\n\u003cp>For years, scientists have warned that the Sierra would gradually see more rain and less snow because of the warming climate, a trend that has potentially dire consequences for California’s water supply. But the trend of the last few years has been stunning. The report’s authors noted that during the winter of 2014-2015, just 6.5 percent of precipitation at the lake level fell in the form of snow. Decades ago it was more like a 50-50 mix.\u003c/p>\n\n",
"stats": {
"hasVideo": false,
"hasChartOrMap": false,
"hasAudio": false,
"hasPolis": false,
"wordCount": 478,
"hasGoogleForm": false,
"hasGallery": false,
"hasHearkenModule": false,
"iframeSrcs": [],
"paragraphCount": 11
},
"modified": 1704929842,
"excerpt": "The findings surprised even scientists who monitor Tahoe's vitals, and could show climate change impacts coming faster than expected.",
"headData": {
"twImgId": "",
"twTitle": "",
"ogTitle": "",
"ogImgId": "",
"twDescription": "",
"description": "The findings surprised even scientists who monitor Tahoe's vitals, and could show climate change impacts coming faster than expected.",
"title": "Warming at Alarming Rate, Lake Tahoe Reflects Rapid Sierra Climate Change | KQED",
"ogDescription": "",
"schema": {
"@context": "https://schema.org",
"@type": "Article",
"headline": "Warming at Alarming Rate, Lake Tahoe Reflects Rapid Sierra Climate Change",
"datePublished": "2016-07-28T16:34:57-07:00",
"dateModified": "2024-01-10T15:37:22-08:00",
"image": "https://cdn.kqed.org/wp-content/uploads/2020/02/KQED-OG-Image@1x.png"
}
},
"guestAuthors": [],
"slug": "warming-at-alarming-rate-lake-tahoe-reflects-rapid-sierra-climate-change",
"status": "publish",
"sticky": false,
"path": "/science/881900/warming-at-alarming-rate-lake-tahoe-reflects-rapid-sierra-climate-change",
"audioTrackLength": null,
"parsedContent": [
{
"type": "contentString",
"content": "\u003cdiv class=\"post-body\">\u003cp>\u003cp>Lake Tahoe is showing some severe impacts from the changing climate.\u003c/p>\n\u003cp>Indicators released Thursday in the annual “\u003ca href=\"http://terc.ucdavis.edu/\" target=\"_blank\" rel=\"noopener\">State of the Lake\u003c/a>” report packed a few surprises, even for scientists.\u003c/p>\n\u003cp>For one thing, the lake has been warming faster than ever recorded. In 2015 the lake’s average temperature rose 0.48 degrees Fahrenheit — and over the last four years, the rise was 15 times faster than the lake’s historic warming rate.\u003c/p>\n\u003cp>“That came as a surprise to me,” says Geoffrey Schladow, a UC Davis freshwater scientist and lead author of the report.\u003c/p>\n\u003cp>Given the enormous volume of Lake Tahoe, Schladow is struck by how quickly it warmed. Schladow says if you took the full volume of water in Tahoe and spread it out over California, it would cover the state in 15 inches of water.\u003c/p>\n\u003cp>\u003c/p>\u003c/div>",
"attributes": {
"named": {},
"numeric": []
}
},
{
"type": "component",
"content": "",
"name": "ad",
"attributes": {
"named": {
"label": "fullwidth"
},
"numeric": [
"fullwidth"
]
}
},
{
"type": "contentString",
"content": "\u003cdiv class=\"post-body\">\u003cp>\u003c/p>\n\u003cp>“That’s a lot of water,” he notes. “We’re not saying that it’s going to keep increasing at that rate, but the fact that it can change so quickly is disturbing.”\u003c/p>\n\u003caside class=\"pullquote alignright\">‘The fact that it can change so quickly is disturbing.’\u003ccite>Geoffrey Schladow, UC Davis freshwater scientist\u003c/cite>\u003c/aside>\n\u003cp>Even more disturbing to scientists is how all this warming has affected the lake’s ability to mix its own waters, a natural process that is thermally driven. The warm winters have stunted that process, meaning that oxygen-rich surface water is not making it to the lake bottom, depriving fish and other life forms of oxygen. Scientists routinely measure how deep the mixing occurs — the deeper, the healthier for the lake — and last year’s level was 262 feet, the most shallow ever recorded. Tahoe’s maximum depth is more than 1600 feet.\u003c/p>\n\u003cp>“What we’re seeing now is that the climate and the weather are starting to affect the lake more directly,” says Schladow, who notes that Tahoe is only a mirror held up to the rest of the state; if this critical mixing process is shutting down in Tahoe, it’s doubtless happening in other lakes around the West.\u003c/p>\n\u003cfigure id=\"attachment_882001\" class=\"wp-caption aligncenter\" style=\"max-width: 716px\">\u003cimg loading=\"lazy\" decoding=\"async\" class=\"size-full wp-image-882001\" src=\"http://ww2.kqed.org/science/wp-content/uploads/sites/35/2016/07/sotl_2016_snow_as_precipitation_ver1605263-716x429.jpg\" alt=\"The long-term trend at Lake Tahoe -- and elsewhere in the Sierra -- is for more rain and less snow, which affects the state's water supply.\" width=\"716\" height=\"429\" srcset=\"https://cdn.kqed.org/wp-content/uploads/sites/35/2016/07/sotl_2016_snow_as_precipitation_ver1605263-716x429.jpg 716w, https://cdn.kqed.org/wp-content/uploads/sites/35/2016/07/sotl_2016_snow_as_precipitation_ver1605263-716x429-400x240.jpg 400w\" sizes=\"(max-width: 716px) 100vw, 716px\">\u003cfigcaption class=\"wp-caption-text\">The long-term trend at Lake Tahoe — and elsewhere in the Sierra — is for more rain and less snow, which affects the state’s water supply. \u003ccite>(UC Davis)\u003c/cite>\u003c/figcaption>\u003c/figure>\n\u003cp>\u003c/p>\n\u003cp>For years, scientists have warned that the Sierra would gradually see more rain and less snow because of the warming climate, a trend that has potentially dire consequences for California’s water supply. But the trend of the last few years has been stunning. The report’s authors noted that during the winter of 2014-2015, just 6.5 percent of precipitation at the lake level fell in the form of snow. Decades ago it was more like a 50-50 mix.\u003c/p>\n\n\u003c/div>\u003c/p>",
"attributes": {
"named": {},
"numeric": []
}
}
],
"link": "/science/881900/warming-at-alarming-rate-lake-tahoe-reflects-rapid-sierra-climate-change",
"authors": [
"221"
],
"series": [
"science_1151"
],
"categories": [
"science_30",
"science_31",
"science_35",
"science_40",
"science_43",
"science_98"
],
"tags": [
"science_572",
"science_5185",
"science_813"
],
"featImg": "science_881997",
"label": "science_1151"
},
"science_863270": {
"type": "posts",
"id": "science_863270",
"meta": {
"index": "posts_1716263798",
"site": "science",
"id": "863270",
"score": null,
"sort": [
1469051758000
]
},
"parent": 0,
"labelTerm": {
"site": "science"
},
"blocks": [],
"publishDate": 1469051758,
"format": "standard",
"title": "Tree Climbers Clone Redwoods to Fight Climate Change",
"headTitle": "Tree Climbers Clone Redwoods to Fight Climate Change | KQED",
"content": "\u003cp>At the foot of a giant sequoia in California’s Sierra Nevada, two arborists stepped into harnesses then inched up ropes more than 20 stories into the dizzying canopy of a tree that survived thousands of years, enduring drought, wildfire and disease.\u003c/p>\n\u003cp>There, the arborists clipped off tips of young branches to be hand-delivered across the country, cloned in a lab and eventually planted in a forest in some other part of the world.\u003c/p>\n\u003cp>The two are among a cadre of modern day Johnny Appleseeds who believe California’s giant sequoias and coastal redwoods are blessed with some of the heartiest genetics of any trees on Earth — and that propagating them will help reverse climate change, at least in a small way.\u003c/p>\n\u003cp>“It’s a biological miracle,” said tree climber Jim Clark, firmly back on the ground and holding a green sprig to his lips as if to kiss it. “This piece of tissue … can be rooted, and we have a miniature 3,000-year-old tree.”\u003c/p>\n\u003cp>The cloning expedition to Camp Nelson, a mountain community about 100 miles southeast of Fresno, was led by David Milarch, co-founder of Archangel Ancient Tree Archive.\u003c/p>\n\u003cp>[ad fullwidth]\u003c/p>\n\u003cp>The Michigan-based nurseryman preaches the urgency of restoring the Earth’s decimated forests. In two decades, he says his nonprofit group has cloned 170 types of trees and planted more than 300,000 of them in seven countries with willing landowners.\u003c/p>\n\u003caside class=\"pullquote alignright\">‘It’s a biological miracle. We have a miniature 3,000-year-old tree.’\u003ccite>Jim Clark\u003c/cite>\u003c/aside>\n\u003cp>“It’s really a race against time,” Milarch said. “If we start right now, we can go after climate change and reverse it before it’s too late.”\u003c/p>\n\u003cp>Sequoias growing in the Sierra are among the biggest and oldest trees on Earth, some nearly 300 feet tall and up to 3,000 years old.\u003c/p>\n\u003cp>Relying on common sense that he says is being borne out by science, Milarch, 66, believes their size and robustness make them ideal for absorbing greenhouse gases that drive climate change on the planet. He likens them to people who drink and smoke all their lives, yet thrive well into their 90s.\u003c/p>\n\u003cp>One skeptic is Todd Dawson, a professor of integrated biology at the University of California, Berkeley. He admires Archangel’s creative efforts but says it’s unclear whether the towering trees have superior genes or whether they were simply lucky not to meet the fate of a logger’s saw.\u003c/p>\n\u003cp>Chances are slim, he said, that cloning and planting a limited number of trees will cool the warming planet. He favors more sweeping approaches such as curbing the use of fossil fuels and protecting vast rainforests.\u003c/p>\n\u003cp>“That’s one of the things about global warming — it’s a global problem,” Dawson said. “You’re going to have to plant a lot of trees to combat global warming.”\u003c/p>\n\u003cp>A team of about a dozen expert tree climbers from across the country volunteered for the expedition in May to restock Archangel’s store of genetic samples. They risked their lives to climb to the ends of massive limbs, starting in the southern Sierra sequoia grove and winding up nearly 500 miles away in Northern California, where they carefully collected additional samples from coastal redwoods — a taller, thinner cousin of the giant sequoia. [contextly_sidebar id=”I6Je3Fpl7kMVmUyX8g4zO3Wr5pO1yOZZ”]\u003c/p>\n\u003cp>Clark wrapped the clippings he gathered in damp newspaper, placed them inside ice-filled duffel bags and boarded an overnight flight to the Archangel’s lab across country in Copemish, a rural village in northwestern Michigan.\u003c/p>\n\u003cp>There, Clark and another propagation specialist snipped off some 2,000 shoots a few inches long and planted them in small containers of a peat-and-gel mixture.\u003c/p>\n\u003cp>Another 1,000 fingernail-sized bits of greenery were placed into jars containing a blend of seaweed-based gelatin and growth hormones.\u003c/p>\n\u003cp>The samples grow beneath purplish fluorescent lights under humidity and temperatures designed to encourage rooting. Cloning ancient trees is tricky business, lab workers say, and many samples don’t survive.\u003c/p>\n\u003cp>Later this year, Archangel’s team will come west to plant up to 1,000 sequoia and redwood saplings in a cool, damp region of Oregon where the trees will have the best chance to grow.\u003c/p>\n\u003cp>Bill Werner, a horticulture consultant based in Monterey, California, who has worked with Archangel, says that in the face of global warming, it’s easy to dismiss the efforts of a “renegade” group that relies heavily on donations and volunteer nurserymen and arborists.\u003c/p>\n\u003cp>“That’s not fair,” Werner said. “It may be a drop in the bucket, but at least somebody’s doing something.”\u003c/p>\n\u003cp>—\u003c/p>\n\u003cp>\u003c/p>\n\u003cp>AP correspondent John Flesher contributed to this report.\u003c/p>\n\n",
"stats": {
"hasVideo": false,
"hasChartOrMap": false,
"hasAudio": false,
"hasPolis": false,
"wordCount": 825,
"hasGoogleForm": false,
"hasGallery": false,
"hasHearkenModule": false,
"iframeSrcs": [],
"paragraphCount": 24
},
"modified": 1704929892,
"excerpt": null,
"headData": {
"twImgId": "",
"twTitle": "",
"ogTitle": "",
"ogImgId": "",
"twDescription": "",
"description": "At the foot of a giant sequoia in California’s Sierra Nevada, two arborists stepped into harnesses then inched up ropes more than 20 stories into the dizzying canopy of a tree that survived thousands of years, enduring drought, wildfire and disease. There, the arborists clipped off tips of young branches to be hand-delivered across the",
"title": "Tree Climbers Clone Redwoods to Fight Climate Change | KQED",
"ogDescription": "",
"schema": {
"@context": "https://schema.org",
"@type": "Article",
"headline": "Tree Climbers Clone Redwoods to Fight Climate Change",
"datePublished": "2016-07-20T14:55:58-07:00",
"dateModified": "2024-01-10T15:38:12-08:00",
"image": "https://cdn.kqed.org/wp-content/uploads/2020/02/KQED-OG-Image@1x.png"
}
},
"guestAuthors": [],
"slug": "tree-climbers-clone-redwoods-fight-climate-change",
"status": "publish",
"nprByline": "Scott Smith/AP",
"sticky": false,
"path": "/science/863270/tree-climbers-clone-redwoods-fight-climate-change",
"audioTrackLength": null,
"parsedContent": [
{
"type": "contentString",
"content": "\u003cdiv class=\"post-body\">\u003cp>\u003cp>At the foot of a giant sequoia in California’s Sierra Nevada, two arborists stepped into harnesses then inched up ropes more than 20 stories into the dizzying canopy of a tree that survived thousands of years, enduring drought, wildfire and disease.\u003c/p>\n\u003cp>There, the arborists clipped off tips of young branches to be hand-delivered across the country, cloned in a lab and eventually planted in a forest in some other part of the world.\u003c/p>\n\u003cp>The two are among a cadre of modern day Johnny Appleseeds who believe California’s giant sequoias and coastal redwoods are blessed with some of the heartiest genetics of any trees on Earth — and that propagating them will help reverse climate change, at least in a small way.\u003c/p>\n\u003cp>“It’s a biological miracle,” said tree climber Jim Clark, firmly back on the ground and holding a green sprig to his lips as if to kiss it. “This piece of tissue … can be rooted, and we have a miniature 3,000-year-old tree.”\u003c/p>\n\u003cp>The cloning expedition to Camp Nelson, a mountain community about 100 miles southeast of Fresno, was led by David Milarch, co-founder of Archangel Ancient Tree Archive.\u003c/p>\n\u003cp>\u003c/p>\u003c/div>",
"attributes": {
"named": {},
"numeric": []
}
},
{
"type": "component",
"content": "",
"name": "ad",
"attributes": {
"named": {
"label": "fullwidth"
},
"numeric": [
"fullwidth"
]
}
},
{
"type": "contentString",
"content": "\u003cdiv class=\"post-body\">\u003cp>\u003c/p>\n\u003cp>The Michigan-based nurseryman preaches the urgency of restoring the Earth’s decimated forests. In two decades, he says his nonprofit group has cloned 170 types of trees and planted more than 300,000 of them in seven countries with willing landowners.\u003c/p>\n\u003caside class=\"pullquote alignright\">‘It’s a biological miracle. We have a miniature 3,000-year-old tree.’\u003ccite>Jim Clark\u003c/cite>\u003c/aside>\n\u003cp>“It’s really a race against time,” Milarch said. “If we start right now, we can go after climate change and reverse it before it’s too late.”\u003c/p>\n\u003cp>Sequoias growing in the Sierra are among the biggest and oldest trees on Earth, some nearly 300 feet tall and up to 3,000 years old.\u003c/p>\n\u003cp>Relying on common sense that he says is being borne out by science, Milarch, 66, believes their size and robustness make them ideal for absorbing greenhouse gases that drive climate change on the planet. He likens them to people who drink and smoke all their lives, yet thrive well into their 90s.\u003c/p>\n\u003cp>One skeptic is Todd Dawson, a professor of integrated biology at the University of California, Berkeley. He admires Archangel’s creative efforts but says it’s unclear whether the towering trees have superior genes or whether they were simply lucky not to meet the fate of a logger’s saw.\u003c/p>\n\u003cp>Chances are slim, he said, that cloning and planting a limited number of trees will cool the warming planet. He favors more sweeping approaches such as curbing the use of fossil fuels and protecting vast rainforests.\u003c/p>\n\u003cp>“That’s one of the things about global warming — it’s a global problem,” Dawson said. “You’re going to have to plant a lot of trees to combat global warming.”\u003c/p>\n\u003cp>A team of about a dozen expert tree climbers from across the country volunteered for the expedition in May to restock Archangel’s store of genetic samples. They risked their lives to climb to the ends of massive limbs, starting in the southern Sierra sequoia grove and winding up nearly 500 miles away in Northern California, where they carefully collected additional samples from coastal redwoods — a taller, thinner cousin of the giant sequoia. \u003c/p>\u003cp>\u003c/p>\u003cp>\u003c/p>\n\u003cp>Clark wrapped the clippings he gathered in damp newspaper, placed them inside ice-filled duffel bags and boarded an overnight flight to the Archangel’s lab across country in Copemish, a rural village in northwestern Michigan.\u003c/p>\n\u003cp>There, Clark and another propagation specialist snipped off some 2,000 shoots a few inches long and planted them in small containers of a peat-and-gel mixture.\u003c/p>\n\u003cp>Another 1,000 fingernail-sized bits of greenery were placed into jars containing a blend of seaweed-based gelatin and growth hormones.\u003c/p>\n\u003cp>The samples grow beneath purplish fluorescent lights under humidity and temperatures designed to encourage rooting. Cloning ancient trees is tricky business, lab workers say, and many samples don’t survive.\u003c/p>\n\u003cp>Later this year, Archangel’s team will come west to plant up to 1,000 sequoia and redwood saplings in a cool, damp region of Oregon where the trees will have the best chance to grow.\u003c/p>\n\u003cp>Bill Werner, a horticulture consultant based in Monterey, California, who has worked with Archangel, says that in the face of global warming, it’s easy to dismiss the efforts of a “renegade” group that relies heavily on donations and volunteer nurserymen and arborists.\u003c/p>\n\u003cp>“That’s not fair,” Werner said. “It may be a drop in the bucket, but at least somebody’s doing something.”\u003c/p>\n\u003cp>—\u003c/p>\n\u003cp>\u003c/p>\n\u003cp>AP correspondent John Flesher contributed to this report.\u003c/p>\n\n\u003c/div>\u003c/p>",
"attributes": {
"named": {},
"numeric": []
}
}
],
"link": "/science/863270/tree-climbers-clone-redwoods-fight-climate-change",
"authors": [
"byline_science_863270"
],
"categories": [
"science_31",
"science_35"
],
"tags": [
"science_5178",
"science_194",
"science_813",
"science_109"
],
"featImg": "science_863271",
"label": "science"
},
"science_860496": {
"type": "posts",
"id": "science_860496",
"meta": {
"index": "posts_1716263798",
"site": "science",
"id": "860496",
"score": null,
"sort": [
1468951654000
]
},
"parent": 0,
"labelTerm": {},
"blocks": [],
"publishDate": 1468951654,
"format": "standard",
"title": "First Half of 2016 Blows Away Temp Records",
"headTitle": "First Half of 2016 Blows Away Temp Records | KQED",
"content": "\u003cp>The first half of 2016 has blown away temperature records, capped off by a record hot June, once again bumping up the odds that 2016 will be the hottest year on record globally, according to data released Tuesday.\u003c/p>\n\u003cp>The monthly numbers from NASA and the National Oceanic and Atmospheric Administration puts the planet on track to surpass 2015 as the hottest on record.\u003c/p>\n\u003caside class=\"pullquote alignright\">Every month this year has been record warm globally.\u003c/aside>\n\u003cp>“2016 has really blown that out of the water,” Gavin Schmidt, the director of NASA’s Goddard Institute for Space Studies, said.\u003c/p>\n\u003cp>While 2016 has gotten a boost from an \u003ca href=\"http://www.climatecentral.org/news/will-la-nina-follow-one-of-strongest-el-ninos-20223\">exceptionally strong El Niño\u003c/a>, the record temps are \u003ca href=\"http://www.climatecentral.org/2015-global-temp-record\">mostly the result\u003c/a> of the excess heat that has built up in Earth’s atmosphere due to accumulating greenhouse gases. That heat is \u003ca href=\"http://sealevel.climatecentral.org/\">raising global sea levels\u003c/a>, disrupting ecosystems and leading to \u003ca href=\"http://www.climatecentral.org/news/climate-change-evolving-role-in-extreme-weather-18501\">more extreme weather events\u003c/a>.\u003c/p>\n\u003cp>Every month this year has been record warm globally. Several months early in the year were the first ever recorded to \u003ca href=\"http://www.climatecentral.org/news/incredible-october-warmth-guarantees-record-hot-2015-19695\">exceed 1°C\u003c/a> (1.8°F) above average.\u003c/p>\n\u003cp>[ad fullwidth]\u003c/p>\n\u003cp>With the \u003ca href=\"http://www.climatecentral.org/news/el-nino-is-over-20424\">demise of El Niño\u003c/a>, those temperature departures have dropped slightly, but are still at record-high levels. June was 1.62°F (0.90°C) above the 20th century average \u003ca href=\"http://www.ncdc.noaa.gov/sotc/global/201606\">according to NOAA\u003c/a> and 1.42°F (0.79°C) above the 1951-1980 average, \u003ca href=\"http://data.giss.nasa.gov/gistemp/tabledata_v3/GLB.Ts+dSST.txt\">according to NASA\u003c/a>. (June was also \u003ca href=\"http://www.climatecentral.org/news/june-hottest-on-record-contiguous-us-20502\">record warm for the contiguous U.S.\u003c/a>, in part because of an intense, record-breaking heat wave that swept the Southwest.)\u003c/p>\n\u003cp>\u003cimg loading=\"lazy\" decoding=\"async\" class=\"aligncenter size-full wp-image-860507\" src=\"http://ww2.kqed.org/science/wp-content/uploads/sites/35/2016/07/2016Global_Jan-Jun_CC.jpg\" alt=\"2016Global_Jan-Jun_CC\" width=\"720\" height=\"492\" srcset=\"https://cdn.kqed.org/wp-content/uploads/sites/35/2016/07/2016Global_Jan-Jun_CC.jpg 720w, https://cdn.kqed.org/wp-content/uploads/sites/35/2016/07/2016Global_Jan-Jun_CC-400x273.jpg 400w\" sizes=\"(max-width: 720px) 100vw, 720px\">In NOAA’s records, that makes an unprecedented 14 consecutive record-hot months. While that streak will eventually end, Deke Arndt, the head of the climate monitoring division at NOAA’s National Centers for Environmental Information, said that the long-term warming trend is stll clear.\u003c/p>\n\u003cp>“It’s important to keep perspective here. Even if we aren’t setting records, we are in a neighborhood beyond anything we had seen before early 2015,” Arndt said in an email. “We’ve left the 20th century far behind. This is a big deal.”\u003c/p>\n\u003cp>With June’s record heat, the year-to-date is 1.89°F (1.05°C) above the 20th century average, according to NOAA, and 1.96°F (1.09°C) above the 1951-1980 average according to NASA.\u003c/p>\n\u003cp>The temperatures “are so in excess of any first part of a year that we’ve seen,” Schmidt said.\u003c/p>\n\u003cp>\u003cimg loading=\"lazy\" decoding=\"async\" class=\"aligncenter size-full wp-image-860508\" src=\"http://ww2.kqed.org/science/wp-content/uploads/sites/35/2016/07/2016hottest_yr_so_far_CC.jpg\" alt=\"2016)hottest_yr_so_far_CC\" width=\"720\" height=\"492\" srcset=\"https://cdn.kqed.org/wp-content/uploads/sites/35/2016/07/2016hottest_yr_so_far_CC.jpg 720w, https://cdn.kqed.org/wp-content/uploads/sites/35/2016/07/2016hottest_yr_so_far_CC-400x273.jpg 400w\" sizes=\"(max-width: 720px) 100vw, 720px\">Each agency uses different methods of processing the global temperature data, as well as different baselines for comparing temperatures, leading to slightly different results. Both agree on the long-term warming trend, though.\u003c/p>\n\u003cp>Nations have agreed to a goal of\u003ca href=\"http://www.climatecentral.org/news/see-earths-temperature-spiral-toward-2c-20332\"> keeping warming under 2°C\u003c/a> (3.6°F) above temperatures from preindustrial times — before manmade greenhouse gases began building in the atmosphere — by the end of the century. To put current global temperatures into the perspective of that framework, \u003ca href=\"http://www.climatecentral.org/news/world-flirts-with-1.5C-threshold-20260\">Climate Central has been reanalyzing\u003c/a> the NASA and NOAA data. The two datasets are averaged and then compared to the average from 1881-1910, closer to the preindustrial era.\u003c/p>\n\u003cp>Through June, 2016 was 2.4°F (1.34°C) above the average for that period.\u003c/p>\n\u003cp>The Arctic has been one of the areas of the world that has seen sky-high temperatures this year, which have led to \u003ca href=\"http://www.climatecentral.org/news/arctic-sea-ice-record-low-for-june-20508\">record-low sea ice levels\u003c/a>.\u003c/p>\n\u003cp>Those roasting Arctic temperatures have extended into Alaska. The state’s average temperature is 9°F above the 1925-2000 average for the year through June. The North Slope town of Deadhorse just recorded a temperature of 85°F (29.4°C), the \u003ca href=\"http://wxshift.com/news/heat-wave-to-blanket-us-next-week\">hottest temperature\u003c/a> ever measured within 50 miles of its Arctic coast.\u003c/p>\n\u003cp>The oceans are another area that have seen persistent warmth. According to NOAA, the global average ocean temperature for the first half of the year is 1.42°F (0.79°C) above the 20th century average, the largest such departure in 137 years of records. These elevated temperatures have led to a record third year of a \u003ca href=\"http://www.climatecentral.org/news/coral-bleaching-record-third-year-20467\">global coral bleaching event\u003c/a>.\u003c/p>\n\u003cp>Water changes temperature more slowly than the air or land, which means the global ocean heat is likely to persist for some time. In part because of that, temperatures are likely to stay elevated for the remainder of the year, even if they drop off the record pace.\u003c/p>\n\u003cp>Whether 2016 ultimately bests 2015 depends on how the second half of year goes. Forecasts have backed off predictions of a La Niña this fall; La Niña tends to cool global temperatures.\u003c/p>\n\u003cp>The significant lead that 2016 has makes the odds good that the year will end up the warmest, though there is no guarantee.\u003c/p>\n\u003cp>Regardless of where 2016 falls, the long-term trend of warming is clear, and it has tipped the odds in favor of record heat: Of the 15 warmest years on record, 14 have occurred in the 21st century.\u003c/p>\n\u003cp>“2016 will be one of the warmest on record. Whether it slips to nominally above or nominally below 2015, that may depend on some climate variability factors like the strength of the La Niña,” Arndt said. “But it will share with 2015 the distinction of being, comfortably, the two warmest years on record and warmer, comfortably than any year we’ve measured in modern times.”\u003c/p>\n\u003cp>\u003c/p>\n\u003cp>\u003ca href=\"http://www.climatecentral.org/\">\u003cspan style=\"font-weight: 400\">Climate Central\u003c/span>\u003c/a> \u003ci>\u003cspan style=\"font-weight: 400\">is an independent organization that researches and reports on climate change.\u003c/span>\u003c/i>\u003c/p>\n\n",
"stats": {
"hasVideo": false,
"hasChartOrMap": false,
"hasAudio": false,
"hasPolis": false,
"wordCount": 940,
"hasGoogleForm": false,
"hasGallery": false,
"hasHearkenModule": false,
"iframeSrcs": [],
"paragraphCount": 24
},
"modified": 1704929898,
"excerpt": "2016 is looking more and more likely to be the hottest year on record, after a record warm June extended this year's streak.",
"headData": {
"twImgId": "",
"twTitle": "",
"ogTitle": "",
"ogImgId": "",
"twDescription": "",
"description": "2016 is looking more and more likely to be the hottest year on record, after a record warm June extended this year's streak.",
"title": "First Half of 2016 Blows Away Temp Records | KQED",
"ogDescription": "",
"schema": {
"@context": "https://schema.org",
"@type": "Article",
"headline": "First Half of 2016 Blows Away Temp Records",
"datePublished": "2016-07-19T11:07:34-07:00",
"dateModified": "2024-01-10T15:38:18-08:00",
"image": "https://cdn.kqed.org/wp-content/uploads/2020/02/KQED-OG-Image@1x.png"
}
},
"guestAuthors": [],
"slug": "first-half-of-2016-blows-away-temp-records",
"status": "publish",
"sourceUrl": "http://www.climatecentral.org/",
"nprByline": "Andrea Thompson\u003c/br>Climate Central",
"sticky": false,
"source": "Climate Central",
"path": "/science/860496/first-half-of-2016-blows-away-temp-records",
"audioTrackLength": null,
"parsedContent": [
{
"type": "contentString",
"content": "\u003cdiv class=\"post-body\">\u003cp>\u003cp>The first half of 2016 has blown away temperature records, capped off by a record hot June, once again bumping up the odds that 2016 will be the hottest year on record globally, according to data released Tuesday.\u003c/p>\n\u003cp>The monthly numbers from NASA and the National Oceanic and Atmospheric Administration puts the planet on track to surpass 2015 as the hottest on record.\u003c/p>\n\u003caside class=\"pullquote alignright\">Every month this year has been record warm globally.\u003c/aside>\n\u003cp>“2016 has really blown that out of the water,” Gavin Schmidt, the director of NASA’s Goddard Institute for Space Studies, said.\u003c/p>\n\u003cp>While 2016 has gotten a boost from an \u003ca href=\"http://www.climatecentral.org/news/will-la-nina-follow-one-of-strongest-el-ninos-20223\">exceptionally strong El Niño\u003c/a>, the record temps are \u003ca href=\"http://www.climatecentral.org/2015-global-temp-record\">mostly the result\u003c/a> of the excess heat that has built up in Earth’s atmosphere due to accumulating greenhouse gases. That heat is \u003ca href=\"http://sealevel.climatecentral.org/\">raising global sea levels\u003c/a>, disrupting ecosystems and leading to \u003ca href=\"http://www.climatecentral.org/news/climate-change-evolving-role-in-extreme-weather-18501\">more extreme weather events\u003c/a>.\u003c/p>\n\u003cp>Every month this year has been record warm globally. Several months early in the year were the first ever recorded to \u003ca href=\"http://www.climatecentral.org/news/incredible-october-warmth-guarantees-record-hot-2015-19695\">exceed 1°C\u003c/a> (1.8°F) above average.\u003c/p>\n\u003cp>\u003c/p>\u003c/div>",
"attributes": {
"named": {},
"numeric": []
}
},
{
"type": "component",
"content": "",
"name": "ad",
"attributes": {
"named": {
"label": "fullwidth"
},
"numeric": [
"fullwidth"
]
}
},
{
"type": "contentString",
"content": "\u003cdiv class=\"post-body\">\u003cp>\u003c/p>\n\u003cp>With the \u003ca href=\"http://www.climatecentral.org/news/el-nino-is-over-20424\">demise of El Niño\u003c/a>, those temperature departures have dropped slightly, but are still at record-high levels. June was 1.62°F (0.90°C) above the 20th century average \u003ca href=\"http://www.ncdc.noaa.gov/sotc/global/201606\">according to NOAA\u003c/a> and 1.42°F (0.79°C) above the 1951-1980 average, \u003ca href=\"http://data.giss.nasa.gov/gistemp/tabledata_v3/GLB.Ts+dSST.txt\">according to NASA\u003c/a>. (June was also \u003ca href=\"http://www.climatecentral.org/news/june-hottest-on-record-contiguous-us-20502\">record warm for the contiguous U.S.\u003c/a>, in part because of an intense, record-breaking heat wave that swept the Southwest.)\u003c/p>\n\u003cp>\u003cimg loading=\"lazy\" decoding=\"async\" class=\"aligncenter size-full wp-image-860507\" src=\"http://ww2.kqed.org/science/wp-content/uploads/sites/35/2016/07/2016Global_Jan-Jun_CC.jpg\" alt=\"2016Global_Jan-Jun_CC\" width=\"720\" height=\"492\" srcset=\"https://cdn.kqed.org/wp-content/uploads/sites/35/2016/07/2016Global_Jan-Jun_CC.jpg 720w, https://cdn.kqed.org/wp-content/uploads/sites/35/2016/07/2016Global_Jan-Jun_CC-400x273.jpg 400w\" sizes=\"(max-width: 720px) 100vw, 720px\">In NOAA’s records, that makes an unprecedented 14 consecutive record-hot months. While that streak will eventually end, Deke Arndt, the head of the climate monitoring division at NOAA’s National Centers for Environmental Information, said that the long-term warming trend is stll clear.\u003c/p>\n\u003cp>“It’s important to keep perspective here. Even if we aren’t setting records, we are in a neighborhood beyond anything we had seen before early 2015,” Arndt said in an email. “We’ve left the 20th century far behind. This is a big deal.”\u003c/p>\n\u003cp>With June’s record heat, the year-to-date is 1.89°F (1.05°C) above the 20th century average, according to NOAA, and 1.96°F (1.09°C) above the 1951-1980 average according to NASA.\u003c/p>\n\u003cp>The temperatures “are so in excess of any first part of a year that we’ve seen,” Schmidt said.\u003c/p>\n\u003cp>\u003cimg loading=\"lazy\" decoding=\"async\" class=\"aligncenter size-full wp-image-860508\" src=\"http://ww2.kqed.org/science/wp-content/uploads/sites/35/2016/07/2016hottest_yr_so_far_CC.jpg\" alt=\"2016)hottest_yr_so_far_CC\" width=\"720\" height=\"492\" srcset=\"https://cdn.kqed.org/wp-content/uploads/sites/35/2016/07/2016hottest_yr_so_far_CC.jpg 720w, https://cdn.kqed.org/wp-content/uploads/sites/35/2016/07/2016hottest_yr_so_far_CC-400x273.jpg 400w\" sizes=\"(max-width: 720px) 100vw, 720px\">Each agency uses different methods of processing the global temperature data, as well as different baselines for comparing temperatures, leading to slightly different results. Both agree on the long-term warming trend, though.\u003c/p>\n\u003cp>Nations have agreed to a goal of\u003ca href=\"http://www.climatecentral.org/news/see-earths-temperature-spiral-toward-2c-20332\"> keeping warming under 2°C\u003c/a> (3.6°F) above temperatures from preindustrial times — before manmade greenhouse gases began building in the atmosphere — by the end of the century. To put current global temperatures into the perspective of that framework, \u003ca href=\"http://www.climatecentral.org/news/world-flirts-with-1.5C-threshold-20260\">Climate Central has been reanalyzing\u003c/a> the NASA and NOAA data. The two datasets are averaged and then compared to the average from 1881-1910, closer to the preindustrial era.\u003c/p>\n\u003cp>Through June, 2016 was 2.4°F (1.34°C) above the average for that period.\u003c/p>\n\u003cp>The Arctic has been one of the areas of the world that has seen sky-high temperatures this year, which have led to \u003ca href=\"http://www.climatecentral.org/news/arctic-sea-ice-record-low-for-june-20508\">record-low sea ice levels\u003c/a>.\u003c/p>\n\u003cp>Those roasting Arctic temperatures have extended into Alaska. The state’s average temperature is 9°F above the 1925-2000 average for the year through June. The North Slope town of Deadhorse just recorded a temperature of 85°F (29.4°C), the \u003ca href=\"http://wxshift.com/news/heat-wave-to-blanket-us-next-week\">hottest temperature\u003c/a> ever measured within 50 miles of its Arctic coast.\u003c/p>\n\u003cp>The oceans are another area that have seen persistent warmth. According to NOAA, the global average ocean temperature for the first half of the year is 1.42°F (0.79°C) above the 20th century average, the largest such departure in 137 years of records. These elevated temperatures have led to a record third year of a \u003ca href=\"http://www.climatecentral.org/news/coral-bleaching-record-third-year-20467\">global coral bleaching event\u003c/a>.\u003c/p>\n\u003cp>Water changes temperature more slowly than the air or land, which means the global ocean heat is likely to persist for some time. In part because of that, temperatures are likely to stay elevated for the remainder of the year, even if they drop off the record pace.\u003c/p>\n\u003cp>Whether 2016 ultimately bests 2015 depends on how the second half of year goes. Forecasts have backed off predictions of a La Niña this fall; La Niña tends to cool global temperatures.\u003c/p>\n\u003cp>The significant lead that 2016 has makes the odds good that the year will end up the warmest, though there is no guarantee.\u003c/p>\n\u003cp>Regardless of where 2016 falls, the long-term trend of warming is clear, and it has tipped the odds in favor of record heat: Of the 15 warmest years on record, 14 have occurred in the 21st century.\u003c/p>\n\u003cp>“2016 will be one of the warmest on record. Whether it slips to nominally above or nominally below 2015, that may depend on some climate variability factors like the strength of the La Niña,” Arndt said. “But it will share with 2015 the distinction of being, comfortably, the two warmest years on record and warmer, comfortably than any year we’ve measured in modern times.”\u003c/p>\n\u003cp>\u003c/p>\n\u003cp>\u003ca href=\"http://www.climatecentral.org/\">\u003cspan style=\"font-weight: 400\">Climate Central\u003c/span>\u003c/a> \u003ci>\u003cspan style=\"font-weight: 400\">is an independent organization that researches and reports on climate change.\u003c/span>\u003c/i>\u003c/p>\n\n\u003c/div>\u003c/p>",
"attributes": {
"named": {},
"numeric": []
}
}
],
"link": "/science/860496/first-half-of-2016-blows-away-temp-records",
"authors": [
"byline_science_860496"
],
"categories": [
"science_31",
"science_40"
],
"featImg": "science_860501",
"label": "source_science_860496"
},
"science_858143": {
"type": "posts",
"id": "science_858143",
"meta": {
"index": "posts_1716263798",
"site": "science",
"id": "858143",
"score": null,
"sort": [
1468865687000
]
},
"parent": 0,
"labelTerm": {},
"blocks": [],
"publishDate": 1468865687,
"format": "standard",
"title": "Unlocking the Secret to California's Rain",
"headTitle": "Unlocking the Secret to California’s Rain | KQED",
"content": "\u003cp>One thing the drought has brought to wider attention is the role of so-called atmospheric rivers in the state’s weather and water supply.\u003c/p>\n\u003cp>An \u003ca href=\"http://www.esrl.noaa.gov/psd/atmrivers/\" target=\"_blank\" rel=\"nofollow noopener\">atmospheric river\u003c/a> is a narrow band of high-speed wind that sweeps across the Pacific Ocean, often dragging vast amounts of tropical moisture with it. Sometimes dubbed a “horizontal hurricane,” just a handful of these storms can bring California half of its annual rainfall every year. Indeed, an absence of very wet atmospheric rivers over the past few years is one reason California has experienced such a severe drought.\u003c/p>\n\u003cp>Atmospheric rivers are also responsible for the state’s worst flooding events.\u003c/p>\n\u003cp>Their influence on water supply and flood risk depends largely on where they make landfall, and for how long. But until recently, very little research has been devoted to understanding atmospheric rivers. These storms can lash around like an uncontrolled fire hose, and the mechanisms responsible for that behavior have been poorly understood.\u003c/p>\n\u003cp>Marty Ralph is working to change this. For years, he focused his research efforts on atmospheric rivers while chief of the Water Cycle Branch at the NOAA’s Earth System Research Laboratory in Boulder, Colorado. Last year, he moved to the Scripps Institution of Oceanography at U.C. San Diego, where he helped launch the \u003ca href=\"http://cw3e.ucsd.edu/\" target=\"_blank\" rel=\"nofollow noopener\">Center for Western Weather and Water Extremes\u003c/a>.\u003c/p>\n\u003cp>[ad fullwidth]\u003c/p>\n\u003cp>The new center focuses largely on understanding and predicting atmospheric rivers. A few weeks ago, it received a $3 million allocation in the new state budget to take this work further. Water Deeply recently spoke with Ralph about this program.\u003c/p>\n\u003cp>\u003cstrong>Water Deeply: What’s the idea behind this research program?\u003c/strong>\u003c/p>\n\u003cp>\u003cspan class=\"s2\">Marty Ralph: The idea behind the program emerged when I moved from NOAA to the Scripps Institution of Oceanography. I set out to create a center of excellence on storms that are important to the Western U.S. And we’ve created this Center for Western Weather and Water Extremes, \u003cspan class=\"s3\">CW3E\u003c/span>. What we’re doing is bringing a focus to meteorological science and applications that are really focused on Western U.S. issues, and we’re starting with atmospheric rivers in California as the key player.\u003c/span>\u003c/p>\n\u003cp>\u003cstrong>\u003cspan class=\"s2\">Water Deeply: Why is this so important to California?\u003c/span>\u003c/strong>\u003c/p>\n\u003cp>\u003cspan class=\"s2\">Ralph: The really fundamental idea is that California has unique information needs to support its decision-making on water, whether it’s for flood control or water supply. The type of weather that is key to those decisions is these atmospheric river type storms. These provide about 30–50 percent of the state’s water supply each year, in Northern California especially. And that happens in just a handful of days \u003c/span>– maybe 10 days on average – each storm being on the order of one day long. They produce the lion’s share of the water supply, and really the variability on the annual water supply really hinges on the number of atmospheric river events, rather than how strong they are.\u003c/p>\n\u003cp>\u003cspan class=\"s2\">An analysis showed 85 percent of the variability from year to year in annual precipitation in the Sacramento River basin was due to variations in the top 5 percent wettest days of the year. Those top 5 percent wettest days are mostly atmospheric river events. So there’s a seasonal role. There’s also a hazard, too. Somewhere between 80 and 90 percent of the major river flood events happen as a result of landfalling atmospheric rivers.\u003c/span>\u003c/p>\n\u003cp>\u003cstrong>\u003cspan class=\"s2\">Water Deeply: How will this new $3 million in funding from the state of California be useful?\u003c/span>\u003c/strong>\u003c/p>\n\u003cp>\u003cspan class=\"s2\">Ralph: It will help us establish a weather prediction model that’s tailored to the atmospheric river problem and the extreme precipitation that’s associated with it. For example, national models, like those used by the National Weather Service and the like, they have to serve the nation 24-7, 365 days a year. A single model that does really well at, say, hurricanes or thunderstorms may not do so well at atmospheric rivers. Similarly, a national model that really did the atmospheric river problem well may not do so well on those other problems.\u003c/span>\u003c/p>\n\u003cp>\u003cspan class=\"s2\">This is how meteorology is evolving. There’s no one perfect prediction model and we are establishing what we call \u003ca href=\"http://cw3e.ucsd.edu/?page_id=4206\" target=\"_blank\" rel=\"noopener\">\u003cspan class=\"s3\">West-WRF\u003c/span>\u003c/a>, the Western Weather Research and Forecasting model. It is a very versatile model, and we are tailoring it to the western U.S. and, in particular, California precipitation events, so we can predict those as best as possible.\u003c/span>\u003c/p>\n\u003cp>\u003cspan class=\"s2\">We’re also developing tools for diagnosing atmospheric river conditions as they are occurring, and helping show what the prediction of them looks like. So in other words, we’re doing a bit for atmospheric rivers in California what meteorology has done for hurricanes elsewhere in the country \u003c/span>– developing specialized tools that really represent that phenomenon and the uncertainty and predictability of it so we can help inform people who are making decisions based on forecasts, whether they are emergency managers or water managers.\u003c/p>\n\u003cp>\u003cstrong>\u003cspan class=\"s2\">Water Deeply: How far along is this new forecasting tool?\u003c/span>\u003c/strong>\u003c/p>\n\u003cp>\u003cspan class=\"s2\">Ralph: We have some prototypes running right now on our website. In the summer it’s not very exciting, because there’s not a hell of a lot going on. We used them in winter to try them out in real time, then used the summer to diagnose how they did and try to improve on them. We’ve got a running start. We’ve had some seed funding and gotten things rolling a little bit from that.\u003c/span>\u003c/p>\n\u003cp>\u003cstrong>\u003cspan class=\"s2\">Water Deeply: What are your goals for the forecasting model?\u003c/span>\u003c/strong>\u003c/p>\n\u003cp>\u003cspan class=\"s2\">Ralph: The goal is for it to have long-term capability to support the region. One of the key applications we’re supporting is called \u003ca href=\"http://cw3e.ucsd.edu/FIRO/\" target=\"_blank\" rel=\"noopener\">\u003cspan class=\"s3\">forecast-informed reservoir operations\u003c/span>\u003c/a> (FIRO). We have a collaboration going on with the Sonoma County Water Agency, at Lake Mendocino on the Russian River, which provides water to 600,000 people, the wine grape industry and to help recover endangered fish populations. They do a lot of water management. The U.S. Army Corps of Engineers is the other operator of that dam for flood control.\u003c/span>\u003c/p>\n\u003cp>\u003cspan class=\"s2\">We have a steering committee that’s looking at assessing the viability of using atmospheric river forecasts to help operate Lake Mendocino. It’s a several-year effort. We’ve just gotten a work plan completed for a five-year program to look at the viability of using this method. It has the potential to increase water supply available for the state.\u003c/span>\u003c/p>\n\u003cp>\u003cspan class=\"s2\">Use of FIRO in reservoir operations is \u003ca href=\"http://ensia.com/features/how-better-weather-forecasting-can-help-stretch-water-supplies/\" target=\"_blank\" rel=\"noopener\">\u003cspan class=\"s3\">relatively tough to do\u003c/span>\u003c/a> given that, when dams were built, it wasn’t really allowable. This atmospheric river program will help us ensure those tools are available, with the best skill possible, to support FIRO. And that we can explore its potential for use on other reservoirs.\u003c/span>\u003c/p>\n\u003cp>\u003cstrong>\u003cspan class=\"s2\">Water Deeply: When will you have a working atmospheric river model ready to use in regular weather forecasting?\u003c/span>\u003c/strong>\u003c/p>\n\u003cp>\u003cspan class=\"s2\">Ralph: In a way, it’s already doing that. It’s being used in ensemble predictions\u003c/span>– in which we use many different forecast models joined together and we get an average answer. We’re contributing our West-WRF model to that approach. So it’s actually happening in a small way already.\u003c/p>\n\u003cp>\u003cspan class=\"s2\">But our goal is to have it be also available to produce its own forecast, without the ensemble, and be valuable in its own right. Our initial estimations are that it performed pretty well relative to other national models last winter. And now we’re just in the process of starting to refine it. That’s a tough science problem to do it right. It takes quite a lot of effort and time and people.\u003c/span>\u003c/p>\n\u003cp>\u003cspan class=\"s2\">\u003cstrong>Water Deeply: How does the El Niño (ENSO) condition influence atmospheric rivers?\u003c/strong>\u003c/span>\u003c/p>\n\u003cp>\u003cspan class=\"s2\">Ralph: ENSO modulates the position and structure of the Pacific storm track, which in turn affects the preferred locations of the atmospheric river events.\u003c/span>\u003c/p>\n\u003cp>\u003cspan class=\"s2\">In cases where ENSO also creates a warm coastal sea surface temperature anomaly, that extra warmth can cause added evaporation and heating of atmospheric rivers as they cross over that warm water, thereby enhancing the potential for precipitation upon landfall.\u003c/span>\u003c/p>\n\u003cp>\u003cstrong>\u003cspan class=\"s2\">Water Deeply: Does your atmospheric river forecast model take into account the ENSO condition? If so, how is that integrated?\u003c/span>\u003c/strong>\u003c/p>\n\u003cp>\u003cspan class=\"s2\">Ralph: ENSO conditions are accounted for through their influence on sea surface temperatures, which are part of the boundary conditions used in weather forecast models, including our version focused on atmospheric rivers.\u003c/span>\u003c/p>\n\u003cp>\u003cstrong>\u003cspan class=\"s2\">Water Deeply: A couple of years ago, you set up a network of ground-based sensors in the American River watershed to track atmospheric rivers as they came onshore. What’s the status of that sensor network now?\u003c/span>\u003c/strong>\u003c/p>\n\u003cp>\u003cspan class=\"s2\">Ralph: The ground-based networks have expanded across California, including a roughly 100-station network spread across the state. Those include four different sensor types. There are also extra new observations on the Russian River watershed.\u003c/span>\u003c/p>\n\u003cp>\u003cspan class=\"s2\">And last winter I led the first-ever operational atmospheric river\u003ca href=\"https://www.washingtonpost.com/news/capital-weather-gang/wp/2016/02/18/hurricane-hunters-fly-into-atmospheric-rivers-for-first-time-key-to-weather-extremes-in-the-west/\" target=\"_blank\" rel=\"noopener\">\u003cspan class=\"s4\">airborne reconnaissance\u003c/span>\u003c/a> effort. It learned from our past research efforts and made use of two Air Force C-130 aircraft normally deployed for hurricane recon for the eastern part of the nation.\u003c/span>\u003c/p>\n\u003cp>\u003cstrong>\u003cspan class=\"s2\">Water Deeply: Do atmospheric rivers affect states other than California? And does your research and modeling include atmospheric river forecasting in those states?\u003c/span>\u003c/strong>\u003c/p>\n\u003cp>\u003cspan class=\"s2\">Ralph: Atmospheric rivers do affect other states, especially the West Coast states, but also the next set of states inland (Ariz., Nev., Utah, Idaho, Mont., Colo.).\u003c/span>\u003c/p>\n\u003cp>\u003cspan class=\"s2\">There is also emerging recognition that atmospheric rivers can be key sources of extreme precipitation in the Eastern U.S. Although other phenomena, such as landfalling hurricanes and big thunderstorm systems, are also important there.\u003c/span>\u003c/p>\n\u003cp>[ad floatright]\u003c/p>\n\u003cp>\u003ci>\u003cspan style=\"font-weight: 400\">This article originally appeared on \u003c/span>\u003c/i>\u003ca href=\"https://mail.kqed.org/owa/redir.aspx?C=9e4bb0e1a7d74f24ba4684ef2533053d&URL=https%3a%2f%2fwww.newsdeeply.com%2fwater\">\u003ci>\u003cspan style=\"font-weight: 400\">Water Deeply\u003c/span>\u003c/i>\u003c/a>\u003ci>\u003cspan style=\"font-weight: 400\">, and you can find it \u003c/span>\u003c/i>\u003ca href=\"https://www.newsdeeply.com/water/articles/2016/07/18/unlocking-the-wests-weather-maker\">\u003ci>\u003cspan style=\"font-weight: 400\">here\u003c/span>\u003c/i>\u003c/a>\u003ci>\u003cspan style=\"font-weight: 400\">. For important news about the California drought, you can \u003c/span>\u003c/i>\u003ca href=\"https://mail.kqed.org/owa/redir.aspx?C=9e4bb0e1a7d74f24ba4684ef2533053d&URL=http%3a%2f%2fwaterdeeply.us5.list-manage.com%2fsubscribe%3fu%3d8b78e9a34ff7443ec1e8c62c6%26id%3d2947becb78\">\u003ci>\u003cspan style=\"font-weight: 400\">sign up\u003c/span>\u003c/i>\u003c/a>\u003ci>\u003cspan style=\"font-weight: 400\"> to the Water Deeply email list.\u003c/span>\u003c/i>\u003c/p>\n\n",
"stats": {
"hasVideo": false,
"hasChartOrMap": false,
"hasAudio": false,
"hasPolis": false,
"wordCount": 1677,
"hasGoogleForm": false,
"hasGallery": false,
"hasHearkenModule": false,
"iframeSrcs": [],
"paragraphCount": 38
},
"modified": 1704929905,
"excerpt": "Atmospheric rivers are responsible for a huge share of California's precipitation. Weather expert Marty Ralph explains new efforts that aim to forecast these storms for the first time.",
"headData": {
"twImgId": "",
"twTitle": "",
"ogTitle": "",
"ogImgId": "",
"twDescription": "",
"description": "Atmospheric rivers are responsible for a huge share of California's precipitation. Weather expert Marty Ralph explains new efforts that aim to forecast these storms for the first time.",
"title": "Unlocking the Secret to California's Rain | KQED",
"ogDescription": "",
"schema": {
"@context": "https://schema.org",
"@type": "Article",
"headline": "Unlocking the Secret to California's Rain",
"datePublished": "2016-07-18T11:14:47-07:00",
"dateModified": "2024-01-10T15:38:25-08:00",
"image": "https://cdn.kqed.org/wp-content/uploads/2020/02/KQED-OG-Image@1x.png"
}
},
"guestAuthors": [],
"slug": "unlocking-the-secret-to-californias-rain",
"status": "publish",
"sourceUrl": "https://www.newsdeeply.com/water/",
"nprByline": "Matt Weiser\u003c/br>Water Deeply",
"sticky": false,
"source": "Water Deeply",
"path": "/science/858143/unlocking-the-secret-to-californias-rain",
"audioTrackLength": null,
"parsedContent": [
{
"type": "contentString",
"content": "\u003cdiv class=\"post-body\">\u003cp>\u003cp>One thing the drought has brought to wider attention is the role of so-called atmospheric rivers in the state’s weather and water supply.\u003c/p>\n\u003cp>An \u003ca href=\"http://www.esrl.noaa.gov/psd/atmrivers/\" target=\"_blank\" rel=\"nofollow noopener\">atmospheric river\u003c/a> is a narrow band of high-speed wind that sweeps across the Pacific Ocean, often dragging vast amounts of tropical moisture with it. Sometimes dubbed a “horizontal hurricane,” just a handful of these storms can bring California half of its annual rainfall every year. Indeed, an absence of very wet atmospheric rivers over the past few years is one reason California has experienced such a severe drought.\u003c/p>\n\u003cp>Atmospheric rivers are also responsible for the state’s worst flooding events.\u003c/p>\n\u003cp>Their influence on water supply and flood risk depends largely on where they make landfall, and for how long. But until recently, very little research has been devoted to understanding atmospheric rivers. These storms can lash around like an uncontrolled fire hose, and the mechanisms responsible for that behavior have been poorly understood.\u003c/p>\n\u003cp>Marty Ralph is working to change this. For years, he focused his research efforts on atmospheric rivers while chief of the Water Cycle Branch at the NOAA’s Earth System Research Laboratory in Boulder, Colorado. Last year, he moved to the Scripps Institution of Oceanography at U.C. San Diego, where he helped launch the \u003ca href=\"http://cw3e.ucsd.edu/\" target=\"_blank\" rel=\"nofollow noopener\">Center for Western Weather and Water Extremes\u003c/a>.\u003c/p>\n\u003cp>\u003c/p>\u003c/div>",
"attributes": {
"named": {},
"numeric": []
}
},
{
"type": "component",
"content": "",
"name": "ad",
"attributes": {
"named": {
"label": "fullwidth"
},
"numeric": [
"fullwidth"
]
}
},
{
"type": "contentString",
"content": "\u003cdiv class=\"post-body\">\u003cp>\u003c/p>\n\u003cp>The new center focuses largely on understanding and predicting atmospheric rivers. A few weeks ago, it received a $3 million allocation in the new state budget to take this work further. Water Deeply recently spoke with Ralph about this program.\u003c/p>\n\u003cp>\u003cstrong>Water Deeply: What’s the idea behind this research program?\u003c/strong>\u003c/p>\n\u003cp>\u003cspan class=\"s2\">Marty Ralph: The idea behind the program emerged when I moved from NOAA to the Scripps Institution of Oceanography. I set out to create a center of excellence on storms that are important to the Western U.S. And we’ve created this Center for Western Weather and Water Extremes, \u003cspan class=\"s3\">CW3E\u003c/span>. What we’re doing is bringing a focus to meteorological science and applications that are really focused on Western U.S. issues, and we’re starting with atmospheric rivers in California as the key player.\u003c/span>\u003c/p>\n\u003cp>\u003cstrong>\u003cspan class=\"s2\">Water Deeply: Why is this so important to California?\u003c/span>\u003c/strong>\u003c/p>\n\u003cp>\u003cspan class=\"s2\">Ralph: The really fundamental idea is that California has unique information needs to support its decision-making on water, whether it’s for flood control or water supply. The type of weather that is key to those decisions is these atmospheric river type storms. These provide about 30–50 percent of the state’s water supply each year, in Northern California especially. And that happens in just a handful of days \u003c/span>– maybe 10 days on average – each storm being on the order of one day long. They produce the lion’s share of the water supply, and really the variability on the annual water supply really hinges on the number of atmospheric river events, rather than how strong they are.\u003c/p>\n\u003cp>\u003cspan class=\"s2\">An analysis showed 85 percent of the variability from year to year in annual precipitation in the Sacramento River basin was due to variations in the top 5 percent wettest days of the year. Those top 5 percent wettest days are mostly atmospheric river events. So there’s a seasonal role. There’s also a hazard, too. Somewhere between 80 and 90 percent of the major river flood events happen as a result of landfalling atmospheric rivers.\u003c/span>\u003c/p>\n\u003cp>\u003cstrong>\u003cspan class=\"s2\">Water Deeply: How will this new $3 million in funding from the state of California be useful?\u003c/span>\u003c/strong>\u003c/p>\n\u003cp>\u003cspan class=\"s2\">Ralph: It will help us establish a weather prediction model that’s tailored to the atmospheric river problem and the extreme precipitation that’s associated with it. For example, national models, like those used by the National Weather Service and the like, they have to serve the nation 24-7, 365 days a year. A single model that does really well at, say, hurricanes or thunderstorms may not do so well at atmospheric rivers. Similarly, a national model that really did the atmospheric river problem well may not do so well on those other problems.\u003c/span>\u003c/p>\n\u003cp>\u003cspan class=\"s2\">This is how meteorology is evolving. There’s no one perfect prediction model and we are establishing what we call \u003ca href=\"http://cw3e.ucsd.edu/?page_id=4206\" target=\"_blank\" rel=\"noopener\">\u003cspan class=\"s3\">West-WRF\u003c/span>\u003c/a>, the Western Weather Research and Forecasting model. It is a very versatile model, and we are tailoring it to the western U.S. and, in particular, California precipitation events, so we can predict those as best as possible.\u003c/span>\u003c/p>\n\u003cp>\u003cspan class=\"s2\">We’re also developing tools for diagnosing atmospheric river conditions as they are occurring, and helping show what the prediction of them looks like. So in other words, we’re doing a bit for atmospheric rivers in California what meteorology has done for hurricanes elsewhere in the country \u003c/span>– developing specialized tools that really represent that phenomenon and the uncertainty and predictability of it so we can help inform people who are making decisions based on forecasts, whether they are emergency managers or water managers.\u003c/p>\n\u003cp>\u003cstrong>\u003cspan class=\"s2\">Water Deeply: How far along is this new forecasting tool?\u003c/span>\u003c/strong>\u003c/p>\n\u003cp>\u003cspan class=\"s2\">Ralph: We have some prototypes running right now on our website. In the summer it’s not very exciting, because there’s not a hell of a lot going on. We used them in winter to try them out in real time, then used the summer to diagnose how they did and try to improve on them. We’ve got a running start. We’ve had some seed funding and gotten things rolling a little bit from that.\u003c/span>\u003c/p>\n\u003cp>\u003cstrong>\u003cspan class=\"s2\">Water Deeply: What are your goals for the forecasting model?\u003c/span>\u003c/strong>\u003c/p>\n\u003cp>\u003cspan class=\"s2\">Ralph: The goal is for it to have long-term capability to support the region. One of the key applications we’re supporting is called \u003ca href=\"http://cw3e.ucsd.edu/FIRO/\" target=\"_blank\" rel=\"noopener\">\u003cspan class=\"s3\">forecast-informed reservoir operations\u003c/span>\u003c/a> (FIRO). We have a collaboration going on with the Sonoma County Water Agency, at Lake Mendocino on the Russian River, which provides water to 600,000 people, the wine grape industry and to help recover endangered fish populations. They do a lot of water management. The U.S. Army Corps of Engineers is the other operator of that dam for flood control.\u003c/span>\u003c/p>\n\u003cp>\u003cspan class=\"s2\">We have a steering committee that’s looking at assessing the viability of using atmospheric river forecasts to help operate Lake Mendocino. It’s a several-year effort. We’ve just gotten a work plan completed for a five-year program to look at the viability of using this method. It has the potential to increase water supply available for the state.\u003c/span>\u003c/p>\n\u003cp>\u003cspan class=\"s2\">Use of FIRO in reservoir operations is \u003ca href=\"http://ensia.com/features/how-better-weather-forecasting-can-help-stretch-water-supplies/\" target=\"_blank\" rel=\"noopener\">\u003cspan class=\"s3\">relatively tough to do\u003c/span>\u003c/a> given that, when dams were built, it wasn’t really allowable. This atmospheric river program will help us ensure those tools are available, with the best skill possible, to support FIRO. And that we can explore its potential for use on other reservoirs.\u003c/span>\u003c/p>\n\u003cp>\u003cstrong>\u003cspan class=\"s2\">Water Deeply: When will you have a working atmospheric river model ready to use in regular weather forecasting?\u003c/span>\u003c/strong>\u003c/p>\n\u003cp>\u003cspan class=\"s2\">Ralph: In a way, it’s already doing that. It’s being used in ensemble predictions\u003c/span>– in which we use many different forecast models joined together and we get an average answer. We’re contributing our West-WRF model to that approach. So it’s actually happening in a small way already.\u003c/p>\n\u003cp>\u003cspan class=\"s2\">But our goal is to have it be also available to produce its own forecast, without the ensemble, and be valuable in its own right. Our initial estimations are that it performed pretty well relative to other national models last winter. And now we’re just in the process of starting to refine it. That’s a tough science problem to do it right. It takes quite a lot of effort and time and people.\u003c/span>\u003c/p>\n\u003cp>\u003cspan class=\"s2\">\u003cstrong>Water Deeply: How does the El Niño (ENSO) condition influence atmospheric rivers?\u003c/strong>\u003c/span>\u003c/p>\n\u003cp>\u003cspan class=\"s2\">Ralph: ENSO modulates the position and structure of the Pacific storm track, which in turn affects the preferred locations of the atmospheric river events.\u003c/span>\u003c/p>\n\u003cp>\u003cspan class=\"s2\">In cases where ENSO also creates a warm coastal sea surface temperature anomaly, that extra warmth can cause added evaporation and heating of atmospheric rivers as they cross over that warm water, thereby enhancing the potential for precipitation upon landfall.\u003c/span>\u003c/p>\n\u003cp>\u003cstrong>\u003cspan class=\"s2\">Water Deeply: Does your atmospheric river forecast model take into account the ENSO condition? If so, how is that integrated?\u003c/span>\u003c/strong>\u003c/p>\n\u003cp>\u003cspan class=\"s2\">Ralph: ENSO conditions are accounted for through their influence on sea surface temperatures, which are part of the boundary conditions used in weather forecast models, including our version focused on atmospheric rivers.\u003c/span>\u003c/p>\n\u003cp>\u003cstrong>\u003cspan class=\"s2\">Water Deeply: A couple of years ago, you set up a network of ground-based sensors in the American River watershed to track atmospheric rivers as they came onshore. What’s the status of that sensor network now?\u003c/span>\u003c/strong>\u003c/p>\n\u003cp>\u003cspan class=\"s2\">Ralph: The ground-based networks have expanded across California, including a roughly 100-station network spread across the state. Those include four different sensor types. There are also extra new observations on the Russian River watershed.\u003c/span>\u003c/p>\n\u003cp>\u003cspan class=\"s2\">And last winter I led the first-ever operational atmospheric river\u003ca href=\"https://www.washingtonpost.com/news/capital-weather-gang/wp/2016/02/18/hurricane-hunters-fly-into-atmospheric-rivers-for-first-time-key-to-weather-extremes-in-the-west/\" target=\"_blank\" rel=\"noopener\">\u003cspan class=\"s4\">airborne reconnaissance\u003c/span>\u003c/a> effort. It learned from our past research efforts and made use of two Air Force C-130 aircraft normally deployed for hurricane recon for the eastern part of the nation.\u003c/span>\u003c/p>\n\u003cp>\u003cstrong>\u003cspan class=\"s2\">Water Deeply: Do atmospheric rivers affect states other than California? And does your research and modeling include atmospheric river forecasting in those states?\u003c/span>\u003c/strong>\u003c/p>\n\u003cp>\u003cspan class=\"s2\">Ralph: Atmospheric rivers do affect other states, especially the West Coast states, but also the next set of states inland (Ariz., Nev., Utah, Idaho, Mont., Colo.).\u003c/span>\u003c/p>\n\u003cp>\u003cspan class=\"s2\">There is also emerging recognition that atmospheric rivers can be key sources of extreme precipitation in the Eastern U.S. Although other phenomena, such as landfalling hurricanes and big thunderstorm systems, are also important there.\u003c/span>\u003c/p>\n\u003cp>\u003c/p>\u003c/div>",
"attributes": {
"named": {},
"numeric": []
}
},
{
"type": "component",
"content": "",
"name": "ad",
"attributes": {
"named": {
"label": "floatright"
},
"numeric": [
"floatright"
]
}
},
{
"type": "contentString",
"content": "\u003cdiv class=\"post-body\">\u003cp>\u003c/p>\n\u003cp>\u003ci>\u003cspan style=\"font-weight: 400\">This article originally appeared on \u003c/span>\u003c/i>\u003ca href=\"https://mail.kqed.org/owa/redir.aspx?C=9e4bb0e1a7d74f24ba4684ef2533053d&URL=https%3a%2f%2fwww.newsdeeply.com%2fwater\">\u003ci>\u003cspan style=\"font-weight: 400\">Water Deeply\u003c/span>\u003c/i>\u003c/a>\u003ci>\u003cspan style=\"font-weight: 400\">, and you can find it \u003c/span>\u003c/i>\u003ca href=\"https://www.newsdeeply.com/water/articles/2016/07/18/unlocking-the-wests-weather-maker\">\u003ci>\u003cspan style=\"font-weight: 400\">here\u003c/span>\u003c/i>\u003c/a>\u003ci>\u003cspan style=\"font-weight: 400\">. For important news about the California drought, you can \u003c/span>\u003c/i>\u003ca href=\"https://mail.kqed.org/owa/redir.aspx?C=9e4bb0e1a7d74f24ba4684ef2533053d&URL=http%3a%2f%2fwaterdeeply.us5.list-manage.com%2fsubscribe%3fu%3d8b78e9a34ff7443ec1e8c62c6%26id%3d2947becb78\">\u003ci>\u003cspan style=\"font-weight: 400\">sign up\u003c/span>\u003c/i>\u003c/a>\u003ci>\u003cspan style=\"font-weight: 400\"> to the Water Deeply email list.\u003c/span>\u003c/i>\u003c/p>\n\n\u003c/div>\u003c/p>",
"attributes": {
"named": {},
"numeric": []
}
}
],
"link": "/science/858143/unlocking-the-secret-to-californias-rain",
"authors": [
"byline_science_858143"
],
"categories": [
"science_31",
"science_40",
"science_98"
],
"featImg": "science_858149",
"label": "source_science_858143"
},
"science_850997": {
"type": "posts",
"id": "science_850997",
"meta": {
"index": "posts_1716263798",
"site": "science",
"id": "850997",
"score": null,
"sort": [
1468605858000
]
},
"parent": 0,
"labelTerm": {},
"blocks": [],
"publishDate": 1468605858,
"format": "standard",
"title": "Oceans Eating Away at Yet Another Part of Antarctica",
"headTitle": "Oceans Eating Away at Yet Another Part of Antarctica | KQED",
"content": "\u003cp>The Antarctic Peninsula is one of the fastest warming spots on the planet, and it was thought that the rising air temperature was driving the melt of the glaciers along its fringes. But it is actually warm ocean waters that are \u003ca href=\"http://www.climatecentral.org/news/look-out-below-antarctic-melting-from-underneath-16128\">eating away at the ice\u003c/a> along part of its western side, a group of scientists reported Thursday in the \u003ca href=\"http://science.sciencemag.org/cgi/doi/10.1126/science.aae0017\">journal Science\u003c/a>.\u003c/p>\n\u003caside class=\"pullquote alignright\">‘Ice losses from around Antarctica owe as much to warmer ocean temperatures … as to rises in air temperature.’\u003ccite>Robert Bingham, University of Edinburgh\u003c/cite>\u003c/aside>\n\u003cp>The study adds to a spate of research in the last few years that have pointed the finger at warm ocean currents as the key culprit in undercutting the glaciers that serve as doorstops to Antarctica’s massive ice sheets. As those glaciers wilt away, the land-bound ice behind them can \u003ca href=\"http://www.climatecentral.org/news/antarctic-ice-shelves-shrinking-19015\">flow faster to the sea\u003c/a>, with the potential to significantly raise global sea levels. Coastal areas around the world will be swamped, putting millions of people and billions of dollars of infrastructure in peril.\u003c/p>\n\u003cp>“Now we know that ocean warming is not only affecting the large ice streams and ice shelves of West Antarctica, but also the small glaciers of the separate Antarctic Peninsula ice sheet,” study co-author \u003ca href=\"https://www.dur.ac.uk/geography/staff/geogstaffhidden/?id=14129\">Alison Cook\u003c/a> said in an email. “Understanding this link will improve predictions of sea level rise.”\u003c/p>\n\u003cp>\u003cstrong>‘Striking Similarity’\u003c/strong>\u003c/p>\n\u003cp>While the rest of the continent’s coastline features vast rivers of ice that flow to the sea, the west side of the Antarctic Peninsula is made up of “over 600 small glaciers of varying shapes and sizes,” Cook, a glaciologist at Durham University in England, said, few of which had been studied in any detail.\u003c/p>\n\u003cp>[ad fullwidth]\u003c/p>\n\u003cp>The peninsula — an arm of land that stretches up from the rest of Antarctica toward the southern tip of South America — has warmed\u003ca href=\"http://www.climatecentral.org/news/soaring-temperatures-in-west-antarctica-could-destabilize-ice-15409\"> about 5°F (2.8°C) in the past 50 years\u003c/a>. Unsurprisingly, the region has seen considerable ice melt, and that melt was blamed on the \u003ca href=\"http://www.climatecentral.org/news/antarctica-record-high-temp-bodes-ill-for-ice-18840\">surging air temperatures\u003c/a> driven by \u003ca href=\"http://www.climatecentral.org/news/antarctica-record-high-temp-bodes-ill-for-ice-18840\">the broader warming\u003c/a> of the planet’s atmosphere.\u003c/p>\n\u003cp>It was clear that there was a distinct pattern of melt from north to south, though. In the northwest, the region of the largest air temperature increase, the glaciers paradoxically seemed fairly stable, while in the cooler southwest there had been considerable retreat.\u003c/p>\n\u003cp>Cook and her colleagues looked at ocean temperatures along the west coast of the peninsula and found a pattern of temperatures at mid-ocean depths that mirrored what was happening to the glaciers.\u003c/p>\n\u003cp>“The more we studied this, the more it became apparent that this followed a striking similarity to the glacier retreat rates,” Cook said.\u003c/p>\n\u003cp>At the southern end of the western side of the peninsula, warm Circumpolar Deep Water that has welled up meets the glaciers and wears away at their fronts.\u003c/p>\n\u003cp>At the northern end of the peninsula, the glaciers terminate in colder waters that come from a different source, keeping the fronts of those glaciers much more stable.\u003c/p>\n\u003cp>“This is a great study with convincing evidence that the northern and southern west coast of AP (Antarctic Peninsula) have very different oceanic regimes and the correspondence with the pattern of glacier retreat is undeniably strong,” Eric Rignot, a NASA glaciologist said in an email.\u003c/p>\n\u003cp>\u003cstrong>More Measurements Needed\u003c/strong>\u003c/p>\n\u003cp>The same Circumpolar Deep Water implicated in the new study is thought to be eroding glaciers elsewhere along the West Antarctic coast, including an adjacent area of the \u003ca href=\"http://www.climatecentral.org/news/overlooked-area-antarctica-major-ice-loss-20408\">Bellingshausen Sea coast\u003c/a> where a recent study suggested melt had been happening for much longer than previously thought.\u003c/p>\n\u003cp>“This study underscores what many of us in the scientific community have been suggesting for some time, namely that ice losses from around Antarctica owe as much to warmer ocean temperatures reaching parts of Antarctica’s coastline as to rises in air temperature,” \u003ca href=\"http://www.geos.ed.ac.uk/homes/rbingha2/\">Robert Bingham\u003c/a>, a glaciologist at the University of Edinburgh, said in an email. Bingham, who led the Bellingshausen Sea study, was not part of the new research.\u003c/p>\n\u003cp>While the glaciers along the Antarctic Peninsula are much smaller than those in the Bellingshausen Area, or the Amundsen Sea Embayment, where some of the fastest-slowing and retreating glaciers are found, their potential to contribute to sea level rise cannot be discounted. While they make up only 4 percent of Antarctica’s total ice sheet area, they have accounted for about 25 percent of its mass loss.\u003c/p>\n\u003cp>“The AP ice sheet is one of the largest current contributors to sea level rise and as the glaciers here are highly sensitive to changes in the environment they are key indicators of how the ice will respond to future changes,” Cook said.\u003c/p>\n\u003cp>The study’s findings lay bare the need for better understanding and monitoring of both Antarctica’s glaciers and the oceans lapping at them, Bingham and Rignot said.\u003c/p>\n\u003cp>“Our ultimate aim must be to predict how ocean-driven ice losses from Antarctica will impact upon global sea level rise,” Bingham said. “To provide such predictions, it’s clear that we need a far better understanding of ice-ocean interactions all around the fringes of Antarctica, and in particular to monitor changes occurring in the ice at the same time as changes in the ocean.”\u003c/p>\n\u003cp>\u003c/p>\n\u003cp>\u003ca href=\"http://www.climatecentral.org/\">\u003cspan style=\"font-weight: 400\">Climate Central\u003c/span>\u003c/a> \u003ci>\u003cspan style=\"font-weight: 400\">is an independent organization that researches and reports on climate change.\u003c/span>\u003c/i>\u003c/p>\n\n",
"stats": {
"hasVideo": false,
"hasChartOrMap": false,
"hasAudio": false,
"hasPolis": false,
"wordCount": 919,
"hasGoogleForm": false,
"hasGallery": false,
"hasHearkenModule": false,
"iframeSrcs": [],
"paragraphCount": 22
},
"modified": 1704929915,
"excerpt": "Warm ocean waters, not rising air temperatures, are causing the retreat of glaciers on Antarctica's western edge.",
"headData": {
"twImgId": "",
"twTitle": "",
"ogTitle": "",
"ogImgId": "",
"twDescription": "",
"description": "Warm ocean waters, not rising air temperatures, are causing the retreat of glaciers on Antarctica's western edge.",
"title": "Oceans Eating Away at Yet Another Part of Antarctica | KQED",
"ogDescription": "",
"schema": {
"@context": "https://schema.org",
"@type": "Article",
"headline": "Oceans Eating Away at Yet Another Part of Antarctica",
"datePublished": "2016-07-15T11:04:18-07:00",
"dateModified": "2024-01-10T15:38:35-08:00",
"image": "https://cdn.kqed.org/wp-content/uploads/2020/02/KQED-OG-Image@1x.png"
}
},
"guestAuthors": [],
"slug": "oceans-eating-away-at-yet-another-part-of-antarctica",
"status": "publish",
"sourceUrl": "http://www.climatecentral.org/",
"nprByline": "Andrea Thompson\u003c/br>Climate Central",
"sticky": false,
"source": "Climate Central",
"path": "/science/850997/oceans-eating-away-at-yet-another-part-of-antarctica",
"audioTrackLength": null,
"parsedContent": [
{
"type": "contentString",
"content": "\u003cdiv class=\"post-body\">\u003cp>\u003cp>The Antarctic Peninsula is one of the fastest warming spots on the planet, and it was thought that the rising air temperature was driving the melt of the glaciers along its fringes. But it is actually warm ocean waters that are \u003ca href=\"http://www.climatecentral.org/news/look-out-below-antarctic-melting-from-underneath-16128\">eating away at the ice\u003c/a> along part of its western side, a group of scientists reported Thursday in the \u003ca href=\"http://science.sciencemag.org/cgi/doi/10.1126/science.aae0017\">journal Science\u003c/a>.\u003c/p>\n\u003caside class=\"pullquote alignright\">‘Ice losses from around Antarctica owe as much to warmer ocean temperatures … as to rises in air temperature.’\u003ccite>Robert Bingham, University of Edinburgh\u003c/cite>\u003c/aside>\n\u003cp>The study adds to a spate of research in the last few years that have pointed the finger at warm ocean currents as the key culprit in undercutting the glaciers that serve as doorstops to Antarctica’s massive ice sheets. As those glaciers wilt away, the land-bound ice behind them can \u003ca href=\"http://www.climatecentral.org/news/antarctic-ice-shelves-shrinking-19015\">flow faster to the sea\u003c/a>, with the potential to significantly raise global sea levels. Coastal areas around the world will be swamped, putting millions of people and billions of dollars of infrastructure in peril.\u003c/p>\n\u003cp>“Now we know that ocean warming is not only affecting the large ice streams and ice shelves of West Antarctica, but also the small glaciers of the separate Antarctic Peninsula ice sheet,” study co-author \u003ca href=\"https://www.dur.ac.uk/geography/staff/geogstaffhidden/?id=14129\">Alison Cook\u003c/a> said in an email. “Understanding this link will improve predictions of sea level rise.”\u003c/p>\n\u003cp>\u003cstrong>‘Striking Similarity’\u003c/strong>\u003c/p>\n\u003cp>While the rest of the continent’s coastline features vast rivers of ice that flow to the sea, the west side of the Antarctic Peninsula is made up of “over 600 small glaciers of varying shapes and sizes,” Cook, a glaciologist at Durham University in England, said, few of which had been studied in any detail.\u003c/p>\n\u003cp>\u003c/p>\u003c/div>",
"attributes": {
"named": {},
"numeric": []
}
},
{
"type": "component",
"content": "",
"name": "ad",
"attributes": {
"named": {
"label": "fullwidth"
},
"numeric": [
"fullwidth"
]
}
},
{
"type": "contentString",
"content": "\u003cdiv class=\"post-body\">\u003cp>\u003c/p>\n\u003cp>The peninsula — an arm of land that stretches up from the rest of Antarctica toward the southern tip of South America — has warmed\u003ca href=\"http://www.climatecentral.org/news/soaring-temperatures-in-west-antarctica-could-destabilize-ice-15409\"> about 5°F (2.8°C) in the past 50 years\u003c/a>. Unsurprisingly, the region has seen considerable ice melt, and that melt was blamed on the \u003ca href=\"http://www.climatecentral.org/news/antarctica-record-high-temp-bodes-ill-for-ice-18840\">surging air temperatures\u003c/a> driven by \u003ca href=\"http://www.climatecentral.org/news/antarctica-record-high-temp-bodes-ill-for-ice-18840\">the broader warming\u003c/a> of the planet’s atmosphere.\u003c/p>\n\u003cp>It was clear that there was a distinct pattern of melt from north to south, though. In the northwest, the region of the largest air temperature increase, the glaciers paradoxically seemed fairly stable, while in the cooler southwest there had been considerable retreat.\u003c/p>\n\u003cp>Cook and her colleagues looked at ocean temperatures along the west coast of the peninsula and found a pattern of temperatures at mid-ocean depths that mirrored what was happening to the glaciers.\u003c/p>\n\u003cp>“The more we studied this, the more it became apparent that this followed a striking similarity to the glacier retreat rates,” Cook said.\u003c/p>\n\u003cp>At the southern end of the western side of the peninsula, warm Circumpolar Deep Water that has welled up meets the glaciers and wears away at their fronts.\u003c/p>\n\u003cp>At the northern end of the peninsula, the glaciers terminate in colder waters that come from a different source, keeping the fronts of those glaciers much more stable.\u003c/p>\n\u003cp>“This is a great study with convincing evidence that the northern and southern west coast of AP (Antarctic Peninsula) have very different oceanic regimes and the correspondence with the pattern of glacier retreat is undeniably strong,” Eric Rignot, a NASA glaciologist said in an email.\u003c/p>\n\u003cp>\u003cstrong>More Measurements Needed\u003c/strong>\u003c/p>\n\u003cp>The same Circumpolar Deep Water implicated in the new study is thought to be eroding glaciers elsewhere along the West Antarctic coast, including an adjacent area of the \u003ca href=\"http://www.climatecentral.org/news/overlooked-area-antarctica-major-ice-loss-20408\">Bellingshausen Sea coast\u003c/a> where a recent study suggested melt had been happening for much longer than previously thought.\u003c/p>\n\u003cp>“This study underscores what many of us in the scientific community have been suggesting for some time, namely that ice losses from around Antarctica owe as much to warmer ocean temperatures reaching parts of Antarctica’s coastline as to rises in air temperature,” \u003ca href=\"http://www.geos.ed.ac.uk/homes/rbingha2/\">Robert Bingham\u003c/a>, a glaciologist at the University of Edinburgh, said in an email. Bingham, who led the Bellingshausen Sea study, was not part of the new research.\u003c/p>\n\u003cp>While the glaciers along the Antarctic Peninsula are much smaller than those in the Bellingshausen Area, or the Amundsen Sea Embayment, where some of the fastest-slowing and retreating glaciers are found, their potential to contribute to sea level rise cannot be discounted. While they make up only 4 percent of Antarctica’s total ice sheet area, they have accounted for about 25 percent of its mass loss.\u003c/p>\n\u003cp>“The AP ice sheet is one of the largest current contributors to sea level rise and as the glaciers here are highly sensitive to changes in the environment they are key indicators of how the ice will respond to future changes,” Cook said.\u003c/p>\n\u003cp>The study’s findings lay bare the need for better understanding and monitoring of both Antarctica’s glaciers and the oceans lapping at them, Bingham and Rignot said.\u003c/p>\n\u003cp>“Our ultimate aim must be to predict how ocean-driven ice losses from Antarctica will impact upon global sea level rise,” Bingham said. “To provide such predictions, it’s clear that we need a far better understanding of ice-ocean interactions all around the fringes of Antarctica, and in particular to monitor changes occurring in the ice at the same time as changes in the ocean.”\u003c/p>\n\u003cp>\u003c/p>\n\u003cp>\u003ca href=\"http://www.climatecentral.org/\">\u003cspan style=\"font-weight: 400\">Climate Central\u003c/span>\u003c/a> \u003ci>\u003cspan style=\"font-weight: 400\">is an independent organization that researches and reports on climate change.\u003c/span>\u003c/i>\u003c/p>\n\n\u003c/div>\u003c/p>",
"attributes": {
"named": {},
"numeric": []
}
}
],
"link": "/science/850997/oceans-eating-away-at-yet-another-part-of-antarctica",
"authors": [
"byline_science_850997"
],
"categories": [
"science_31",
"science_40",
"science_2873"
],
"featImg": "science_851000",
"label": "source_science_850997"
},
"science_848472": {
"type": "posts",
"id": "science_848472",
"meta": {
"index": "posts_1716263798",
"site": "science",
"id": "848472",
"score": null,
"sort": [
1468519683000
]
},
"parent": 0,
"labelTerm": {},
"blocks": [],
"publishDate": 1468519683,
"format": "standard",
"title": "Clean Energy Puts a Dent in Carbon Dioxide Emissions",
"headTitle": "Clean Energy Puts a Dent in Carbon Dioxide Emissions | KQED",
"content": "\u003cp>Americans are using less electricity as buildings become more energy-efficient and industrial power demand weakens, and \u003ca href=\"http://mjbradley.com/benchmarking-air-emissions\">a new report\u003c/a> says that is leading to three trends: Declining carbon dioxide emissions, low electric power prices and the decline of coal, which has until recently been the primary fuel used to produce electricity.\u003c/p>\n\u003cp>Some of the nation’s largest electric utilities have been slow to cut carbon dioxide emissions in recent years, but as coal-fired power plants are shut down and states develop more wind and solar, carbon emissions are falling more quickly, according to the report published Wednesday by Bank of America, the Natural Resources Defense Council, climate think tank \u003ca href=\"http://ceres.org/press/press-releases/air-emissions-report\">Ceres\u003c/a> and three major utilities — \u003ca href=\"http://www.exeloncorp.com/\">Exelon\u003c/a>, \u003ca href=\"http://entergy.com/\">Entergy\u003c/a> and \u003ca href=\"http://www.calpine.com/\">Calpine\u003c/a>.\u003c/p>\n\u003cp>U.S. power plants’ carbon dioxide emissions were 14 percent higher in 2014 than they were in 1990. But the good news for the climate is that emissions fell about 15 percent between 2005 and 2014, and early data suggest that they fell another 6 percent between 2014 and 2015, reducing emissions to just above 1990 levels, the report says.\u003c/p>\n\u003cp>By contrast, spurred by environmental regulations under the Clean Air Act, utilities have cut their nitrogen oxide and sulfur dioxide emissions — major air pollutants — by more than 75 percent since 1990, and mercury emissions were cut 55 percent since 2000.\u003c/p>\n\u003cp>“Less progress has been made in terms of reducing CO2 emissions,” the report says.\u003c/p>\n\u003cp>[ad fullwidth]\u003c/p>\n\u003cp>Generating electricity is the primary source of greenhouse gas emissions causing climate change both in the U.S. and across the globe and the target of the Obama administration’s most sweeping climate policy — the \u003ca href=\"http://www.climatecentral.org/news/the-suit-against-the-clean-power-plan-explained-20234\">Clean Power Plan\u003c/a>. But the way Americans produce and use electricity is changing, and the climate may benefit, according to the report.\u003c/p>\n\u003cp>More zero-carbon energy is being produced from wind and solar, and low natural gas prices and mercury pollution regulations are encouraging utilities to shutter coal-fired-power plants and open new ones that run on natural gas, which emits less carbon dioxide, the report says.\u003c/p>\n\u003cp>“Renewable energy is widely expected to continue its strong growth, which will put the electricity sector in an excellent position to help the U.S. meet its international commitments,” said \u003ca href=\"https://www.nrdc.org/experts/starla-yeh\">Starla Yeh\u003c/a>, senior policy analyst in the Climate and Clean Air Program at NRDC. “We must reach this milestone to avoid the worst impacts of climate change.”\u003c/p>\n\u003cp>The most progress in reducing carbon emissions from electric power plants has been made in New England and the South, where many states have cut their carbon emissions rate by greater than 20 percent since 2008.\u003c/p>\n\u003cp>The South \u003ca href=\"http://www.ceres.org/industry-initiatives/electric-power/benchmarking-air-emissions-of-the-100-largest-electric-power-producers/benchmarking-air-emissions-of-the-100-largest-electric-power-producers\">stands out\u003c/a> because the region has been traditionally resistant to renewables, but with a greater focus on shutting down coal-fired power plants, six states have cut the rate of their carbon emissions by more than 20 percent between 2008 and 2014. Those states include North Carolina, South Carolina, Georgia, Alabama, Mississippi and Tennessee.\u003c/p>\n\u003cp>“The primary factor is a shift away from coal and toward natural gas,” said \u003ca href=\"http://www.ceres.org/about-us/who-we-are/ceres-staff/dan-bakal\">Dan Bakal\u003c/a>, director of electric power for Ceres.\u003c/p>\n\u003cp>Some Southern states have added renewables and use some nuclear power, but those were not major factors in their emissions reductions, he said.\u003c/p>\n\u003cp>The states with the highest power plant carbon emissions rates are Kentucky, Wyoming, West Virginia, Indiana and Missouri — all states heavily dependent on coal, according to the report. States with the lowest emissions rates are Vermont, Idaho, Washington, Oregon and Maine.\u003c/p>\n\u003cp>\u003c/p>\n\u003cp>\u003ca href=\"http://www.climatecentral.org/\">\u003cspan style=\"font-weight: 400\">Climate Central\u003c/span>\u003c/a> \u003ci>\u003cspan style=\"font-weight: 400\">is an independent organization that researches and reports on climate change.\u003c/span>\u003c/i>\u003c/p>\n\n",
"stats": {
"hasVideo": false,
"hasChartOrMap": false,
"hasAudio": false,
"hasPolis": false,
"wordCount": 607,
"hasGoogleForm": false,
"hasGallery": false,
"hasHearkenModule": false,
"iframeSrcs": [],
"paragraphCount": 16
},
"modified": 1704929923,
"excerpt": "A new report shows electric power utilities are reducing carbon pollution that fuels climate change.",
"headData": {
"twImgId": "",
"twTitle": "",
"ogTitle": "",
"ogImgId": "",
"twDescription": "",
"description": "A new report shows electric power utilities are reducing carbon pollution that fuels climate change.",
"title": "Clean Energy Puts a Dent in Carbon Dioxide Emissions | KQED",
"ogDescription": "",
"schema": {
"@context": "https://schema.org",
"@type": "Article",
"headline": "Clean Energy Puts a Dent in Carbon Dioxide Emissions",
"datePublished": "2016-07-14T11:08:03-07:00",
"dateModified": "2024-01-10T15:38:43-08:00",
"image": "https://cdn.kqed.org/wp-content/uploads/2020/02/KQED-OG-Image@1x.png"
}
},
"guestAuthors": [],
"slug": "clean-energy-puts-a-dent-in-carbon-dioxide-emissions",
"status": "publish",
"nprByline": "Bobby Magaill\u003c/br>Climate Central",
"sticky": false,
"source": "Climate Central",
"path": "/science/848472/clean-energy-puts-a-dent-in-carbon-dioxide-emissions",
"audioTrackLength": null,
"parsedContent": [
{
"type": "contentString",
"content": "\u003cdiv class=\"post-body\">\u003cp>\u003cp>Americans are using less electricity as buildings become more energy-efficient and industrial power demand weakens, and \u003ca href=\"http://mjbradley.com/benchmarking-air-emissions\">a new report\u003c/a> says that is leading to three trends: Declining carbon dioxide emissions, low electric power prices and the decline of coal, which has until recently been the primary fuel used to produce electricity.\u003c/p>\n\u003cp>Some of the nation’s largest electric utilities have been slow to cut carbon dioxide emissions in recent years, but as coal-fired power plants are shut down and states develop more wind and solar, carbon emissions are falling more quickly, according to the report published Wednesday by Bank of America, the Natural Resources Defense Council, climate think tank \u003ca href=\"http://ceres.org/press/press-releases/air-emissions-report\">Ceres\u003c/a> and three major utilities — \u003ca href=\"http://www.exeloncorp.com/\">Exelon\u003c/a>, \u003ca href=\"http://entergy.com/\">Entergy\u003c/a> and \u003ca href=\"http://www.calpine.com/\">Calpine\u003c/a>.\u003c/p>\n\u003cp>U.S. power plants’ carbon dioxide emissions were 14 percent higher in 2014 than they were in 1990. But the good news for the climate is that emissions fell about 15 percent between 2005 and 2014, and early data suggest that they fell another 6 percent between 2014 and 2015, reducing emissions to just above 1990 levels, the report says.\u003c/p>\n\u003cp>By contrast, spurred by environmental regulations under the Clean Air Act, utilities have cut their nitrogen oxide and sulfur dioxide emissions — major air pollutants — by more than 75 percent since 1990, and mercury emissions were cut 55 percent since 2000.\u003c/p>\n\u003cp>“Less progress has been made in terms of reducing CO2 emissions,” the report says.\u003c/p>\n\u003cp>\u003c/p>\u003c/div>",
"attributes": {
"named": {},
"numeric": []
}
},
{
"type": "component",
"content": "",
"name": "ad",
"attributes": {
"named": {
"label": "fullwidth"
},
"numeric": [
"fullwidth"
]
}
},
{
"type": "contentString",
"content": "\u003cdiv class=\"post-body\">\u003cp>\u003c/p>\n\u003cp>Generating electricity is the primary source of greenhouse gas emissions causing climate change both in the U.S. and across the globe and the target of the Obama administration’s most sweeping climate policy — the \u003ca href=\"http://www.climatecentral.org/news/the-suit-against-the-clean-power-plan-explained-20234\">Clean Power Plan\u003c/a>. But the way Americans produce and use electricity is changing, and the climate may benefit, according to the report.\u003c/p>\n\u003cp>More zero-carbon energy is being produced from wind and solar, and low natural gas prices and mercury pollution regulations are encouraging utilities to shutter coal-fired-power plants and open new ones that run on natural gas, which emits less carbon dioxide, the report says.\u003c/p>\n\u003cp>“Renewable energy is widely expected to continue its strong growth, which will put the electricity sector in an excellent position to help the U.S. meet its international commitments,” said \u003ca href=\"https://www.nrdc.org/experts/starla-yeh\">Starla Yeh\u003c/a>, senior policy analyst in the Climate and Clean Air Program at NRDC. “We must reach this milestone to avoid the worst impacts of climate change.”\u003c/p>\n\u003cp>The most progress in reducing carbon emissions from electric power plants has been made in New England and the South, where many states have cut their carbon emissions rate by greater than 20 percent since 2008.\u003c/p>\n\u003cp>The South \u003ca href=\"http://www.ceres.org/industry-initiatives/electric-power/benchmarking-air-emissions-of-the-100-largest-electric-power-producers/benchmarking-air-emissions-of-the-100-largest-electric-power-producers\">stands out\u003c/a> because the region has been traditionally resistant to renewables, but with a greater focus on shutting down coal-fired power plants, six states have cut the rate of their carbon emissions by more than 20 percent between 2008 and 2014. Those states include North Carolina, South Carolina, Georgia, Alabama, Mississippi and Tennessee.\u003c/p>\n\u003cp>“The primary factor is a shift away from coal and toward natural gas,” said \u003ca href=\"http://www.ceres.org/about-us/who-we-are/ceres-staff/dan-bakal\">Dan Bakal\u003c/a>, director of electric power for Ceres.\u003c/p>\n\u003cp>Some Southern states have added renewables and use some nuclear power, but those were not major factors in their emissions reductions, he said.\u003c/p>\n\u003cp>The states with the highest power plant carbon emissions rates are Kentucky, Wyoming, West Virginia, Indiana and Missouri — all states heavily dependent on coal, according to the report. States with the lowest emissions rates are Vermont, Idaho, Washington, Oregon and Maine.\u003c/p>\n\u003cp>\u003c/p>\n\u003cp>\u003ca href=\"http://www.climatecentral.org/\">\u003cspan style=\"font-weight: 400\">Climate Central\u003c/span>\u003c/a> \u003ci>\u003cspan style=\"font-weight: 400\">is an independent organization that researches and reports on climate change.\u003c/span>\u003c/i>\u003c/p>\n\n\u003c/div>\u003c/p>",
"attributes": {
"named": {},
"numeric": []
}
}
],
"link": "/science/848472/clean-energy-puts-a-dent-in-carbon-dioxide-emissions",
"authors": [
"byline_science_848472"
],
"categories": [
"science_31",
"science_33",
"science_40"
],
"featImg": "science_848477",
"label": "source_science_848472"
},
"science_845966": {
"type": "posts",
"id": "science_845966",
"meta": {
"index": "posts_1716263798",
"site": "science",
"id": "845966",
"score": null,
"sort": [
1468431909000
]
},
"parent": 0,
"labelTerm": {},
"blocks": [],
"publishDate": 1468431909,
"format": "standard",
"title": "U.S. Faces Dramatic Rise in Extreme Heat, Humidity",
"headTitle": "U.S. Faces Dramatic Rise in Extreme Heat, Humidity | KQED",
"content": "\u003cp>Across the U.S., we’ve hit the dog days of summer. Most regions are now seeing their hottest temperatures of the year, and the combination of heat and high humidity sends most people running for a cold drink, some shade, or an air conditioner.\u003c/p>\n\u003cp>Heat is the No.1 weather related killer, and as carbon pollution continues, global temperatures will keep climbing, bringing hotter summers and more extreme and dangerous heat.\u003c/p>\n\u003cp>Climate Central’s \u003cem>\u003ca href=\"http://impact.statesatrisk.org/\">States at Risk\u003c/a> \u003c/em>project analyzed historic trends in summer temperatures since 1970 as well as projections for future extreme heat for hundreds of metro areas across the lower 48 states. Using several measures, our findings show that most U.S. cities have already experienced large increases in extreme summer heat and absolute humidity, which together can cause serious heat-related health problems.\u003c/p>\n\u003cp>We found that scores of U.S. cities home to tens of millions of people will face dramatic increases in dangerous and extreme heat days by the middle of this century if current greenhouse gas emissions trends continue.\u003c/p>\n\u003cp>The hottest parts of the country, including Texas, the Southwest, and Florida have already experienced large increases in extreme heat days, including days over 90°F, 95°F, and 100°F, as well as rising levels of humidity that make hot days feel miserable and extremely hot days downright dangerous. Cities in those same states are facing the biggest projected increases in dangerous heat over the next several decades.\u003c/p>\n\u003cul>\n\u003cli>\u003cstrong>Florida\u003c/strong> faces by far the greatest increase in the dangerous combination of heat and humidity over the next several decades. The 13 metro areas in the U.S. projected to see the greatest increase in danger days by 2050, are all in Florida. Every one of these cities is projected to see an increase of more than 100 dangerous heat days — when the heat index, a combination of heat and humidity, is more than 104°F — by that time. This will only accelerate changes already seen in Florida, where Miami tops the nation with the greatest increase in annual average 90\u003csup>o\u003c/sup>F days per year since 1970 with 46 more such days. McAllen, Texas is second, with 26, followed by Tucson with 25.\u003c/li>\n\u003cli>\u003cstrong>Texas\u003c/strong> tops the nation in extreme heat, with 6 of the top 7 cities with the greatest increase in 95°F days, including Austin, San Antonio, and Corpus Christi. In addition, three Texas cities lead the nation in projected danger days by 2050. Nearly half the year, between 168 and 179 days, will be what the National Weather Service considers dangerous heat days by 2050 in McAllen, Laredo, and Brownsville-Harlingen.\u003c/li>\n\u003cli>\u003cstrong>Arizona\u003c/strong> is also hard hit, with Phoenix projected to see 146 danger days by 2050, Tucson expected to see 135, and Yuma projected to have 159. As a harbinger of these changes, Tucson now has 24 more days above 100°F on average per year than in the 1970s, the second largest increase in the nation.\u003c/li>\n\u003c/ul>\n\u003cp>\u003cimg loading=\"lazy\" decoding=\"async\" class=\"aligncenter size-full wp-image-846073\" src=\"http://ww2.kqed.org/science/wp-content/uploads/sites/35/2016/07/Summer-Sizzle_CC.jpg\" alt=\"Summer Sizzle_CC\" width=\"720\" height=\"405\" srcset=\"https://cdn.kqed.org/wp-content/uploads/sites/35/2016/07/Summer-Sizzle_CC.jpg 720w, https://cdn.kqed.org/wp-content/uploads/sites/35/2016/07/Summer-Sizzle_CC-400x225.jpg 400w\" sizes=\"(max-width: 720px) 100vw, 720px\">\u003c/p>\n\u003cp>[ad fullwidth]\u003c/p>\n\u003cp>\u003cimg loading=\"lazy\" decoding=\"async\" class=\"aligncenter size-full wp-image-846074\" src=\"http://ww2.kqed.org/science/wp-content/uploads/sites/35/2016/07/Impacts-of-extreme-heat.png\" alt=\"Impacts of extreme heat\" width=\"720\" height=\"40\" srcset=\"https://cdn.kqed.org/wp-content/uploads/sites/35/2016/07/Impacts-of-extreme-heat.png 720w, https://cdn.kqed.org/wp-content/uploads/sites/35/2016/07/Impacts-of-extreme-heat-400x22.png 400w\" sizes=\"(max-width: 720px) 100vw, 720px\">\u003c/p>\n\u003cp>Extreme heat and the combination of high heat and humidity pose serious risks for human health. According to the National Weather Service, heat is the No.1 weather-related killer in the U.S. — more than tornados, floods, and hurricanes — and it is estimated that between 600 and 1,500 heat-related deaths occur in an average summer in the U.S.\u003csup>1,2\u003c/sup> Individual heat waves can be even more deadly. The 1995 heat wave in Chicago is estimated to have led to more than 700 deaths and in excess of 1000 more hospital admissions than normal.\u003csup>3,4\u003c/sup>\u003c/p>\n\u003cp>This deadly risk is not likely to go away. By the end of the century, heat-related deaths are projected to increase by thousands to tens-of-thousands each year in the U.S.\u003csup>5\u003c/sup> Those most at risk of heat-related health impacts are infants and young children, elderly over 65, those already ill, athletes, and outdoor workers\u003csup>2\u003c/sup>. But everyone is potentially at risk.\u003c/p>\n\u003cp>Elevated heat, especially along with high humidity, makes it difficult for the body to cool itself. In addition to increasing the risk of mortality, heat can cause problems throughout the body. It can range from dehydration, cramps, exhaustion, dizziness, vomiting and heat rash to more serious issues involving kidney failure, heart issues, and exacerbation of respiratory issues\u003csup>6,7\u003c/sup>. These heat impacts also provide a challenge to the healthcare industry with increased hospitalizations and doctors’ visits and insurance claims.\u003c/p>\n\u003cp>High heat also impacts other sectors and infrastructure. Stagnant air often occurs during periods of elevated heat and allows dangerous levels of air pollutants to build up. High temperatures also directly provide conditions conducive for producing harmful ground-level ozone. Periods of extreme heat can wither crops and exacerbate drought conditions greatly impacting agriculture. Blackouts often accompany heat-waves as the need for cooling puts a heavy strain on the power grid. Heat waves can also lead to harmful algal blooms and promote other bacterial growth in bodies of water and lead to degraded fish habitat, such as for species that require cooler streams and rivers.\u003c/p>\n\u003cp>\u003cimg loading=\"lazy\" decoding=\"async\" class=\"aligncenter size-full wp-image-846076\" src=\"http://ww2.kqed.org/science/wp-content/uploads/sites/35/2016/07/More-danger-days-coming.png\" alt=\"More danger days coming\" width=\"720\" height=\"40\" srcset=\"https://cdn.kqed.org/wp-content/uploads/sites/35/2016/07/More-danger-days-coming.png 720w, https://cdn.kqed.org/wp-content/uploads/sites/35/2016/07/More-danger-days-coming-400x22.png 400w\" sizes=\"(max-width: 720px) 100vw, 720px\">\u003c/p>\n\u003cp>The combination of hot temperatures and high humidity create dangerous conditions for humans. The National Weather Service defines as dangerous any day when the heat index (the combination of heat and humidity, commonly known as the “feels like temperature”) exceeds 104°F. Under these conditions, sunstroke and heat exhaustion are likely, and physical activity or being outside for long periods is risky, potentially leading to heat stroke. These dangerous heat days pose the greatest threat to kids and the elderly, and to people who don’t have easy access to air conditioning.\u003c/p>\n\u003cp>\u003cimg loading=\"lazy\" decoding=\"async\" class=\"aligncenter size-full wp-image-846078\" src=\"http://ww2.kqed.org/science/wp-content/uploads/sites/35/2016/07/DangerDays_sanfrancisco_en_title_lg.jpg\" alt=\"DangerDays_sanfrancisco_en_title_lg\" width=\"1920\" height=\"1080\" srcset=\"https://cdn.kqed.org/wp-content/uploads/sites/35/2016/07/DangerDays_sanfrancisco_en_title_lg.jpg 1920w, https://cdn.kqed.org/wp-content/uploads/sites/35/2016/07/DangerDays_sanfrancisco_en_title_lg-400x225.jpg 400w, https://cdn.kqed.org/wp-content/uploads/sites/35/2016/07/DangerDays_sanfrancisco_en_title_lg-800x450.jpg 800w, https://cdn.kqed.org/wp-content/uploads/sites/35/2016/07/DangerDays_sanfrancisco_en_title_lg-768x432.jpg 768w, https://cdn.kqed.org/wp-content/uploads/sites/35/2016/07/DangerDays_sanfrancisco_en_title_lg-1440x810.jpg 1440w, https://cdn.kqed.org/wp-content/uploads/sites/35/2016/07/DangerDays_sanfrancisco_en_title_lg-1180x664.jpg 1180w, https://cdn.kqed.org/wp-content/uploads/sites/35/2016/07/DangerDays_sanfrancisco_en_title_lg-960x540.jpg 960w\" sizes=\"(max-width: 1920px) 100vw, 1920px\">\u003c/p>\n\u003cp>We analyzed 360 of the biggest U.S. cities to see how the average number of danger days is projected to increase in the coming decades. The projections draw on 29 global climate models that have been downscaled across the continental U.S. to represent local climate conditions.\u003c/p>\n\u003cp>The top 25 U.S. cities expected to see the most danger days by 2050 are:\u003c/p>\n\u003cp>\u003cimg loading=\"lazy\" decoding=\"async\" class=\"aligncenter size-full wp-image-846081\" src=\"http://ww2.kqed.org/science/wp-content/uploads/sites/35/2016/07/DangerDaysrank_heat_500_497_s_c1_c_c.png\" alt=\"DangerDaysrank_heat_500_497_s_c1_c_c\" width=\"500\" height=\"497\" srcset=\"https://cdn.kqed.org/wp-content/uploads/sites/35/2016/07/DangerDaysrank_heat_500_497_s_c1_c_c.png 500w, https://cdn.kqed.org/wp-content/uploads/sites/35/2016/07/DangerDaysrank_heat_500_497_s_c1_c_c-400x398.png 400w, https://cdn.kqed.org/wp-content/uploads/sites/35/2016/07/DangerDaysrank_heat_500_497_s_c1_c_c-32x32.png 32w, https://cdn.kqed.org/wp-content/uploads/sites/35/2016/07/DangerDaysrank_heat_500_497_s_c1_c_c-50x50.png 50w, https://cdn.kqed.org/wp-content/uploads/sites/35/2016/07/DangerDaysrank_heat_500_497_s_c1_c_c-64x64.png 64w, https://cdn.kqed.org/wp-content/uploads/sites/35/2016/07/DangerDaysrank_heat_500_497_s_c1_c_c-96x96.png 96w, https://cdn.kqed.org/wp-content/uploads/sites/35/2016/07/DangerDaysrank_heat_500_497_s_c1_c_c-128x128.png 128w, https://cdn.kqed.org/wp-content/uploads/sites/35/2016/07/DangerDaysrank_heat_500_497_s_c1_c_c-150x150.png 150w\" sizes=\"(max-width: 500px) 100vw, 500px\">\u003c/p>\n\u003cp>The 25 U.S. cities projected to see the biggest increase in danger days over current conditions are:\u003c/p>\n\u003cp>\u003cimg loading=\"lazy\" decoding=\"async\" class=\"aligncenter size-full wp-image-846083\" src=\"http://ww2.kqed.org/science/wp-content/uploads/sites/35/2016/07/DangerDaysgrowth_heat_500_484_s_c1_c_c.png\" alt=\"DangerDaysgrowth_heat_500_484_s_c1_c_c\" width=\"500\" height=\"484\" srcset=\"https://cdn.kqed.org/wp-content/uploads/sites/35/2016/07/DangerDaysgrowth_heat_500_484_s_c1_c_c.png 500w, https://cdn.kqed.org/wp-content/uploads/sites/35/2016/07/DangerDaysgrowth_heat_500_484_s_c1_c_c-400x387.png 400w, https://cdn.kqed.org/wp-content/uploads/sites/35/2016/07/DangerDaysgrowth_heat_500_484_s_c1_c_c-32x32.png 32w\" sizes=\"(max-width: 500px) 100vw, 500px\">\u003c/p>\n\u003cp>\u003cimg loading=\"lazy\" decoding=\"async\" class=\"aligncenter size-full wp-image-846084\" src=\"http://ww2.kqed.org/science/wp-content/uploads/sites/35/2016/07/heatBanner_dayssince1970_720_40_s_c1_c_c.png\" alt=\"heatBanner_dayssince1970_720_40_s_c1_c_c\" width=\"720\" height=\"40\" srcset=\"https://cdn.kqed.org/wp-content/uploads/sites/35/2016/07/heatBanner_dayssince1970_720_40_s_c1_c_c.png 720w, https://cdn.kqed.org/wp-content/uploads/sites/35/2016/07/heatBanner_dayssince1970_720_40_s_c1_c_c-400x22.png 400w\" sizes=\"(max-width: 720px) 100vw, 720px\">\u003c/p>\n\u003cp>Even in the absence of high humidity, extremely hot days pose a considerable health threat, particularly under prolonged exposure. Across most of the U.S. temperatures have increasingly been exceeding 90°F, 95°F, and 100°F since 1970.\u003c/p>\n\u003cp>Our analysis of trends in extreme heat days is based on annual counts of 90°F, 95°F, and 100°F exceedances in the country’s largest 200 cities. The hottest cities are seeing the biggest average increases in extreme heat days, in general.\u003c/p>\n\u003cp>The top 25 cities that have seen the biggest increase in annual average days above 90°F since 1970:\u003c/p>\n\u003cp>\u003cimg loading=\"lazy\" decoding=\"async\" class=\"aligncenter size-full wp-image-846085\" src=\"http://ww2.kqed.org/science/wp-content/uploads/sites/35/2016/07/HeatReport_90days_rank_500_485_s_c1_c_c.png\" alt=\"HeatReport_90days_rank_500_485_s_c1_c_c\" width=\"500\" height=\"485\" srcset=\"https://cdn.kqed.org/wp-content/uploads/sites/35/2016/07/HeatReport_90days_rank_500_485_s_c1_c_c.png 500w, https://cdn.kqed.org/wp-content/uploads/sites/35/2016/07/HeatReport_90days_rank_500_485_s_c1_c_c-400x388.png 400w, https://cdn.kqed.org/wp-content/uploads/sites/35/2016/07/HeatReport_90days_rank_500_485_s_c1_c_c-32x32.png 32w, https://cdn.kqed.org/wp-content/uploads/sites/35/2016/07/HeatReport_90days_rank_500_485_s_c1_c_c-50x50.png 50w\" sizes=\"(max-width: 500px) 100vw, 500px\">\u003c/p>\n\u003cp>The top 10 cities that have seen the biggest increase in 100°F days are:\u003c/p>\n\u003cp>\u003cimg loading=\"lazy\" decoding=\"async\" class=\"aligncenter size-full wp-image-846086\" src=\"http://ww2.kqed.org/science/wp-content/uploads/sites/35/2016/07/HeatReport_100days_rank_500_525_s_c1_c_c.png\" alt=\"HeatReport_100days_rank_500_525_s_c1_c_c\" width=\"500\" height=\"525\" srcset=\"https://cdn.kqed.org/wp-content/uploads/sites/35/2016/07/HeatReport_100days_rank_500_525_s_c1_c_c.png 500w, https://cdn.kqed.org/wp-content/uploads/sites/35/2016/07/HeatReport_100days_rank_500_525_s_c1_c_c-400x420.png 400w\" sizes=\"(max-width: 500px) 100vw, 500px\">\u003c/p>\n\u003cp>\u003cimg loading=\"lazy\" decoding=\"async\" class=\"aligncenter size-full wp-image-846087\" src=\"http://ww2.kqed.org/science/wp-content/uploads/sites/35/2016/07/heatBanner_warmingsummers_720_40_s_c1_c_c.png\" alt=\"heatBanner_warmingsummers_720_40_s_c1_c_c\" width=\"720\" height=\"40\" srcset=\"https://cdn.kqed.org/wp-content/uploads/sites/35/2016/07/heatBanner_warmingsummers_720_40_s_c1_c_c.png 720w, https://cdn.kqed.org/wp-content/uploads/sites/35/2016/07/heatBanner_warmingsummers_720_40_s_c1_c_c-400x22.png 400w\" sizes=\"(max-width: 720px) 100vw, 720px\">\u003c/p>\n\u003cp>Since 1970, summers have been warming in 45 of the lower 48 states. In many of these states, this warming is driven largely by nighttime temperatures getting hotter.\u003c/p>\n\u003cp>\u003cimg loading=\"lazy\" decoding=\"async\" class=\"aligncenter size-full wp-image-846088\" src=\"http://ww2.kqed.org/science/wp-content/uploads/sites/35/2016/07/Fastest-warming-summers.png\" alt=\"Fastest warming summers\" width=\"500\" height=\"499\" srcset=\"https://cdn.kqed.org/wp-content/uploads/sites/35/2016/07/Fastest-warming-summers.png 500w, https://cdn.kqed.org/wp-content/uploads/sites/35/2016/07/Fastest-warming-summers-400x399.png 400w, https://cdn.kqed.org/wp-content/uploads/sites/35/2016/07/Fastest-warming-summers-32x32.png 32w, https://cdn.kqed.org/wp-content/uploads/sites/35/2016/07/Fastest-warming-summers-50x50.png 50w, https://cdn.kqed.org/wp-content/uploads/sites/35/2016/07/Fastest-warming-summers-64x64.png 64w, https://cdn.kqed.org/wp-content/uploads/sites/35/2016/07/Fastest-warming-summers-96x96.png 96w, https://cdn.kqed.org/wp-content/uploads/sites/35/2016/07/Fastest-warming-summers-128x128.png 128w, https://cdn.kqed.org/wp-content/uploads/sites/35/2016/07/Fastest-warming-summers-150x150.png 150w\" sizes=\"(max-width: 500px) 100vw, 500px\">\u003c/p>\n\u003cp>\u003cimg loading=\"lazy\" decoding=\"async\" class=\"aligncenter size-full wp-image-846089\" src=\"http://ww2.kqed.org/science/wp-content/uploads/sites/35/2016/07/Steamier-summers.png\" alt=\"Steamier summers\" width=\"720\" height=\"40\" srcset=\"https://cdn.kqed.org/wp-content/uploads/sites/35/2016/07/Steamier-summers.png 720w, https://cdn.kqed.org/wp-content/uploads/sites/35/2016/07/Steamier-summers-400x22.png 400w\" sizes=\"(max-width: 720px) 100vw, 720px\">\u003c/p>\n\u003cp>As temperatures rise, evaporation increases, causing increased water vapor in the air. That extra moisture makes the air feel muggier, and can make it a lot more difficult to tolerate the heat because our bodies have a harder time keeping cool through perspiration. As summers warm across the country from increasing greenhouse gases, cities are also getting sticker.\u003c/p>\n\u003cp>Climate Central analyzed how the average summer dew point has changed in 200 major U.S. cities since 1970 (the \u003ca href=\"http://wxshift.com/videos/ask-a-met-dew-point\">dew point\u003c/a> is a measure of how much moisture is in the air). We found that 87 percent of those cities have experienced an overall increase in their average summer dew point over the past 46 years, indicating that there is typically more moisture in the air on hot summer days now than there used to be.\u003c/p>\n\u003cp>The top 25 cities seeing the largest increase in summer air moisture since the 1970s are (several of which are among the fastest warming cities in the country):\u003c/p>\n\u003cp>\u003cimg loading=\"lazy\" decoding=\"async\" class=\"aligncenter size-full wp-image-846090\" src=\"http://ww2.kqed.org/science/wp-content/uploads/sites/35/2016/07/HeatReport_Dewpoints_500_495_s_c1_c_c.png\" alt=\"HeatReport_Dewpoints_500_495_s_c1_c_c\" width=\"500\" height=\"495\" srcset=\"https://cdn.kqed.org/wp-content/uploads/sites/35/2016/07/HeatReport_Dewpoints_500_495_s_c1_c_c.png 500w, https://cdn.kqed.org/wp-content/uploads/sites/35/2016/07/HeatReport_Dewpoints_500_495_s_c1_c_c-400x396.png 400w, https://cdn.kqed.org/wp-content/uploads/sites/35/2016/07/HeatReport_Dewpoints_500_495_s_c1_c_c-32x32.png 32w, https://cdn.kqed.org/wp-content/uploads/sites/35/2016/07/HeatReport_Dewpoints_500_495_s_c1_c_c-50x50.png 50w, https://cdn.kqed.org/wp-content/uploads/sites/35/2016/07/HeatReport_Dewpoints_500_495_s_c1_c_c-64x64.png 64w, https://cdn.kqed.org/wp-content/uploads/sites/35/2016/07/HeatReport_Dewpoints_500_495_s_c1_c_c-96x96.png 96w, https://cdn.kqed.org/wp-content/uploads/sites/35/2016/07/HeatReport_Dewpoints_500_495_s_c1_c_c-128x128.png 128w, https://cdn.kqed.org/wp-content/uploads/sites/35/2016/07/HeatReport_Dewpoints_500_495_s_c1_c_c-150x150.png 150w\" sizes=\"(max-width: 500px) 100vw, 500px\">\u003c/p>\n\u003cp>\u003ca href=\"http://www.climatecentral.org/\">Climate Central\u003c/a> \u003cem>is an independent organization that researches and reports on climate change.\u003c/em>\u003c/p>\n\u003cp>\u003cem>Analysis by Alyson Kenward, PhD, Jennifer Brady, James Bronzan and Todd Sanford. Read full \u003ca href=\"http://assets.climatecentral.org/pdfs/Heat_methodology.pdf\" target=\"_blank\" rel=\"noopener\">methodology\u003c/a>. \u003c/em>\u003c/p>\n\u003cp>\u003cem>Footnotes:\u003c/em>\u003c/p>\n\u003cp>\u003cem>1. Harvard Medical School (2005), \u003ca href=\"http://ccsl.iccip.net/ccf_report_oct_06.pdf\" target=\"_blank\" rel=\"noopener\">Climate Change Futures: Health, Ecological and Economic Dimensions\u003c/a>, Cambridge, MA: The Center for Health and the Global Environment, Harvard Medical School.\u003c/em>\u003c/p>\n\u003cp>\u003cem>2. Centers for Disease Control, \u003ca href=\"https://www.cdc.gov/extremeheat/\" target=\"_blank\" rel=\"noopener\">Extreme Heat and Your Health\u003c/a>, 2011\u003c/em>\u003c/p>\n\u003cp>\u003cem>3. Palecki et al. (2001), Bulletin of the American Meteorological Society. T\u003ca href=\"http://journals.ametsoc.org/doi/pdf/10.1175/1520-0477%282001%29082%3C1353%3ATNAIOT%3E2.3.CO%3B2\" target=\"_blank\" rel=\"noopener\">he Nature and Impacts of the July 1999 Heat Wave in the Midwestern United States: Learning From the Lessons of 1995\u003c/a>. 82:7, 1353. \u003c/em>\u003c/p>\n\u003cp>\u003cem>4. Semenza et al. (1999), Am. J. Preventive Med. \u003ca href=\"http://www.sciencedirect.com/science/article/pii/S0749379799000252\" target=\"_blank\" rel=\"noopener\">Excessive Hospitalizations During the July 1995 Heat Wave in Chicago\u003c/a>. 16:4, 269. \u003c/em>\u003c/p>\n\u003cp>\u003cem>5. U.S. Global Change Research Program (2016), T\u003ca href=\"https://health2016.globalchange.gov/\" target=\"_blank\" rel=\"noopener\">he Impacts of Climate Change on Human Health in the United States: A Scientific Assessment\u003c/a>. \u003c/em>\u003c/p>\n\u003cp>\u003cem>6. Becker, J.A. and L.K. Stewart (2011), American Family Physician. \u003ca href=\"http://www.ncbi.nlm.nih.gov/pubmed/21661715\" target=\"_blank\" rel=\"noopener\">Heat-related illness\u003c/a>. 83:11, 1325.\u003c/em>\u003c/p>\n\u003cp>[ad floatright]\u003c/p>\n\u003cp>\u003cem>7. Glazer, J.L. (2005), American Family Physician. \u003ca href=\"http://www.aafp.org/afp/2005/0601/p2133.html\" target=\"_blank\" rel=\"noopener\">Management of Heatstroke and Heat Exhaustion\u003c/a>. 71:11, 2133.\u003c/em>\u003c/p>\n\n",
"stats": {
"hasVideo": false,
"hasChartOrMap": false,
"hasAudio": false,
"hasPolis": false,
"wordCount": 1553,
"hasGoogleForm": false,
"hasGallery": false,
"hasHearkenModule": false,
"iframeSrcs": [],
"paragraphCount": 46
},
"modified": 1704929927,
"excerpt": "As carbon pollution continues, global temperatures will keep climbing, bringing hotter summers and more extreme and dangerous heat.",
"headData": {
"twImgId": "",
"twTitle": "",
"ogTitle": "",
"ogImgId": "",
"twDescription": "",
"description": "As carbon pollution continues, global temperatures will keep climbing, bringing hotter summers and more extreme and dangerous heat.",
"title": "U.S. Faces Dramatic Rise in Extreme Heat, Humidity | KQED",
"ogDescription": "",
"schema": {
"@context": "https://schema.org",
"@type": "Article",
"headline": "U.S. Faces Dramatic Rise in Extreme Heat, Humidity",
"datePublished": "2016-07-13T10:45:09-07:00",
"dateModified": "2024-01-10T15:38:47-08:00",
"image": "https://cdn.kqed.org/wp-content/uploads/2020/02/KQED-OG-Image@1x.png"
}
},
"guestAuthors": [],
"slug": "u-s-faces-dramatic-rise-in-extreme-heat-humidity",
"status": "publish",
"sourceUrl": "http://www.climatecentral.org/",
"nprByline": "Climate Central",
"sticky": false,
"source": "Climate Central",
"path": "/science/845966/u-s-faces-dramatic-rise-in-extreme-heat-humidity",
"audioTrackLength": null,
"parsedContent": [
{
"type": "contentString",
"content": "\u003cdiv class=\"post-body\">\u003cp>\u003cp>Across the U.S., we’ve hit the dog days of summer. Most regions are now seeing their hottest temperatures of the year, and the combination of heat and high humidity sends most people running for a cold drink, some shade, or an air conditioner.\u003c/p>\n\u003cp>Heat is the No.1 weather related killer, and as carbon pollution continues, global temperatures will keep climbing, bringing hotter summers and more extreme and dangerous heat.\u003c/p>\n\u003cp>Climate Central’s \u003cem>\u003ca href=\"http://impact.statesatrisk.org/\">States at Risk\u003c/a> \u003c/em>project analyzed historic trends in summer temperatures since 1970 as well as projections for future extreme heat for hundreds of metro areas across the lower 48 states. Using several measures, our findings show that most U.S. cities have already experienced large increases in extreme summer heat and absolute humidity, which together can cause serious heat-related health problems.\u003c/p>\n\u003cp>We found that scores of U.S. cities home to tens of millions of people will face dramatic increases in dangerous and extreme heat days by the middle of this century if current greenhouse gas emissions trends continue.\u003c/p>\n\u003cp>The hottest parts of the country, including Texas, the Southwest, and Florida have already experienced large increases in extreme heat days, including days over 90°F, 95°F, and 100°F, as well as rising levels of humidity that make hot days feel miserable and extremely hot days downright dangerous. Cities in those same states are facing the biggest projected increases in dangerous heat over the next several decades.\u003c/p>\n\u003cul>\n\u003cli>\u003cstrong>Florida\u003c/strong> faces by far the greatest increase in the dangerous combination of heat and humidity over the next several decades. The 13 metro areas in the U.S. projected to see the greatest increase in danger days by 2050, are all in Florida. Every one of these cities is projected to see an increase of more than 100 dangerous heat days — when the heat index, a combination of heat and humidity, is more than 104°F — by that time. This will only accelerate changes already seen in Florida, where Miami tops the nation with the greatest increase in annual average 90\u003csup>o\u003c/sup>F days per year since 1970 with 46 more such days. McAllen, Texas is second, with 26, followed by Tucson with 25.\u003c/li>\n\u003cli>\u003cstrong>Texas\u003c/strong> tops the nation in extreme heat, with 6 of the top 7 cities with the greatest increase in 95°F days, including Austin, San Antonio, and Corpus Christi. In addition, three Texas cities lead the nation in projected danger days by 2050. Nearly half the year, between 168 and 179 days, will be what the National Weather Service considers dangerous heat days by 2050 in McAllen, Laredo, and Brownsville-Harlingen.\u003c/li>\n\u003cli>\u003cstrong>Arizona\u003c/strong> is also hard hit, with Phoenix projected to see 146 danger days by 2050, Tucson expected to see 135, and Yuma projected to have 159. As a harbinger of these changes, Tucson now has 24 more days above 100°F on average per year than in the 1970s, the second largest increase in the nation.\u003c/li>\n\u003c/ul>\n\u003cp>\u003cimg loading=\"lazy\" decoding=\"async\" class=\"aligncenter size-full wp-image-846073\" src=\"http://ww2.kqed.org/science/wp-content/uploads/sites/35/2016/07/Summer-Sizzle_CC.jpg\" alt=\"Summer Sizzle_CC\" width=\"720\" height=\"405\" srcset=\"https://cdn.kqed.org/wp-content/uploads/sites/35/2016/07/Summer-Sizzle_CC.jpg 720w, https://cdn.kqed.org/wp-content/uploads/sites/35/2016/07/Summer-Sizzle_CC-400x225.jpg 400w\" sizes=\"(max-width: 720px) 100vw, 720px\">\u003c/p>\n\u003cp>\u003c/p>\u003c/div>",
"attributes": {
"named": {},
"numeric": []
}
},
{
"type": "component",
"content": "",
"name": "ad",
"attributes": {
"named": {
"label": "fullwidth"
},
"numeric": [
"fullwidth"
]
}
},
{
"type": "contentString",
"content": "\u003cdiv class=\"post-body\">\u003cp>\u003c/p>\n\u003cp>\u003cimg loading=\"lazy\" decoding=\"async\" class=\"aligncenter size-full wp-image-846074\" src=\"http://ww2.kqed.org/science/wp-content/uploads/sites/35/2016/07/Impacts-of-extreme-heat.png\" alt=\"Impacts of extreme heat\" width=\"720\" height=\"40\" srcset=\"https://cdn.kqed.org/wp-content/uploads/sites/35/2016/07/Impacts-of-extreme-heat.png 720w, https://cdn.kqed.org/wp-content/uploads/sites/35/2016/07/Impacts-of-extreme-heat-400x22.png 400w\" sizes=\"(max-width: 720px) 100vw, 720px\">\u003c/p>\n\u003cp>Extreme heat and the combination of high heat and humidity pose serious risks for human health. According to the National Weather Service, heat is the No.1 weather-related killer in the U.S. — more than tornados, floods, and hurricanes — and it is estimated that between 600 and 1,500 heat-related deaths occur in an average summer in the U.S.\u003csup>1,2\u003c/sup> Individual heat waves can be even more deadly. The 1995 heat wave in Chicago is estimated to have led to more than 700 deaths and in excess of 1000 more hospital admissions than normal.\u003csup>3,4\u003c/sup>\u003c/p>\n\u003cp>This deadly risk is not likely to go away. By the end of the century, heat-related deaths are projected to increase by thousands to tens-of-thousands each year in the U.S.\u003csup>5\u003c/sup> Those most at risk of heat-related health impacts are infants and young children, elderly over 65, those already ill, athletes, and outdoor workers\u003csup>2\u003c/sup>. But everyone is potentially at risk.\u003c/p>\n\u003cp>Elevated heat, especially along with high humidity, makes it difficult for the body to cool itself. In addition to increasing the risk of mortality, heat can cause problems throughout the body. It can range from dehydration, cramps, exhaustion, dizziness, vomiting and heat rash to more serious issues involving kidney failure, heart issues, and exacerbation of respiratory issues\u003csup>6,7\u003c/sup>. These heat impacts also provide a challenge to the healthcare industry with increased hospitalizations and doctors’ visits and insurance claims.\u003c/p>\n\u003cp>High heat also impacts other sectors and infrastructure. Stagnant air often occurs during periods of elevated heat and allows dangerous levels of air pollutants to build up. High temperatures also directly provide conditions conducive for producing harmful ground-level ozone. Periods of extreme heat can wither crops and exacerbate drought conditions greatly impacting agriculture. Blackouts often accompany heat-waves as the need for cooling puts a heavy strain on the power grid. Heat waves can also lead to harmful algal blooms and promote other bacterial growth in bodies of water and lead to degraded fish habitat, such as for species that require cooler streams and rivers.\u003c/p>\n\u003cp>\u003cimg loading=\"lazy\" decoding=\"async\" class=\"aligncenter size-full wp-image-846076\" src=\"http://ww2.kqed.org/science/wp-content/uploads/sites/35/2016/07/More-danger-days-coming.png\" alt=\"More danger days coming\" width=\"720\" height=\"40\" srcset=\"https://cdn.kqed.org/wp-content/uploads/sites/35/2016/07/More-danger-days-coming.png 720w, https://cdn.kqed.org/wp-content/uploads/sites/35/2016/07/More-danger-days-coming-400x22.png 400w\" sizes=\"(max-width: 720px) 100vw, 720px\">\u003c/p>\n\u003cp>The combination of hot temperatures and high humidity create dangerous conditions for humans. The National Weather Service defines as dangerous any day when the heat index (the combination of heat and humidity, commonly known as the “feels like temperature”) exceeds 104°F. Under these conditions, sunstroke and heat exhaustion are likely, and physical activity or being outside for long periods is risky, potentially leading to heat stroke. These dangerous heat days pose the greatest threat to kids and the elderly, and to people who don’t have easy access to air conditioning.\u003c/p>\n\u003cp>\u003cimg loading=\"lazy\" decoding=\"async\" class=\"aligncenter size-full wp-image-846078\" src=\"http://ww2.kqed.org/science/wp-content/uploads/sites/35/2016/07/DangerDays_sanfrancisco_en_title_lg.jpg\" alt=\"DangerDays_sanfrancisco_en_title_lg\" width=\"1920\" height=\"1080\" srcset=\"https://cdn.kqed.org/wp-content/uploads/sites/35/2016/07/DangerDays_sanfrancisco_en_title_lg.jpg 1920w, https://cdn.kqed.org/wp-content/uploads/sites/35/2016/07/DangerDays_sanfrancisco_en_title_lg-400x225.jpg 400w, https://cdn.kqed.org/wp-content/uploads/sites/35/2016/07/DangerDays_sanfrancisco_en_title_lg-800x450.jpg 800w, https://cdn.kqed.org/wp-content/uploads/sites/35/2016/07/DangerDays_sanfrancisco_en_title_lg-768x432.jpg 768w, https://cdn.kqed.org/wp-content/uploads/sites/35/2016/07/DangerDays_sanfrancisco_en_title_lg-1440x810.jpg 1440w, https://cdn.kqed.org/wp-content/uploads/sites/35/2016/07/DangerDays_sanfrancisco_en_title_lg-1180x664.jpg 1180w, https://cdn.kqed.org/wp-content/uploads/sites/35/2016/07/DangerDays_sanfrancisco_en_title_lg-960x540.jpg 960w\" sizes=\"(max-width: 1920px) 100vw, 1920px\">\u003c/p>\n\u003cp>We analyzed 360 of the biggest U.S. cities to see how the average number of danger days is projected to increase in the coming decades. The projections draw on 29 global climate models that have been downscaled across the continental U.S. to represent local climate conditions.\u003c/p>\n\u003cp>The top 25 U.S. cities expected to see the most danger days by 2050 are:\u003c/p>\n\u003cp>\u003cimg loading=\"lazy\" decoding=\"async\" class=\"aligncenter size-full wp-image-846081\" src=\"http://ww2.kqed.org/science/wp-content/uploads/sites/35/2016/07/DangerDaysrank_heat_500_497_s_c1_c_c.png\" alt=\"DangerDaysrank_heat_500_497_s_c1_c_c\" width=\"500\" height=\"497\" srcset=\"https://cdn.kqed.org/wp-content/uploads/sites/35/2016/07/DangerDaysrank_heat_500_497_s_c1_c_c.png 500w, https://cdn.kqed.org/wp-content/uploads/sites/35/2016/07/DangerDaysrank_heat_500_497_s_c1_c_c-400x398.png 400w, https://cdn.kqed.org/wp-content/uploads/sites/35/2016/07/DangerDaysrank_heat_500_497_s_c1_c_c-32x32.png 32w, https://cdn.kqed.org/wp-content/uploads/sites/35/2016/07/DangerDaysrank_heat_500_497_s_c1_c_c-50x50.png 50w, https://cdn.kqed.org/wp-content/uploads/sites/35/2016/07/DangerDaysrank_heat_500_497_s_c1_c_c-64x64.png 64w, https://cdn.kqed.org/wp-content/uploads/sites/35/2016/07/DangerDaysrank_heat_500_497_s_c1_c_c-96x96.png 96w, https://cdn.kqed.org/wp-content/uploads/sites/35/2016/07/DangerDaysrank_heat_500_497_s_c1_c_c-128x128.png 128w, https://cdn.kqed.org/wp-content/uploads/sites/35/2016/07/DangerDaysrank_heat_500_497_s_c1_c_c-150x150.png 150w\" sizes=\"(max-width: 500px) 100vw, 500px\">\u003c/p>\n\u003cp>The 25 U.S. cities projected to see the biggest increase in danger days over current conditions are:\u003c/p>\n\u003cp>\u003cimg loading=\"lazy\" decoding=\"async\" class=\"aligncenter size-full wp-image-846083\" src=\"http://ww2.kqed.org/science/wp-content/uploads/sites/35/2016/07/DangerDaysgrowth_heat_500_484_s_c1_c_c.png\" alt=\"DangerDaysgrowth_heat_500_484_s_c1_c_c\" width=\"500\" height=\"484\" srcset=\"https://cdn.kqed.org/wp-content/uploads/sites/35/2016/07/DangerDaysgrowth_heat_500_484_s_c1_c_c.png 500w, https://cdn.kqed.org/wp-content/uploads/sites/35/2016/07/DangerDaysgrowth_heat_500_484_s_c1_c_c-400x387.png 400w, https://cdn.kqed.org/wp-content/uploads/sites/35/2016/07/DangerDaysgrowth_heat_500_484_s_c1_c_c-32x32.png 32w\" sizes=\"(max-width: 500px) 100vw, 500px\">\u003c/p>\n\u003cp>\u003cimg loading=\"lazy\" decoding=\"async\" class=\"aligncenter size-full wp-image-846084\" src=\"http://ww2.kqed.org/science/wp-content/uploads/sites/35/2016/07/heatBanner_dayssince1970_720_40_s_c1_c_c.png\" alt=\"heatBanner_dayssince1970_720_40_s_c1_c_c\" width=\"720\" height=\"40\" srcset=\"https://cdn.kqed.org/wp-content/uploads/sites/35/2016/07/heatBanner_dayssince1970_720_40_s_c1_c_c.png 720w, https://cdn.kqed.org/wp-content/uploads/sites/35/2016/07/heatBanner_dayssince1970_720_40_s_c1_c_c-400x22.png 400w\" sizes=\"(max-width: 720px) 100vw, 720px\">\u003c/p>\n\u003cp>Even in the absence of high humidity, extremely hot days pose a considerable health threat, particularly under prolonged exposure. Across most of the U.S. temperatures have increasingly been exceeding 90°F, 95°F, and 100°F since 1970.\u003c/p>\n\u003cp>Our analysis of trends in extreme heat days is based on annual counts of 90°F, 95°F, and 100°F exceedances in the country’s largest 200 cities. The hottest cities are seeing the biggest average increases in extreme heat days, in general.\u003c/p>\n\u003cp>The top 25 cities that have seen the biggest increase in annual average days above 90°F since 1970:\u003c/p>\n\u003cp>\u003cimg loading=\"lazy\" decoding=\"async\" class=\"aligncenter size-full wp-image-846085\" src=\"http://ww2.kqed.org/science/wp-content/uploads/sites/35/2016/07/HeatReport_90days_rank_500_485_s_c1_c_c.png\" alt=\"HeatReport_90days_rank_500_485_s_c1_c_c\" width=\"500\" height=\"485\" srcset=\"https://cdn.kqed.org/wp-content/uploads/sites/35/2016/07/HeatReport_90days_rank_500_485_s_c1_c_c.png 500w, https://cdn.kqed.org/wp-content/uploads/sites/35/2016/07/HeatReport_90days_rank_500_485_s_c1_c_c-400x388.png 400w, https://cdn.kqed.org/wp-content/uploads/sites/35/2016/07/HeatReport_90days_rank_500_485_s_c1_c_c-32x32.png 32w, https://cdn.kqed.org/wp-content/uploads/sites/35/2016/07/HeatReport_90days_rank_500_485_s_c1_c_c-50x50.png 50w\" sizes=\"(max-width: 500px) 100vw, 500px\">\u003c/p>\n\u003cp>The top 10 cities that have seen the biggest increase in 100°F days are:\u003c/p>\n\u003cp>\u003cimg loading=\"lazy\" decoding=\"async\" class=\"aligncenter size-full wp-image-846086\" src=\"http://ww2.kqed.org/science/wp-content/uploads/sites/35/2016/07/HeatReport_100days_rank_500_525_s_c1_c_c.png\" alt=\"HeatReport_100days_rank_500_525_s_c1_c_c\" width=\"500\" height=\"525\" srcset=\"https://cdn.kqed.org/wp-content/uploads/sites/35/2016/07/HeatReport_100days_rank_500_525_s_c1_c_c.png 500w, https://cdn.kqed.org/wp-content/uploads/sites/35/2016/07/HeatReport_100days_rank_500_525_s_c1_c_c-400x420.png 400w\" sizes=\"(max-width: 500px) 100vw, 500px\">\u003c/p>\n\u003cp>\u003cimg loading=\"lazy\" decoding=\"async\" class=\"aligncenter size-full wp-image-846087\" src=\"http://ww2.kqed.org/science/wp-content/uploads/sites/35/2016/07/heatBanner_warmingsummers_720_40_s_c1_c_c.png\" alt=\"heatBanner_warmingsummers_720_40_s_c1_c_c\" width=\"720\" height=\"40\" srcset=\"https://cdn.kqed.org/wp-content/uploads/sites/35/2016/07/heatBanner_warmingsummers_720_40_s_c1_c_c.png 720w, https://cdn.kqed.org/wp-content/uploads/sites/35/2016/07/heatBanner_warmingsummers_720_40_s_c1_c_c-400x22.png 400w\" sizes=\"(max-width: 720px) 100vw, 720px\">\u003c/p>\n\u003cp>Since 1970, summers have been warming in 45 of the lower 48 states. In many of these states, this warming is driven largely by nighttime temperatures getting hotter.\u003c/p>\n\u003cp>\u003cimg loading=\"lazy\" decoding=\"async\" class=\"aligncenter size-full wp-image-846088\" src=\"http://ww2.kqed.org/science/wp-content/uploads/sites/35/2016/07/Fastest-warming-summers.png\" alt=\"Fastest warming summers\" width=\"500\" height=\"499\" srcset=\"https://cdn.kqed.org/wp-content/uploads/sites/35/2016/07/Fastest-warming-summers.png 500w, https://cdn.kqed.org/wp-content/uploads/sites/35/2016/07/Fastest-warming-summers-400x399.png 400w, https://cdn.kqed.org/wp-content/uploads/sites/35/2016/07/Fastest-warming-summers-32x32.png 32w, https://cdn.kqed.org/wp-content/uploads/sites/35/2016/07/Fastest-warming-summers-50x50.png 50w, https://cdn.kqed.org/wp-content/uploads/sites/35/2016/07/Fastest-warming-summers-64x64.png 64w, https://cdn.kqed.org/wp-content/uploads/sites/35/2016/07/Fastest-warming-summers-96x96.png 96w, https://cdn.kqed.org/wp-content/uploads/sites/35/2016/07/Fastest-warming-summers-128x128.png 128w, https://cdn.kqed.org/wp-content/uploads/sites/35/2016/07/Fastest-warming-summers-150x150.png 150w\" sizes=\"(max-width: 500px) 100vw, 500px\">\u003c/p>\n\u003cp>\u003cimg loading=\"lazy\" decoding=\"async\" class=\"aligncenter size-full wp-image-846089\" src=\"http://ww2.kqed.org/science/wp-content/uploads/sites/35/2016/07/Steamier-summers.png\" alt=\"Steamier summers\" width=\"720\" height=\"40\" srcset=\"https://cdn.kqed.org/wp-content/uploads/sites/35/2016/07/Steamier-summers.png 720w, https://cdn.kqed.org/wp-content/uploads/sites/35/2016/07/Steamier-summers-400x22.png 400w\" sizes=\"(max-width: 720px) 100vw, 720px\">\u003c/p>\n\u003cp>As temperatures rise, evaporation increases, causing increased water vapor in the air. That extra moisture makes the air feel muggier, and can make it a lot more difficult to tolerate the heat because our bodies have a harder time keeping cool through perspiration. As summers warm across the country from increasing greenhouse gases, cities are also getting sticker.\u003c/p>\n\u003cp>Climate Central analyzed how the average summer dew point has changed in 200 major U.S. cities since 1970 (the \u003ca href=\"http://wxshift.com/videos/ask-a-met-dew-point\">dew point\u003c/a> is a measure of how much moisture is in the air). We found that 87 percent of those cities have experienced an overall increase in their average summer dew point over the past 46 years, indicating that there is typically more moisture in the air on hot summer days now than there used to be.\u003c/p>\n\u003cp>The top 25 cities seeing the largest increase in summer air moisture since the 1970s are (several of which are among the fastest warming cities in the country):\u003c/p>\n\u003cp>\u003cimg loading=\"lazy\" decoding=\"async\" class=\"aligncenter size-full wp-image-846090\" src=\"http://ww2.kqed.org/science/wp-content/uploads/sites/35/2016/07/HeatReport_Dewpoints_500_495_s_c1_c_c.png\" alt=\"HeatReport_Dewpoints_500_495_s_c1_c_c\" width=\"500\" height=\"495\" srcset=\"https://cdn.kqed.org/wp-content/uploads/sites/35/2016/07/HeatReport_Dewpoints_500_495_s_c1_c_c.png 500w, https://cdn.kqed.org/wp-content/uploads/sites/35/2016/07/HeatReport_Dewpoints_500_495_s_c1_c_c-400x396.png 400w, https://cdn.kqed.org/wp-content/uploads/sites/35/2016/07/HeatReport_Dewpoints_500_495_s_c1_c_c-32x32.png 32w, https://cdn.kqed.org/wp-content/uploads/sites/35/2016/07/HeatReport_Dewpoints_500_495_s_c1_c_c-50x50.png 50w, https://cdn.kqed.org/wp-content/uploads/sites/35/2016/07/HeatReport_Dewpoints_500_495_s_c1_c_c-64x64.png 64w, https://cdn.kqed.org/wp-content/uploads/sites/35/2016/07/HeatReport_Dewpoints_500_495_s_c1_c_c-96x96.png 96w, https://cdn.kqed.org/wp-content/uploads/sites/35/2016/07/HeatReport_Dewpoints_500_495_s_c1_c_c-128x128.png 128w, https://cdn.kqed.org/wp-content/uploads/sites/35/2016/07/HeatReport_Dewpoints_500_495_s_c1_c_c-150x150.png 150w\" sizes=\"(max-width: 500px) 100vw, 500px\">\u003c/p>\n\u003cp>\u003ca href=\"http://www.climatecentral.org/\">Climate Central\u003c/a> \u003cem>is an independent organization that researches and reports on climate change.\u003c/em>\u003c/p>\n\u003cp>\u003cem>Analysis by Alyson Kenward, PhD, Jennifer Brady, James Bronzan and Todd Sanford. Read full \u003ca href=\"http://assets.climatecentral.org/pdfs/Heat_methodology.pdf\" target=\"_blank\" rel=\"noopener\">methodology\u003c/a>. \u003c/em>\u003c/p>\n\u003cp>\u003cem>Footnotes:\u003c/em>\u003c/p>\n\u003cp>\u003cem>1. Harvard Medical School (2005), \u003ca href=\"http://ccsl.iccip.net/ccf_report_oct_06.pdf\" target=\"_blank\" rel=\"noopener\">Climate Change Futures: Health, Ecological and Economic Dimensions\u003c/a>, Cambridge, MA: The Center for Health and the Global Environment, Harvard Medical School.\u003c/em>\u003c/p>\n\u003cp>\u003cem>2. Centers for Disease Control, \u003ca href=\"https://www.cdc.gov/extremeheat/\" target=\"_blank\" rel=\"noopener\">Extreme Heat and Your Health\u003c/a>, 2011\u003c/em>\u003c/p>\n\u003cp>\u003cem>3. Palecki et al. (2001), Bulletin of the American Meteorological Society. T\u003ca href=\"http://journals.ametsoc.org/doi/pdf/10.1175/1520-0477%282001%29082%3C1353%3ATNAIOT%3E2.3.CO%3B2\" target=\"_blank\" rel=\"noopener\">he Nature and Impacts of the July 1999 Heat Wave in the Midwestern United States: Learning From the Lessons of 1995\u003c/a>. 82:7, 1353. \u003c/em>\u003c/p>\n\u003cp>\u003cem>4. Semenza et al. (1999), Am. J. Preventive Med. \u003ca href=\"http://www.sciencedirect.com/science/article/pii/S0749379799000252\" target=\"_blank\" rel=\"noopener\">Excessive Hospitalizations During the July 1995 Heat Wave in Chicago\u003c/a>. 16:4, 269. \u003c/em>\u003c/p>\n\u003cp>\u003cem>5. U.S. Global Change Research Program (2016), T\u003ca href=\"https://health2016.globalchange.gov/\" target=\"_blank\" rel=\"noopener\">he Impacts of Climate Change on Human Health in the United States: A Scientific Assessment\u003c/a>. \u003c/em>\u003c/p>\n\u003cp>\u003cem>6. Becker, J.A. and L.K. Stewart (2011), American Family Physician. \u003ca href=\"http://www.ncbi.nlm.nih.gov/pubmed/21661715\" target=\"_blank\" rel=\"noopener\">Heat-related illness\u003c/a>. 83:11, 1325.\u003c/em>\u003c/p>\n\u003cp>\u003c/p>\u003c/div>",
"attributes": {
"named": {},
"numeric": []
}
},
{
"type": "component",
"content": "",
"name": "ad",
"attributes": {
"named": {
"label": "floatright"
},
"numeric": [
"floatright"
]
}
},
{
"type": "contentString",
"content": "\u003cdiv class=\"post-body\">\u003cp>\u003c/p>\n\u003cp>\u003cem>7. Glazer, J.L. (2005), American Family Physician. \u003ca href=\"http://www.aafp.org/afp/2005/0601/p2133.html\" target=\"_blank\" rel=\"noopener\">Management of Heatstroke and Heat Exhaustion\u003c/a>. 71:11, 2133.\u003c/em>\u003c/p>\n\n\u003c/div>\u003c/p>",
"attributes": {
"named": {},
"numeric": []
}
}
],
"link": "/science/845966/u-s-faces-dramatic-rise-in-extreme-heat-humidity",
"authors": [
"byline_science_845966"
],
"categories": [
"science_31",
"science_35",
"science_40"
],
"featImg": "science_846071",
"label": "source_science_845966"
},
"science_841345": {
"type": "posts",
"id": "science_841345",
"meta": {
"index": "posts_1716263798",
"site": "science",
"id": "841345",
"score": null,
"sort": [
1468267511000
]
},
"parent": 0,
"labelTerm": {},
"blocks": [],
"publishDate": 1468267511,
"format": "standard",
"title": "Governor Brown Looks to Extend Climate-Change Efforts",
"headTitle": "Governor Brown Looks to Extend Climate-Change Efforts | KQED",
"content": "\u003cp>Gov. Jerry Brown has launched a campaign to extend some of the most ambitious climate-change programs in the country and ensure his environmental legacy when he leaves office in two years.\u003c/p>\n\u003cp>The centerpiece of the push is a cap-and-trade program that aims to reduce the use of fossil fuels by forcing manufacturers and other companies to meet tougher emissions limits or pay up to exceed them. The program has been one of the most-watched efforts in the world aimed at the climate-changing fuels.\u003c/p>\n\u003cp>[contextly_sidebar id=”mucZabSoq9pMwf5Ev8R1JTwKRNTFHUFM”]The four-year-old program, however, is only authorized to operate until 2020 and faces a litany of challenges, including a lawsuit questioning its legality, poor sales of credits, and lukewarm support among Democratic legislators to extend it.\u003c/p>\n\u003cp>On Tuesday, the California Air Resources Board will release a proposed blueprint for continuing the cap-and-trade program until 2030, with a vote expected next year.\u003c/p>\n\u003cp>Supporters credit the strategy — born under previous Gov. Arnold Schwarzenegger, a Republican, and stemming from other climate change programs initiated under Brown — with helping to cut California’s overall output of emissions by 1.5 percent in its first two years, despite the massive energy demands of the state’s thriving economy.\u003c/p>\n\u003cp>[ad fullwidth]\u003c/p>\n\u003cp>With Brown set to leave office in 2018, a state appeals court is considering a challenge from the California Chamber of Commerce contending the pollution-credit program is an illegal tax, not a fee.\u003c/p>\n\u003cp>Environmental groups say the lawsuit and overall uncertainty about the survival of the program are undermining the market for pollution credits. A May auction saw companies buy only one-tenth of the available credits, leaving the state billions of dollars short in projected revenue from the sales.\u003c/p>\n\u003cp>Meanwhile, groups representing oil interests confirmed last week that they are in direct talks with the Brown administration over cap-and-trade.\u003c/p>\n\u003cp>California oil companies have long sought to alter or repeal the state’s low-carbon fuel standard. By 2020, those companies would be required to reduce the carbon content of gasoline and other fuels by 10 percent, a significant jump from the current 2 percent.\u003c/p>\n\u003cp>Any deal-making on climate change would reflect a pragmatic approach to the oil industry by Brown, who took office encouraging immediate boosts in oil and gas drilling to spur California’s economy, even as he promoted incentives that would reduce long-term reliance on fossil fuels.\u003c/p>\n\u003cp>“What you’re seeing now is an all-hands-on-deck effort to formulate the most responsible way forward.” said Derek Walker, an associate vice president of the Environmental Defense Fund. “They’re talking to the oil industry, talking to environmental groups, to organized labor — they’re talking to everybody.”\u003c/p>\n\u003cp>Brown has leveraged his position as governor to help draw attention to the battle against climate change. He has set non-binding mandates for increased use of solar, wind and other renewable energy sources in California in the decades to come while signing accords and global support statements aimed at easing climate change.\u003c/p>\n\u003cp>At home, though, Brown has encountered trouble from moderate Democrats in the state Assembly who last year blocked his plan to slash statewide petroleum use in half within 15 years.\u003c/p>\n\u003cp>The same lawmakers refused to endorse legislation by Sen. Fran Pavley, D-Agoura Hills, seeking to dramatically cut greenhouse gas emissions through 2050. Pavley was forced to scale back her proposal that now would extend only to 2030. She has since compromised even further, agreeing last month to merge parts of her plan with legislation mandating that revenues from such programs be spent in low-income communities affected by pollution.\u003c/p>\n\u003cp>Winning legislative support could be key for Brown in ensuring the survival of the cap-and-trade program, said Jessica Levinson, a political science professor at Loyola Law School.\u003c/p>\n\u003cp>“His ability to solidify cap and trade is a big part of being able to say to other governors, to other countries, ‘We’re doing something big and specific and real and it works,'” Levinson said.\u003c/p>\n\u003cp>\u003c/p>\n\u003cp>Should the program succumb to legal challenges, market weakness or legislative ambivalence: “Jerry Brown’s fingerprints will be on whatever we ultimately decide to do,” Levinson said.\u003c/p>\n\n",
"stats": {
"hasVideo": false,
"hasChartOrMap": false,
"hasAudio": false,
"hasPolis": false,
"wordCount": 723,
"hasGoogleForm": false,
"hasGallery": false,
"hasHearkenModule": false,
"iframeSrcs": [],
"paragraphCount": 19
},
"modified": 1704929940,
"excerpt": "On Tuesday, the California Air Resources Board will release a proposal for continuing the state's cap-and-trade program beyond 2020.",
"headData": {
"twImgId": "",
"twTitle": "",
"ogTitle": "",
"ogImgId": "",
"twDescription": "",
"description": "On Tuesday, the California Air Resources Board will release a proposal for continuing the state's cap-and-trade program beyond 2020.",
"title": "Governor Brown Looks to Extend Climate-Change Efforts | KQED",
"ogDescription": "",
"schema": {
"@context": "https://schema.org",
"@type": "Article",
"headline": "Governor Brown Looks to Extend Climate-Change Efforts",
"datePublished": "2016-07-11T13:05:11-07:00",
"dateModified": "2024-01-10T15:39:00-08:00",
"image": "https://cdn.kqed.org/wp-content/uploads/2020/02/KQED-OG-Image@1x.png"
}
},
"guestAuthors": [],
"slug": "governor-brown-looks-to-extend-climate-change-efforts",
"status": "publish",
"nprByline": "Ellen Knickmeyer\u003c/br>Associated Press",
"sticky": false,
"source": "Associated Press",
"path": "/science/841345/governor-brown-looks-to-extend-climate-change-efforts",
"audioTrackLength": null,
"parsedContent": [
{
"type": "contentString",
"content": "\u003cdiv class=\"post-body\">\u003cp>\u003cp>Gov. Jerry Brown has launched a campaign to extend some of the most ambitious climate-change programs in the country and ensure his environmental legacy when he leaves office in two years.\u003c/p>\n\u003cp>The centerpiece of the push is a cap-and-trade program that aims to reduce the use of fossil fuels by forcing manufacturers and other companies to meet tougher emissions limits or pay up to exceed them. The program has been one of the most-watched efforts in the world aimed at the climate-changing fuels.\u003c/p>\n\u003cp>\u003c/p>\u003cp>\u003c/p>\u003cp>The four-year-old program, however, is only authorized to operate until 2020 and faces a litany of challenges, including a lawsuit questioning its legality, poor sales of credits, and lukewarm support among Democratic legislators to extend it.\u003c/p>\n\u003cp>On Tuesday, the California Air Resources Board will release a proposed blueprint for continuing the cap-and-trade program until 2030, with a vote expected next year.\u003c/p>\n\u003cp>Supporters credit the strategy — born under previous Gov. Arnold Schwarzenegger, a Republican, and stemming from other climate change programs initiated under Brown — with helping to cut California’s overall output of emissions by 1.5 percent in its first two years, despite the massive energy demands of the state’s thriving economy.\u003c/p>\n\u003cp>\u003c/p>\u003c/div>",
"attributes": {
"named": {},
"numeric": []
}
},
{
"type": "component",
"content": "",
"name": "ad",
"attributes": {
"named": {
"label": "fullwidth"
},
"numeric": [
"fullwidth"
]
}
},
{
"type": "contentString",
"content": "\u003cdiv class=\"post-body\">\u003cp>\u003c/p>\n\u003cp>With Brown set to leave office in 2018, a state appeals court is considering a challenge from the California Chamber of Commerce contending the pollution-credit program is an illegal tax, not a fee.\u003c/p>\n\u003cp>Environmental groups say the lawsuit and overall uncertainty about the survival of the program are undermining the market for pollution credits. A May auction saw companies buy only one-tenth of the available credits, leaving the state billions of dollars short in projected revenue from the sales.\u003c/p>\n\u003cp>Meanwhile, groups representing oil interests confirmed last week that they are in direct talks with the Brown administration over cap-and-trade.\u003c/p>\n\u003cp>California oil companies have long sought to alter or repeal the state’s low-carbon fuel standard. By 2020, those companies would be required to reduce the carbon content of gasoline and other fuels by 10 percent, a significant jump from the current 2 percent.\u003c/p>\n\u003cp>Any deal-making on climate change would reflect a pragmatic approach to the oil industry by Brown, who took office encouraging immediate boosts in oil and gas drilling to spur California’s economy, even as he promoted incentives that would reduce long-term reliance on fossil fuels.\u003c/p>\n\u003cp>“What you’re seeing now is an all-hands-on-deck effort to formulate the most responsible way forward.” said Derek Walker, an associate vice president of the Environmental Defense Fund. “They’re talking to the oil industry, talking to environmental groups, to organized labor — they’re talking to everybody.”\u003c/p>\n\u003cp>Brown has leveraged his position as governor to help draw attention to the battle against climate change. He has set non-binding mandates for increased use of solar, wind and other renewable energy sources in California in the decades to come while signing accords and global support statements aimed at easing climate change.\u003c/p>\n\u003cp>At home, though, Brown has encountered trouble from moderate Democrats in the state Assembly who last year blocked his plan to slash statewide petroleum use in half within 15 years.\u003c/p>\n\u003cp>The same lawmakers refused to endorse legislation by Sen. Fran Pavley, D-Agoura Hills, seeking to dramatically cut greenhouse gas emissions through 2050. Pavley was forced to scale back her proposal that now would extend only to 2030. She has since compromised even further, agreeing last month to merge parts of her plan with legislation mandating that revenues from such programs be spent in low-income communities affected by pollution.\u003c/p>\n\u003cp>Winning legislative support could be key for Brown in ensuring the survival of the cap-and-trade program, said Jessica Levinson, a political science professor at Loyola Law School.\u003c/p>\n\u003cp>“His ability to solidify cap and trade is a big part of being able to say to other governors, to other countries, ‘We’re doing something big and specific and real and it works,'” Levinson said.\u003c/p>\n\u003cp>\u003c/p>\n\u003cp>Should the program succumb to legal challenges, market weakness or legislative ambivalence: “Jerry Brown’s fingerprints will be on whatever we ultimately decide to do,” Levinson said.\u003c/p>\n\n\u003c/div>\u003c/p>",
"attributes": {
"named": {},
"numeric": []
}
}
],
"link": "/science/841345/governor-brown-looks-to-extend-climate-change-efforts",
"authors": [
"byline_science_841345"
],
"categories": [
"science_31",
"science_40"
],
"featImg": "science_841350",
"label": "source_science_841345"
},
"science_841018": {
"type": "posts",
"id": "science_841018",
"meta": {
"index": "posts_1716263798",
"site": "science",
"id": "841018",
"score": null,
"sort": [
1468256682000
]
},
"parent": 0,
"labelTerm": {},
"blocks": [],
"publishDate": 1468256682,
"format": "standard",
"title": "California Drought, Marine Heat More Likely With Warming",
"headTitle": "California Drought, Marine Heat More Likely With Warming | KQED",
"content": "\u003cp>A persistent wash of warm waters off the West Coast, which caused wildlife die-offs and blocked drought-quenching storms from reaching California last year, was caused by the happenstance interplay of natural ocean cycles, research findings published Monday show.\u003c/p>\n\u003cp>The findings also suggested that while the drought and the blob of warm water were the result of the natural whims of the weather, climate change could make such events more likely and intense in the future. To a small extent, it’s already doing so.\u003c/p>\n\u003cp>“The atmospheric variability that forced the warm blob is the same that forced the drought,” said \u003ca href=\"http://ocean.eas.gatech.edu/manu/\">Emanuele Di Lorenzo\u003c/a>, an ocean and climate dynamics professor at Georgia Tech who coauthored the analysis, \u003ca href=\"http://nature.com/articles/doi:10.1038/nclimate3082\">published in Nature Climate Change\u003c/a>. “This atmospheric variability is increasing under greenhouse gases.”\u003c/p>\n\u003cp>The new findings could help scientists predict when similar marine heatwaves and droughts will strike in the future. They also suggest such heatwaves will become more common and intense, which could mean greater drought risks in the West. (By increasing evaporation and reducing snowfall, warmer temperatures are already making Western droughts worse.)\u003c/p>\n\u003cp>“This could potentially provide predictability,” said \u003ca href=\"http://www.atmos.washington.edu/~cliff/cliff.php\">Cliff Mass\u003c/a>, a University of Washington atmospheric sciences professor who wasn’t involved with the research. “This is natural variability that we’re dealing with.”\u003c/p>\n\u003cp>[ad fullwidth]\u003c/p>\n\u003cp>A patch of warm water that appeared off the West Coast during the fall of 2013 spread through the Gulf of Alaska into 2014, with winter water temperatures exceeding 5°F above average. The marine heatwave persisted but waned during the year and then burst back to its former devastating glory a winter later, affecting the entire coast, from Mexico to Alaska.\u003c/p>\n\u003cp>The result was ecological tumult. Alaskan fishermen \u003ca href=\"http://www.climatecentral.org/news/west-coast-warming-natural-variability-18067\">netted tropical species\u003c/a>. A poisonous algae bloom linked to warm waters kept crabbers from California to Washington off the water. Seabirds and sea lions starved on beaches.\u003c/p>\n\u003cp>The warm water was the result of an atmospheric accomplice that helped to parch the West: a ridge of high pressure. The timing was unfortunate. Experts had expected \u003ca href=\"http://www.climatecentral.org/news/monster-el-nino-transforms-worlds-weather-20138\">one of the most powerful El Niños\u003c/a> on record last year to douse California’s drought, but the high pressure system off southern California deflected its hearty storms northward.\u003c/p>\n\u003cp>With El Niño now over, California is stuck in its \u003ca href=\"http://droughtmonitor.unl.edu/Home/StateDroughtMonitor.aspx?CA\">fifth year of drought\u003c/a>, with the most severe conditions in the south, where the ridge’s effects were strongest. And scientists are left trying to unravel the mystery of what just happened.\u003c/p>\n\u003cp>Di Lorenzo and \u003ca href=\"http://www.atmos.washington.edu/~mantua/work.html\">Nathan Mantua\u003c/a>, a National Oceanic and Atmospheric Administration scientist, wanted to know whether the warm ocean winter of 2015 was linked to the warm ocean winter a year earlier. Understanding any links could boosts scientists’ abilities to forecast the future.\u003c/p>\n\u003cfigure id=\"attachment_841024\" class=\"wp-caption aligncenter\" style=\"max-width: 720px\">\u003cimg loading=\"lazy\" decoding=\"async\" class=\"size-full wp-image-841024\" src=\"http://ww2.kqed.org/science/wp-content/uploads/sites/35/2016/07/climate-central-fire.jpg\" alt=\"California's persistent drough is fueling wildfires. \" width=\"720\" height=\"406\" srcset=\"https://cdn.kqed.org/wp-content/uploads/sites/35/2016/07/climate-central-fire.jpg 720w, https://cdn.kqed.org/wp-content/uploads/sites/35/2016/07/climate-central-fire-400x226.jpg 400w\" sizes=\"(max-width: 720px) 100vw, 720px\">\u003cfigcaption class=\"wp-caption-text\">California’s persistent drough is fueling wildfires. \u003ccite>(Russ Allison Loar/Flickr)\u003c/cite>\u003c/figcaption>\u003c/figure>\n\u003cp>The pair analyzed temperature records and model simulations, discovering that they could force models to re-enact the observed conditions in ways that pointed to the influence of well-known ocean cycles.\u003c/p>\n\u003cp>“These climate patterns tend to have some influence on each other, and then El Niño is a central player in coordinating the connection,” Mantua said. “Looking at the historical record we see that similar things have happened, but never to the extreme that was observed in the last few years.”\u003c/p>\n\u003cp>Mantua said the connections that El Niño helped to forge between warm waters in the Gulf of Alaska in 2014 and along coastlines further south could account for about half of the unusually warm water temperature in 2015 — over and above long-term warming rates. (Scientists call these long-distance connections, the likes of which are common around the planet, ‘teleconnections.’)\u003c/p>\n\u003cp>“That means about half of the extreme we can’t account for,” Mantua said. “One possibility is it’s just bad luck that things lined up in this way.”\u003c/p>\n\u003cp>Scripps researcher \u003ca href=\"http://scrippsscholars.ucsd.edu/agershunov/biocv\">Alexander Gershunov\u003c/a> said the new analysis “insightfully synthesizes previous research” in a way that could create a new paradigm for scientists, helping them understand invisible connections between different patterns of natural variation in the Pacific Ocean. And that could help with long-range weather forecasting.\u003c/p>\n\u003cp>“If it holds up to scrutiny, the new paradigm may prove instrumental in significantly extending the lead time for forecasting El Niño,” Gershunov said.\u003c/p>\n\u003cp>The conclusion that climate change could exacerbate Western drought risks didn’t surprise Stanford University climate scientist \u003ca href=\"https://earth.stanford.edu/noah-diffenbaugh\">Noah Diffenbaugh\u003c/a>. His own research has linked greenhouse gas pollution from fossil fuels, farming and deforestation with weather patterns that can fuel Californian droughts.\u003c/p>\n\u003cp>\u003c/p>\n\u003cp>“We’re finding the conditions that have been present during the recent drought years, that those are more probable with increasing greenhouse gas forcings,” Diffenbaugh said.\u003c/p>\n\n",
"stats": {
"hasVideo": false,
"hasChartOrMap": false,
"hasAudio": false,
"hasPolis": false,
"wordCount": 822,
"hasGoogleForm": false,
"hasGallery": false,
"hasHearkenModule": false,
"iframeSrcs": [],
"paragraphCount": 20
},
"modified": 1704929944,
"excerpt": "Conditions behind California's drought and warm coastal waters were mostly natural, but not entirely.",
"headData": {
"twImgId": "",
"twTitle": "",
"ogTitle": "",
"ogImgId": "",
"twDescription": "",
"description": "Conditions behind California's drought and warm coastal waters were mostly natural, but not entirely.",
"title": "California Drought, Marine Heat More Likely With Warming | KQED",
"ogDescription": "",
"schema": {
"@context": "https://schema.org",
"@type": "Article",
"headline": "California Drought, Marine Heat More Likely With Warming",
"datePublished": "2016-07-11T10:04:42-07:00",
"dateModified": "2024-01-10T15:39:04-08:00",
"image": "https://cdn.kqed.org/wp-content/uploads/2020/02/KQED-OG-Image@1x.png"
}
},
"guestAuthors": [],
"slug": "california-drought-marine-heat-more-likely-with-warming",
"status": "publish",
"sourceUrl": "http://www.climatecentral.org/",
"nprByline": "John Upton\u003c/br>Climate Central",
"sticky": false,
"source": "Climate Central",
"path": "/science/841018/california-drought-marine-heat-more-likely-with-warming",
"audioTrackLength": null,
"parsedContent": [
{
"type": "contentString",
"content": "\u003cdiv class=\"post-body\">\u003cp>\u003cp>A persistent wash of warm waters off the West Coast, which caused wildlife die-offs and blocked drought-quenching storms from reaching California last year, was caused by the happenstance interplay of natural ocean cycles, research findings published Monday show.\u003c/p>\n\u003cp>The findings also suggested that while the drought and the blob of warm water were the result of the natural whims of the weather, climate change could make such events more likely and intense in the future. To a small extent, it’s already doing so.\u003c/p>\n\u003cp>“The atmospheric variability that forced the warm blob is the same that forced the drought,” said \u003ca href=\"http://ocean.eas.gatech.edu/manu/\">Emanuele Di Lorenzo\u003c/a>, an ocean and climate dynamics professor at Georgia Tech who coauthored the analysis, \u003ca href=\"http://nature.com/articles/doi:10.1038/nclimate3082\">published in Nature Climate Change\u003c/a>. “This atmospheric variability is increasing under greenhouse gases.”\u003c/p>\n\u003cp>The new findings could help scientists predict when similar marine heatwaves and droughts will strike in the future. They also suggest such heatwaves will become more common and intense, which could mean greater drought risks in the West. (By increasing evaporation and reducing snowfall, warmer temperatures are already making Western droughts worse.)\u003c/p>\n\u003cp>“This could potentially provide predictability,” said \u003ca href=\"http://www.atmos.washington.edu/~cliff/cliff.php\">Cliff Mass\u003c/a>, a University of Washington atmospheric sciences professor who wasn’t involved with the research. “This is natural variability that we’re dealing with.”\u003c/p>\n\u003cp>\u003c/p>\u003c/div>",
"attributes": {
"named": {},
"numeric": []
}
},
{
"type": "component",
"content": "",
"name": "ad",
"attributes": {
"named": {
"label": "fullwidth"
},
"numeric": [
"fullwidth"
]
}
},
{
"type": "contentString",
"content": "\u003cdiv class=\"post-body\">\u003cp>\u003c/p>\n\u003cp>A patch of warm water that appeared off the West Coast during the fall of 2013 spread through the Gulf of Alaska into 2014, with winter water temperatures exceeding 5°F above average. The marine heatwave persisted but waned during the year and then burst back to its former devastating glory a winter later, affecting the entire coast, from Mexico to Alaska.\u003c/p>\n\u003cp>The result was ecological tumult. Alaskan fishermen \u003ca href=\"http://www.climatecentral.org/news/west-coast-warming-natural-variability-18067\">netted tropical species\u003c/a>. A poisonous algae bloom linked to warm waters kept crabbers from California to Washington off the water. Seabirds and sea lions starved on beaches.\u003c/p>\n\u003cp>The warm water was the result of an atmospheric accomplice that helped to parch the West: a ridge of high pressure. The timing was unfortunate. Experts had expected \u003ca href=\"http://www.climatecentral.org/news/monster-el-nino-transforms-worlds-weather-20138\">one of the most powerful El Niños\u003c/a> on record last year to douse California’s drought, but the high pressure system off southern California deflected its hearty storms northward.\u003c/p>\n\u003cp>With El Niño now over, California is stuck in its \u003ca href=\"http://droughtmonitor.unl.edu/Home/StateDroughtMonitor.aspx?CA\">fifth year of drought\u003c/a>, with the most severe conditions in the south, where the ridge’s effects were strongest. And scientists are left trying to unravel the mystery of what just happened.\u003c/p>\n\u003cp>Di Lorenzo and \u003ca href=\"http://www.atmos.washington.edu/~mantua/work.html\">Nathan Mantua\u003c/a>, a National Oceanic and Atmospheric Administration scientist, wanted to know whether the warm ocean winter of 2015 was linked to the warm ocean winter a year earlier. Understanding any links could boosts scientists’ abilities to forecast the future.\u003c/p>\n\u003cfigure id=\"attachment_841024\" class=\"wp-caption aligncenter\" style=\"max-width: 720px\">\u003cimg loading=\"lazy\" decoding=\"async\" class=\"size-full wp-image-841024\" src=\"http://ww2.kqed.org/science/wp-content/uploads/sites/35/2016/07/climate-central-fire.jpg\" alt=\"California's persistent drough is fueling wildfires. \" width=\"720\" height=\"406\" srcset=\"https://cdn.kqed.org/wp-content/uploads/sites/35/2016/07/climate-central-fire.jpg 720w, https://cdn.kqed.org/wp-content/uploads/sites/35/2016/07/climate-central-fire-400x226.jpg 400w\" sizes=\"(max-width: 720px) 100vw, 720px\">\u003cfigcaption class=\"wp-caption-text\">California’s persistent drough is fueling wildfires. \u003ccite>(Russ Allison Loar/Flickr)\u003c/cite>\u003c/figcaption>\u003c/figure>\n\u003cp>The pair analyzed temperature records and model simulations, discovering that they could force models to re-enact the observed conditions in ways that pointed to the influence of well-known ocean cycles.\u003c/p>\n\u003cp>“These climate patterns tend to have some influence on each other, and then El Niño is a central player in coordinating the connection,” Mantua said. “Looking at the historical record we see that similar things have happened, but never to the extreme that was observed in the last few years.”\u003c/p>\n\u003cp>Mantua said the connections that El Niño helped to forge between warm waters in the Gulf of Alaska in 2014 and along coastlines further south could account for about half of the unusually warm water temperature in 2015 — over and above long-term warming rates. (Scientists call these long-distance connections, the likes of which are common around the planet, ‘teleconnections.’)\u003c/p>\n\u003cp>“That means about half of the extreme we can’t account for,” Mantua said. “One possibility is it’s just bad luck that things lined up in this way.”\u003c/p>\n\u003cp>Scripps researcher \u003ca href=\"http://scrippsscholars.ucsd.edu/agershunov/biocv\">Alexander Gershunov\u003c/a> said the new analysis “insightfully synthesizes previous research” in a way that could create a new paradigm for scientists, helping them understand invisible connections between different patterns of natural variation in the Pacific Ocean. And that could help with long-range weather forecasting.\u003c/p>\n\u003cp>“If it holds up to scrutiny, the new paradigm may prove instrumental in significantly extending the lead time for forecasting El Niño,” Gershunov said.\u003c/p>\n\u003cp>The conclusion that climate change could exacerbate Western drought risks didn’t surprise Stanford University climate scientist \u003ca href=\"https://earth.stanford.edu/noah-diffenbaugh\">Noah Diffenbaugh\u003c/a>. His own research has linked greenhouse gas pollution from fossil fuels, farming and deforestation with weather patterns that can fuel Californian droughts.\u003c/p>\n\u003cp>\u003c/p>\n\u003cp>“We’re finding the conditions that have been present during the recent drought years, that those are more probable with increasing greenhouse gas forcings,” Diffenbaugh said.\u003c/p>\n\n\u003c/div>\u003c/p>",
"attributes": {
"named": {},
"numeric": []
}
}
],
"link": "/science/841018/california-drought-marine-heat-more-likely-with-warming",
"authors": [
"byline_science_841018"
],
"categories": [
"science_31",
"science_40",
"science_2873",
"science_98"
],
"featImg": "science_841021",
"label": "source_science_841018"
},
"science_841008": {
"type": "posts",
"id": "science_841008",
"meta": {
"index": "posts_1716263798",
"site": "science",
"id": "841008",
"score": null,
"sort": [
1468254459000
]
},
"parent": 0,
"labelTerm": {},
"blocks": [],
"publishDate": 1468254459,
"format": "standard",
"title": "Climate Change May Already Be Shifting Clouds Toward the Poles",
"headTitle": "Climate Change May Already Be Shifting Clouds Toward the Poles | KQED",
"content": "\u003cp>The way clouds cover the Earth may be changing because of global warming, according to a study published Monday that used satellite data to track cloud patterns across about two decades, starting in the 1980s.\u003c/p>\n\u003cp>Clouds in the mid-latitudes shifted toward the poles during that period, as the subtropical dry zones expanded and the highest cloud-tops got higher.\u003c/p>\n\u003cp>These changes are predicted by most climate models of global warming, even though those models disagree on a lot of other things related to clouds, says \u003ca href=\"http://meteora.ucsd.edu/~jnorris/\">Joel Norris\u003c/a>, a climate scientist at the University of California, San Diego.\u003c/p>\n\u003cp>“I guess what was surprising is that a lot of times we think of climate change as something that’s going to occur in the future,” says Norris. “This is happening right now. It’s happened during my lifetime — it was a bit startling.”\u003c/p>\n\u003cp>About 70 percent of our planet is covered by clouds, at any given moment. These constantly moving shape-shifters aren’t exactly easy for scientists to study.\u003c/p>\n\u003cp>[ad fullwidth]\u003c/p>\n\u003cp>Clouds aren’t as simple as their fluffy nature might suggest. To understand them, scientists have to track the behavior of tiny water droplets, as well as huge masses of clouds that might be hundreds of miles wide.\u003c/p>\n\u003cp>And climate modelers also have to take into account the fact that clouds can have two different effects on temperatures.\u003c/p>\n\u003cp>“During daytime, if there are a lot of clouds present, thick clouds, then that will keep the temperature cooler,” says Norris, because clouds reflect incoming sunlight back to space.\u003c/p>\n\u003cp>But thick clouds can also act like a blanket that keeps the Earth’s warmth in, he says, “which is the reason why a cloudy night won’t be as cold at the surface as a clear night.”\u003c/p>\n\u003cp>Clouds have been called the \u003ca href=\"http://www.nsf.gov/news/special_reports/clouds/\">wild card\u003c/a> of climate science. Researchers argue over how exactly global warming will affect clouds and vice versa.\u003c/p>\n\u003cp>While weather satellites can give you tons of cloud pictures, Norris says these satellites aren’t that great for trying to figure out long-term trends.\u003c/p>\n\u003cp>“The difficulties we have is that every few years a new satellite is put up with a different instrument, the orbits change, and this all changes how much cloud the satellite measures,” Norris explains.\u003c/p>\n\u003cp>So he and his colleagues recently did a bunch of corrections that would make it possible to compare cloud measurements over a couple of decades, starting in the 1980s.\u003c/p>\n\u003cp>In this week’s issue of the journal \u003ca href=\"http://www.nature.com/articles/doi:10.1038/nature18273\">Nature\u003c/a>, the researchers explain how their findings match what scientists would expect to see, based on climate models.\u003c/p>\n\u003cp>Norris says it’s probably happening primarily because of two influences — human-produced global warming, and also the recovery from the cooling effect of two volcanic eruptions during that time frame.\u003c/p>\n\u003cp>So will other climate researchers buy this new history of clouds? \u003ca href=\"http://www.cgd.ucar.edu/staff/trenbert/\">Kevin Trenberth\u003c/a> at the National Center for Atmospheric Research in Colorado isn’t so sure.\u003c/p>\n\u003cp>“This is a very good attempt to try and get a handle on this, but I don’t think it’s the final answer,” says Trenberth, who notes that the time frame studied was pretty short and included a period often described as the \u003ca href=\"http://www.nature.com/news/global-warming-hiatus-debate-flares-up-again-1.19414\">global warming hiatus\u003c/a>, from 1999 to 2013.\u003c/p>\n\u003cp>\u003c/p>\n\u003cp>Climate researchers still have a lot of work to do when it comes to understanding clouds, says Trenberth, who believes the state of the science is still like that old \u003ca href=\"http://jonimitchell.com/\">Joni Mitchell\u003c/a> song \u003cem>Both Sides Now, \u003c/em>in which she sings, “I really don’t know clouds at all.”\u003c/p>\n\u003cdiv class=\"fullattribution\">Copyright 2016 NPR. To see more, visit http://www.npr.org/.\u003cimg decoding=\"async\" src=\"http://www.google-analytics.com/__utm.gif?utmac=UA-5828686-4&utmdt=Climate+Change+May+Already+Be+Shifting+Clouds+Toward+The+Poles&utme=8(APIKey)9(MDAxOTAwOTE4MDEyMTkxMDAzNjczZDljZA004)\">\u003c/div>\n\n",
"stats": {
"hasVideo": false,
"hasChartOrMap": false,
"hasAudio": false,
"hasPolis": false,
"wordCount": 630,
"hasGoogleForm": false,
"hasGallery": false,
"hasHearkenModule": false,
"iframeSrcs": [],
"paragraphCount": 20
},
"modified": 1704929945,
"excerpt": "Scientists who have been tracking cloud patterns over the past two decades say the shifts they're seeing seem to correlate closely with what's predicted by computer models of Earth's changing climate.",
"headData": {
"twImgId": "",
"twTitle": "",
"ogTitle": "",
"ogImgId": "",
"twDescription": "",
"description": "Scientists who have been tracking cloud patterns over the past two decades say the shifts they're seeing seem to correlate closely with what's predicted by computer models of Earth's changing climate.",
"title": "Climate Change May Already Be Shifting Clouds Toward the Poles | KQED",
"ogDescription": "",
"schema": {
"@context": "https://schema.org",
"@type": "Article",
"headline": "Climate Change May Already Be Shifting Clouds Toward the Poles",
"datePublished": "2016-07-11T09:27:39-07:00",
"dateModified": "2024-01-10T15:39:05-08:00",
"image": "https://cdn.kqed.org/wp-content/uploads/2020/02/KQED-OG-Image@1x.png"
}
},
"guestAuthors": [],
"slug": "climate-change-may-already-be-shifting-clouds-toward-the-poles",
"status": "publish",
"sourceUrl": "http://www.npr.org/",
"nprApiLink": "http://api.npr.org/query?id=485314321&apiKey=MDAxOTAwOTE4MDEyMTkxMDAzNjczZDljZA004",
"nprByline": "Nell Greenfieldboyce\u003c/br>NPR",
"nprStoryDate": "Mon, 11 Jul 2016 11:01:00 -0400",
"nprLastModifiedDate": "Mon, 11 Jul 2016 11:33:19 -0400",
"sticky": false,
"nprHtmlLink": "http://www.npr.org/sections/thetwo-way/2016/07/11/485314321/climate-change-may-already-be-shifting-clouds-toward-the-poles?ft=nprml&f=485314321",
"nprImageAgency": "NOAA/Flickr",
"source": "NPR",
"nprStoryId": "485314321",
"nprRetrievedStory": "1",
"nprPubDate": "Mon, 11 Jul 2016 11:33:00 -0400",
"path": "/science/841008/climate-change-may-already-be-shifting-clouds-toward-the-poles",
"audioTrackLength": null,
"parsedContent": [
{
"type": "contentString",
"content": "\u003cdiv class=\"post-body\">\u003cp>\u003cp>The way clouds cover the Earth may be changing because of global warming, according to a study published Monday that used satellite data to track cloud patterns across about two decades, starting in the 1980s.\u003c/p>\n\u003cp>Clouds in the mid-latitudes shifted toward the poles during that period, as the subtropical dry zones expanded and the highest cloud-tops got higher.\u003c/p>\n\u003cp>These changes are predicted by most climate models of global warming, even though those models disagree on a lot of other things related to clouds, says \u003ca href=\"http://meteora.ucsd.edu/~jnorris/\">Joel Norris\u003c/a>, a climate scientist at the University of California, San Diego.\u003c/p>\n\u003cp>“I guess what was surprising is that a lot of times we think of climate change as something that’s going to occur in the future,” says Norris. “This is happening right now. It’s happened during my lifetime — it was a bit startling.”\u003c/p>\n\u003cp>About 70 percent of our planet is covered by clouds, at any given moment. These constantly moving shape-shifters aren’t exactly easy for scientists to study.\u003c/p>\n\u003cp>\u003c/p>\u003c/div>",
"attributes": {
"named": {},
"numeric": []
}
},
{
"type": "component",
"content": "",
"name": "ad",
"attributes": {
"named": {
"label": "fullwidth"
},
"numeric": [
"fullwidth"
]
}
},
{
"type": "contentString",
"content": "\u003cdiv class=\"post-body\">\u003cp>\u003c/p>\n\u003cp>Clouds aren’t as simple as their fluffy nature might suggest. To understand them, scientists have to track the behavior of tiny water droplets, as well as huge masses of clouds that might be hundreds of miles wide.\u003c/p>\n\u003cp>And climate modelers also have to take into account the fact that clouds can have two different effects on temperatures.\u003c/p>\n\u003cp>“During daytime, if there are a lot of clouds present, thick clouds, then that will keep the temperature cooler,” says Norris, because clouds reflect incoming sunlight back to space.\u003c/p>\n\u003cp>But thick clouds can also act like a blanket that keeps the Earth’s warmth in, he says, “which is the reason why a cloudy night won’t be as cold at the surface as a clear night.”\u003c/p>\n\u003cp>Clouds have been called the \u003ca href=\"http://www.nsf.gov/news/special_reports/clouds/\">wild card\u003c/a> of climate science. Researchers argue over how exactly global warming will affect clouds and vice versa.\u003c/p>\n\u003cp>While weather satellites can give you tons of cloud pictures, Norris says these satellites aren’t that great for trying to figure out long-term trends.\u003c/p>\n\u003cp>“The difficulties we have is that every few years a new satellite is put up with a different instrument, the orbits change, and this all changes how much cloud the satellite measures,” Norris explains.\u003c/p>\n\u003cp>So he and his colleagues recently did a bunch of corrections that would make it possible to compare cloud measurements over a couple of decades, starting in the 1980s.\u003c/p>\n\u003cp>In this week’s issue of the journal \u003ca href=\"http://www.nature.com/articles/doi:10.1038/nature18273\">Nature\u003c/a>, the researchers explain how their findings match what scientists would expect to see, based on climate models.\u003c/p>\n\u003cp>Norris says it’s probably happening primarily because of two influences — human-produced global warming, and also the recovery from the cooling effect of two volcanic eruptions during that time frame.\u003c/p>\n\u003cp>So will other climate researchers buy this new history of clouds? \u003ca href=\"http://www.cgd.ucar.edu/staff/trenbert/\">Kevin Trenberth\u003c/a> at the National Center for Atmospheric Research in Colorado isn’t so sure.\u003c/p>\n\u003cp>“This is a very good attempt to try and get a handle on this, but I don’t think it’s the final answer,” says Trenberth, who notes that the time frame studied was pretty short and included a period often described as the \u003ca href=\"http://www.nature.com/news/global-warming-hiatus-debate-flares-up-again-1.19414\">global warming hiatus\u003c/a>, from 1999 to 2013.\u003c/p>\n\u003cp>\u003c/p>\n\u003cp>Climate researchers still have a lot of work to do when it comes to understanding clouds, says Trenberth, who believes the state of the science is still like that old \u003ca href=\"http://jonimitchell.com/\">Joni Mitchell\u003c/a> song \u003cem>Both Sides Now, \u003c/em>in which she sings, “I really don’t know clouds at all.”\u003c/p>\n\u003cdiv class=\"fullattribution\">Copyright 2016 NPR. To see more, visit http://www.npr.org/.\u003cimg decoding=\"async\" src=\"http://www.google-analytics.com/__utm.gif?utmac=UA-5828686-4&utmdt=Climate+Change+May+Already+Be+Shifting+Clouds+Toward+The+Poles&utme=8(APIKey)9(MDAxOTAwOTE4MDEyMTkxMDAzNjczZDljZA004)\">\u003c/div>\n\n\u003c/div>\u003c/p>",
"attributes": {
"named": {},
"numeric": []
}
}
],
"link": "/science/841008/climate-change-may-already-be-shifting-clouds-toward-the-poles",
"authors": [
"byline_science_841008"
],
"categories": [
"science_31",
"science_35",
"science_40"
],
"featImg": "science_841009",
"label": "source_science_841008"
}
},
"podcastsReducer": {
"isFetching": false,
"fetchFailed": false,
"hasFetched": false,
"podcasts": {}
},
"radioProgramsReducer": {
"isFetching": false,
"fetchFailed": false,
"hasFetched": false,
"radioPrograms": {}
},
"radioSearchSegmentsReducer": {},
"programsReducer": {
"all-things-considered": {
"id": "all-things-considered",
"title": "All Things Considered",
"info": "Every weekday, \u003cem>All Things Considered\u003c/em> hosts Robert Siegel, Audie Cornish, Ari Shapiro, and Kelly McEvers present the program's trademark mix of news, interviews, commentaries, reviews, and offbeat features. Michel Martin hosts on the weekends.",
"airtime": "MON-FRI 1pm-2pm, 4:30pm-6:30pm\u003cbr />SAT-SUN 5pm-6pm",
"imageSrc": "https://cdn.kqed.org/wp-content/uploads/2024/04/All-Things-Considered-Podcast-Tile-360x360-1.jpg",
"officialWebsiteLink": "https://www.npr.org/programs/all-things-considered/",
"meta": {
"site": "news",
"source": "npr"
},
"link": "/radio/program/all-things-considered"
},
"american-suburb-podcast": {
"id": "american-suburb-podcast",
"title": "American Suburb: The Podcast",
"tagline": "The flip side of gentrification, told through one town",
"info": "Gentrification is changing cities across America, forcing people from neighborhoods they have long called home. Call them the displaced. Now those priced out of the Bay Area are looking for a better life in an unlikely place. American Suburb follows this migration to one California town along the Delta, 45 miles from San Francisco. But is this once sleepy suburb ready for them?",
"imageSrc": "https://cdn.kqed.org/wp-content/uploads/2024/04/American-Suburb-Podcast-Tile-703x703-1.jpg",
"officialWebsiteLink": "/news/series/american-suburb-podcast",
"meta": {
"site": "news",
"source": "kqed",
"order": 19
},
"link": "/news/series/american-suburb-podcast/",
"subscribe": {
"npr": "https://rpb3r.app.goo.gl/RBrW",
"apple": "https://itunes.apple.com/WebObjects/MZStore.woa/wa/viewPodcast?mt=2&id=1287748328",
"tuneIn": "https://tunein.com/radio/American-Suburb-p1086805/",
"rss": "https://ww2.kqed.org/news/series/american-suburb-podcast/feed/podcast",
"google": "https://podcasts.google.com/feed/aHR0cHM6Ly9mZWVkcy5tZWdhcGhvbmUuZm0vS1FJTkMzMDExODgxNjA5"
}
},
"baycurious": {
"id": "baycurious",
"title": "Bay Curious",
"tagline": "Exploring the Bay Area, one question at a time",
"info": "KQED’s new podcast, Bay Curious, gets to the bottom of the mysteries — both profound and peculiar — that give the Bay Area its unique identity. And we’ll do it with your help! You ask the questions. You decide what Bay Curious investigates. And you join us on the journey to find the answers.",
"imageSrc": "https://cdn.kqed.org/wp-content/uploads/2024/04/Bay-Curious-Podcast-Tile-703x703-1.jpg",
"imageAlt": "KQED Bay Curious",
"officialWebsiteLink": "/news/series/baycurious",
"meta": {
"site": "news",
"source": "kqed",
"order": 3
},
"link": "/podcasts/baycurious",
"subscribe": {
"apple": "https://podcasts.apple.com/us/podcast/bay-curious/id1172473406",
"npr": "https://www.npr.org/podcasts/500557090/bay-curious",
"rss": "https://ww2.kqed.org/news/category/bay-curious-podcast/feed/podcast",
"amazon": "https://music.amazon.com/podcasts/9a90d476-aa04-455d-9a4c-0871ed6216d4/bay-curious",
"stitcher": "https://www.stitcher.com/podcast/kqed/bay-curious",
"spotify": "https://open.spotify.com/show/6O76IdmhixfijmhTZLIJ8k"
}
},
"bbc-world-service": {
"id": "bbc-world-service",
"title": "BBC World Service",
"info": "The day's top stories from BBC News compiled twice daily in the week, once at weekends.",
"airtime": "MON-FRI 9pm-10pm, TUE-FRI 1am-2am",
"imageSrc": "https://cdn.kqed.org/wp-content/uploads/2024/04/BBC-World-Service-Podcast-Tile-360x360-1.jpg",
"officialWebsiteLink": "https://www.bbc.co.uk/sounds/play/live:bbc_world_service",
"meta": {
"site": "news",
"source": "BBC World Service"
},
"link": "/radio/program/bbc-world-service",
"subscribe": {
"apple": "https://itunes.apple.com/us/podcast/global-news-podcast/id135067274?mt=2",
"tuneIn": "https://tunein.com/radio/BBC-World-Service-p455581/",
"rss": "https://podcasts.files.bbci.co.uk/p02nq0gn.rss"
}
},
"californiareport": {
"id": "californiareport",
"title": "The California Report",
"tagline": "California, day by day",
"info": "KQED’s statewide radio news program providing daily coverage of issues, trends and public policy decisions.",
"imageSrc": "https://cdn.kqed.org/wp-content/uploads/2024/04/The-California-Report-Podcast-Tile-703x703-1.jpg",
"imageAlt": "KQED The California Report",
"officialWebsiteLink": "/californiareport",
"meta": {
"site": "news",
"source": "kqed",
"order": 8
},
"link": "/californiareport",
"subscribe": {
"apple": "https://podcasts.apple.com/us/podcast/kqeds-the-california-report/id79681292",
"amazon": "https://music.amazon.com/podcasts/26099305-72af-4542-9dde-ac1807fe36d5/kqed-s-the-california-report",
"npr": "https://www.npr.org/podcasts/432285393/the-california-report",
"stitcher": "https://www.stitcher.com/podcast/kqedfm-kqeds-the-california-report-podcast-8838",
"rss": "https://ww2.kqed.org/news/tag/tcram/feed/podcast"
}
},
"californiareportmagazine": {
"id": "californiareportmagazine",
"title": "The California Report Magazine",
"tagline": "Your state, your stories",
"info": "Every week, The California Report Magazine takes you on a road trip for the ears: to visit the places and meet the people who make California unique. The in-depth storytelling podcast from the California Report.",
"airtime": "FRI 4:30pm-5pm, 6:30pm-7pm, 11pm-11:30pm",
"imageSrc": "https://cdn.kqed.org/wp-content/uploads/2024/04/The-California-Report-Magazine-Podcast-Tile-703x703-1.jpg",
"imageAlt": "KQED The California Report Magazine",
"officialWebsiteLink": "/californiareportmagazine",
"meta": {
"site": "news",
"source": "kqed",
"order": 10
},
"link": "/californiareportmagazine",
"subscribe": {
"apple": "https://podcasts.apple.com/us/podcast/the-california-report-magazine/id1314750545",
"google": "https://podcasts.google.com/feed/aHR0cHM6Ly9mZWVkcy5tZWdhcGhvbmUuZm0vS1FJTkM3NjkwNjk1OTAz",
"npr": "https://www.npr.org/podcasts/564733126/the-california-report-magazine",
"stitcher": "https://www.stitcher.com/podcast/kqed/the-california-report-magazine",
"rss": "https://ww2.kqed.org/news/tag/tcrmag/feed/podcast"
}
},
"city-arts": {
"id": "city-arts",
"title": "City Arts & Lectures",
"info": "A one-hour radio program to hear celebrated writers, artists and thinkers address contemporary ideas and values, often discussing the creative process. Please note: tapes or transcripts are not available",
"imageSrc": "https://ww2.kqed.org/radio/wp-content/uploads/sites/50/2018/05/cityartsandlecture-300x300.jpg",
"officialWebsiteLink": "https://www.cityarts.net/",
"airtime": "SUN 1pm-2pm, TUE 10pm, WED 1am",
"meta": {
"site": "news",
"source": "City Arts & Lectures"
},
"link": "https://www.cityarts.net",
"subscribe": {
"tuneIn": "https://tunein.com/radio/City-Arts-and-Lectures-p692/",
"rss": "https://www.cityarts.net/feed/"
}
},
"closealltabs": {
"id": "closealltabs",
"title": "Close All Tabs",
"tagline": "Your irreverent guide to the trends redefining our world",
"info": "Close All Tabs breaks down how digital culture shapes our world through thoughtful insights and irreverent humor.",
"imageSrc": "https://cdn.kqed.org/wp-content/uploads/2025/02/CAT_2_Tile-scaled.jpg",
"imageAlt": "KQED Close All Tabs",
"officialWebsiteLink": "/podcasts/closealltabs",
"meta": {
"site": "news",
"source": "kqed",
"order": 1
},
"link": "/podcasts/closealltabs",
"subscribe": {
"apple": "https://podcasts.apple.com/us/podcast/close-all-tabs/id214663465",
"rss": "https://feeds.megaphone.fm/KQINC6993880386",
"amazon": "https://music.amazon.com/podcasts/92d9d4ac-67a3-4eed-b10a-fb45d45b1ef2/close-all-tabs",
"spotify": "https://open.spotify.com/show/6LAJFHnGK1pYXYzv6SIol6?si=deb0cae19813417c"
}
},
"code-switch-life-kit": {
"id": "code-switch-life-kit",
"title": "Code Switch / Life Kit",
"info": "\u003cem>Code Switch\u003c/em>, which listeners will hear in the first part of the hour, has fearless and much-needed conversations about race. Hosted by journalists of color, the show tackles the subject of race head-on, exploring how it impacts every part of society — from politics and pop culture to history, sports and more.\u003cbr />\u003cbr />\u003cem>Life Kit\u003c/em>, which will be in the second part of the hour, guides you through spaces and feelings no one prepares you for — from finances to mental health, from workplace microaggressions to imposter syndrome, from relationships to parenting. The show features experts with real world experience and shares their knowledge. Because everyone needs a little help being human.\u003cbr />\u003cbr />\u003ca href=\"https://www.npr.org/podcasts/510312/codeswitch\">\u003cem>Code Switch\u003c/em> offical site and podcast\u003c/a>\u003cbr />\u003ca href=\"https://www.npr.org/lifekit\">\u003cem>Life Kit\u003c/em> offical site and podcast\u003c/a>\u003cbr />",
"airtime": "SUN 9pm-10pm",
"imageSrc": "https://cdn.kqed.org/wp-content/uploads/2024/04/Code-Switch-Life-Kit-Podcast-Tile-360x360-1.jpg",
"meta": {
"site": "radio",
"source": "npr"
},
"link": "/radio/program/code-switch-life-kit",
"subscribe": {
"apple": "https://podcasts.apple.com/podcast/1112190608?mt=2&at=11l79Y&ct=nprdirectory",
"google": "https://podcasts.google.com/feed/aHR0cHM6Ly93d3cubnByLm9yZy9yc3MvcG9kY2FzdC5waHA_aWQ9NTEwMzEy",
"spotify": "https://open.spotify.com/show/3bExJ9JQpkwNhoHvaIIuyV",
"rss": "https://feeds.npr.org/510312/podcast.xml"
}
},
"commonwealth-club": {
"id": "commonwealth-club",
"title": "Commonwealth Club of California Podcast",
"info": "The Commonwealth Club of California is the nation's oldest and largest public affairs forum. As a non-partisan forum, The Club brings to the public airwaves diverse viewpoints on important topics. The Club's weekly radio broadcast - the oldest in the U.S., dating back to 1924 - is carried across the nation on public radio stations and is now podcasting. Our website archive features audio of our recent programs, as well as selected speeches from our long and distinguished history. This podcast feed is usually updated twice a week and is always un-edited.",
"airtime": "THU 10pm, FRI 1am",
"imageSrc": "https://cdn.kqed.org/wp-content/uploads/2024/04/Commonwealth-Club-Podcast-Tile-360x360-1.jpg",
"officialWebsiteLink": "https://www.commonwealthclub.org/podcasts",
"meta": {
"site": "news",
"source": "Commonwealth Club of California"
},
"link": "/radio/program/commonwealth-club",
"subscribe": {
"apple": "https://itunes.apple.com/us/podcast/commonwealth-club-of-california-podcast/id976334034?mt=2",
"google": "https://podcasts.google.com/feed/aHR0cDovL3d3dy5jb21tb253ZWFsdGhjbHViLm9yZy9hdWRpby9wb2RjYXN0L3dlZWtseS54bWw",
"tuneIn": "https://tunein.com/radio/Commonwealth-Club-of-California-p1060/"
}
},
"forum": {
"id": "forum",
"title": "Forum",
"tagline": "The conversation starts here",
"info": "KQED’s live call-in program discussing local, state, national and international issues, as well as in-depth interviews.",
"airtime": "MON-FRI 9am-11am, 10pm-11pm",
"imageSrc": "https://cdn.kqed.org/wp-content/uploads/2024/04/Forum-Podcast-Tile-703x703-1.jpg",
"imageAlt": "KQED Forum with Mina Kim and Alexis Madrigal",
"officialWebsiteLink": "/forum",
"meta": {
"site": "news",
"source": "kqed",
"order": 9
},
"link": "/forum",
"subscribe": {
"apple": "https://podcasts.apple.com/us/podcast/kqeds-forum/id73329719",
"google": "https://podcasts.google.com/feed/aHR0cHM6Ly9mZWVkcy5tZWdhcGhvbmUuZm0vS1FJTkM5NTU3MzgxNjMz",
"npr": "https://www.npr.org/podcasts/432307980/forum",
"stitcher": "https://www.stitcher.com/podcast/kqedfm-kqeds-forum-podcast",
"rss": "https://feeds.megaphone.fm/KQINC9557381633"
}
},
"freakonomics-radio": {
"id": "freakonomics-radio",
"title": "Freakonomics Radio",
"info": "Freakonomics Radio is a one-hour award-winning podcast and public-radio project hosted by Stephen Dubner, with co-author Steve Levitt as a regular guest. It is produced in partnership with WNYC.",
"imageSrc": "https://ww2.kqed.org/news/wp-content/uploads/sites/10/2018/05/freakonomicsRadio.png",
"officialWebsiteLink": "http://freakonomics.com/",
"airtime": "SUN 1am-2am, SAT 3pm-4pm",
"meta": {
"site": "radio",
"source": "WNYC"
},
"link": "/radio/program/freakonomics-radio",
"subscribe": {
"npr": "https://rpb3r.app.goo.gl/4s8b",
"apple": "https://itunes.apple.com/us/podcast/freakonomics-radio/id354668519",
"tuneIn": "https://tunein.com/podcasts/WNYC-Podcasts/Freakonomics-Radio-p272293/",
"rss": "https://feeds.feedburner.com/freakonomicsradio"
}
},
"fresh-air": {
"id": "fresh-air",
"title": "Fresh Air",
"info": "Hosted by Terry Gross, \u003cem>Fresh Air from WHYY\u003c/em> is the Peabody Award-winning weekday magazine of contemporary arts and issues. One of public radio's most popular programs, Fresh Air features intimate conversations with today's biggest luminaries.",
"airtime": "MON-FRI 7pm-8pm",
"imageSrc": "https://cdn.kqed.org/wp-content/uploads/2024/04/Fresh-Air-Podcast-Tile-360x360-1.jpg",
"officialWebsiteLink": "https://www.npr.org/programs/fresh-air/",
"meta": {
"site": "radio",
"source": "npr"
},
"link": "/radio/program/fresh-air",
"subscribe": {
"npr": "https://rpb3r.app.goo.gl/4s8b",
"apple": "https://itunes.apple.com/WebObjects/MZStore.woa/wa/viewPodcast?s=143441&mt=2&id=214089682&at=11l79Y&ct=nprdirectory",
"tuneIn": "https://tunein.com/radio/Fresh-Air-p17/",
"rss": "https://feeds.npr.org/381444908/podcast.xml"
}
},
"here-and-now": {
"id": "here-and-now",
"title": "Here & Now",
"info": "A live production of NPR and WBUR Boston, in collaboration with stations across the country, Here & Now reflects the fluid world of news as it's happening in the middle of the day, with timely, in-depth news, interviews and conversation. Hosted by Robin Young, Jeremy Hobson and Tonya Mosley.",
"airtime": "MON-THU 11am-12pm",
"imageSrc": "https://cdn.kqed.org/wp-content/uploads/2024/04/Here-And-Now-Podcast-Tile-360x360-1.jpg",
"officialWebsiteLink": "http://www.wbur.org/hereandnow",
"meta": {
"site": "news",
"source": "npr"
},
"link": "/radio/program/here-and-now",
"subsdcribe": {
"apple": "https://itunes.apple.com/WebObjects/MZStore.woa/wa/viewPodcast?mt=2&id=426698661",
"tuneIn": "https://tunein.com/radio/Here--Now-p211/",
"rss": "https://feeds.npr.org/510051/podcast.xml"
}
},
"hidden-brain": {
"id": "hidden-brain",
"title": "Hidden Brain",
"info": "Shankar Vedantam uses science and storytelling to reveal the unconscious patterns that drive human behavior, shape our choices and direct our relationships.",
"imageSrc": "https://ww2.kqed.org/radio/wp-content/uploads/sites/50/2018/05/hiddenbrain.jpg",
"officialWebsiteLink": "https://www.npr.org/series/423302056/hidden-brain",
"airtime": "SUN 7pm-8pm",
"meta": {
"site": "news",
"source": "NPR"
},
"link": "/radio/program/hidden-brain",
"subscribe": {
"apple": "https://itunes.apple.com/us/podcast/hidden-brain/id1028908750?mt=2",
"tuneIn": "https://tunein.com/podcasts/Science-Podcasts/Hidden-Brain-p787503/",
"rss": "https://feeds.npr.org/510308/podcast.xml"
}
},
"how-i-built-this": {
"id": "how-i-built-this",
"title": "How I Built This with Guy Raz",
"info": "Guy Raz dives into the stories behind some of the world's best known companies. How I Built This weaves a narrative journey about innovators, entrepreneurs and idealists—and the movements they built.",
"imageSrc": "https://ww2.kqed.org/news/wp-content/uploads/sites/10/2018/05/howIBuiltThis.png",
"officialWebsiteLink": "https://www.npr.org/podcasts/510313/how-i-built-this",
"airtime": "SUN 7:30pm-8pm",
"meta": {
"site": "news",
"source": "npr"
},
"link": "/radio/program/how-i-built-this",
"subscribe": {
"npr": "https://rpb3r.app.goo.gl/3zxy",
"apple": "https://itunes.apple.com/us/podcast/how-i-built-this-with-guy-raz/id1150510297?mt=2",
"tuneIn": "https://tunein.com/podcasts/Arts--Culture-Podcasts/How-I-Built-This-p910896/",
"rss": "https://feeds.npr.org/510313/podcast.xml"
}
},
"hyphenacion": {
"id": "hyphenacion",
"title": "Hyphenación",
"tagline": "Where conversation and cultura meet",
"info": "What kind of no sabo word is Hyphenación? For us, it’s about living within a hyphenation. Like being a third-gen Mexican-American from the Texas border now living that Bay Area Chicano life. Like Xorje! Each week we bring together a couple of hyphenated Latinos to talk all about personal life choices: family, careers, relationships, belonging … everything is on the table. ",
"imageSrc": "https://cdn.kqed.org/wp-content/uploads/2025/03/Hyphenacion_FinalAssets_PodcastTile.png",
"imageAlt": "KQED Hyphenación",
"officialWebsiteLink": "/podcasts/hyphenacion",
"meta": {
"site": "news",
"source": "kqed",
"order": 15
},
"link": "/podcasts/hyphenacion",
"subscribe": {
"apple": "https://podcasts.apple.com/us/podcast/hyphenaci%C3%B3n/id1191591838",
"spotify": "https://open.spotify.com/show/2p3Fifq96nw9BPcmFdIq0o?si=39209f7b25774f38",
"youtube": "https://www.youtube.com/c/kqedarts",
"amazon": "https://music.amazon.com/podcasts/6c3dd23c-93fb-4aab-97ba-1725fa6315f1/hyphenaci%C3%B3n",
"rss": "https://feeds.megaphone.fm/KQINC2275451163"
}
},
"jerrybrown": {
"id": "jerrybrown",
"title": "The Political Mind of Jerry Brown",
"tagline": "Lessons from a lifetime in politics",
"info": "The Political Mind of Jerry Brown brings listeners the wisdom of the former Governor, Mayor, and presidential candidate. Scott Shafer interviewed Brown for more than 40 hours, covering the former governor's life and half-century in the political game – and Brown has some lessons he'd like to share. ",
"imageSrc": "https://cdn.kqed.org/wp-content/uploads/2024/04/The-Political-Mind-of-Jerry-Brown-Podcast-Tile-703x703-1.jpg",
"imageAlt": "KQED The Political Mind of Jerry Brown",
"officialWebsiteLink": "/podcasts/jerrybrown",
"meta": {
"site": "news",
"source": "kqed",
"order": 18
},
"link": "/podcasts/jerrybrown",
"subscribe": {
"npr": "https://www.npr.org/podcasts/790253322/the-political-mind-of-jerry-brown",
"apple": "https://itunes.apple.com/us/podcast/id1492194549",
"rss": "https://ww2.kqed.org/news/series/jerrybrown/feed/podcast/",
"tuneIn": "http://tun.in/pjGcK",
"stitcher": "https://www.stitcher.com/podcast/kqed/the-political-mind-of-jerry-brown",
"spotify": "https://open.spotify.com/show/54C1dmuyFyKMFttY6X2j6r?si=K8SgRCoISNK6ZbjpXrX5-w",
"amazon": "https://music.amazon.com/podcasts/44420f75-3b0e-4301-ab3b-16da6b09e543/the-political-mind-of-jerry-brown"
}
},
"latino-usa": {
"id": "latino-usa",
"title": "Latino USA",
"airtime": "MON 1am-2am, SUN 6pm-7pm",
"info": "Latino USA, the radio journal of news and culture, is the only national, English-language radio program produced from a Latino perspective.",
"imageSrc": "https://ww2.kqed.org/radio/wp-content/uploads/sites/50/2018/04/latinoUsa.jpg",
"officialWebsiteLink": "http://latinousa.org/",
"meta": {
"site": "news",
"source": "npr"
},
"link": "/radio/program/latino-usa",
"subscribe": {
"npr": "https://rpb3r.app.goo.gl/xtTd",
"apple": "https://itunes.apple.com/WebObjects/MZStore.woa/wa/viewPodcast?s=143441&mt=2&id=79681317&at=11l79Y&ct=nprdirectory",
"tuneIn": "https://tunein.com/radio/Latino-USA-p621/",
"rss": "https://feeds.npr.org/510016/podcast.xml"
}
},
"marketplace": {
"id": "marketplace",
"title": "Marketplace",
"info": "Our flagship program, helmed by Kai Ryssdal, examines what the day in money delivered, through stories, conversations, newsworthy numbers and more. Updated Monday through Friday at about 3:30 p.m. PT.",
"airtime": "MON-FRI 4pm-4:30pm, MON-WED 6:30pm-7pm",
"imageSrc": "https://cdn.kqed.org/wp-content/uploads/2024/04/Marketplace-Podcast-Tile-360x360-1.jpg",
"officialWebsiteLink": "https://www.marketplace.org/",
"meta": {
"site": "news",
"source": "American Public Media"
},
"link": "/radio/program/marketplace",
"subscribe": {
"apple": "https://itunes.apple.com/WebObjects/MZStore.woa/wa/viewPodcast?s=143441&mt=2&id=201853034&at=11l79Y&ct=nprdirectory",
"tuneIn": "https://tunein.com/radio/APM-Marketplace-p88/",
"rss": "https://feeds.publicradio.org/public_feeds/marketplace-pm/rss/rss"
}
},
"masters-of-scale": {
"id": "masters-of-scale",
"title": "Masters of Scale",
"info": "Masters of Scale is an original podcast in which LinkedIn co-founder and Greylock Partner Reid Hoffman sets out to describe and prove theories that explain how great entrepreneurs take their companies from zero to a gazillion in ingenious fashion.",
"airtime": "Every other Wednesday June 12 through October 16 at 8pm (repeats Thursdays at 2am)",
"imageSrc": "https://cdn.kqed.org/wp-content/uploads/2024/04/Masters-of-Scale-Podcast-Tile-360x360-1.jpg",
"officialWebsiteLink": "https://mastersofscale.com/",
"meta": {
"site": "radio",
"source": "WaitWhat"
},
"link": "/radio/program/masters-of-scale",
"subscribe": {
"apple": "http://mastersofscale.app.link/",
"rss": "https://rss.art19.com/masters-of-scale"
}
},
"mindshift": {
"id": "mindshift",
"title": "MindShift",
"tagline": "A podcast about the future of learning and how we raise our kids",
"info": "The MindShift podcast explores the innovations in education that are shaping how kids learn. Hosts Ki Sung and Katrina Schwartz introduce listeners to educators, researchers, parents and students who are developing effective ways to improve how kids learn. We cover topics like how fed-up administrators are developing surprising tactics to deal with classroom disruptions; how listening to podcasts are helping kids develop reading skills; the consequences of overparenting; and why interdisciplinary learning can engage students on all ends of the traditional achievement spectrum. This podcast is part of the MindShift education site, a division of KQED News. KQED is an NPR/PBS member station based in San Francisco. You can also visit the MindShift website for episodes and supplemental blog posts or tweet us \u003ca href=\"https://twitter.com/MindShiftKQED\">@MindShiftKQED\u003c/a> or visit us at \u003ca href=\"/mindshift\">MindShift.KQED.org\u003c/a>",
"imageSrc": "https://cdn.kqed.org/wp-content/uploads/2024/04/Mindshift-Podcast-Tile-703x703-1.jpg",
"imageAlt": "KQED MindShift: How We Will Learn",
"officialWebsiteLink": "/mindshift/",
"meta": {
"site": "news",
"source": "kqed",
"order": 12
},
"link": "/podcasts/mindshift",
"subscribe": {
"apple": "https://podcasts.apple.com/us/podcast/mindshift-podcast/id1078765985",
"google": "https://podcasts.google.com/feed/aHR0cHM6Ly9mZWVkcy5tZWdhcGhvbmUuZm0vS1FJTkM1NzY0NjAwNDI5",
"npr": "https://www.npr.org/podcasts/464615685/mind-shift-podcast",
"stitcher": "https://www.stitcher.com/podcast/kqed/stories-teachers-share",
"spotify": "https://open.spotify.com/show/0MxSpNYZKNprFLCl7eEtyx"
}
},
"morning-edition": {
"id": "morning-edition",
"title": "Morning Edition",
"info": "\u003cem>Morning Edition\u003c/em> takes listeners around the country and the world with multi-faceted stories and commentaries every weekday. Hosts Steve Inskeep, David Greene and Rachel Martin bring you the latest breaking news and features to prepare you for the day.",
"airtime": "MON-FRI 3am-9am",
"imageSrc": "https://cdn.kqed.org/wp-content/uploads/2024/04/Morning-Edition-Podcast-Tile-360x360-1.jpg",
"officialWebsiteLink": "https://www.npr.org/programs/morning-edition/",
"meta": {
"site": "news",
"source": "npr"
},
"link": "/radio/program/morning-edition"
},
"onourwatch": {
"id": "onourwatch",
"title": "On Our Watch",
"tagline": "Deeply-reported investigative journalism",
"info": "For decades, the process for how police police themselves has been inconsistent – if not opaque. In some states, like California, these proceedings were completely hidden. After a new police transparency law unsealed scores of internal affairs files, our reporters set out to examine these cases and the shadow world of police discipline. On Our Watch brings listeners into the rooms where officers are questioned and witnesses are interrogated to find out who this system is really protecting. Is it the officers, or the public they've sworn to serve?",
"imageSrc": "https://cdn.kqed.org/wp-content/uploads/2024/04/On-Our-Watch-Podcast-Tile-703x703-1.jpg",
"imageAlt": "On Our Watch from NPR and KQED",
"officialWebsiteLink": "/podcasts/onourwatch",
"meta": {
"site": "news",
"source": "kqed",
"order": 11
},
"link": "/podcasts/onourwatch",
"subscribe": {
"apple": "https://podcasts.apple.com/podcast/id1567098962",
"google": "https://podcasts.google.com/feed/aHR0cHM6Ly9mZWVkcy5ucHIub3JnLzUxMDM2MC9wb2RjYXN0LnhtbD9zYz1nb29nbGVwb2RjYXN0cw",
"npr": "https://rpb3r.app.goo.gl/onourwatch",
"spotify": "https://open.spotify.com/show/0OLWoyizopu6tY1XiuX70x",
"tuneIn": "https://tunein.com/radio/On-Our-Watch-p1436229/",
"stitcher": "https://www.stitcher.com/show/on-our-watch",
"rss": "https://feeds.npr.org/510360/podcast.xml"
}
},
"on-the-media": {
"id": "on-the-media",
"title": "On The Media",
"info": "Our weekly podcast explores how the media 'sausage' is made, casts an incisive eye on fluctuations in the marketplace of ideas, and examines threats to the freedom of information and expression in America and abroad. For one hour a week, the show tries to lift the veil from the process of \"making media,\" especially news media, because it's through that lens that we see the world and the world sees us",
"airtime": "SUN 2pm-3pm, MON 12am-1am",
"imageSrc": "https://ww2.kqed.org/radio/wp-content/uploads/sites/50/2018/04/onTheMedia.png",
"officialWebsiteLink": "https://www.wnycstudios.org/shows/otm",
"meta": {
"site": "news",
"source": "wnyc"
},
"link": "/radio/program/on-the-media",
"subscribe": {
"apple": "https://itunes.apple.com/us/podcast/on-the-media/id73330715?mt=2",
"tuneIn": "https://tunein.com/radio/On-the-Media-p69/",
"rss": "http://feeds.wnyc.org/onthemedia"
}
},
"pbs-newshour": {
"id": "pbs-newshour",
"title": "PBS NewsHour",
"info": "Analysis, background reports and updates from the PBS NewsHour putting today's news in context.",
"airtime": "MON-FRI 3pm-4pm",
"imageSrc": "https://cdn.kqed.org/wp-content/uploads/2024/04/PBS-News-Hour-Podcast-Tile-360x360-1.jpg",
"officialWebsiteLink": "https://www.pbs.org/newshour/",
"meta": {
"site": "news",
"source": "pbs"
},
"link": "/radio/program/pbs-newshour",
"subscribe": {
"apple": "https://itunes.apple.com/us/podcast/pbs-newshour-full-show/id394432287?mt=2",
"tuneIn": "https://tunein.com/radio/PBS-NewsHour---Full-Show-p425698/",
"rss": "https://www.pbs.org/newshour/feeds/rss/podcasts/show"
}
},
"perspectives": {
"id": "perspectives",
"title": "Perspectives",
"tagline": "KQED's series of daily listener commentaries since 1991",
"info": "KQED's series of daily listener commentaries since 1991.",
"imageSrc": "https://cdn.kqed.org/wp-content/uploads/2025/01/Perspectives_Tile_Final.jpg",
"imageAlt": "KQED Perspectives",
"officialWebsiteLink": "/perspectives/",
"meta": {
"site": "radio",
"source": "kqed",
"order": 14
},
"link": "/perspectives",
"subscribe": {
"apple": "https://podcasts.apple.com/us/podcast/id73801135",
"npr": "https://www.npr.org/podcasts/432309616/perspectives",
"rss": "https://ww2.kqed.org/perspectives/category/perspectives/feed/",
"google": "https://podcasts.google.com/feed/aHR0cHM6Ly93dzIua3FlZC5vcmcvcGVyc3BlY3RpdmVzL2NhdGVnb3J5L3BlcnNwZWN0aXZlcy9mZWVkLw"
}
},
"planet-money": {
"id": "planet-money",
"title": "Planet Money",
"info": "The economy explained. Imagine you could call up a friend and say, Meet me at the bar and tell me what's going on with the economy. Now imagine that's actually a fun evening.",
"airtime": "SUN 3pm-4pm",
"imageSrc": "https://ww2.kqed.org/radio/wp-content/uploads/sites/50/2018/04/planetmoney.jpg",
"officialWebsiteLink": "https://www.npr.org/sections/money/",
"meta": {
"site": "news",
"source": "npr"
},
"link": "/radio/program/planet-money",
"subscribe": {
"npr": "https://rpb3r.app.goo.gl/M4f5",
"apple": "https://itunes.apple.com/us/podcast/planet-money/id290783428?mt=2",
"tuneIn": "https://tunein.com/podcasts/Business--Economics-Podcasts/Planet-Money-p164680/",
"rss": "https://feeds.npr.org/510289/podcast.xml"
}
},
"politicalbreakdown": {
"id": "politicalbreakdown",
"title": "Political Breakdown",
"tagline": "Politics from a personal perspective",
"info": "Political Breakdown is a new series that explores the political intersection of California and the nation. Each week hosts Scott Shafer and Marisa Lagos are joined with a new special guest to unpack politics -- with personality — and offer an insider’s glimpse at how politics happens.",
"airtime": "THU 6:30pm-7pm",
"imageSrc": "https://cdn.kqed.org/wp-content/uploads/2024/04/Political-Breakdown-2024-Podcast-Tile-703x703-1.jpg",
"imageAlt": "KQED Political Breakdown",
"officialWebsiteLink": "/podcasts/politicalbreakdown",
"meta": {
"site": "radio",
"source": "kqed",
"order": 5
},
"link": "/podcasts/politicalbreakdown",
"subscribe": {
"apple": "https://podcasts.apple.com/us/podcast/political-breakdown/id1327641087",
"amazon": "https://music.amazon.com/podcasts/e0c2d153-ad36-4c8d-901d-f1da6a724824/political-breakdown",
"npr": "https://www.npr.org/podcasts/572155894/political-breakdown",
"stitcher": "https://www.stitcher.com/podcast/kqed/political-breakdown",
"spotify": "https://open.spotify.com/show/07RVyIjIdk2WDuVehvBMoN",
"rss": "https://ww2.kqed.org/news/tag/political-breakdown/feed/podcast"
}
},
"possible": {
"id": "possible",
"title": "Possible",
"info": "Possible is hosted by entrepreneur Reid Hoffman and writer Aria Finger. Together in Possible, Hoffman and Finger lead enlightening discussions about building a brighter collective future. The show features interviews with visionary guests like Trevor Noah, Sam Altman and Janette Sadik-Khan. Possible paints an optimistic portrait of the world we can create through science, policy, business, art and our shared humanity. It asks: What if everything goes right for once? How can we get there? Each episode also includes a short fiction story generated by advanced AI GPT-4, serving as a thought-provoking springboard to speculate how humanity could leverage technology for good.",
"airtime": "SUN 2pm",
"imageSrc": "https://cdn.kqed.org/wp-content/uploads/2024/04/Possible-Podcast-Tile-360x360-1.jpg",
"officialWebsiteLink": "https://www.possible.fm/",
"meta": {
"site": "news",
"source": "Possible"
},
"link": "/radio/program/possible",
"subscribe": {
"apple": "https://podcasts.apple.com/us/podcast/possible/id1677184070",
"spotify": "https://open.spotify.com/show/730YpdUSNlMyPQwNnyjp4k"
}
},
"pri-the-world": {
"id": "pri-the-world",
"title": "PRI's The World: Latest Edition",
"info": "Each weekday, host Marco Werman and his team of producers bring you the world's most interesting stories in an hour of radio that reminds us just how small our planet really is.",
"airtime": "MON-FRI 2pm-3pm",
"imageSrc": "https://cdn.kqed.org/wp-content/uploads/2024/04/The-World-Podcast-Tile-360x360-1.jpg",
"officialWebsiteLink": "https://www.pri.org/programs/the-world",
"meta": {
"site": "news",
"source": "PRI"
},
"link": "/radio/program/pri-the-world",
"subscribe": {
"apple": "https://itunes.apple.com/us/podcast/pris-the-world-latest-edition/id278196007?mt=2",
"tuneIn": "https://tunein.com/podcasts/News--Politics-Podcasts/PRIs-The-World-p24/",
"rss": "http://feeds.feedburner.com/pri/theworld"
}
},
"radiolab": {
"id": "radiolab",
"title": "Radiolab",
"info": "A two-time Peabody Award-winner, Radiolab is an investigation told through sounds and stories, and centered around one big idea. In the Radiolab world, information sounds like music and science and culture collide. Hosted by Jad Abumrad and Robert Krulwich, the show is designed for listeners who demand skepticism, but appreciate wonder. WNYC Studios is the producer of other leading podcasts including Freakonomics Radio, Death, Sex & Money, On the Media and many more.",
"airtime": "SUN 12am-1am, SAT 2pm-3pm",
"imageSrc": "https://ww2.kqed.org/radio/wp-content/uploads/sites/50/2018/04/radiolab1400.png",
"officialWebsiteLink": "https://www.wnycstudios.org/shows/radiolab/",
"meta": {
"site": "science",
"source": "WNYC"
},
"link": "/radio/program/radiolab",
"subscribe": {
"apple": "https://itunes.apple.com/us/podcast/radiolab/id152249110?mt=2",
"tuneIn": "https://tunein.com/radio/RadioLab-p68032/",
"rss": "https://feeds.wnyc.org/radiolab"
}
},
"reveal": {
"id": "reveal",
"title": "Reveal",
"info": "Created by The Center for Investigative Reporting and PRX, Reveal is public radios first one-hour weekly radio show and podcast dedicated to investigative reporting. Credible, fact based and without a partisan agenda, Reveal combines the power and artistry of driveway moment storytelling with data-rich reporting on critically important issues. The result is stories that inform and inspire, arming our listeners with information to right injustices, hold the powerful accountable and improve lives.Reveal is hosted by Al Letson and showcases the award-winning work of CIR and newsrooms large and small across the nation. In a radio and podcast market crowded with choices, Reveal focuses on important and often surprising stories that illuminate the world for our listeners.",
"airtime": "SAT 4pm-5pm",
"imageSrc": "https://ww2.kqed.org/radio/wp-content/uploads/sites/50/2018/04/reveal300px.png",
"officialWebsiteLink": "https://www.revealnews.org/episodes/",
"meta": {
"site": "news",
"source": "npr"
},
"link": "/radio/program/reveal",
"subscribe": {
"apple": "https://itunes.apple.com/us/podcast/reveal/id886009669",
"tuneIn": "https://tunein.com/radio/Reveal-p679597/",
"rss": "http://feeds.revealradio.org/revealpodcast"
}
},
"rightnowish": {
"id": "rightnowish",
"title": "Rightnowish",
"tagline": "Art is where you find it",
"info": "Rightnowish digs into life in the Bay Area right now… ish. Journalist Pendarvis Harshaw takes us to galleries painted on the sides of liquor stores in West Oakland. We'll dance in warehouses in the Bayview, make smoothies with kids in South Berkeley, and listen to classical music in a 1984 Cutlass Supreme in Richmond. Every week, Pen talks to movers and shakers about how the Bay Area shapes what they create, and how they shape the place we call home.",
"imageSrc": "https://cdn.kqed.org/wp-content/uploads/2024/04/Rightnowish-Podcast-Tile-500x500-1.jpg",
"imageAlt": "KQED Rightnowish with Pendarvis Harshaw",
"officialWebsiteLink": "/podcasts/rightnowish",
"meta": {
"site": "arts",
"source": "kqed",
"order": 16
},
"link": "/podcasts/rightnowish",
"subscribe": {
"npr": "https://www.npr.org/podcasts/721590300/rightnowish",
"rss": "https://ww2.kqed.org/arts/programs/rightnowish/feed/podcast",
"apple": "https://podcasts.apple.com/us/podcast/rightnowish/id1482187648",
"stitcher": "https://www.stitcher.com/podcast/kqed/rightnowish",
"google": "https://podcasts.google.com/feed/aHR0cHM6Ly9mZWVkcy5tZWdhcGhvbmUuZm0vS1FJTkMxMjU5MTY3NDc4",
"spotify": "https://open.spotify.com/show/7kEJuafTzTVan7B78ttz1I"
}
},
"science-friday": {
"id": "science-friday",
"title": "Science Friday",
"info": "Science Friday is a weekly science talk show, broadcast live over public radio stations nationwide. Each week, the show focuses on science topics that are in the news and tries to bring an educated, balanced discussion to bear on the scientific issues at hand. Panels of expert guests join host Ira Flatow, a veteran science journalist, to discuss science and to take questions from listeners during the call-in portion of the program.",
"airtime": "FRI 11am-1pm",
"imageSrc": "https://cdn.kqed.org/wp-content/uploads/2024/04/Science-Friday-Podcast-Tile-360x360-1.jpg",
"officialWebsiteLink": "https://www.wnycstudios.org/shows/science-friday",
"meta": {
"site": "news",
"source": "npr"
},
"link": "/radio/program/science-friday",
"subscribe": {
"apple": "https://itunes.apple.com/WebObjects/MZStore.woa/wa/viewPodcast?s=143441&mt=2&id=73329284&at=11l79Y&ct=nprdirectory",
"tuneIn": "https://tunein.com/radio/Science-Friday-p394/",
"rss": "http://feeds.wnyc.org/science-friday"
}
},
"snap-judgment": {
"id": "snap-judgment",
"title": "Snap Judgment",
"tagline": "Real stories with killer beats",
"info": "The Snap Judgment radio show and podcast mixes real stories with killer beats to produce cinematic, dramatic radio. Snap's musical brand of storytelling dares listeners to see the world through the eyes of another. This is storytelling... with a BEAT!! Snap first aired on public radio stations nationwide in July 2010. Today, Snap Judgment airs on over 450 public radio stations and is brought to the airwaves by KQED & PRX.",
"airtime": "SAT 1pm-2pm, 9pm-10pm",
"imageSrc": "https://cdn.kqed.org/wp-content/uploads/2024/05/Snap-Judgment-Podcast-Tile-703x703-1.jpg",
"imageAlt": "KQED Snap Judgment",
"officialWebsiteLink": "https://snapjudgment.org",
"meta": {
"site": "arts",
"source": "kqed",
"order": 4
},
"link": "https://snapjudgment.org",
"subscribe": {
"apple": "https://podcasts.apple.com/us/podcast/snap-judgment/id283657561",
"npr": "https://www.npr.org/podcasts/449018144/snap-judgment",
"stitcher": "https://www.pandora.com/podcast/snap-judgment/PC:241?source=stitcher-sunset",
"spotify": "https://open.spotify.com/show/3Cct7ZWmxHNAtLgBTqjC5v",
"rss": "https://snap.feed.snapjudgment.org/"
}
},
"soldout": {
"id": "soldout",
"title": "SOLD OUT: Rethinking Housing in America",
"tagline": "A new future for housing",
"info": "Sold Out: Rethinking Housing in America",
"imageSrc": "https://cdn.kqed.org/wp-content/uploads/2024/04/Sold-Out-Podcast-Tile-703x703-1.jpg",
"imageAlt": "KQED Sold Out: Rethinking Housing in America",
"officialWebsiteLink": "/podcasts/soldout",
"meta": {
"site": "news",
"source": "kqed",
"order": 13
},
"link": "/podcasts/soldout",
"subscribe": {
"npr": "https://www.npr.org/podcasts/911586047/s-o-l-d-o-u-t-a-new-future-for-housing",
"apple": "https://podcasts.apple.com/us/podcast/introducing-sold-out-rethinking-housing-in-america/id1531354937",
"rss": "https://feeds.megaphone.fm/soldout",
"spotify": "https://open.spotify.com/show/38dTBSk2ISFoPiyYNoKn1X",
"stitcher": "https://www.stitcher.com/podcast/kqed/sold-out-rethinking-housing-in-america",
"tunein": "https://tunein.com/radio/SOLD-OUT-Rethinking-Housing-in-America-p1365871/"
}
},
"spooked": {
"id": "spooked",
"title": "Spooked",
"tagline": "True-life supernatural stories",
"info": "",
"imageSrc": "https://cdn.kqed.org/wp-content/uploads/2024/10/Spooked-Podcast-Tile-703x703-1.jpg",
"imageAlt": "KQED Spooked",
"officialWebsiteLink": "https://spookedpodcast.org/",
"meta": {
"site": "news",
"source": "kqed",
"order": 7
},
"link": "https://spookedpodcast.org/",
"subscribe": {
"apple": "https://podcasts.apple.com/us/podcast/spooked/id1279361017",
"npr": "https://www.npr.org/podcasts/549547848/snap-judgment-presents-spooked",
"spotify": "https://open.spotify.com/show/76571Rfl3m7PLJQZKQIGCT",
"rss": "https://feeds.simplecast.com/TBotaapn"
}
},
"tech-nation": {
"id": "tech-nation",
"title": "Tech Nation Radio Podcast",
"info": "Tech Nation is a weekly public radio program, hosted by Dr. Moira Gunn. Founded in 1993, it has grown from a simple interview show to a multi-faceted production, featuring conversations with noted technology and science leaders, and a weekly science and technology-related commentary.",
"airtime": "FRI 10pm",
"imageSrc": "https://cdn.kqed.org/wp-content/uploads/2024/04/Tech-Nation-Radio-Podcast-Tile-360x360-1.jpg",
"officialWebsiteLink": "http://technation.podomatic.com/",
"meta": {
"site": "science",
"source": "Tech Nation Media"
},
"link": "/radio/program/tech-nation",
"subscribe": {
"rss": "https://technation.podomatic.com/rss2.xml"
}
},
"ted-radio-hour": {
"id": "ted-radio-hour",
"title": "TED Radio Hour",
"info": "The TED Radio Hour is a journey through fascinating ideas, astonishing inventions, fresh approaches to old problems, and new ways to think and create.",
"airtime": "SUN 3pm-4pm, SAT 10pm-11pm",
"imageSrc": "https://ww2.kqed.org/radio/wp-content/uploads/sites/50/2018/04/tedRadioHour.jpg",
"officialWebsiteLink": "https://www.npr.org/programs/ted-radio-hour/?showDate=2018-06-22",
"meta": {
"site": "news",
"source": "npr"
},
"link": "/radio/program/ted-radio-hour",
"subscribe": {
"npr": "https://rpb3r.app.goo.gl/8vsS",
"apple": "https://itunes.apple.com/WebObjects/MZStore.woa/wa/viewPodcast?s=143441&mt=2&id=523121474&at=11l79Y&ct=nprdirectory",
"tuneIn": "https://tunein.com/radio/TED-Radio-Hour-p418021/",
"rss": "https://feeds.npr.org/510298/podcast.xml"
}
},
"thebay": {
"id": "thebay",
"title": "The Bay",
"tagline": "Local news to keep you rooted",
"info": "Host Devin Katayama walks you through the biggest story of the day with reporters and newsmakers.",
"imageSrc": "https://cdn.kqed.org/wp-content/uploads/2024/04/The-Bay-Podcast-Tile-703x703-1.jpg",
"imageAlt": "KQED The Bay",
"officialWebsiteLink": "/podcasts/thebay",
"meta": {
"site": "radio",
"source": "kqed",
"order": 2
},
"link": "/podcasts/thebay",
"subscribe": {
"apple": "https://podcasts.apple.com/us/podcast/the-bay/id1350043452",
"amazon": "https://music.amazon.com/podcasts/d800ea4c-7a2c-42f2-b861-edaf78a5db0b/the-bay",
"npr": "https://www.npr.org/podcasts/586725995/the-bay",
"stitcher": "https://www.stitcher.com/podcast/kqed/the-bay",
"spotify": "https://open.spotify.com/show/4BIKBKIujizLHlIlBNaAqQ",
"rss": "https://feeds.megaphone.fm/KQINC8259786327"
}
},
"thelatest": {
"id": "thelatest",
"title": "The Latest",
"tagline": "Trusted local news in real time",
"info": "",
"imageSrc": "https://cdn.kqed.org/wp-content/uploads/2025/05/The-Latest-2025-Podcast-Tile-703x703-1.jpg",
"imageAlt": "KQED The Latest",
"officialWebsiteLink": "/thelatest",
"meta": {
"site": "news",
"source": "kqed",
"order": 6
},
"link": "/thelatest",
"subscribe": {
"apple": "https://podcasts.apple.com/us/podcast/the-latest-from-kqed/id1197721799",
"npr": "https://www.npr.org/podcasts/1257949365/the-latest-from-k-q-e-d",
"spotify": "https://open.spotify.com/show/5KIIXMgM9GTi5AepwOYvIZ?si=bd3053fec7244dba",
"rss": "https://feeds.megaphone.fm/KQINC9137121918"
}
},
"theleap": {
"id": "theleap",
"title": "The Leap",
"tagline": "What if you closed your eyes, and jumped?",
"info": "Stories about people making dramatic, risky changes, told by award-winning public radio reporter Judy Campbell.",
"imageSrc": "https://cdn.kqed.org/wp-content/uploads/2024/04/The-Leap-Podcast-Tile-703x703-1.jpg",
"imageAlt": "KQED The Leap",
"officialWebsiteLink": "/podcasts/theleap",
"meta": {
"site": "news",
"source": "kqed",
"order": 17
},
"link": "/podcasts/theleap",
"subscribe": {
"apple": "https://podcasts.apple.com/us/podcast/the-leap/id1046668171",
"npr": "https://www.npr.org/podcasts/447248267/the-leap",
"stitcher": "https://www.stitcher.com/podcast/kqed/the-leap",
"spotify": "https://open.spotify.com/show/3sSlVHHzU0ytLwuGs1SD1U",
"rss": "https://ww2.kqed.org/news/programs/the-leap/feed/podcast"
}
},
"the-moth-radio-hour": {
"id": "the-moth-radio-hour",
"title": "The Moth Radio Hour",
"info": "Since its launch in 1997, The Moth has presented thousands of true stories, told live and without notes, to standing-room-only crowds worldwide. Moth storytellers stand alone, under a spotlight, with only a microphone and a roomful of strangers. The storyteller and the audience embark on a high-wire act of shared experience which is both terrifying and exhilarating. Since 2008, The Moth podcast has featured many of our favorite stories told live on Moth stages around the country. For information on all of our programs and live events, visit themoth.org.",
"airtime": "SAT 8pm-9pm and SUN 11am-12pm",
"imageSrc": "https://ww2.kqed.org/radio/wp-content/uploads/sites/50/2018/04/theMoth.jpg",
"officialWebsiteLink": "https://themoth.org/",
"meta": {
"site": "arts",
"source": "prx"
},
"link": "/radio/program/the-moth-radio-hour",
"subscribe": {
"apple": "https://itunes.apple.com/us/podcast/the-moth-podcast/id275699983?mt=2",
"tuneIn": "https://tunein.com/radio/The-Moth-p273888/",
"rss": "http://feeds.themoth.org/themothpodcast"
}
},
"the-new-yorker-radio-hour": {
"id": "the-new-yorker-radio-hour",
"title": "The New Yorker Radio Hour",
"info": "The New Yorker Radio Hour is a weekly program presented by the magazine's editor, David Remnick, and produced by WNYC Studios and The New Yorker. Each episode features a diverse mix of interviews, profiles, storytelling, and an occasional burst of humor inspired by the magazine, and shaped by its writers, artists, and editors. This isn't a radio version of a magazine, but something all its own, reflecting the rich possibilities of audio storytelling and conversation. Theme music for the show was composed and performed by Merrill Garbus of tUnE-YArDs.",
"airtime": "SAT 10am-11am",
"imageSrc": "https://cdn.kqed.org/wp-content/uploads/2024/04/The-New-Yorker-Podcast-Tile-360x360-1.jpg",
"officialWebsiteLink": "https://www.wnycstudios.org/shows/tnyradiohour",
"meta": {
"site": "arts",
"source": "WNYC"
},
"link": "/radio/program/the-new-yorker-radio-hour",
"subscribe": {
"apple": "https://itunes.apple.com/us/podcast/id1050430296",
"tuneIn": "https://tunein.com/podcasts/WNYC-Podcasts/New-Yorker-Radio-Hour-p803804/",
"rss": "https://feeds.feedburner.com/newyorkerradiohour"
}
},
"the-sam-sanders-show": {
"id": "the-sam-sanders-show",
"title": "The Sam Sanders Show",
"info": "One of public radio's most dynamic voices, Sam Sanders helped launch The NPR Politics Podcast and hosted NPR's hit show It's Been A Minute. Now, the award-winning host returns with something brand new, The Sam Sanders Show. Every week, Sam Sanders and friends dig into the culture that shapes our lives: what's driving the biggest trends, how artists really think, and even the memes you can't stop scrolling past. Sam is beloved for his way of unpacking the world and bringing you up close to fresh currents and engaging conversations. The Sam Sanders Show is smart, funny and always a good time.",
"airtime": "FRI 12-1pm AND SAT 11am-12pm",
"imageSrc": "https://cdn.kqed.org/wp-content/uploads/2025/11/The-Sam-Sanders-Show-Podcast-Tile-400x400-1.jpg",
"officialWebsiteLink": "https://www.kcrw.com/shows/the-sam-sanders-show/latest",
"meta": {
"site": "arts",
"source": "KCRW"
},
"link": "https://www.kcrw.com/shows/the-sam-sanders-show/latest",
"subscribe": {
"rss": "https://feed.cdnstream1.com/zjb/feed/download/ac/28/59/ac28594c-e1d0-4231-8728-61865cdc80e8.xml"
}
},
"the-splendid-table": {
"id": "the-splendid-table",
"title": "The Splendid Table",
"info": "\u003cem>The Splendid Table\u003c/em> hosts our nation's conversations about cooking, sustainability and food culture.",
"imageSrc": "https://cdn.kqed.org/wp-content/uploads/2024/04/The-Splendid-Table-Podcast-Tile-360x360-1.jpg",
"officialWebsiteLink": "https://www.splendidtable.org/",
"airtime": "SUN 10-11 pm",
"meta": {
"site": "radio",
"source": "npr"
},
"link": "/radio/program/the-splendid-table"
},
"this-american-life": {
"id": "this-american-life",
"title": "This American Life",
"info": "This American Life is a weekly public radio show, heard by 2.2 million people on more than 500 stations. Another 2.5 million people download the weekly podcast. It is hosted by Ira Glass, produced in collaboration with Chicago Public Media, delivered to stations by PRX The Public Radio Exchange, and has won all of the major broadcasting awards.",
"airtime": "SAT 12pm-1pm, 7pm-8pm",
"imageSrc": "https://ww2.kqed.org/radio/wp-content/uploads/sites/50/2018/04/thisAmericanLife.png",
"officialWebsiteLink": "https://www.thisamericanlife.org/",
"meta": {
"site": "news",
"source": "wbez"
},
"link": "/radio/program/this-american-life",
"subscribe": {
"apple": "https://itunes.apple.com/WebObjects/MZStore.woa/wa/viewPodcast?s=143441&mt=2&id=201671138&at=11l79Y&ct=nprdirectory",
"rss": "https://www.thisamericanlife.org/podcast/rss.xml"
}
},
"tinydeskradio": {
"id": "tinydeskradio",
"title": "Tiny Desk Radio",
"info": "We're bringing the best of Tiny Desk to the airwaves, only on public radio.",
"airtime": "SUN 8pm and SAT 9pm",
"imageSrc": "https://cdn.kqed.org/wp-content/uploads/2025/04/300x300-For-Member-Station-Logo-Tiny-Desk-Radio-@2x.png",
"officialWebsiteLink": "https://www.npr.org/series/g-s1-52030/tiny-desk-radio",
"meta": {
"site": "news",
"source": "npr"
},
"link": "/radio/program/tinydeskradio",
"subscribe": {
"rss": "https://feeds.npr.org/g-s1-52030/rss.xml"
}
},
"wait-wait-dont-tell-me": {
"id": "wait-wait-dont-tell-me",
"title": "Wait Wait... Don't Tell Me!",
"info": "Peter Sagal and Bill Kurtis host the weekly NPR News quiz show alongside some of the best and brightest news and entertainment personalities.",
"airtime": "SUN 10am-11am, SAT 11am-12pm, SAT 6pm-7pm",
"imageSrc": "https://cdn.kqed.org/wp-content/uploads/2024/04/Wait-Wait-Podcast-Tile-300x300-1.jpg",
"officialWebsiteLink": "https://www.npr.org/programs/wait-wait-dont-tell-me/",
"meta": {
"site": "news",
"source": "npr"
},
"link": "/radio/program/wait-wait-dont-tell-me",
"subscribe": {
"npr": "https://rpb3r.app.goo.gl/Xogv",
"apple": "https://itunes.apple.com/WebObjects/MZStore.woa/wa/viewPodcast?s=143441&mt=2&id=121493804&at=11l79Y&ct=nprdirectory",
"tuneIn": "https://tunein.com/radio/Wait-Wait-Dont-Tell-Me-p46/",
"rss": "https://feeds.npr.org/344098539/podcast.xml"
}
},
"weekend-edition-saturday": {
"id": "weekend-edition-saturday",
"title": "Weekend Edition Saturday",
"info": "Weekend Edition Saturday wraps up the week's news and offers a mix of analysis and features on a wide range of topics, including arts, sports, entertainment, and human interest stories. The two-hour program is hosted by NPR's Peabody Award-winning Scott Simon.",
"airtime": "SAT 5am-10am",
"imageSrc": "https://cdn.kqed.org/wp-content/uploads/2024/04/Weekend-Edition-Podcast-Tile-360x360-1.jpg",
"officialWebsiteLink": "https://www.npr.org/programs/weekend-edition-saturday/",
"meta": {
"site": "news",
"source": "npr"
},
"link": "/radio/program/weekend-edition-saturday"
},
"weekend-edition-sunday": {
"id": "weekend-edition-sunday",
"title": "Weekend Edition Sunday",
"info": "Weekend Edition Sunday features interviews with newsmakers, artists, scientists, politicians, musicians, writers, theologians and historians. The program has covered news events from Nelson Mandela's 1990 release from a South African prison to the capture of Saddam Hussein.",
"airtime": "SUN 5am-10am",
"imageSrc": "https://cdn.kqed.org/wp-content/uploads/2024/04/Weekend-Edition-Podcast-Tile-360x360-1.jpg",
"officialWebsiteLink": "https://www.npr.org/programs/weekend-edition-sunday/",
"meta": {
"site": "news",
"source": "npr"
},
"link": "/radio/program/weekend-edition-sunday"
}
},
"racesReducer": {},
"racesGenElectionReducer": {},
"racesGenElection2026Reducer": {},
"radioSchedulesReducer": {},
"listsReducer": {
"posts/science?category=climate": {
"isFetching": false,
"latestQuery": {
"from": 1164,
"size": 12
},
"vitalsOnly": false,
"totalRequested": 12,
"isLoading": false,
"isLoadingMore": true,
"total": {
"value": 1586,
"relation": "eq"
},
"items": [
"science_846701",
"science_884418",
"science_881900",
"science_863270",
"science_860496",
"science_858143",
"science_850997",
"science_848472",
"science_845966",
"science_841345",
"science_841018",
"science_841008"
],
"complete": true
}
},
"recallGuideReducer": {
"intros": {},
"policy": {},
"candidates": {}
},
"savedArticleReducer": {
"articles": [],
"status": {}
},
"newslettersReducer": {
"isFetching": false,
"fetchFailed": false,
"hasFetched": false,
"newsletters": {},
"isSubscribing": false,
"isUnsubscribing": false,
"subscribedNewsletters": {}
},
"termsReducer": {
"about": {
"name": "About",
"type": "terms",
"id": "about",
"slug": "about",
"link": "/about",
"taxonomy": "site"
},
"arts": {
"name": "Arts & Culture",
"grouping": [
"arts",
"pop",
"trulyca"
],
"description": "KQED Arts provides daily in-depth coverage of the Bay Area's music, art, film, performing arts, literature and arts news, as well as cultural commentary and criticism.",
"type": "terms",
"id": "arts",
"slug": "arts",
"link": "/arts",
"taxonomy": "site"
},
"artschool": {
"name": "Art School",
"parent": "arts",
"type": "terms",
"id": "artschool",
"slug": "artschool",
"link": "/artschool",
"taxonomy": "site"
},
"bayareabites": {
"name": "KQED food",
"grouping": [
"food",
"bayareabites",
"checkplease"
],
"parent": "food",
"type": "terms",
"id": "bayareabites",
"slug": "bayareabites",
"link": "/food",
"taxonomy": "site"
},
"bayareahiphop": {
"name": "Bay Area Hiphop",
"type": "terms",
"id": "bayareahiphop",
"slug": "bayareahiphop",
"link": "/bayareahiphop",
"taxonomy": "site"
},
"campaign21": {
"name": "Campaign 21",
"type": "terms",
"id": "campaign21",
"slug": "campaign21",
"link": "/campaign21",
"taxonomy": "site"
},
"careers": {
"name": "Careers",
"type": "terms",
"id": "careers",
"slug": "careers",
"link": "/careers",
"taxonomy": "site"
},
"checkplease": {
"name": "KQED food",
"grouping": [
"food",
"bayareabites",
"checkplease"
],
"parent": "food",
"type": "terms",
"id": "checkplease",
"slug": "checkplease",
"link": "/food",
"taxonomy": "site"
},
"education": {
"name": "Education",
"grouping": [
"education"
],
"type": "terms",
"id": "education",
"slug": "education",
"link": "/education",
"taxonomy": "site"
},
"elections": {
"name": "Elections",
"type": "terms",
"id": "elections",
"slug": "elections",
"link": "/elections",
"taxonomy": "site"
},
"events": {
"name": "Events",
"type": "terms",
"id": "events",
"slug": "events",
"link": "/events",
"taxonomy": "site"
},
"event": {
"name": "Event",
"alias": "events",
"type": "terms",
"id": "event",
"slug": "event",
"link": "/event",
"taxonomy": "site"
},
"filmschoolshorts": {
"name": "Film School Shorts",
"type": "terms",
"id": "filmschoolshorts",
"slug": "filmschoolshorts",
"link": "/filmschoolshorts",
"taxonomy": "site"
},
"food": {
"name": "KQED food",
"grouping": [
"food",
"bayareabites",
"checkplease"
],
"type": "terms",
"id": "food",
"slug": "food",
"link": "/food",
"taxonomy": "site"
},
"forum": {
"name": "Forum",
"relatedContentQuery": "posts/forum?",
"parent": "news",
"type": "terms",
"id": "forum",
"slug": "forum",
"link": "/forum",
"taxonomy": "site"
},
"futureofyou": {
"name": "Future of You",
"grouping": [
"science",
"futureofyou"
],
"parent": "science",
"type": "terms",
"id": "futureofyou",
"slug": "futureofyou",
"link": "/futureofyou",
"taxonomy": "site"
},
"jpepinheart": {
"name": "KQED food",
"relatedContentQuery": "posts/food,bayareabites,checkplease",
"parent": "food",
"type": "terms",
"id": "jpepinheart",
"slug": "jpepinheart",
"link": "/food",
"taxonomy": "site"
},
"liveblog": {
"name": "Live Blog",
"type": "terms",
"id": "liveblog",
"slug": "liveblog",
"link": "/liveblog",
"taxonomy": "site"
},
"livetv": {
"name": "Live TV",
"parent": "tv",
"type": "terms",
"id": "livetv",
"slug": "livetv",
"link": "/livetv",
"taxonomy": "site"
},
"lowdown": {
"name": "The Lowdown",
"relatedContentQuery": "posts/lowdown?",
"parent": "news",
"type": "terms",
"id": "lowdown",
"slug": "lowdown",
"link": "/lowdown",
"taxonomy": "site"
},
"mindshift": {
"name": "Mindshift",
"parent": "news",
"description": "MindShift explores the future of education by highlighting the innovative – and sometimes counterintuitive – ways educators and parents are helping all children succeed.",
"type": "terms",
"id": "mindshift",
"slug": "mindshift",
"link": "/mindshift",
"taxonomy": "site"
},
"news": {
"name": "News",
"grouping": [
"news",
"forum"
],
"type": "terms",
"id": "news",
"slug": "news",
"link": "/news",
"taxonomy": "site"
},
"newsletters": {
"name": "newsletters",
"type": "terms",
"id": "newsletters",
"slug": "newsletters",
"link": "/newsletters",
"taxonomy": "site"
},
"perspectives": {
"name": "Perspectives",
"parent": "radio",
"type": "terms",
"id": "perspectives",
"slug": "perspectives",
"link": "/perspectives",
"taxonomy": "site"
},
"podcasts": {
"name": "Podcasts",
"type": "terms",
"id": "podcasts",
"slug": "podcasts",
"link": "/podcasts",
"taxonomy": "site"
},
"pop": {
"name": "Pop",
"parent": "arts",
"type": "terms",
"id": "pop",
"slug": "pop",
"link": "/pop",
"taxonomy": "site"
},
"pressroom": {
"name": "Pressroom",
"type": "terms",
"id": "pressroom",
"slug": "pressroom",
"link": "/pressroom",
"taxonomy": "site"
},
"quest": {
"name": "Quest",
"parent": "science",
"type": "terms",
"id": "quest",
"slug": "quest",
"link": "/quest",
"taxonomy": "site"
},
"radio": {
"name": "Radio",
"grouping": [
"forum",
"perspectives"
],
"description": "Listen to KQED Public Radio – home of Forum and The California Report – on 88.5 FM in San Francisco, 89.3 FM in Sacramento, 88.3 FM in Santa Rosa and 88.1 FM in Martinez.",
"type": "terms",
"id": "radio",
"slug": "radio",
"link": "/radio",
"taxonomy": "site"
},
"root": {
"name": "KQED",
"image": "https://ww2.kqed.org/app/uploads/2020/02/KQED-OG-Image@1x.png",
"imageWidth": 1200,
"imageHeight": 630,
"headData": {
"title": "KQED | News, Radio, Podcasts, TV | Public Media for Northern California",
"description": "KQED provides public radio, television, and independent reporting on issues that matter to the Bay Area. We’re the NPR and PBS member station for Northern California."
},
"type": "terms",
"id": "root",
"slug": "root",
"link": "/root",
"taxonomy": "site"
},
"science": {
"name": "Science",
"grouping": [
"science",
"futureofyou"
],
"description": "KQED Science brings you award-winning science and environment coverage from the Bay Area and beyond.",
"type": "terms",
"id": "science",
"slug": "science",
"link": "/science",
"taxonomy": "site"
},
"stateofhealth": {
"name": "State of Health",
"parent": "science",
"type": "terms",
"id": "stateofhealth",
"slug": "stateofhealth",
"link": "/stateofhealth",
"taxonomy": "site"
},
"support": {
"name": "Support",
"type": "terms",
"id": "support",
"slug": "support",
"link": "/support",
"taxonomy": "site"
},
"thedolist": {
"name": "The Do List",
"parent": "arts",
"type": "terms",
"id": "thedolist",
"slug": "thedolist",
"link": "/thedolist",
"taxonomy": "site"
},
"trulyca": {
"name": "Truly CA",
"grouping": [
"arts",
"pop",
"trulyca"
],
"parent": "arts",
"type": "terms",
"id": "trulyca",
"slug": "trulyca",
"link": "/trulyca",
"taxonomy": "site"
},
"tv": {
"name": "TV",
"type": "terms",
"id": "tv",
"slug": "tv",
"link": "/tv",
"taxonomy": "site"
},
"voterguide": {
"name": "Voter Guide",
"parent": "elections",
"alias": "elections",
"type": "terms",
"id": "voterguide",
"slug": "voterguide",
"link": "/voterguide",
"taxonomy": "site"
},
"guiaelectoral": {
"name": "Guia Electoral",
"parent": "elections",
"alias": "elections",
"type": "terms",
"id": "guiaelectoral",
"slug": "guiaelectoral",
"link": "/guiaelectoral",
"taxonomy": "site"
},
"science_category_climate": {
"isLoading": true
},
"science_31": {
"type": "terms",
"id": "science_31",
"meta": {
"index": "terms_1716263798",
"site": "science",
"id": "31",
"found": true
},
"relationships": {},
"featImg": null,
"name": "Climate",
"description": null,
"taxonomy": "category",
"headData": {
"twImgId": null,
"twTitle": null,
"ogTitle": null,
"ogImgId": null,
"twDescription": null,
"description": null,
"title": "Climate Archives | KQED Science",
"ogDescription": null
},
"ttid": 33,
"slug": "climate",
"isLoading": false,
"link": "/science/category/climate"
},
"source_science_884418": {
"type": "terms",
"id": "source_science_884418",
"meta": {
"override": true
},
"name": "Climate Central",
"link": "http://www.climatecentral.org/",
"isLoading": false
},
"source_science_860496": {
"type": "terms",
"id": "source_science_860496",
"meta": {
"override": true
},
"name": "Climate Central",
"link": "http://www.climatecentral.org/",
"isLoading": false
},
"source_science_858143": {
"type": "terms",
"id": "source_science_858143",
"meta": {
"override": true
},
"name": "Water Deeply",
"link": "https://www.newsdeeply.com/water/",
"isLoading": false
},
"source_science_850997": {
"type": "terms",
"id": "source_science_850997",
"meta": {
"override": true
},
"name": "Climate Central",
"link": "http://www.climatecentral.org/",
"isLoading": false
},
"source_science_848472": {
"type": "terms",
"id": "source_science_848472",
"meta": {
"override": true
},
"name": "Climate Central",
"isLoading": false
},
"source_science_845966": {
"type": "terms",
"id": "source_science_845966",
"meta": {
"override": true
},
"name": "Climate Central",
"link": "http://www.climatecentral.org/",
"isLoading": false
},
"source_science_841345": {
"type": "terms",
"id": "source_science_841345",
"meta": {
"override": true
},
"name": "Associated Press",
"isLoading": false
},
"source_science_841018": {
"type": "terms",
"id": "source_science_841018",
"meta": {
"override": true
},
"name": "Climate Central",
"link": "http://www.climatecentral.org/",
"isLoading": false
},
"source_science_841008": {
"type": "terms",
"id": "source_science_841008",
"meta": {
"override": true
},
"name": "NPR",
"link": "http://www.npr.org/",
"isLoading": false
},
"science_1151": {
"type": "terms",
"id": "science_1151",
"meta": {
"index": "terms_1716263798",
"site": "science",
"id": "1151",
"found": true
},
"relationships": {},
"featImg": null,
"name": "Drought Watch",
"description": "\u003cem>What California's reservoirs look like right now (From KQED's \u003ca href=\"http://ww2.kqed.org/lowdown/\">The Lowdown\u003c/a>)\u003c/em>\r\n\r\n[iframe src=\"http://kroodsma.com/KQED/water-supply-master/public/map.html\" width=\"640\" height=\"720\" frameborder=\"0\" scrolling=\"no\"]\r\n\r\n\u003cem>We’re collecting all of our California drought coverage here, starting with the current state of the drought, then providing the \u003ca href=\"#background\">background\u003c/a> and rounding up \u003ca href=\"#river\">all the stories\u003c/a> we’ve produced.\u003c/em>\r\n\r\n\u003cstrong>Relief at Last\r\n\u003c/strong>\r\n\r\nIn early April, after more than five years of the most withering drought on record, California Governor Jerry Brown finally lifted the emergency drought order he issued in January of 2014. By that time, the record-setting winter of 2016-17 had removed all doubt that the drought was over, though concerns over depleted groundwater levels still remain. According to the \u003ca href=\"http://droughtmonitor.unl.edu/\" target=\"_blank\">U.S. Drought Monitor\u003c/a>, less than 10 percent of California remains in “moderate drought” — compared to nearly 100 percent of the state a year ago.\r\n\r\n[http_redir]",
"taxonomy": "series",
"headData": {
"twImgId": null,
"twTitle": null,
"ogTitle": null,
"ogImgId": null,
"twDescription": null,
"description": "What California's reservoirs look like right now (From KQED's The Lowdown) [iframe src=\"http://kroodsma.com/KQED/water-supply-master/public/map.html\" width=\"640\" height=\"720\" frameborder=\"0\" scrolling=\"no\"] We’re collecting all of our California drought coverage here, starting with the current state of the drought, then providing the background and rounding up all the stories we’ve produced. Relief at Last In early April, after more than five years of the most withering drought on record, California Governor Jerry Brown finally lifted the emergency drought order he issued in January of 2014. By that time, the record-setting winter of 2016-17 had removed all doubt that the drought was over, though concerns over depleted groundwater levels still remain. According to the U.S. Drought Monitor, less than 10 percent of California remains in “moderate drought” — compared to nearly 100 percent of the state a year ago. [http_redir]",
"title": "Drought Watch Archives | KQED Science",
"ogDescription": null
},
"ttid": 1160,
"slug": "california-drought-watch",
"isLoading": false,
"link": "/science/series/california-drought-watch"
},
"science_40": {
"type": "terms",
"id": "science_40",
"meta": {
"index": "terms_1716263798",
"site": "science",
"id": "40",
"found": true
},
"relationships": {},
"featImg": null,
"name": "News",
"description": null,
"taxonomy": "category",
"headData": {
"twImgId": null,
"twTitle": null,
"ogTitle": null,
"ogImgId": null,
"twDescription": null,
"description": null,
"title": "News Archives | KQED Science",
"ogDescription": null
},
"ttid": 42,
"slug": "news",
"isLoading": false,
"link": "/science/category/news"
},
"science_43": {
"type": "terms",
"id": "science_43",
"meta": {
"index": "terms_1716263798",
"site": "science",
"id": "43",
"found": true
},
"relationships": {},
"featImg": null,
"name": "Radio",
"description": null,
"taxonomy": "category",
"headData": {
"twImgId": null,
"twTitle": null,
"ogTitle": null,
"ogImgId": null,
"twDescription": null,
"description": null,
"title": "Radio Archives | KQED Science",
"ogDescription": null
},
"ttid": 45,
"slug": "radio",
"isLoading": false,
"link": "/science/category/radio"
},
"science_98": {
"type": "terms",
"id": "science_98",
"meta": {
"index": "terms_1716263798",
"site": "science",
"id": "98",
"found": true
},
"relationships": {},
"featImg": null,
"name": "Water",
"description": null,
"taxonomy": "category",
"headData": {
"twImgId": null,
"twTitle": null,
"ogTitle": null,
"ogImgId": null,
"twDescription": null,
"description": null,
"title": "Water Archives | KQED Science",
"ogDescription": null
},
"ttid": 102,
"slug": "water",
"isLoading": false,
"link": "/science/category/water"
},
"science_1622": {
"type": "terms",
"id": "science_1622",
"meta": {
"index": "terms_1716263798",
"site": "science",
"id": "1622",
"found": true
},
"relationships": {},
"featImg": null,
"name": "California drought",
"description": null,
"taxonomy": "tag",
"headData": {
"twImgId": null,
"twTitle": null,
"ogTitle": null,
"ogImgId": null,
"twDescription": null,
"description": null,
"title": "California drought Archives | KQED Science",
"ogDescription": null
},
"ttid": 1631,
"slug": "california-drought",
"isLoading": false,
"link": "/science/tag/california-drought"
},
"science_876": {
"type": "terms",
"id": "science_876",
"meta": {
"index": "terms_1716263798",
"site": "science",
"id": "876",
"found": true
},
"relationships": {},
"featImg": null,
"name": "water conservation",
"description": null,
"taxonomy": "tag",
"headData": {
"twImgId": null,
"twTitle": null,
"ogTitle": null,
"ogImgId": null,
"twDescription": null,
"description": null,
"title": "water conservation Archives | KQED Science",
"ogDescription": null
},
"ttid": 882,
"slug": "water-conservation",
"isLoading": false,
"link": "/science/tag/water-conservation"
},
"science_35": {
"type": "terms",
"id": "science_35",
"meta": {
"index": "terms_1716263798",
"site": "science",
"id": "35",
"found": true
},
"relationships": {},
"featImg": null,
"name": "Environment",
"description": null,
"taxonomy": "category",
"headData": {
"twImgId": null,
"twTitle": null,
"ogTitle": null,
"ogImgId": null,
"twDescription": null,
"description": null,
"title": "Environment Archives | KQED Science",
"ogDescription": null
},
"ttid": 37,
"slug": "environment",
"isLoading": false,
"link": "/science/category/environment"
},
"science_194": {
"type": "terms",
"id": "science_194",
"meta": {
"index": "terms_1716263798",
"site": "science",
"id": "194",
"found": true
},
"relationships": {},
"featImg": null,
"name": "climate change",
"description": null,
"taxonomy": "tag",
"headData": {
"twImgId": null,
"twTitle": null,
"ogTitle": null,
"ogImgId": null,
"twDescription": null,
"description": null,
"title": "climate change Archives | KQED Science",
"ogDescription": null
},
"ttid": 198,
"slug": "climate-change",
"isLoading": false,
"link": "/science/tag/climate-change"
},
"science_113": {
"type": "terms",
"id": "science_113",
"meta": {
"index": "terms_1716263798",
"site": "science",
"id": "113",
"found": true
},
"relationships": {},
"featImg": null,
"name": "wildfire",
"description": null,
"taxonomy": "tag",
"headData": {
"twImgId": null,
"twTitle": null,
"ogTitle": null,
"ogImgId": null,
"twDescription": null,
"description": null,
"title": "wildfire Archives | KQED Science",
"ogDescription": null
},
"ttid": 117,
"slug": "wildfire",
"isLoading": false,
"link": "/science/tag/wildfire"
},
"science_30": {
"type": "terms",
"id": "science_30",
"meta": {
"index": "terms_1716263798",
"site": "science",
"id": "30",
"found": true
},
"relationships": {},
"featImg": null,
"name": "Biology",
"description": null,
"taxonomy": "category",
"headData": {
"twImgId": null,
"twTitle": null,
"ogTitle": null,
"ogImgId": null,
"twDescription": null,
"description": null,
"title": "Biology Archives | KQED Science",
"ogDescription": null
},
"ttid": 32,
"slug": "biology",
"isLoading": false,
"link": "/science/category/biology"
},
"science_572": {
"type": "terms",
"id": "science_572",
"meta": {
"index": "terms_1716263798",
"site": "science",
"id": "572",
"found": true
},
"relationships": {},
"featImg": null,
"name": "drought",
"description": null,
"taxonomy": "tag",
"headData": {
"twImgId": null,
"twTitle": null,
"ogTitle": null,
"ogImgId": null,
"twDescription": null,
"description": null,
"title": "drought Archives | KQED Science",
"ogDescription": null
},
"ttid": 578,
"slug": "drought",
"isLoading": false,
"link": "/science/tag/drought"
},
"science_5185": {
"type": "terms",
"id": "science_5185",
"meta": {
"index": "terms_1716263798",
"site": "science",
"id": "5185",
"found": true
},
"relationships": {},
"featImg": null,
"name": "Lake Tahoe",
"description": null,
"taxonomy": "tag",
"headData": {
"twImgId": null,
"twTitle": null,
"ogTitle": null,
"ogImgId": null,
"twDescription": null,
"description": null,
"title": "Lake Tahoe Archives | KQED Science",
"ogDescription": null
},
"ttid": 5185,
"slug": "lake-tahoe",
"isLoading": false,
"link": "/science/tag/lake-tahoe"
},
"science_813": {
"type": "terms",
"id": "science_813",
"meta": {
"index": "terms_1716263798",
"site": "science",
"id": "813",
"found": true
},
"relationships": {},
"featImg": null,
"name": "news",
"description": null,
"taxonomy": "tag",
"headData": {
"twImgId": null,
"twTitle": null,
"ogTitle": null,
"ogImgId": null,
"twDescription": null,
"description": null,
"title": "news Archives | KQED Science",
"ogDescription": null
},
"ttid": 820,
"slug": "news-2",
"isLoading": false,
"link": "/science/tag/news-2"
},
"science_5178": {
"type": "terms",
"id": "science_5178",
"meta": {
"index": "terms_1716263798",
"site": "science",
"id": "5178",
"found": true
},
"relationships": {},
"featImg": null,
"name": "California",
"description": null,
"taxonomy": "tag",
"headData": {
"twImgId": null,
"twTitle": null,
"ogTitle": null,
"ogImgId": null,
"twDescription": null,
"description": null,
"title": "California Archives | KQED Science",
"ogDescription": null
},
"ttid": 5178,
"slug": "california",
"isLoading": false,
"link": "/science/tag/california"
},
"science_109": {
"type": "terms",
"id": "science_109",
"meta": {
"index": "terms_1716263798",
"site": "science",
"id": "109",
"found": true
},
"relationships": {},
"featImg": null,
"name": "sierra nevada",
"description": null,
"taxonomy": "tag",
"headData": {
"twImgId": null,
"twTitle": null,
"ogTitle": null,
"ogImgId": null,
"twDescription": null,
"description": null,
"title": "sierra nevada Archives | KQED Science",
"ogDescription": null
},
"ttid": 113,
"slug": "sierra-nevada",
"isLoading": false,
"link": "/science/tag/sierra-nevada"
},
"science_2873": {
"type": "terms",
"id": "science_2873",
"meta": {
"index": "terms_1716263798",
"site": "science",
"id": "2873",
"found": true
},
"relationships": {},
"featImg": null,
"name": "Oceans",
"description": null,
"taxonomy": "category",
"headData": {
"twImgId": null,
"twTitle": null,
"ogTitle": null,
"ogImgId": null,
"twDescription": null,
"description": null,
"title": "Oceans Archives | KQED Science",
"ogDescription": null
},
"ttid": 2873,
"slug": "oceans",
"isLoading": false,
"link": "/science/category/oceans"
},
"science_33": {
"type": "terms",
"id": "science_33",
"meta": {
"index": "terms_1716263798",
"site": "science",
"id": "33",
"found": true
},
"relationships": {},
"featImg": null,
"name": "Energy",
"description": null,
"taxonomy": "category",
"headData": {
"twImgId": null,
"twTitle": null,
"ogTitle": null,
"ogImgId": null,
"twDescription": null,
"description": null,
"title": "Energy Archives | KQED Science",
"ogDescription": null
},
"ttid": 35,
"slug": "energy",
"isLoading": false,
"link": "/science/category/energy"
}
},
"userPermissionsReducer": {
"wpLoggedIn": false
},
"eventsReducer": {},
"fssReducer": {},
"tvDailyScheduleReducer": {},
"tvWeeklyScheduleReducer": {},
"tvPrimetimeScheduleReducer": {},
"tvMonthlyScheduleReducer": {},
"userAccountReducer": {
"user": {
"email": null,
"emailStatus": "EMAIL_UNVALIDATED",
"loggedStatus": "LOGGED_OUT",
"loggingChecked": false,
"articles": [],
"firstName": null,
"lastName": null,
"phoneNumber": null,
"fetchingMembership": false,
"membershipError": false,
"memberships": [
{
"id": null,
"startDate": null,
"firstName": null,
"lastName": null,
"familyNumber": null,
"memberNumber": null,
"memberSince": null,
"expirationDate": null,
"pfsEligible": false,
"isSustaining": false,
"membershipLevel": "Prospect",
"membershipStatus": "Non Member",
"lastGiftDate": null,
"renewalDate": null,
"lastDonationAmount": null
}
]
},
"authModal": {
"isOpen": false,
"view": "LANDING_VIEW"
},
"error": null
},
"youthMediaReducer": {},
"checkPleaseReducer": {
"filterData": {
"region": {
"key": "Restaurant Region",
"filters": [
"Any Region"
]
},
"cuisine": {
"key": "Restaurant Cuisine",
"filters": [
"Any Cuisine"
]
}
},
"restaurantDataById": {},
"restaurantIdsSorted": [],
"error": null
},
"userAgentReducer": {
"userAgent": "Mozilla/5.0 AppleWebKit/537.36 (KHTML, like Gecko; compatible; ClaudeBot/1.0; +claudebot@anthropic.com)",
"isBot": true
},
"requestOutcomesReducer": {
"notFound": []
}
}