window.__IS_SSR__=true
window.__INITIAL_STATE__={
"attachmentsReducer": {
"audio_0": {
"type": "attachments",
"id": "audio_0",
"imgSizes": {
"kqedFullSize": {
"file": "https://ww2.kqed.org/news/wp-content/themes/KQED-unified/img/audio_bgs/background0.jpg"
}
}
},
"audio_1": {
"type": "attachments",
"id": "audio_1",
"imgSizes": {
"kqedFullSize": {
"file": "https://ww2.kqed.org/news/wp-content/themes/KQED-unified/img/audio_bgs/background1.jpg"
}
}
},
"audio_2": {
"type": "attachments",
"id": "audio_2",
"imgSizes": {
"kqedFullSize": {
"file": "https://ww2.kqed.org/news/wp-content/themes/KQED-unified/img/audio_bgs/background2.jpg"
}
}
},
"audio_3": {
"type": "attachments",
"id": "audio_3",
"imgSizes": {
"kqedFullSize": {
"file": "https://ww2.kqed.org/news/wp-content/themes/KQED-unified/img/audio_bgs/background3.jpg"
}
}
},
"audio_4": {
"type": "attachments",
"id": "audio_4",
"imgSizes": {
"kqedFullSize": {
"file": "https://ww2.kqed.org/news/wp-content/themes/KQED-unified/img/audio_bgs/background4.jpg"
}
}
},
"placeholder": {
"type": "attachments",
"id": "placeholder",
"imgSizes": {
"thumbnail": {
"file": "https://cdn.kqed.org/wp-content/uploads/2024/12/KQED-Default-Image-816638274-2000x1333-1-160x107.jpg",
"width": 160,
"height": 107,
"mimeType": "image/jpeg"
},
"medium": {
"file": "https://cdn.kqed.org/wp-content/uploads/2024/12/KQED-Default-Image-816638274-2000x1333-1-800x533.jpg",
"width": 800,
"height": 533,
"mimeType": "image/jpeg"
},
"medium_large": {
"file": "https://cdn.kqed.org/wp-content/uploads/2024/12/KQED-Default-Image-816638274-2000x1333-1-768x512.jpg",
"width": 768,
"height": 512,
"mimeType": "image/jpeg"
},
"large": {
"file": "https://cdn.kqed.org/wp-content/uploads/2024/12/KQED-Default-Image-816638274-2000x1333-1-1020x680.jpg",
"width": 1020,
"height": 680,
"mimeType": "image/jpeg"
},
"1536x1536": {
"file": "https://cdn.kqed.org/wp-content/uploads/2024/12/KQED-Default-Image-816638274-2000x1333-1-1536x1024.jpg",
"width": 1536,
"height": 1024,
"mimeType": "image/jpeg"
},
"fd-lrg": {
"file": "https://cdn.kqed.org/wp-content/uploads/2024/12/KQED-Default-Image-816638274-2000x1333-1-1536x1024.jpg",
"width": 1536,
"height": 1024,
"mimeType": "image/jpeg"
},
"fd-med": {
"file": "https://cdn.kqed.org/wp-content/uploads/2024/12/KQED-Default-Image-816638274-2000x1333-1-1020x680.jpg",
"width": 1020,
"height": 680,
"mimeType": "image/jpeg"
},
"fd-sm": {
"file": "https://cdn.kqed.org/wp-content/uploads/2024/12/KQED-Default-Image-816638274-2000x1333-1-800x533.jpg",
"width": 800,
"height": 533,
"mimeType": "image/jpeg"
},
"post-thumbnail": {
"file": "https://cdn.kqed.org/wp-content/uploads/2024/12/KQED-Default-Image-816638274-2000x1333-1-672x372.jpg",
"width": 672,
"height": 372,
"mimeType": "image/jpeg"
},
"twentyfourteen-full-width": {
"file": "https://cdn.kqed.org/wp-content/uploads/2024/12/KQED-Default-Image-816638274-2000x1333-1-1038x576.jpg",
"width": 1038,
"height": 576,
"mimeType": "image/jpeg"
},
"xxsmall": {
"file": "https://cdn.kqed.org/wp-content/uploads/2024/12/KQED-Default-Image-816638274-2000x1333-1-160x107.jpg",
"width": 160,
"height": 107,
"mimeType": "image/jpeg"
},
"xsmall": {
"file": "https://cdn.kqed.org/wp-content/uploads/2024/12/KQED-Default-Image-816638274-2000x1333-1-672x372.jpg",
"width": 672,
"height": 372,
"mimeType": "image/jpeg"
},
"small": {
"file": "https://cdn.kqed.org/wp-content/uploads/2024/12/KQED-Default-Image-816638274-2000x1333-1-672x372.jpg",
"width": 672,
"height": 372,
"mimeType": "image/jpeg"
},
"xlarge": {
"file": "https://cdn.kqed.org/wp-content/uploads/2024/12/KQED-Default-Image-816638274-2000x1333-1-1020x680.jpg",
"width": 1020,
"height": 680,
"mimeType": "image/jpeg"
},
"full-width": {
"file": "https://cdn.kqed.org/wp-content/uploads/2024/12/KQED-Default-Image-816638274-2000x1333-1-1920x1280.jpg",
"width": 1920,
"height": 1280,
"mimeType": "image/jpeg"
},
"guest-author-32": {
"file": "https://cdn.kqed.org/wp-content/uploads/2025/01/KQED-Default-Image-816638274-1333x1333-1-160x160.jpg",
"width": 32,
"height": 32,
"mimeType": "image/jpeg"
},
"guest-author-50": {
"file": "https://cdn.kqed.org/wp-content/uploads/2025/01/KQED-Default-Image-816638274-1333x1333-1-160x160.jpg",
"width": 50,
"height": 50,
"mimeType": "image/jpeg"
},
"guest-author-64": {
"file": "https://cdn.kqed.org/wp-content/uploads/2025/01/KQED-Default-Image-816638274-1333x1333-1-160x160.jpg",
"width": 64,
"height": 64,
"mimeType": "image/jpeg"
},
"guest-author-96": {
"file": "https://cdn.kqed.org/wp-content/uploads/2025/01/KQED-Default-Image-816638274-1333x1333-1-160x160.jpg",
"width": 96,
"height": 96,
"mimeType": "image/jpeg"
},
"guest-author-128": {
"file": "https://cdn.kqed.org/wp-content/uploads/2025/01/KQED-Default-Image-816638274-1333x1333-1-160x160.jpg",
"width": 128,
"height": 128,
"mimeType": "image/jpeg"
},
"detail": {
"file": "https://cdn.kqed.org/wp-content/uploads/2025/01/KQED-Default-Image-816638274-1333x1333-1-160x160.jpg",
"width": 160,
"height": 160,
"mimeType": "image/jpeg"
},
"kqedFullSize": {
"file": "https://cdn.kqed.org/wp-content/uploads/2024/12/KQED-Default-Image-816638274-2000x1333-1.jpg",
"width": 2000,
"height": 1333
}
}
},
"science_959714": {
"type": "attachments",
"id": "science_959714",
"meta": {
"index": "attachments_1716263798",
"site": "science",
"id": "959714",
"found": true
},
"parent": 958786,
"imgSizes": {
"twentyfourteen-full-width": {
"file": "https://ww2.kqed.org/app/uploads/sites/35/2016/08/ObamaforKQED10-1038x576.jpeg",
"width": 1038,
"mimeType": "image/jpeg",
"height": 576
},
"thumbnail": {
"file": "https://ww2.kqed.org/app/uploads/sites/35/2016/08/ObamaforKQED10-400x292.jpeg",
"width": 400,
"mimeType": "image/jpeg",
"height": 292
},
"fd-sm": {
"file": "https://ww2.kqed.org/app/uploads/sites/35/2016/08/ObamaforKQED10-960x701.jpeg",
"width": 960,
"mimeType": "image/jpeg",
"height": 701
},
"post-thumbnail": {
"file": "https://ww2.kqed.org/app/uploads/sites/35/2016/08/ObamaforKQED10-672x372.jpeg",
"width": 672,
"mimeType": "image/jpeg",
"height": 372
},
"kqedFullSize": {
"file": "https://ww2.kqed.org/app/uploads/sites/35/2016/08/ObamaforKQED10.jpeg",
"width": 1118,
"height": 816
},
"guest-author-50": {
"file": "https://ww2.kqed.org/app/uploads/sites/35/2016/08/ObamaforKQED10-50x50.jpeg",
"width": 50,
"mimeType": "image/jpeg",
"height": 50
},
"guest-author-96": {
"file": "https://ww2.kqed.org/app/uploads/sites/35/2016/08/ObamaforKQED10-96x96.jpeg",
"width": 96,
"mimeType": "image/jpeg",
"height": 96
},
"medium": {
"file": "https://ww2.kqed.org/app/uploads/sites/35/2016/08/ObamaforKQED10-800x584.jpeg",
"width": 800,
"mimeType": "image/jpeg",
"height": 584
},
"guest-author-64": {
"file": "https://ww2.kqed.org/app/uploads/sites/35/2016/08/ObamaforKQED10-64x64.jpeg",
"width": 64,
"mimeType": "image/jpeg",
"height": 64
},
"guest-author-32": {
"file": "https://ww2.kqed.org/app/uploads/sites/35/2016/08/ObamaforKQED10-32x32.jpeg",
"width": 32,
"mimeType": "image/jpeg",
"height": 32
},
"detail": {
"file": "https://ww2.kqed.org/app/uploads/sites/35/2016/08/ObamaforKQED10-150x150.jpeg",
"width": 150,
"mimeType": "image/jpeg",
"height": 150
},
"medium_large": {
"file": "https://ww2.kqed.org/app/uploads/sites/35/2016/08/ObamaforKQED10-768x561.jpeg",
"width": 768,
"mimeType": "image/jpeg",
"height": 561
},
"guest-author-128": {
"file": "https://ww2.kqed.org/app/uploads/sites/35/2016/08/ObamaforKQED10-128x128.jpeg",
"width": 128,
"mimeType": "image/jpeg",
"height": 128
}
},
"publishDate": 1472683543,
"modified": 1472683985,
"caption": "\"The challenges of conservation and combating climate change are connected -- they're linked,\" President Obama told a gathering at the 20th annual Lake Tahoe Summit.",
"description": "President Obama talks conservation and climate change at the Tahoe Summit.",
"title": "ObamaforKQED10",
"credit": "Marcus Lavergne/KUNR",
"status": "inherit",
"isLoading": false,
"fetchFailed": false
},
"science_959257": {
"type": "attachments",
"id": "science_959257",
"meta": {
"index": "attachments_1716263798",
"site": "science",
"id": "959257",
"found": true
},
"parent": 959253,
"imgSizes": {
"twentyfourteen-full-width": {
"file": "https://ww2.kqed.org/app/uploads/sites/35/2016/08/5228190088_afabd8c890_o-1038x576.jpg",
"width": 1038,
"mimeType": "image/jpeg",
"height": 576
},
"thumbnail": {
"file": "https://ww2.kqed.org/app/uploads/sites/35/2016/08/5228190088_afabd8c890_o-400x300.jpg",
"width": 400,
"mimeType": "image/jpeg",
"height": 300
},
"fd-sm": {
"file": "https://ww2.kqed.org/app/uploads/sites/35/2016/08/5228190088_afabd8c890_o-960x720.jpg",
"width": 960,
"mimeType": "image/jpeg",
"height": 720
},
"post-thumbnail": {
"file": "https://ww2.kqed.org/app/uploads/sites/35/2016/08/5228190088_afabd8c890_o-672x372.jpg",
"width": 672,
"mimeType": "image/jpeg",
"height": 372
},
"kqedFullSize": {
"file": "https://ww2.kqed.org/app/uploads/sites/35/2016/08/5228190088_afabd8c890_o.jpg",
"width": 2880,
"height": 2160
},
"large": {
"file": "https://ww2.kqed.org/app/uploads/sites/35/2016/08/5228190088_afabd8c890_o-1440x1080.jpg",
"width": 1440,
"mimeType": "image/jpeg",
"height": 1080
},
"guest-author-50": {
"file": "https://ww2.kqed.org/app/uploads/sites/35/2016/08/5228190088_afabd8c890_o-50x50.jpg",
"width": 50,
"mimeType": "image/jpeg",
"height": 50
},
"guest-author-96": {
"file": "https://ww2.kqed.org/app/uploads/sites/35/2016/08/5228190088_afabd8c890_o-96x96.jpg",
"width": 96,
"mimeType": "image/jpeg",
"height": 96
},
"medium": {
"file": "https://ww2.kqed.org/app/uploads/sites/35/2016/08/5228190088_afabd8c890_o-800x600.jpg",
"width": 800,
"mimeType": "image/jpeg",
"height": 600
},
"guest-author-64": {
"file": "https://ww2.kqed.org/app/uploads/sites/35/2016/08/5228190088_afabd8c890_o-64x64.jpg",
"width": 64,
"mimeType": "image/jpeg",
"height": 64
},
"guest-author-32": {
"file": "https://ww2.kqed.org/app/uploads/sites/35/2016/08/5228190088_afabd8c890_o-32x32.jpg",
"width": 32,
"mimeType": "image/jpeg",
"height": 32
},
"fd-lrg": {
"file": "https://ww2.kqed.org/app/uploads/sites/35/2016/08/5228190088_afabd8c890_o-1920x1440.jpg",
"width": 1920,
"mimeType": "image/jpeg",
"height": 1440
},
"fd-med": {
"file": "https://ww2.kqed.org/app/uploads/sites/35/2016/08/5228190088_afabd8c890_o-1180x885.jpg",
"width": 1180,
"mimeType": "image/jpeg",
"height": 885
},
"detail": {
"file": "https://ww2.kqed.org/app/uploads/sites/35/2016/08/5228190088_afabd8c890_o-150x150.jpg",
"width": 150,
"mimeType": "image/jpeg",
"height": 150
},
"medium_large": {
"file": "https://ww2.kqed.org/app/uploads/sites/35/2016/08/5228190088_afabd8c890_o-768x576.jpg",
"width": 768,
"mimeType": "image/jpeg",
"height": 576
},
"guest-author-128": {
"file": "https://ww2.kqed.org/app/uploads/sites/35/2016/08/5228190088_afabd8c890_o-128x128.jpg",
"width": 128,
"mimeType": "image/jpeg",
"height": 128
}
},
"publishDate": 1472669024,
"modified": 1472669211,
"caption": "Preparing a drought-friendly yard in Los Angeles.",
"description": null,
"title": "drought, xeriscape",
"credit": "\u003ca href=\"https://flic.kr/p/8XZQLq\">Steve & Michelle Gerdes\u003c/a>/Flickr",
"status": "inherit",
"isLoading": false,
"fetchFailed": false
},
"science_946592": {
"type": "attachments",
"id": "science_946592",
"meta": {
"index": "attachments_1716263798",
"site": "science",
"id": "946592",
"found": true
},
"parent": 946591,
"imgSizes": {
"thumbnail": {
"file": "https://ww2.kqed.org/app/uploads/sites/35/2016/08/Capitol-sacramento-400x225.jpg",
"width": 400,
"mimeType": "image/jpeg",
"height": 225
},
"post-thumbnail": {
"file": "https://ww2.kqed.org/app/uploads/sites/35/2016/08/Capitol-sacramento-672x372.jpg",
"width": 672,
"mimeType": "image/jpeg",
"height": 372
},
"kqedFullSize": {
"file": "https://ww2.kqed.org/app/uploads/sites/35/2016/08/Capitol-sacramento.jpg",
"width": 720,
"height": 405
},
"guest-author-50": {
"file": "https://ww2.kqed.org/app/uploads/sites/35/2016/08/Capitol-sacramento-50x50.jpg",
"width": 50,
"mimeType": "image/jpeg",
"height": 50
},
"guest-author-96": {
"file": "https://ww2.kqed.org/app/uploads/sites/35/2016/08/Capitol-sacramento-96x96.jpg",
"width": 96,
"mimeType": "image/jpeg",
"height": 96
},
"guest-author-64": {
"file": "https://ww2.kqed.org/app/uploads/sites/35/2016/08/Capitol-sacramento-64x64.jpg",
"width": 64,
"mimeType": "image/jpeg",
"height": 64
},
"detail": {
"file": "https://ww2.kqed.org/app/uploads/sites/35/2016/08/Capitol-sacramento-150x150.jpg",
"width": 150,
"mimeType": "image/jpeg",
"height": 150
},
"guest-author-32": {
"file": "https://ww2.kqed.org/app/uploads/sites/35/2016/08/Capitol-sacramento-32x32.jpg",
"width": 32,
"mimeType": "image/jpeg",
"height": 32
},
"guest-author-128": {
"file": "https://ww2.kqed.org/app/uploads/sites/35/2016/08/Capitol-sacramento-128x128.jpg",
"width": 128,
"mimeType": "image/jpeg",
"height": 128
}
},
"publishDate": 1472237695,
"modified": 1472237724,
"caption": "California State Capitol in Sacramento.\n",
"description": null,
"title": "Capitol sacramento",
"credit": "Tony Webster/flickr",
"status": "inherit",
"isLoading": false,
"fetchFailed": false
},
"science_944018": {
"type": "attachments",
"id": "science_944018",
"meta": {
"index": "attachments_1716263798",
"site": "science",
"id": "944018",
"found": true
},
"parent": 944002,
"imgSizes": {
"thumbnail": {
"file": "https://ww2.kqed.org/app/uploads/sites/35/2016/08/8_24_16_Andrea_CC_coralcoring_720_480_s_c1_c_c-400x267.jpg",
"width": 400,
"mimeType": "image/jpeg",
"height": 267
},
"post-thumbnail": {
"file": "https://ww2.kqed.org/app/uploads/sites/35/2016/08/8_24_16_Andrea_CC_coralcoring_720_480_s_c1_c_c-672x372.jpg",
"width": 672,
"mimeType": "image/jpeg",
"height": 372
},
"kqedFullSize": {
"file": "https://ww2.kqed.org/app/uploads/sites/35/2016/08/8_24_16_Andrea_CC_coralcoring_720_480_s_c1_c_c.jpg",
"width": 720,
"height": 480
},
"guest-author-50": {
"file": "https://ww2.kqed.org/app/uploads/sites/35/2016/08/8_24_16_Andrea_CC_coralcoring_720_480_s_c1_c_c-50x50.jpg",
"width": 50,
"mimeType": "image/jpeg",
"height": 50
},
"guest-author-96": {
"file": "https://ww2.kqed.org/app/uploads/sites/35/2016/08/8_24_16_Andrea_CC_coralcoring_720_480_s_c1_c_c-96x96.jpg",
"width": 96,
"mimeType": "image/jpeg",
"height": 96
},
"guest-author-64": {
"file": "https://ww2.kqed.org/app/uploads/sites/35/2016/08/8_24_16_Andrea_CC_coralcoring_720_480_s_c1_c_c-64x64.jpg",
"width": 64,
"mimeType": "image/jpeg",
"height": 64
},
"detail": {
"file": "https://ww2.kqed.org/app/uploads/sites/35/2016/08/8_24_16_Andrea_CC_coralcoring_720_480_s_c1_c_c-150x150.jpg",
"width": 150,
"mimeType": "image/jpeg",
"height": 150
},
"guest-author-32": {
"file": "https://ww2.kqed.org/app/uploads/sites/35/2016/08/8_24_16_Andrea_CC_coralcoring_720_480_s_c1_c_c-32x32.jpg",
"width": 32,
"mimeType": "image/jpeg",
"height": 32
},
"guest-author-128": {
"file": "https://ww2.kqed.org/app/uploads/sites/35/2016/08/8_24_16_Andrea_CC_coralcoring_720_480_s_c1_c_c-128x128.jpg",
"width": 128,
"mimeType": "image/jpeg",
"height": 128
}
},
"publishDate": 1472148247,
"modified": 1472148298,
"caption": "Coring at a coral reef of the northwest coast of Australia.",
"description": "Coring at a coral reef of the northwest coast of Australia.",
"title": "8_24_16_Andrea_CC_coralcoring_720_480_s_c1_c_c",
"credit": "Eric Matson/AIMS ",
"status": "inherit",
"isLoading": false,
"fetchFailed": false
},
"science_943995": {
"type": "attachments",
"id": "science_943995",
"meta": {
"index": "attachments_1716263798",
"site": "science",
"id": "943995",
"found": true
},
"parent": 943904,
"imgSizes": {
"twentyfourteen-full-width": {
"file": "https://ww2.kqed.org/app/uploads/sites/35/2016/08/Pinnacles-1038x576.jpg",
"width": 1038,
"mimeType": "image/jpeg",
"height": 576
},
"thumbnail": {
"file": "https://ww2.kqed.org/app/uploads/sites/35/2016/08/Pinnacles-400x267.jpg",
"width": 400,
"mimeType": "image/jpeg",
"height": 267
},
"fd-sm": {
"file": "https://ww2.kqed.org/app/uploads/sites/35/2016/08/Pinnacles-960x640.jpg",
"width": 960,
"mimeType": "image/jpeg",
"height": 640
},
"post-thumbnail": {
"file": "https://ww2.kqed.org/app/uploads/sites/35/2016/08/Pinnacles-672x372.jpg",
"width": 672,
"mimeType": "image/jpeg",
"height": 372
},
"kqedFullSize": {
"file": "https://ww2.kqed.org/app/uploads/sites/35/2016/08/Pinnacles.jpg",
"width": 2048,
"height": 1365
},
"large": {
"file": "https://ww2.kqed.org/app/uploads/sites/35/2016/08/Pinnacles-1440x960.jpg",
"width": 1440,
"mimeType": "image/jpeg",
"height": 960
},
"guest-author-50": {
"file": "https://ww2.kqed.org/app/uploads/sites/35/2016/08/Pinnacles-50x50.jpg",
"width": 50,
"mimeType": "image/jpeg",
"height": 50
},
"guest-author-96": {
"file": "https://ww2.kqed.org/app/uploads/sites/35/2016/08/Pinnacles-96x96.jpg",
"width": 96,
"mimeType": "image/jpeg",
"height": 96
},
"medium": {
"file": "https://ww2.kqed.org/app/uploads/sites/35/2016/08/Pinnacles-800x533.jpg",
"width": 800,
"mimeType": "image/jpeg",
"height": 533
},
"guest-author-64": {
"file": "https://ww2.kqed.org/app/uploads/sites/35/2016/08/Pinnacles-64x64.jpg",
"width": 64,
"mimeType": "image/jpeg",
"height": 64
},
"guest-author-32": {
"file": "https://ww2.kqed.org/app/uploads/sites/35/2016/08/Pinnacles-32x32.jpg",
"width": 32,
"mimeType": "image/jpeg",
"height": 32
},
"fd-lrg": {
"file": "https://ww2.kqed.org/app/uploads/sites/35/2016/08/Pinnacles-1920x1280.jpg",
"width": 1920,
"mimeType": "image/jpeg",
"height": 1280
},
"fd-med": {
"file": "https://ww2.kqed.org/app/uploads/sites/35/2016/08/Pinnacles-1180x786.jpg",
"width": 1180,
"mimeType": "image/jpeg",
"height": 786
},
"detail": {
"file": "https://ww2.kqed.org/app/uploads/sites/35/2016/08/Pinnacles-150x150.jpg",
"width": 150,
"mimeType": "image/jpeg",
"height": 150
},
"medium_large": {
"file": "https://ww2.kqed.org/app/uploads/sites/35/2016/08/Pinnacles-768x512.jpg",
"width": 768,
"mimeType": "image/jpeg",
"height": 512
},
"guest-author-128": {
"file": "https://ww2.kqed.org/app/uploads/sites/35/2016/08/Pinnacles-128x128.jpg",
"width": 128,
"mimeType": "image/jpeg",
"height": 128
}
},
"publishDate": 1472145770,
"modified": 1472145973,
"caption": "Pinnacles National Park east of the Salinas Valley in Central California. By 2100 scientists predict that summers in Pinnacles will be like summers in southeast Georgia.",
"description": null,
"title": "Pinnacles",
"credit": "David Fulmer/flickr",
"status": "inherit",
"isLoading": false,
"fetchFailed": false
},
"science_931732": {
"type": "attachments",
"id": "science_931732",
"meta": {
"index": "attachments_1716263798",
"site": "science",
"id": "931732",
"found": true
},
"parent": 931634,
"imgSizes": {
"twentyfourteen-full-width": {
"file": "https://ww2.kqed.org/app/uploads/sites/35/2016/08/28793191970_95b544c72b_k-1038x576.jpg",
"width": 1038,
"mimeType": "image/jpeg",
"height": 576
},
"thumbnail": {
"file": "https://ww2.kqed.org/app/uploads/sites/35/2016/08/28793191970_95b544c72b_k-400x300.jpg",
"width": 400,
"mimeType": "image/jpeg",
"height": 300
},
"fd-sm": {
"file": "https://ww2.kqed.org/app/uploads/sites/35/2016/08/28793191970_95b544c72b_k-960x720.jpg",
"width": 960,
"mimeType": "image/jpeg",
"height": 720
},
"post-thumbnail": {
"file": "https://ww2.kqed.org/app/uploads/sites/35/2016/08/28793191970_95b544c72b_k-672x372.jpg",
"width": 672,
"mimeType": "image/jpeg",
"height": 372
},
"kqedFullSize": {
"file": "https://ww2.kqed.org/app/uploads/sites/35/2016/08/28793191970_95b544c72b_k.jpg",
"width": 2048,
"height": 1536
},
"large": {
"file": "https://ww2.kqed.org/app/uploads/sites/35/2016/08/28793191970_95b544c72b_k-1440x1080.jpg",
"width": 1440,
"mimeType": "image/jpeg",
"height": 1080
},
"guest-author-50": {
"file": "https://ww2.kqed.org/app/uploads/sites/35/2016/08/28793191970_95b544c72b_k-50x50.jpg",
"width": 50,
"mimeType": "image/jpeg",
"height": 50
},
"guest-author-96": {
"file": "https://ww2.kqed.org/app/uploads/sites/35/2016/08/28793191970_95b544c72b_k-96x96.jpg",
"width": 96,
"mimeType": "image/jpeg",
"height": 96
},
"medium": {
"file": "https://ww2.kqed.org/app/uploads/sites/35/2016/08/28793191970_95b544c72b_k-800x600.jpg",
"width": 800,
"mimeType": "image/jpeg",
"height": 600
},
"guest-author-64": {
"file": "https://ww2.kqed.org/app/uploads/sites/35/2016/08/28793191970_95b544c72b_k-64x64.jpg",
"width": 64,
"mimeType": "image/jpeg",
"height": 64
},
"guest-author-32": {
"file": "https://ww2.kqed.org/app/uploads/sites/35/2016/08/28793191970_95b544c72b_k-32x32.jpg",
"width": 32,
"mimeType": "image/jpeg",
"height": 32
},
"fd-lrg": {
"file": "https://ww2.kqed.org/app/uploads/sites/35/2016/08/28793191970_95b544c72b_k-1920x1440.jpg",
"width": 1920,
"mimeType": "image/jpeg",
"height": 1440
},
"fd-med": {
"file": "https://ww2.kqed.org/app/uploads/sites/35/2016/08/28793191970_95b544c72b_k-1180x885.jpg",
"width": 1180,
"mimeType": "image/jpeg",
"height": 885
},
"detail": {
"file": "https://ww2.kqed.org/app/uploads/sites/35/2016/08/28793191970_95b544c72b_k-150x150.jpg",
"width": 150,
"mimeType": "image/jpeg",
"height": 150
},
"medium_large": {
"file": "https://ww2.kqed.org/app/uploads/sites/35/2016/08/28793191970_95b544c72b_k-768x576.jpg",
"width": 768,
"mimeType": "image/jpeg",
"height": 576
},
"guest-author-128": {
"file": "https://ww2.kqed.org/app/uploads/sites/35/2016/08/28793191970_95b544c72b_k-128x128.jpg",
"width": 128,
"mimeType": "image/jpeg",
"height": 128
}
},
"publishDate": 1471643916,
"modified": 1471643944,
"caption": "Members of a Los Angeles Fire Department Strike Team read smoke behavior as they prepare to strategically reengage the Blue Cut wildfire, which began on August 16, 2016 in the Cajon Pass area of the San Bernardino National Forest.",
"description": null,
"title": "28793191970_95b544c72b_k",
"credit": "LAFD/flickr",
"status": "inherit",
"isLoading": false,
"fetchFailed": false
},
"science_929281": {
"type": "attachments",
"id": "science_929281",
"meta": {
"index": "attachments_1716263798",
"site": "science",
"id": "929281",
"found": true
},
"parent": 929276,
"imgSizes": {
"thumbnail": {
"file": "https://ww2.kqed.org/app/uploads/sites/35/2016/08/california_capitol-400x226.jpg",
"width": 400,
"mimeType": "image/jpeg",
"height": 226
},
"post-thumbnail": {
"file": "https://ww2.kqed.org/app/uploads/sites/35/2016/08/california_capitol-672x372.jpg",
"width": 672,
"mimeType": "image/jpeg",
"height": 372
},
"kqedFullSize": {
"file": "https://ww2.kqed.org/app/uploads/sites/35/2016/08/california_capitol.jpg",
"width": 720,
"height": 406
},
"guest-author-50": {
"file": "https://ww2.kqed.org/app/uploads/sites/35/2016/08/california_capitol-50x50.jpg",
"width": 50,
"mimeType": "image/jpeg",
"height": 50
},
"guest-author-96": {
"file": "https://ww2.kqed.org/app/uploads/sites/35/2016/08/california_capitol-96x96.jpg",
"width": 96,
"mimeType": "image/jpeg",
"height": 96
},
"guest-author-64": {
"file": "https://ww2.kqed.org/app/uploads/sites/35/2016/08/california_capitol-64x64.jpg",
"width": 64,
"mimeType": "image/jpeg",
"height": 64
},
"detail": {
"file": "https://ww2.kqed.org/app/uploads/sites/35/2016/08/california_capitol-150x150.jpg",
"width": 150,
"mimeType": "image/jpeg",
"height": 150
},
"guest-author-32": {
"file": "https://ww2.kqed.org/app/uploads/sites/35/2016/08/california_capitol-32x32.jpg",
"width": 32,
"mimeType": "image/jpeg",
"height": 32
},
"guest-author-128": {
"file": "https://ww2.kqed.org/app/uploads/sites/35/2016/08/california_capitol-128x128.jpg",
"width": 128,
"mimeType": "image/jpeg",
"height": 128
}
},
"publishDate": 1471546137,
"modified": 1471546153,
"caption": "California State Capitol in Sacramento.\n",
"description": null,
"title": "california_capitol",
"credit": "Tiocfaidh ár lá 1916/Flickr",
"status": "inherit",
"isLoading": false,
"fetchFailed": false
},
"science_929167": {
"type": "attachments",
"id": "science_929167",
"meta": {
"index": "attachments_1716263798",
"site": "science",
"id": "929167",
"found": true
},
"parent": 929164,
"imgSizes": {
"twentyfourteen-full-width": {
"file": "https://ww2.kqed.org/app/uploads/sites/35/2016/08/gettyimages-499278260_custom-251a1e424273effc1057dc0938b2558a0ee8e962-1-1038x576.jpg",
"width": 1038,
"mimeType": "image/jpeg",
"height": 576
},
"thumbnail": {
"file": "https://ww2.kqed.org/app/uploads/sites/35/2016/08/gettyimages-499278260_custom-251a1e424273effc1057dc0938b2558a0ee8e962-1-400x284.jpg",
"width": 400,
"mimeType": "image/jpeg",
"height": 284
},
"fd-sm": {
"file": "https://ww2.kqed.org/app/uploads/sites/35/2016/08/gettyimages-499278260_custom-251a1e424273effc1057dc0938b2558a0ee8e962-1-960x681.jpg",
"width": 960,
"mimeType": "image/jpeg",
"height": 681
},
"post-thumbnail": {
"file": "https://ww2.kqed.org/app/uploads/sites/35/2016/08/gettyimages-499278260_custom-251a1e424273effc1057dc0938b2558a0ee8e962-1-672x372.jpg",
"width": 672,
"mimeType": "image/jpeg",
"height": 372
},
"kqedFullSize": {
"file": "https://ww2.kqed.org/app/uploads/sites/35/2016/08/gettyimages-499278260_custom-251a1e424273effc1057dc0938b2558a0ee8e962-1.jpg",
"width": 3004,
"height": 2131
},
"large": {
"file": "https://ww2.kqed.org/app/uploads/sites/35/2016/08/gettyimages-499278260_custom-251a1e424273effc1057dc0938b2558a0ee8e962-1-1440x1022.jpg",
"width": 1440,
"mimeType": "image/jpeg",
"height": 1022
},
"guest-author-50": {
"file": "https://ww2.kqed.org/app/uploads/sites/35/2016/08/gettyimages-499278260_custom-251a1e424273effc1057dc0938b2558a0ee8e962-1-50x50.jpg",
"width": 50,
"mimeType": "image/jpeg",
"height": 50
},
"guest-author-96": {
"file": "https://ww2.kqed.org/app/uploads/sites/35/2016/08/gettyimages-499278260_custom-251a1e424273effc1057dc0938b2558a0ee8e962-1-96x96.jpg",
"width": 96,
"mimeType": "image/jpeg",
"height": 96
},
"medium": {
"file": "https://ww2.kqed.org/app/uploads/sites/35/2016/08/gettyimages-499278260_custom-251a1e424273effc1057dc0938b2558a0ee8e962-1-800x568.jpg",
"width": 800,
"mimeType": "image/jpeg",
"height": 568
},
"guest-author-64": {
"file": "https://ww2.kqed.org/app/uploads/sites/35/2016/08/gettyimages-499278260_custom-251a1e424273effc1057dc0938b2558a0ee8e962-1-64x64.jpg",
"width": 64,
"mimeType": "image/jpeg",
"height": 64
},
"guest-author-32": {
"file": "https://ww2.kqed.org/app/uploads/sites/35/2016/08/gettyimages-499278260_custom-251a1e424273effc1057dc0938b2558a0ee8e962-1-32x32.jpg",
"width": 32,
"mimeType": "image/jpeg",
"height": 32
},
"fd-lrg": {
"file": "https://ww2.kqed.org/app/uploads/sites/35/2016/08/gettyimages-499278260_custom-251a1e424273effc1057dc0938b2558a0ee8e962-1-1920x1362.jpg",
"width": 1920,
"mimeType": "image/jpeg",
"height": 1362
},
"fd-med": {
"file": "https://ww2.kqed.org/app/uploads/sites/35/2016/08/gettyimages-499278260_custom-251a1e424273effc1057dc0938b2558a0ee8e962-1-1180x837.jpg",
"width": 1180,
"mimeType": "image/jpeg",
"height": 837
},
"detail": {
"file": "https://ww2.kqed.org/app/uploads/sites/35/2016/08/gettyimages-499278260_custom-251a1e424273effc1057dc0938b2558a0ee8e962-1-150x150.jpg",
"width": 150,
"mimeType": "image/jpeg",
"height": 150
},
"medium_large": {
"file": "https://ww2.kqed.org/app/uploads/sites/35/2016/08/gettyimages-499278260_custom-251a1e424273effc1057dc0938b2558a0ee8e962-1-768x545.jpg",
"width": 768,
"mimeType": "image/jpeg",
"height": 545
},
"guest-author-128": {
"file": "https://ww2.kqed.org/app/uploads/sites/35/2016/08/gettyimages-499278260_custom-251a1e424273effc1057dc0938b2558a0ee8e962-1-128x128.jpg",
"width": 128,
"mimeType": "image/jpeg",
"height": 128
}
},
"publishDate": 1471541427,
"modified": 1471542121,
"caption": "A conference attendee looks at a projection of Earth on the opening day of the COP 21 United Nations conference on climate change, in November on the outskirts of Paris.",
"description": null,
"title": "A conference attendee looks at a projection of Earth on the opening day of the COP 21 United Nations conference on climate change, in November on the outskirts of Paris.",
"credit": "Alain Jocard/AFP/Getty Images",
"status": "inherit",
"isLoading": false,
"fetchFailed": false
},
"science_909583": {
"type": "attachments",
"id": "science_909583",
"meta": {
"index": "attachments_1716263798",
"site": "science",
"id": "909583",
"found": true
},
"parent": 907490,
"imgSizes": {
"thumbnail": {
"file": "https://ww2.kqed.org/app/uploads/sites/35/2016/08/NOAA_map_Fix-e1470759499889-400x216.jpg",
"width": 400,
"mimeType": "image/jpeg",
"height": 216
},
"post-thumbnail": {
"file": "https://ww2.kqed.org/app/uploads/sites/35/2016/08/NOAA_map_Fix-650x372.jpg",
"width": 650,
"mimeType": "image/jpeg",
"height": 372
},
"kqedFullSize": {
"file": "https://ww2.kqed.org/app/uploads/sites/35/2016/08/NOAA_map_Fix-e1470759499889.jpg",
"width": 650,
"height": 351
},
"guest-author-50": {
"file": "https://ww2.kqed.org/app/uploads/sites/35/2016/08/NOAA_map_Fix-e1470759499889-50x50.jpg",
"width": 50,
"mimeType": "image/jpeg",
"height": 50
},
"guest-author-96": {
"file": "https://ww2.kqed.org/app/uploads/sites/35/2016/08/NOAA_map_Fix-e1470759499889-96x96.jpg",
"width": 96,
"mimeType": "image/jpeg",
"height": 96
},
"guest-author-64": {
"file": "https://ww2.kqed.org/app/uploads/sites/35/2016/08/NOAA_map_Fix-e1470759499889-64x64.jpg",
"width": 64,
"mimeType": "image/jpeg",
"height": 64
},
"detail": {
"file": "https://ww2.kqed.org/app/uploads/sites/35/2016/08/NOAA_map_Fix-e1470759499889-150x150.jpg",
"width": 150,
"mimeType": "image/jpeg",
"height": 150
},
"guest-author-32": {
"file": "https://ww2.kqed.org/app/uploads/sites/35/2016/08/NOAA_map_Fix-e1470759499889-32x32.jpg",
"width": 32,
"mimeType": "image/jpeg",
"height": 32
},
"guest-author-128": {
"file": "https://ww2.kqed.org/app/uploads/sites/35/2016/08/NOAA_map_Fix-e1470759499889-128x128.jpg",
"width": 128,
"mimeType": "image/jpeg",
"height": 128
}
},
"publishDate": 1470759414,
"modified": 1470760047,
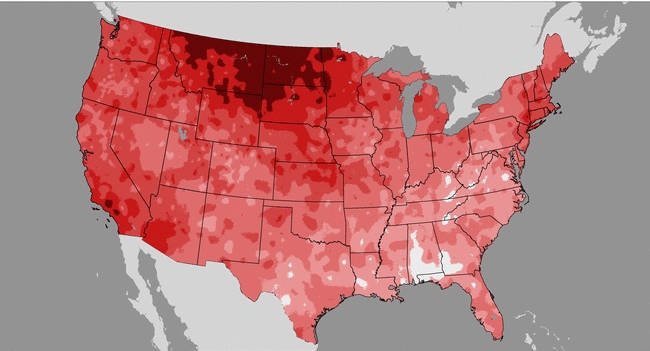
"caption": "A map of the U.S. showing above average temperatures from January through July 2016.\n",
"description": null,
"title": "NOAA_map_Fix",
"credit": "NOAA",
"status": "inherit",
"isLoading": false,
"fetchFailed": false
},
"science_899863": {
"type": "attachments",
"id": "science_899863",
"meta": {
"index": "attachments_1716263798",
"site": "science",
"id": "899863",
"found": true
},
"parent": 899859,
"imgSizes": {
"thumbnail": {
"file": "https://ww2.kqed.org/app/uploads/sites/35/2016/08/mosquito-400x225.jpg",
"width": 400,
"mimeType": "image/jpeg",
"height": 225
},
"post-thumbnail": {
"file": "https://ww2.kqed.org/app/uploads/sites/35/2016/08/mosquito-672x372.jpg",
"width": 672,
"mimeType": "image/jpeg",
"height": 372
},
"kqedFullSize": {
"file": "https://ww2.kqed.org/app/uploads/sites/35/2016/08/mosquito.jpg",
"width": 720,
"height": 405
},
"guest-author-50": {
"file": "https://ww2.kqed.org/app/uploads/sites/35/2016/08/mosquito-50x50.jpg",
"width": 50,
"mimeType": "image/jpeg",
"height": 50
},
"guest-author-96": {
"file": "https://ww2.kqed.org/app/uploads/sites/35/2016/08/mosquito-96x96.jpg",
"width": 96,
"mimeType": "image/jpeg",
"height": 96
},
"guest-author-64": {
"file": "https://ww2.kqed.org/app/uploads/sites/35/2016/08/mosquito-64x64.jpg",
"width": 64,
"mimeType": "image/jpeg",
"height": 64
},
"detail": {
"file": "https://ww2.kqed.org/app/uploads/sites/35/2016/08/mosquito-150x150.jpg",
"width": 150,
"mimeType": "image/jpeg",
"height": 150
},
"guest-author-32": {
"file": "https://ww2.kqed.org/app/uploads/sites/35/2016/08/mosquito-32x32.jpg",
"width": 32,
"mimeType": "image/jpeg",
"height": 32
},
"guest-author-128": {
"file": "https://ww2.kqed.org/app/uploads/sites/35/2016/08/mosquito-128x128.jpg",
"width": 128,
"mimeType": "image/jpeg",
"height": 128
}
},
"publishDate": 1470410584,
"modified": 1470410609,
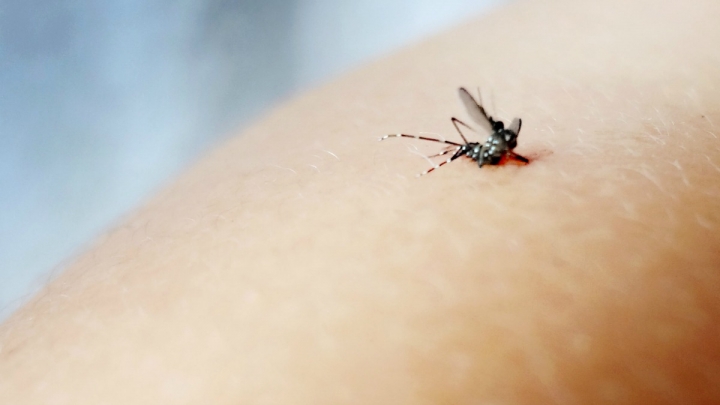
"caption": "A squashed Aedes Aegypti, which can spread Zika and other diseases.",
"description": null,
"title": "mosquito",
"credit": "Laura Domínguez/flickr",
"status": "inherit",
"isLoading": false,
"fetchFailed": false
},
"science_898106": {
"type": "attachments",
"id": "science_898106",
"meta": {
"index": "attachments_1716263798",
"site": "science",
"id": "898106",
"found": true
},
"parent": 880923,
"imgSizes": {
"twentyfourteen-full-width": {
"file": "https://ww2.kqed.org/app/uploads/sites/35/2016/08/Enhanced-ACCESS-Research-Cruise-Pix-094-double-blue-whales-and-Farallones-2-1038x576.jpg",
"width": 1038,
"mimeType": "image/jpeg",
"height": 576
},
"thumbnail": {
"file": "https://ww2.kqed.org/app/uploads/sites/35/2016/08/Enhanced-ACCESS-Research-Cruise-Pix-094-double-blue-whales-and-Farallones-2-400x225.jpg",
"width": 400,
"mimeType": "image/jpeg",
"height": 225
},
"fd-sm": {
"file": "https://ww2.kqed.org/app/uploads/sites/35/2016/08/Enhanced-ACCESS-Research-Cruise-Pix-094-double-blue-whales-and-Farallones-2-960x540.jpg",
"width": 960,
"mimeType": "image/jpeg",
"height": 540
},
"post-thumbnail": {
"file": "https://ww2.kqed.org/app/uploads/sites/35/2016/08/Enhanced-ACCESS-Research-Cruise-Pix-094-double-blue-whales-and-Farallones-2-672x372.jpg",
"width": 672,
"mimeType": "image/jpeg",
"height": 372
},
"kqedFullSize": {
"file": "https://ww2.kqed.org/app/uploads/sites/35/2016/08/Enhanced-ACCESS-Research-Cruise-Pix-094-double-blue-whales-and-Farallones-2.jpg",
"width": 2730,
"height": 1536
},
"large": {
"file": "https://ww2.kqed.org/app/uploads/sites/35/2016/08/Enhanced-ACCESS-Research-Cruise-Pix-094-double-blue-whales-and-Farallones-2-1440x810.jpg",
"width": 1440,
"mimeType": "image/jpeg",
"height": 810
},
"guest-author-50": {
"file": "https://ww2.kqed.org/app/uploads/sites/35/2016/08/Enhanced-ACCESS-Research-Cruise-Pix-094-double-blue-whales-and-Farallones-2-50x50.jpg",
"width": 50,
"mimeType": "image/jpeg",
"height": 50
},
"guest-author-96": {
"file": "https://ww2.kqed.org/app/uploads/sites/35/2016/08/Enhanced-ACCESS-Research-Cruise-Pix-094-double-blue-whales-and-Farallones-2-96x96.jpg",
"width": 96,
"mimeType": "image/jpeg",
"height": 96
},
"medium": {
"file": "https://ww2.kqed.org/app/uploads/sites/35/2016/08/Enhanced-ACCESS-Research-Cruise-Pix-094-double-blue-whales-and-Farallones-2-800x450.jpg",
"width": 800,
"mimeType": "image/jpeg",
"height": 450
},
"guest-author-64": {
"file": "https://ww2.kqed.org/app/uploads/sites/35/2016/08/Enhanced-ACCESS-Research-Cruise-Pix-094-double-blue-whales-and-Farallones-2-64x64.jpg",
"width": 64,
"mimeType": "image/jpeg",
"height": 64
},
"guest-author-32": {
"file": "https://ww2.kqed.org/app/uploads/sites/35/2016/08/Enhanced-ACCESS-Research-Cruise-Pix-094-double-blue-whales-and-Farallones-2-32x32.jpg",
"width": 32,
"mimeType": "image/jpeg",
"height": 32
},
"fd-lrg": {
"file": "https://ww2.kqed.org/app/uploads/sites/35/2016/08/Enhanced-ACCESS-Research-Cruise-Pix-094-double-blue-whales-and-Farallones-2-1920x1080.jpg",
"width": 1920,
"mimeType": "image/jpeg",
"height": 1080
},
"fd-med": {
"file": "https://ww2.kqed.org/app/uploads/sites/35/2016/08/Enhanced-ACCESS-Research-Cruise-Pix-094-double-blue-whales-and-Farallones-2-1180x664.jpg",
"width": 1180,
"mimeType": "image/jpeg",
"height": 664
},
"detail": {
"file": "https://ww2.kqed.org/app/uploads/sites/35/2016/08/Enhanced-ACCESS-Research-Cruise-Pix-094-double-blue-whales-and-Farallones-2-150x150.jpg",
"width": 150,
"mimeType": "image/jpeg",
"height": 150
},
"medium_large": {
"file": "https://ww2.kqed.org/app/uploads/sites/35/2016/08/Enhanced-ACCESS-Research-Cruise-Pix-094-double-blue-whales-and-Farallones-2-768x432.jpg",
"width": 768,
"mimeType": "image/jpeg",
"height": 432
},
"guest-author-128": {
"file": "https://ww2.kqed.org/app/uploads/sites/35/2016/08/Enhanced-ACCESS-Research-Cruise-Pix-094-double-blue-whales-and-Farallones-2-128x128.jpg",
"width": 128,
"mimeType": "image/jpeg",
"height": 128
}
},
"publishDate": 1470346790,
"modified": 1470346850,
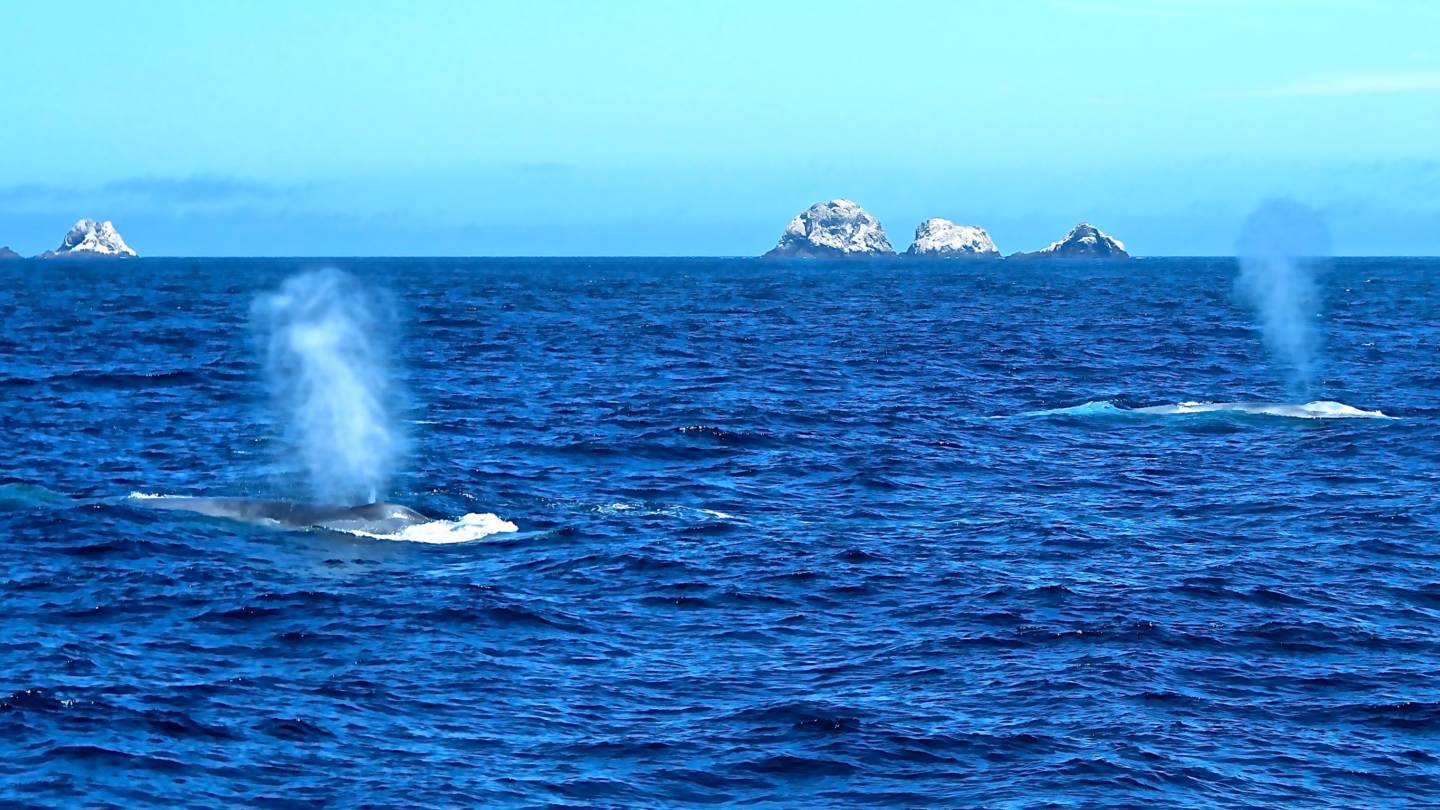
"caption": "Blue whales spouting in front of the Farallon Islands off the North Central California Coast. Found 30 miles out from the San Francisco Bay, these islands are a hotspot for biodiversity.",
"description": null,
"title": "Enhanced - ACCESS Research Cruise Pix 094 - double blue whales and Farallones 2",
"credit": "Aurora MacRae-Crerar/KQED",
"status": "inherit",
"isLoading": false,
"fetchFailed": false
},
"science_893469": {
"type": "attachments",
"id": "science_893469",
"meta": {
"index": "attachments_1716263798",
"site": "science",
"id": "893469",
"found": true
},
"parent": 893464,
"imgSizes": {
"twentyfourteen-full-width": {
"file": "https://ww2.kqed.org/app/uploads/sites/35/2016/08/14303705100_08422e995f_k-1038x576.jpg",
"width": 1038,
"mimeType": "image/jpeg",
"height": 576
},
"thumbnail": {
"file": "https://ww2.kqed.org/app/uploads/sites/35/2016/08/14303705100_08422e995f_k-400x224.jpg",
"width": 400,
"mimeType": "image/jpeg",
"height": 224
},
"fd-sm": {
"file": "https://ww2.kqed.org/app/uploads/sites/35/2016/08/14303705100_08422e995f_k-960x539.jpg",
"width": 960,
"mimeType": "image/jpeg",
"height": 539
},
"post-thumbnail": {
"file": "https://ww2.kqed.org/app/uploads/sites/35/2016/08/14303705100_08422e995f_k-672x372.jpg",
"width": 672,
"mimeType": "image/jpeg",
"height": 372
},
"kqedFullSize": {
"file": "https://ww2.kqed.org/app/uploads/sites/35/2016/08/14303705100_08422e995f_k.jpg",
"width": 2048,
"height": 1149
},
"large": {
"file": "https://ww2.kqed.org/app/uploads/sites/35/2016/08/14303705100_08422e995f_k-1440x808.jpg",
"width": 1440,
"mimeType": "image/jpeg",
"height": 808
},
"guest-author-50": {
"file": "https://ww2.kqed.org/app/uploads/sites/35/2016/08/14303705100_08422e995f_k-50x50.jpg",
"width": 50,
"mimeType": "image/jpeg",
"height": 50
},
"guest-author-96": {
"file": "https://ww2.kqed.org/app/uploads/sites/35/2016/08/14303705100_08422e995f_k-96x96.jpg",
"width": 96,
"mimeType": "image/jpeg",
"height": 96
},
"medium": {
"file": "https://ww2.kqed.org/app/uploads/sites/35/2016/08/14303705100_08422e995f_k-800x449.jpg",
"width": 800,
"mimeType": "image/jpeg",
"height": 449
},
"guest-author-64": {
"file": "https://ww2.kqed.org/app/uploads/sites/35/2016/08/14303705100_08422e995f_k-64x64.jpg",
"width": 64,
"mimeType": "image/jpeg",
"height": 64
},
"guest-author-32": {
"file": "https://ww2.kqed.org/app/uploads/sites/35/2016/08/14303705100_08422e995f_k-32x32.jpg",
"width": 32,
"mimeType": "image/jpeg",
"height": 32
},
"fd-lrg": {
"file": "https://ww2.kqed.org/app/uploads/sites/35/2016/08/14303705100_08422e995f_k-1920x1077.jpg",
"width": 1920,
"mimeType": "image/jpeg",
"height": 1077
},
"fd-med": {
"file": "https://ww2.kqed.org/app/uploads/sites/35/2016/08/14303705100_08422e995f_k-1180x662.jpg",
"width": 1180,
"mimeType": "image/jpeg",
"height": 662
},
"detail": {
"file": "https://ww2.kqed.org/app/uploads/sites/35/2016/08/14303705100_08422e995f_k-150x150.jpg",
"width": 150,
"mimeType": "image/jpeg",
"height": 150
},
"medium_large": {
"file": "https://ww2.kqed.org/app/uploads/sites/35/2016/08/14303705100_08422e995f_k-768x431.jpg",
"width": 768,
"mimeType": "image/jpeg",
"height": 431
},
"guest-author-128": {
"file": "https://ww2.kqed.org/app/uploads/sites/35/2016/08/14303705100_08422e995f_k-128x128.jpg",
"width": 128,
"mimeType": "image/jpeg",
"height": 128
}
},
"publishDate": 1470173789,
"modified": 1470182272,
"caption": "Sand dunes near Stovepipe Wells in Death Valley.",
"description": null,
"title": "14303705100_08422e995f_k",
"credit": "\u003ca href=\"https://www.flickr.com/photos/86755183@N04/14303705100/in/photolist-nMYecb-fbzyqA-7mS7fB-qcriFF-cYAZE9-dW5evq-jL3fbP-baiY6t-jL1QgB-jL3F16-dW5fMG-eELmzb-jL2914-vDP8q-dY73ik-7dhAvy-5AV2rQ-dW5bWq-jL3Lvf-5hQsSK-dY72W2-6Z8Ptu-6Z4Pi2-dW5d2f-5hQA7r-ezzKgu-qgCbiR-2CrCdw-4KETSE-ekbEPM-5NZvW4-pxTkpv-dQrRfg-3qjyGN-evHbEE-bk3jrR-MpnFU-dVGWUD-cWBhTw-c6zy7f-diGsKV-aEVh8J-csKz31-nCsyiG-biyuVF-rgGVGb-avHsTL-eQWf7C-6QJJ6z-cdYuSE/\" target=\"_blank\">Fred Moore/flickr\u003c/a>",
"status": "inherit",
"isLoading": false,
"fetchFailed": false
}
},
"audioPlayerReducer": {
"postId": "stream_live",
"isPaused": true,
"isPlaying": false,
"pfsActive": false,
"pledgeModalIsOpen": true,
"playerDrawerIsOpen": false,
"liveAudioPlayStartedAt": 0,
"liveAudioPlayContext": ""
},
"authorsReducer": {
"byline_science_959253": {
"type": "authors",
"id": "byline_science_959253",
"meta": {
"override": true
},
"slug": "byline_science_959253",
"name": "\u003cstrong>John Upton\u003cbr>Climate Central\u003c/strong>",
"isLoading": false
},
"byline_science_946591": {
"type": "authors",
"id": "byline_science_946591",
"meta": {
"override": true
},
"slug": "byline_science_946591",
"name": "John Upton\u003c/br> Climate Central",
"isLoading": false
},
"byline_science_944002": {
"type": "authors",
"id": "byline_science_944002",
"meta": {
"override": true
},
"slug": "byline_science_944002",
"name": "Andrea Thompson\u003c/br>Climate Central",
"isLoading": false
},
"byline_science_943904": {
"type": "authors",
"id": "byline_science_943904",
"meta": {
"override": true
},
"slug": "byline_science_943904",
"name": "Brian Kahn\u003c/br>Climate Central",
"isLoading": false
},
"byline_science_931634": {
"type": "authors",
"id": "byline_science_931634",
"meta": {
"override": true
},
"slug": "byline_science_931634",
"name": "John Upton\u003c/br>Climate Central",
"isLoading": false
},
"byline_science_929276": {
"type": "authors",
"id": "byline_science_929276",
"meta": {
"override": true
},
"slug": "byline_science_929276",
"name": "John Upton\u003c/br>Climate Central",
"isLoading": false
},
"byline_science_929164": {
"type": "authors",
"id": "byline_science_929164",
"meta": {
"override": true
},
"slug": "byline_science_929164",
"name": "Jennifer Ludden\u003c/br>NPR",
"isLoading": false
},
"byline_science_907490": {
"type": "authors",
"id": "byline_science_907490",
"meta": {
"override": true
},
"slug": "byline_science_907490",
"name": "Andrea Thompson\u003c/br>Climate Central",
"isLoading": false
},
"byline_science_899859": {
"type": "authors",
"id": "byline_science_899859",
"meta": {
"override": true
},
"slug": "byline_science_899859",
"name": "John Upton\u003c/br>Climate Central",
"isLoading": false
},
"byline_science_893464": {
"type": "authors",
"id": "byline_science_893464",
"meta": {
"override": true
},
"slug": "byline_science_893464",
"name": "Andrea Thompson\u003c/br>Climate Central",
"isLoading": false
},
"lindseyhoshaw": {
"type": "authors",
"id": "5432",
"meta": {
"index": "authors_1716337520",
"id": "5432",
"found": true
},
"name": "Lindsey Hoshaw",
"firstName": "Lindsey",
"lastName": "Hoshaw",
"slug": "lindseyhoshaw",
"email": "lhoshaw@kqed.org",
"display_author_email": false,
"staff_mastheads": [],
"title": "KQED Contributor",
"bio": "Lindsey Hoshaw is a former interactive producer for KQED Science. Before joining KQED, Lindsey was a science correspondent for The New York Times, The Boston Globe, Forbes and Scientific American. On Twitter @lindseyhoshaw",
"avatar": "https://secure.gravatar.com/avatar/274b07694c998eaa8f26cfabaa941186?s=600&d=mm&r=g",
"twitter": "lindseyhoshaw",
"facebook": "lindsey.hoshaw.9",
"instagram": null,
"linkedin": null,
"sites": [
{
"site": "arts",
"roles": [
"author"
]
},
{
"site": "news",
"roles": [
"subscriber"
]
},
{
"site": "futureofyou",
"roles": [
"editor"
]
},
{
"site": "bayareabites",
"roles": [
"contributor"
]
},
{
"site": "stateofhealth",
"roles": [
"author"
]
},
{
"site": "science",
"roles": [
"edit_theme_options",
"subscriber"
]
},
{
"site": "quest",
"roles": [
"edit_post_subscriptions",
"edit_usergroups",
"unfiltered_html",
"unfiltered_upload",
"leadcoordinator",
"editor"
]
},
{
"site": "food",
"roles": []
}
],
"headData": {
"title": "Lindsey Hoshaw | KQED",
"description": "KQED Contributor",
"ogImgSrc": "https://secure.gravatar.com/avatar/274b07694c998eaa8f26cfabaa941186?s=600&d=mm&r=g",
"twImgSrc": "https://secure.gravatar.com/avatar/274b07694c998eaa8f26cfabaa941186?s=600&d=mm&r=g"
},
"isLoading": false,
"link": "/author/lindseyhoshaw"
},
"amacraecrerar": {
"type": "authors",
"id": "11253",
"meta": {
"index": "authors_1716337520",
"id": "11253",
"found": true
},
"name": "Aurora MacRae-Crerar",
"firstName": "Aurora",
"lastName": "MacRae-Crerar",
"slug": "amacraecrerar",
"email": "amacraecrerar@kqed.org",
"display_author_email": false,
"staff_mastheads": [],
"title": "KQED Contributor",
"bio": "Aurora MacRae-Crerar is delighted to join the KQED Science team as a 2016 AAAS Mass Media Fellow. She is motivated by the desire to understand how small things cause big change--whether that is microbes and their impact on global warming or individual human efforts and their collective power for societal change. She holds a PhD in Biology from the University of Pennsylvania.",
"avatar": "https://secure.gravatar.com/avatar/80522a004aecda3fa75b7dc343270223a09b229d9f820a03dc855618f4f95d06?s=600&d=blank&r=g",
"twitter": null,
"bluesky": null,
"facebook": null,
"instagram": null,
"linkedin": null,
"sites": [
{
"site": "futureofyou",
"roles": [
"subscriber"
]
},
{
"site": "science",
"roles": [
"subscriber"
]
}
],
"headData": {
"title": "Aurora MacRae-Crerar | KQED",
"description": "KQED Contributor",
"ogImgSrc": "https://secure.gravatar.com/avatar/80522a004aecda3fa75b7dc343270223a09b229d9f820a03dc855618f4f95d06?s=600&d=blank&r=g",
"twImgSrc": "https://secure.gravatar.com/avatar/80522a004aecda3fa75b7dc343270223a09b229d9f820a03dc855618f4f95d06?s=600&d=blank&r=g"
},
"isLoading": false,
"link": "/author/amacraecrerar"
}
},
"pagesReducer": {
"science_category_climate": {
"type": "terms",
"id": "science_31",
"meta": {
"index": "terms_1716263798",
"site": "science",
"id": "31",
"score": 11.06203
},
"featImg": null,
"name": "Climate",
"description": null,
"taxonomy": "category",
"headData": {
"twImgId": null,
"twTitle": null,
"ogTitle": null,
"ogImgId": null,
"twDescription": null,
"description": null,
"title": "Climate Archives | KQED Science",
"ogDescription": null
},
"ttid": 33,
"slug": "climate",
"isLoading": false,
"title": "Climate",
"pageMeta": {
"site": "science",
"WpPageTemplate": "page-topic-editorial",
"currentPage": 97
},
"blocks": [
{
"blockName": "kqed/post-list",
"attrs": {
"layout": "cardArticle2",
"query": "posts/science?category=climate",
"seeMore": false,
"paginated": true,
"page": 97
}
},
{
"blockName": "kqed/ad"
}
]
}
},
"pfsSessionReducer": {},
"postsReducer": {
"stream_live": {
"type": "live",
"id": "stream_live",
"audioUrl": "https://streams.kqed.org/kqedradio",
"title": "Live Stream",
"excerpt": "Live Stream information currently unavailable.",
"link": "/radio",
"featImg": "",
"label": {
"name": "KQED Live",
"link": "/"
}
},
"stream_kqedNewscast": {
"type": "posts",
"id": "stream_kqedNewscast",
"audioUrl": "https://www.kqed.org/.stream/anon/radio/RDnews/newscast.mp3?_=1",
"title": "KQED Newscast",
"featImg": "",
"label": {
"name": "88.5 FM",
"link": "/"
}
},
"science_958786": {
"type": "posts",
"id": "science_958786",
"meta": {
"index": "posts_1716263798",
"site": "science",
"id": "958786",
"score": null,
"sort": [
1472684179000
]
},
"parent": 0,
"labelTerm": {
"site": "science"
},
"blocks": [],
"publishDate": 1472684179,
"format": "standard",
"title": "In Tahoe, Obama Underscores Climate Threats, Touts Conservation Funding",
"headTitle": "In Tahoe, Obama Underscores Climate Threats, Touts Conservation Funding | KQED",
"content": "\u003cp>President Obama made his first-ever visit to Lake Tahoe on Wednesday to stress the importance of conservation efforts for the lake and the nation at large in the face of climate change.\u003c/p>\n\u003cp>[soundcloud url=”https://api.soundcloud.com/tracks/280937235″ params=”color=ff5500&auto_play=false&hide_related=false&show_comments=true&show_user=true&show_reposts=false” width=”100%” height=”166″ iframe=”true” /]\u003c/p>\n\u003cp>“The challenges of conservation and combating climate change are connected — they’re linked,” Obama told a gathering at the 20th annual \u003ca href=\"http://tahoesouth.com/events/annual-lake-tahoe-summit/\" target=\"_blank\" rel=\"noopener\">Lake Tahoe Summit\u003c/a>, which brings together political leaders and scientists to hash out major environmental issues facing the lake. Impacts from the changing climate, runoff, erosion, wildfires, and invasive species have all threatened Lake Tahoe’s legendary clarity.\u003c/p>\n\u003cp>“Just as this space is sacred to Native Americans, it should be sacred to all Americans,” he told the crowd.\u003c/p>\n\u003cp>“That’s why we’re here, to protect this special, pristine place, to keep these waters crystal clear, the keep the air as pure as the heavens,” said Obama.\u003c/p>\n\u003cp>[ad fullwidth]\u003c/p>\n\u003cp>“This is really nice,” said the president with seemingly genuine delight, after laying eyes on the Tahoe Basin for the first time. “I will be coming here more often.”\u003c/p>\n\u003cp>Obama’s admiration for the scenery served to underscore the risks he outlined that climate change and the drought pose to the region.\u003c/p>\n\u003cp>“A single wildfire in a dangerously flammable Lake Tahoe Basin could cause enough erosion to erase decades of progress when it comes to water quality,” says Obama. “A changing climate threatens even the best conservation efforts.”\u003c/p>\n\u003cfigure id=\"attachment_1512529\" class=\"wp-caption alignright\" style=\"max-width: 1632px\">\u003cimg loading=\"lazy\" decoding=\"async\" class=\"size-full wp-image-1512529\" src=\"https://ww2.kqed.org/science/wp-content/uploads/sites/35/2017/03/Lake_Tahoe.jpg\" alt=\"Lake Tahoe just before sunrise.\" width=\"1632\" height=\"1224\" srcset=\"https://cdn.kqed.org/wp-content/uploads/sites/35/2017/03/Lake_Tahoe.jpg 1632w, https://cdn.kqed.org/wp-content/uploads/sites/35/2017/03/Lake_Tahoe-160x120.jpg 160w, https://cdn.kqed.org/wp-content/uploads/sites/35/2017/03/Lake_Tahoe-800x600.jpg 800w, https://cdn.kqed.org/wp-content/uploads/sites/35/2017/03/Lake_Tahoe-768x576.jpg 768w, https://cdn.kqed.org/wp-content/uploads/sites/35/2017/03/Lake_Tahoe-1020x765.jpg 1020w, https://cdn.kqed.org/wp-content/uploads/sites/35/2017/03/Lake_Tahoe-1180x885.jpg 1180w, https://cdn.kqed.org/wp-content/uploads/sites/35/2017/03/Lake_Tahoe-960x720.jpg 960w, https://cdn.kqed.org/wp-content/uploads/sites/35/2017/03/Lake_Tahoe-240x180.jpg 240w, https://cdn.kqed.org/wp-content/uploads/sites/35/2017/03/Lake_Tahoe-375x281.jpg 375w, https://cdn.kqed.org/wp-content/uploads/sites/35/2017/03/Lake_Tahoe-520x390.jpg 520w\" sizes=\"(max-width: 1632px) 100vw, 1632px\">\u003cfigcaption class=\"wp-caption-text\">Lake Tahoe just before sunrise. \u003ccite>(Lindsey Hoshaw/KQED)\u003c/cite>\u003c/figcaption>\u003c/figure>\n\u003cp>Obama used the event to announce more than $33 million in funding for ecosystem restoration and renewable energy projects. The largest chunk of new money — $29.5 million — will go toward stemming forest fires by clearing potential fuels near Lake Tahoe. A recent \u003ca href=\"http://www.fs.fed.us/news/releases/forest-service-survey-finds-record-66-million-dead-trees-southern-sierra-nevada\" target=\"_blank\" rel=\"noopener\">U.S. Forest Service report\u003c/a> found more than 60 million trees in the Sierra Nevada either dead or dying.\u003c/p>\n\u003cp>The funding comes at a crucial time for Lake Tahoe, which faces multiple threats despite $1.8 billion in federal, state, and local money having been funneled into protective measures over the past two decades.\u003c/p>\n\u003cp>Warming temperatures in the region have meant more precipitation falling as rain instead of snow, which creates more runoff into the lake. Warmer temperatures also increase the surface water temperature; a recent \u003ca href=\"http://terc.ucdavis.edu/\" target=\"_blank\" rel=\"noopener\">UC Davis report \u003c/a>found that the lake is warming faster than ever recorded.\u003c/p>\n\u003cp>Although California Senator Dianne Feinstein has urged Congress since 2011 to approve more money under the Lake Tahoe Restoration Act, nothing has materialized. Hence, most of Obama’s environmental conservation efforts have come through executive action.\u003c/p>\n\u003caside class=\"pullquote alignright\">‘A changing climate threatens even the best conservation efforts.’\u003ccite>President Barack Obama\u003c/cite>\u003c/aside>\n\u003cp>During his speech, Obama also announced a package of public and private initiatives aimed at restoring the withering Salton Sea and boosting geothermal energy development in the Southern California deserts. Geothermal plants tap the natural heat deep below the Earth’s surface to generate electrical power. While California is still home to the nation’s largest geothermal operation, development in the state has stalled in recent years.\u003c/p>\n\u003cp>The president said the federal government will work harder to help develop geothermal energy in the southern deserts. The Department of Energy is investigating ways that the Imperial Valley could produce between 100 to 250 megawatts of new geothermal energy while protecting wildlife habitat.\u003c/p>\n\u003cp>The federal government will also put $29 million into two geothermal research projects run by the \u003ca href=\"http://energy.gov/eere/forge/sandia-national-laboratories-fallon\" target=\"_blank\" rel=\"noopener\">Department of Energy’s Sandia National Laboratories, Fallon\u003c/a> in Nevada and the \u003ca href=\"https://www.usu.edu/campuses/page/milford/\" target=\"_blank\" rel=\"noopener\">University of Utah\u003c/a>.\u003c/p>\n\u003cp>Although the administration pledged funding for wildfire prevention and renewable energy, much of the president’s speech focused on private investments.[contextly_sidebar id=”CLtze1ldR9e4PnYovsqnrijpsSZOdmkP”]\u003c/p>\n\u003cp>Private sources including the S.D. Bechtel, Jr. Foundation and the Rockefeller Foundation are part of a new $10 million initiative to restore the Salton Sea, which Senator Barbara Boxer has described as being “at high risk of turning into a public health emergency.” As the lake shrinks from lack of a natural water supply, decaying organic matter releases hydrogen sulfide, which causes air pollution.\u003c/p>\n\u003cp>The appearance is Obama’s first to the annual Tahoe summit, and the first for any sitting president since President Bill Clinton spoke at the inaugural event in 1997.\u003c/p>\n\u003cp>Obama has been on environmental roll lately. Earlier in the summer he visited Yosemite National Park as part of the park service’s centennial.\u003c/p>\n\u003cp>Last week he established the \u003ca href=\"https://www.nps.gov/kaww/index.htm\" target=\"_blank\" rel=\"noopener\">Katahdin Woods and Waters National Monument\u003c/a> in north-central Maine and expanded the \u003ca href=\"http://www.papahanaumokuakea.gov/\">Papahānaumokuākea Marine National Monument\u003c/a>, creating the world’s largest marine protected area off the coast of Hawaii.\u003c/p>\n\u003cp>\u003c/p>\n\u003cp>After his talk today he’ll travel to Midway Atoll to discuss the importance of Papahānaumokuākea and of protecting our national treasures in the face of climate change.\u003c/p>\n\n",
"stats": {
"hasVideo": false,
"hasChartOrMap": false,
"hasAudio": false,
"hasPolis": false,
"wordCount": 877,
"hasGoogleForm": false,
"hasGallery": false,
"hasHearkenModule": false,
"iframeSrcs": [],
"paragraphCount": 23
},
"modified": 1704929694,
"excerpt": "Obama announced new funding for wildfire prevention efforts in the Lake Tahoe area, Salton Sea restoration, and geothermal energy development.",
"headData": {
"twImgId": "",
"twTitle": "",
"ogTitle": "",
"ogImgId": "",
"twDescription": "",
"description": "Obama announced new funding for wildfire prevention efforts in the Lake Tahoe area, Salton Sea restoration, and geothermal energy development.",
"title": "In Tahoe, Obama Underscores Climate Threats, Touts Conservation Funding | KQED",
"ogDescription": "",
"schema": {
"@context": "https://schema.org",
"@type": "Article",
"headline": "In Tahoe, Obama Underscores Climate Threats, Touts Conservation Funding",
"datePublished": "2016-08-31T15:56:19-07:00",
"dateModified": "2024-01-10T15:34:54-08:00",
"image": "https://cdn.kqed.org/wp-content/uploads/2020/02/KQED-OG-Image@1x.png"
}
},
"guestAuthors": [],
"slug": "in-tahoe-obama-underscores-climate-threats-touts-conservation-funding",
"status": "publish",
"sticky": false,
"path": "/science/958786/in-tahoe-obama-underscores-climate-threats-touts-conservation-funding",
"audioTrackLength": null,
"parsedContent": [
{
"type": "contentString",
"content": "\u003cdiv class=\"post-body\">\u003cp>\u003cp>President Obama made his first-ever visit to Lake Tahoe on Wednesday to stress the importance of conservation efforts for the lake and the nation at large in the face of climate change.\u003c/p>\n\u003cp>\u003c/p>\u003cp>\u003cdiv class='utils-parseShortcode-shortcodes-__shortcodes__shortcodeWrapper'>\n \u003ciframe width='”100%”' height='”166″'\n scrolling='no' frameborder='no'\n src='https://w.soundcloud.com/player/?url=”https://api.soundcloud.com/tracks/280937235″&visual=true&”color=ff5500&auto_play=false&hide_related=false&show_comments=true&show_user=true&show_reposts=false”'\n title='”https://api.soundcloud.com/tracks/280937235″'>\n \u003c/iframe>\n \u003c/div>\u003c/p>\u003cp>\u003c/p>\n\u003cp>“The challenges of conservation and combating climate change are connected — they’re linked,” Obama told a gathering at the 20th annual \u003ca href=\"http://tahoesouth.com/events/annual-lake-tahoe-summit/\" target=\"_blank\" rel=\"noopener\">Lake Tahoe Summit\u003c/a>, which brings together political leaders and scientists to hash out major environmental issues facing the lake. Impacts from the changing climate, runoff, erosion, wildfires, and invasive species have all threatened Lake Tahoe’s legendary clarity.\u003c/p>\n\u003cp>“Just as this space is sacred to Native Americans, it should be sacred to all Americans,” he told the crowd.\u003c/p>\n\u003cp>“That’s why we’re here, to protect this special, pristine place, to keep these waters crystal clear, the keep the air as pure as the heavens,” said Obama.\u003c/p>\n\u003cp>\u003c/p>\u003c/div>",
"attributes": {
"named": {},
"numeric": []
}
},
{
"type": "component",
"content": "",
"name": "ad",
"attributes": {
"named": {
"label": "fullwidth"
},
"numeric": [
"fullwidth"
]
}
},
{
"type": "contentString",
"content": "\u003cdiv class=\"post-body\">\u003cp>\u003c/p>\n\u003cp>“This is really nice,” said the president with seemingly genuine delight, after laying eyes on the Tahoe Basin for the first time. “I will be coming here more often.”\u003c/p>\n\u003cp>Obama’s admiration for the scenery served to underscore the risks he outlined that climate change and the drought pose to the region.\u003c/p>\n\u003cp>“A single wildfire in a dangerously flammable Lake Tahoe Basin could cause enough erosion to erase decades of progress when it comes to water quality,” says Obama. “A changing climate threatens even the best conservation efforts.”\u003c/p>\n\u003cfigure id=\"attachment_1512529\" class=\"wp-caption alignright\" style=\"max-width: 1632px\">\u003cimg loading=\"lazy\" decoding=\"async\" class=\"size-full wp-image-1512529\" src=\"https://ww2.kqed.org/science/wp-content/uploads/sites/35/2017/03/Lake_Tahoe.jpg\" alt=\"Lake Tahoe just before sunrise.\" width=\"1632\" height=\"1224\" srcset=\"https://cdn.kqed.org/wp-content/uploads/sites/35/2017/03/Lake_Tahoe.jpg 1632w, https://cdn.kqed.org/wp-content/uploads/sites/35/2017/03/Lake_Tahoe-160x120.jpg 160w, https://cdn.kqed.org/wp-content/uploads/sites/35/2017/03/Lake_Tahoe-800x600.jpg 800w, https://cdn.kqed.org/wp-content/uploads/sites/35/2017/03/Lake_Tahoe-768x576.jpg 768w, https://cdn.kqed.org/wp-content/uploads/sites/35/2017/03/Lake_Tahoe-1020x765.jpg 1020w, https://cdn.kqed.org/wp-content/uploads/sites/35/2017/03/Lake_Tahoe-1180x885.jpg 1180w, https://cdn.kqed.org/wp-content/uploads/sites/35/2017/03/Lake_Tahoe-960x720.jpg 960w, https://cdn.kqed.org/wp-content/uploads/sites/35/2017/03/Lake_Tahoe-240x180.jpg 240w, https://cdn.kqed.org/wp-content/uploads/sites/35/2017/03/Lake_Tahoe-375x281.jpg 375w, https://cdn.kqed.org/wp-content/uploads/sites/35/2017/03/Lake_Tahoe-520x390.jpg 520w\" sizes=\"(max-width: 1632px) 100vw, 1632px\">\u003cfigcaption class=\"wp-caption-text\">Lake Tahoe just before sunrise. \u003ccite>(Lindsey Hoshaw/KQED)\u003c/cite>\u003c/figcaption>\u003c/figure>\n\u003cp>Obama used the event to announce more than $33 million in funding for ecosystem restoration and renewable energy projects. The largest chunk of new money — $29.5 million — will go toward stemming forest fires by clearing potential fuels near Lake Tahoe. A recent \u003ca href=\"http://www.fs.fed.us/news/releases/forest-service-survey-finds-record-66-million-dead-trees-southern-sierra-nevada\" target=\"_blank\" rel=\"noopener\">U.S. Forest Service report\u003c/a> found more than 60 million trees in the Sierra Nevada either dead or dying.\u003c/p>\n\u003cp>The funding comes at a crucial time for Lake Tahoe, which faces multiple threats despite $1.8 billion in federal, state, and local money having been funneled into protective measures over the past two decades.\u003c/p>\n\u003cp>Warming temperatures in the region have meant more precipitation falling as rain instead of snow, which creates more runoff into the lake. Warmer temperatures also increase the surface water temperature; a recent \u003ca href=\"http://terc.ucdavis.edu/\" target=\"_blank\" rel=\"noopener\">UC Davis report \u003c/a>found that the lake is warming faster than ever recorded.\u003c/p>\n\u003cp>Although California Senator Dianne Feinstein has urged Congress since 2011 to approve more money under the Lake Tahoe Restoration Act, nothing has materialized. Hence, most of Obama’s environmental conservation efforts have come through executive action.\u003c/p>\n\u003caside class=\"pullquote alignright\">‘A changing climate threatens even the best conservation efforts.’\u003ccite>President Barack Obama\u003c/cite>\u003c/aside>\n\u003cp>During his speech, Obama also announced a package of public and private initiatives aimed at restoring the withering Salton Sea and boosting geothermal energy development in the Southern California deserts. Geothermal plants tap the natural heat deep below the Earth’s surface to generate electrical power. While California is still home to the nation’s largest geothermal operation, development in the state has stalled in recent years.\u003c/p>\n\u003cp>The president said the federal government will work harder to help develop geothermal energy in the southern deserts. The Department of Energy is investigating ways that the Imperial Valley could produce between 100 to 250 megawatts of new geothermal energy while protecting wildlife habitat.\u003c/p>\n\u003cp>The federal government will also put $29 million into two geothermal research projects run by the \u003ca href=\"http://energy.gov/eere/forge/sandia-national-laboratories-fallon\" target=\"_blank\" rel=\"noopener\">Department of Energy’s Sandia National Laboratories, Fallon\u003c/a> in Nevada and the \u003ca href=\"https://www.usu.edu/campuses/page/milford/\" target=\"_blank\" rel=\"noopener\">University of Utah\u003c/a>.\u003c/p>\n\u003cp>Although the administration pledged funding for wildfire prevention and renewable energy, much of the president’s speech focused on private investments.\u003c/p>\u003cp>\u003c/p>\u003cp>\u003c/p>\n\u003cp>Private sources including the S.D. Bechtel, Jr. Foundation and the Rockefeller Foundation are part of a new $10 million initiative to restore the Salton Sea, which Senator Barbara Boxer has described as being “at high risk of turning into a public health emergency.” As the lake shrinks from lack of a natural water supply, decaying organic matter releases hydrogen sulfide, which causes air pollution.\u003c/p>\n\u003cp>The appearance is Obama’s first to the annual Tahoe summit, and the first for any sitting president since President Bill Clinton spoke at the inaugural event in 1997.\u003c/p>\n\u003cp>Obama has been on environmental roll lately. Earlier in the summer he visited Yosemite National Park as part of the park service’s centennial.\u003c/p>\n\u003cp>Last week he established the \u003ca href=\"https://www.nps.gov/kaww/index.htm\" target=\"_blank\" rel=\"noopener\">Katahdin Woods and Waters National Monument\u003c/a> in north-central Maine and expanded the \u003ca href=\"http://www.papahanaumokuakea.gov/\">Papahānaumokuākea Marine National Monument\u003c/a>, creating the world’s largest marine protected area off the coast of Hawaii.\u003c/p>\n\u003cp>\u003c/p>\n\u003cp>After his talk today he’ll travel to Midway Atoll to discuss the importance of Papahānaumokuākea and of protecting our national treasures in the face of climate change.\u003c/p>\n\n\u003c/div>\u003c/p>",
"attributes": {
"named": {},
"numeric": []
}
}
],
"link": "/science/958786/in-tahoe-obama-underscores-climate-threats-touts-conservation-funding",
"authors": [
"5432"
],
"categories": [
"science_31",
"science_33",
"science_35",
"science_40",
"science_43",
"science_98"
],
"tags": [
"science_5185"
],
"featImg": "science_959714",
"label": "science"
},
"science_959253": {
"type": "posts",
"id": "science_959253",
"meta": {
"index": "posts_1716263798",
"site": "science",
"id": "959253",
"score": null,
"sort": [
1472676736000
]
},
"parent": 0,
"labelTerm": {
"site": "science",
"term": 1151
},
"blocks": [],
"publishDate": 1472676736,
"format": "standard",
"title": "Landscaping for Drought Could Make Warm Nights Cooler",
"headTitle": "Landscaping for Drought Could Make Warm Nights Cooler | KQED",
"content": "\u003cp>As drought-stricken residents of Los Angeles’s hottest neighborhoods replace thirsty lawns with native plants, pavers and bare soil, new research has shown how their local climates could begin tipping back in the direction of their desert-like origins.\u003c/p>\n\u003caside class=\"pullquote alignright\">Nighttime lows help people recover daily even as heat waves persist.\u003c/aside>\n\u003cp>In a \u003ca href=\"http://www.latimes.com/local/lanow/la-me-ln-heat-wave-temperature-records-los-angeles-20160619-snap-story.html\">region beset this year\u003c/a> by drought and powerful heat waves, the widespread adoption of drought-proof landscaping is expected to bring warmer days — and much cooler nights. Overall, experts say the changes would help to protect residents from heat waves, which are being made worse by global warming.\u003c/p>\n\u003cp>California, naturally prone to drought, is enduring the fifth year of a historically bad one. Droughts are projected to intensify in California as temperatures rise, \u003ca href=\"http://www.climatecentral.org/news/california-snowpack-returns-fears-future-20166\">reducing mountain snowpacks\u003c/a> and \u003ca href=\"http://www.climatecentral.org/news/climate-change-bully-california-drought-19354\">soil moisture\u003c/a> and \u003ca href=\"http://www.climatecentral.org/news/california-drought-heatwave-and-warming-20513\">potentially altering weather patterns\u003c/a>.\u003c/p>\n\u003cp>To cut water use, utilities and agencies have been helping Californians swap out their lawns for drought-hardy native landscapes. The L.A. Department of Water and Power says more than 24,000 of its water customers have worked to make the switch since 2009.\u003c/p>\n\u003cp>“You can see the beginnings of some real change in landscaping practices,” said \u003ca href=\"http://www.environment.ucla.edu/people/alex-hall\">Alex Hall\u003c/a>, a professor at UCLA who studies regional and global climate change.\u003c/p>\n\u003cp>[ad fullwidth]\u003c/p>\n\u003cp>Done at a large enough scale, University of Southern California research \u003ca href=\"http://onlinelibrary.wiley.com/doi/10.1002/2016GL069658/abstract\">published in Geographical Research Letters\u003c/a> this month shows how the landscaping changes could affect the weather.\u003c/p>\n\u003cfigure id=\"attachment_959261\" class=\"wp-caption aligncenter\" style=\"max-width: 720px\">\u003ca href=\"http://ww2.kqed.org/science/wp-content/uploads/sites/35/2016/08/temps.png\">\u003cimg loading=\"lazy\" decoding=\"async\" class=\"size-full wp-image-959261\" src=\"http://ww2.kqed.org/science/wp-content/uploads/sites/35/2016/08/temps.png\" alt=\"Summertime temperatures in Los Angeles since the 1940s.\" width=\"720\" height=\"424\" srcset=\"https://cdn.kqed.org/wp-content/uploads/sites/35/2016/08/temps.png 720w, https://cdn.kqed.org/wp-content/uploads/sites/35/2016/08/temps-400x236.png 400w\" sizes=\"(max-width: 720px) 100vw, 720px\">\u003c/a>\u003cfigcaption class=\"wp-caption-text\">Summertime temperatures in Los Angeles since the 1940s. \u003ccite>(NOAA)\u003c/cite>\u003c/figcaption>\u003c/figure>\n\u003cp>Worsening heat waves are among the \u003ca href=\"http://www.climatecentral.org/news/extreme-heat-climate-change-19641\">clearest and deadliest effects\u003c/a> of climate change. The research focused on July temperatures, when heat waves in southern California can be oppressive, taking their heaviest tolls on the elderly, the sick and the poor.\u003c/p>\n\u003cp>“We were interested in understanding these impacts on a summer month,” said \u003ca href=\"http://cee.usc.edu/faculty-staff/faculty-directory/georgeban-weiss.htm\">George Ban-Weiss\u003c/a>, who researches relationships between local and global climate and who led the new study. “One of our concerns is the health consequences of extreme heat, so we wanted to be sure to study a hot baseline period.”\u003c/p>\n\u003cp>\u003cstrong>Hotter Days, But Much Cooler Nights\u003c/strong>\u003c/p>\n\u003cp>Using models, Ban-Weiss and a colleague found that replacing lawns and grassy parks with native bushes and other drought-hardy landscapes would increase daytime temperatures throughout the metropolitan area by 1.3°F on average. That’s largely because irrigation water acts like sweat, cooling down landscapes.\u003c/p>\n\u003cp>The study helps to inform a ‘what if’ thought experiment, in which a future L.A. morphs back toward its original state, free of irrigation, driven by worsening Western droughts.\u003c/p>\n\u003cp>The findings may also be relevant to other cities where soils are wettened during summer more by sprinklers and hoses than by rainfall.\u003c/p>\n\u003cp>[contextly_sidebar id=”pwCrebyEW6F5MuCRM6WDVi6bVHjjmJKt”]In the suburban San Fernando Valley, where temperatures are among the highest, and where the natural environment was described in the 1880s as resembling \u003ca href=\"http://www.boomcalifornia.com/2013/10/myth-of-a-desert-metropolis/\">that of a desert\u003c/a>, daytime temperatures were projected to rise the most — by 3.4°F.\u003c/p>\n\u003cp>That would seem to be bad news. Greenhouse gas pollution has warmed the planet’s surface \u003ca href=\"http://www.climatecentral.org/news/world-flirts-with-1.5C-threshold-20260\">nearly 2°F\u003c/a> on average, and \u003ca href=\"http://www.climatecentral.org/news/west-coast-warming-natural-variability-18067\">natural weather cycles\u003c/a> have caused the West to warm faster than most other places in recent decades. Compounding the problem is the \u003ca href=\"http://www.climatecentral.org/news/urban-heat-islands-threaten-us-health-17919\">urban heat island effect\u003c/a>, with concrete causing L.A. and other cities to warm faster than rural regions.\u003c/p>\n\u003cp>But there was a nocturnal twist to the findings.\u003c/p>\n\u003cp>“If you stop irrigating, you’re making the system go back to the arid system that it really is,” said \u003ca href=\"http://www.atmos.washington.edu/~aswann/Main.html\">Abigail Swann\u003c/a>, a University of Washington ecoclimate researcher. “If you’ve spent any time in arid places, you know that they cool very quickly at night and they also heat very quickly during the day.”\u003c/p>\n\u003cp>\u003cstrong>Nighttime Lows Help People Recover\u003c/strong>\u003c/p>\n\u003cp>At night, the modeling projected a cooling effect from the changing landscapes that would be exceed the daytime warming effect. Across L.A., nighttime lows were projected to fall by an average of nearly 6°F if irrigation suddenly ended.\u003c/p>\n\u003cp>That’s a key finding, because nighttime lows help people recover daily even as heat waves persist. From a public health perspective, the findings point to a “net positive,” said \u003ca href=\"https://www.mailman.columbia.edu/people/our-faculty/plk3\">Patrick Kinney\u003c/a>, a professor who directs Columbia University’s climate and health program.\u003c/p>\n\u003cp>“It’s generally thought that nighttime minimum temperatures are more important for health risks than daytime highs during extreme heat events,” Kinney said.\u003c/p>\n\u003cp>Most of the water used in Los Angeles is piped in from other counties and regions, and most of that is used to water lawns and gardens. The new findings show that cutting back on irrigation in the low-rainfall metropolis could do more than just save water and the energy needed to transport it — it could save lives.\u003c/p>\n\u003cp>\u003c/p>\n\u003cp>\u003cem>\u003ca href=\"http://www.climatecentral.org/\" target=\"_blank\" rel=\"noopener\">Climate Central\u003c/a> is an independent organization that researches and reports on climate change.\u003c/em>\u003c/p>\n\n",
"stats": {
"hasVideo": false,
"hasChartOrMap": false,
"hasAudio": false,
"hasPolis": false,
"wordCount": 832,
"hasGoogleForm": false,
"hasGallery": false,
"hasHearkenModule": false,
"iframeSrcs": [],
"paragraphCount": 24
},
"modified": 1704929695,
"excerpt": "Cooler nights are more important than lower daytime temperatures for helping people recover from heat waves, say health scientists.",
"headData": {
"twImgId": "",
"twTitle": "",
"ogTitle": "",
"ogImgId": "",
"twDescription": "",
"description": "Cooler nights are more important than lower daytime temperatures for helping people recover from heat waves, say health scientists.",
"title": "Landscaping for Drought Could Make Warm Nights Cooler | KQED",
"ogDescription": "",
"schema": {
"@context": "https://schema.org",
"@type": "Article",
"headline": "Landscaping for Drought Could Make Warm Nights Cooler",
"datePublished": "2016-08-31T13:52:16-07:00",
"dateModified": "2024-01-10T15:34:55-08:00",
"image": "https://cdn.kqed.org/wp-content/uploads/2020/02/KQED-OG-Image@1x.png"
}
},
"guestAuthors": [],
"slug": "landscaping-for-drought-could-make-warm-nights-cooler",
"status": "publish",
"nprByline": "\u003cstrong>John Upton\u003cbr>Climate Central\u003c/strong>",
"sticky": false,
"path": "/science/959253/landscaping-for-drought-could-make-warm-nights-cooler",
"audioTrackLength": null,
"parsedContent": [
{
"type": "contentString",
"content": "\u003cdiv class=\"post-body\">\u003cp>\u003cp>As drought-stricken residents of Los Angeles’s hottest neighborhoods replace thirsty lawns with native plants, pavers and bare soil, new research has shown how their local climates could begin tipping back in the direction of their desert-like origins.\u003c/p>\n\u003caside class=\"pullquote alignright\">Nighttime lows help people recover daily even as heat waves persist.\u003c/aside>\n\u003cp>In a \u003ca href=\"http://www.latimes.com/local/lanow/la-me-ln-heat-wave-temperature-records-los-angeles-20160619-snap-story.html\">region beset this year\u003c/a> by drought and powerful heat waves, the widespread adoption of drought-proof landscaping is expected to bring warmer days — and much cooler nights. Overall, experts say the changes would help to protect residents from heat waves, which are being made worse by global warming.\u003c/p>\n\u003cp>California, naturally prone to drought, is enduring the fifth year of a historically bad one. Droughts are projected to intensify in California as temperatures rise, \u003ca href=\"http://www.climatecentral.org/news/california-snowpack-returns-fears-future-20166\">reducing mountain snowpacks\u003c/a> and \u003ca href=\"http://www.climatecentral.org/news/climate-change-bully-california-drought-19354\">soil moisture\u003c/a> and \u003ca href=\"http://www.climatecentral.org/news/california-drought-heatwave-and-warming-20513\">potentially altering weather patterns\u003c/a>.\u003c/p>\n\u003cp>To cut water use, utilities and agencies have been helping Californians swap out their lawns for drought-hardy native landscapes. The L.A. Department of Water and Power says more than 24,000 of its water customers have worked to make the switch since 2009.\u003c/p>\n\u003cp>“You can see the beginnings of some real change in landscaping practices,” said \u003ca href=\"http://www.environment.ucla.edu/people/alex-hall\">Alex Hall\u003c/a>, a professor at UCLA who studies regional and global climate change.\u003c/p>\n\u003cp>\u003c/p>\u003c/div>",
"attributes": {
"named": {},
"numeric": []
}
},
{
"type": "component",
"content": "",
"name": "ad",
"attributes": {
"named": {
"label": "fullwidth"
},
"numeric": [
"fullwidth"
]
}
},
{
"type": "contentString",
"content": "\u003cdiv class=\"post-body\">\u003cp>\u003c/p>\n\u003cp>Done at a large enough scale, University of Southern California research \u003ca href=\"http://onlinelibrary.wiley.com/doi/10.1002/2016GL069658/abstract\">published in Geographical Research Letters\u003c/a> this month shows how the landscaping changes could affect the weather.\u003c/p>\n\u003cfigure id=\"attachment_959261\" class=\"wp-caption aligncenter\" style=\"max-width: 720px\">\u003ca href=\"http://ww2.kqed.org/science/wp-content/uploads/sites/35/2016/08/temps.png\">\u003cimg loading=\"lazy\" decoding=\"async\" class=\"size-full wp-image-959261\" src=\"http://ww2.kqed.org/science/wp-content/uploads/sites/35/2016/08/temps.png\" alt=\"Summertime temperatures in Los Angeles since the 1940s.\" width=\"720\" height=\"424\" srcset=\"https://cdn.kqed.org/wp-content/uploads/sites/35/2016/08/temps.png 720w, https://cdn.kqed.org/wp-content/uploads/sites/35/2016/08/temps-400x236.png 400w\" sizes=\"(max-width: 720px) 100vw, 720px\">\u003c/a>\u003cfigcaption class=\"wp-caption-text\">Summertime temperatures in Los Angeles since the 1940s. \u003ccite>(NOAA)\u003c/cite>\u003c/figcaption>\u003c/figure>\n\u003cp>Worsening heat waves are among the \u003ca href=\"http://www.climatecentral.org/news/extreme-heat-climate-change-19641\">clearest and deadliest effects\u003c/a> of climate change. The research focused on July temperatures, when heat waves in southern California can be oppressive, taking their heaviest tolls on the elderly, the sick and the poor.\u003c/p>\n\u003cp>“We were interested in understanding these impacts on a summer month,” said \u003ca href=\"http://cee.usc.edu/faculty-staff/faculty-directory/georgeban-weiss.htm\">George Ban-Weiss\u003c/a>, who researches relationships between local and global climate and who led the new study. “One of our concerns is the health consequences of extreme heat, so we wanted to be sure to study a hot baseline period.”\u003c/p>\n\u003cp>\u003cstrong>Hotter Days, But Much Cooler Nights\u003c/strong>\u003c/p>\n\u003cp>Using models, Ban-Weiss and a colleague found that replacing lawns and grassy parks with native bushes and other drought-hardy landscapes would increase daytime temperatures throughout the metropolitan area by 1.3°F on average. That’s largely because irrigation water acts like sweat, cooling down landscapes.\u003c/p>\n\u003cp>The study helps to inform a ‘what if’ thought experiment, in which a future L.A. morphs back toward its original state, free of irrigation, driven by worsening Western droughts.\u003c/p>\n\u003cp>The findings may also be relevant to other cities where soils are wettened during summer more by sprinklers and hoses than by rainfall.\u003c/p>\n\u003cp>\u003c/p>\u003cp>\u003c/p>\u003cp>In the suburban San Fernando Valley, where temperatures are among the highest, and where the natural environment was described in the 1880s as resembling \u003ca href=\"http://www.boomcalifornia.com/2013/10/myth-of-a-desert-metropolis/\">that of a desert\u003c/a>, daytime temperatures were projected to rise the most — by 3.4°F.\u003c/p>\n\u003cp>That would seem to be bad news. Greenhouse gas pollution has warmed the planet’s surface \u003ca href=\"http://www.climatecentral.org/news/world-flirts-with-1.5C-threshold-20260\">nearly 2°F\u003c/a> on average, and \u003ca href=\"http://www.climatecentral.org/news/west-coast-warming-natural-variability-18067\">natural weather cycles\u003c/a> have caused the West to warm faster than most other places in recent decades. Compounding the problem is the \u003ca href=\"http://www.climatecentral.org/news/urban-heat-islands-threaten-us-health-17919\">urban heat island effect\u003c/a>, with concrete causing L.A. and other cities to warm faster than rural regions.\u003c/p>\n\u003cp>But there was a nocturnal twist to the findings.\u003c/p>\n\u003cp>“If you stop irrigating, you’re making the system go back to the arid system that it really is,” said \u003ca href=\"http://www.atmos.washington.edu/~aswann/Main.html\">Abigail Swann\u003c/a>, a University of Washington ecoclimate researcher. “If you’ve spent any time in arid places, you know that they cool very quickly at night and they also heat very quickly during the day.”\u003c/p>\n\u003cp>\u003cstrong>Nighttime Lows Help People Recover\u003c/strong>\u003c/p>\n\u003cp>At night, the modeling projected a cooling effect from the changing landscapes that would be exceed the daytime warming effect. Across L.A., nighttime lows were projected to fall by an average of nearly 6°F if irrigation suddenly ended.\u003c/p>\n\u003cp>That’s a key finding, because nighttime lows help people recover daily even as heat waves persist. From a public health perspective, the findings point to a “net positive,” said \u003ca href=\"https://www.mailman.columbia.edu/people/our-faculty/plk3\">Patrick Kinney\u003c/a>, a professor who directs Columbia University’s climate and health program.\u003c/p>\n\u003cp>“It’s generally thought that nighttime minimum temperatures are more important for health risks than daytime highs during extreme heat events,” Kinney said.\u003c/p>\n\u003cp>Most of the water used in Los Angeles is piped in from other counties and regions, and most of that is used to water lawns and gardens. The new findings show that cutting back on irrigation in the low-rainfall metropolis could do more than just save water and the energy needed to transport it — it could save lives.\u003c/p>\n\u003cp>\u003c/p>\n\u003cp>\u003cem>\u003ca href=\"http://www.climatecentral.org/\" target=\"_blank\" rel=\"noopener\">Climate Central\u003c/a> is an independent organization that researches and reports on climate change.\u003c/em>\u003c/p>\n\n\u003c/div>\u003c/p>",
"attributes": {
"named": {},
"numeric": []
}
}
],
"link": "/science/959253/landscaping-for-drought-could-make-warm-nights-cooler",
"authors": [
"byline_science_959253"
],
"series": [
"science_1151"
],
"categories": [
"science_31",
"science_35",
"science_39",
"science_40"
],
"tags": [
"science_572"
],
"featImg": "science_959257",
"label": "science_1151"
},
"science_946591": {
"type": "posts",
"id": "science_946591",
"meta": {
"index": "posts_1716263798",
"site": "science",
"id": "946591",
"score": null,
"sort": [
1472237923000
]
},
"parent": 0,
"labelTerm": {},
"blocks": [],
"publishDate": 1472237923,
"format": "standard",
"title": "California’s New Climate Rules, Explained",
"headTitle": "California’s New Climate Rules, Explained | KQED",
"content": "\u003cp>Following more than a year of legislative toing and froing, California’s leaders agreed this week on how ambitious the state will be in the fight against climate change after 2020.\u003c/p>\n\u003cp>Short answer: very.\u003c/p>\n\u003cp>A progressive culture and Silicon Valley-style innovation a decade ago thrust California toward the head of the worldwide pack when it comes to shifting away from polluting fossil fuels in favor of cleaner alternatives.\u003c/p>\n\u003cp>This week, the state Assembly and Senate ensured the state’s leadership will be strengthened when lawmakers approved two key bills.\u003c/p>\n\u003cp>The legislation will require Californian agencies take steps needed to reduce greenhouse gas pollution by 40 percent in 2030, compared with 1990 levels. Gov. Jerry Brown plans to sign it.\u003c/p>\n\u003cp>[ad fullwidth]\u003c/p>\n\u003cp>\u003cstrong>How do California’s Goals Stack Up?\u003c/strong>\u003c/p>\n\u003cp>The state’s new climate goals are far more ambitious than those of the U.S. overall, and they’re in line with ambitions in Europe, which is a world leader on climate action.\u003c/p>\n\u003cp>Both the European Union and California are shooting for 40 percent pollution reductions in 2030 compared with 1990 levels. The Europeans got off to an earlier start, setting a more ambitious target for 2020 than California. That means California will have to work harder to reach its goals for 2030.\u003c/p>\n\u003cp>“This is exactly the right goal for California,” said \u003ca href=\"http://energyinnovation.org/team-member/chris-busch/\">Chris Busch\u003c/a>, director of research at Energy Innovation, a policy think tank in California. “It’s strong but undeniably achievable and beneficial.”\u003c/p>\n\u003cp>\u003cstrong>Are any countries or states more ambitious than California?\u003c/strong>\u003c/p>\n\u003cp>Just as California is the star of climate action in the U.S., the European Union has its own big shot — Germany. Germany aims to reduce its climate impacts by 40 percent by 2020 compared with 1990 levels, which is something California and the EU aim to achieve a decade later.\u003c/p>\n\u003cp>Still, per person, Californians and Germans continue to be heavier polluters than most Europeans, releasing the equivalent of about \u003ca href=\"http://www.arb.ca.gov/newsrel/newsrelease.php?id=740\">12 tons each\u003c/a> of heat-trapping carbon dioxide in 2013. That’s a third more than the \u003ca href=\"http://ec.europa.eu/eurostat/tgm/table.do?tab=table&init=1&language=en&pcode=t2020_rd300&plugin=1\">European Union average\u003c/a>.\u003c/p>\n\u003cp>For comparison, the \u003ca href=\"http://data.worldbank.org/indicator/EN.ATM.CO2E.PC\">average Indian\u003c/a> releases less than 2 tons a year, a figure that is rising as the country’s economy grows.\u003c/p>\n\u003cp>\u003cstrong>How will California hit its goals?\u003c/strong>\u003c/p>\n\u003cp>California runs a number of programs that help it reduce its climate pollution, including financial support for electric vehicle purchases, mandates on biofuels and requirements that utilities source a substantial amount of their power from renewable sources.\u003c/p>\n\u003cp>The new legislation requires the California Air Resources Board to strengthen these programs, or roll out new ones, to ensure that the new targets are met.\u003c/p>\n\u003cp>California also was among the first in the world to set up a cap-and-trade program, which imposes a limit on the amount of pollution that industry can release each year. By selling tradeable allowances needed to pollute, the state raises money that reduces electricity bills and that funds programs that can reduce climate pollution.\u003c/p>\n\u003cp>\u003cstrong>How is the cap-and-trade program faring?\u003c/strong>\u003c/p>\n\u003cp>The cap-and-trade program is withering like a Californian tomato left out in the sun.\u003c/p>\n\u003cp>One problem is that California’s notoriously dysfunctional legislature can’t agree on how to spend more than $1 billion in cap-and-trade funds, meaning the money is just sitting around instead of being put to work.\u003c/p>\n\u003cp>“It’s not like a savings account that we put in the bank and wait for retirement,” a frustrated Sen. Fran Pavley \u003ca href=\"http://www.latimes.com/politics/la-pol-sac-cap-trade-cash-businesses-20160817-snap-htmlstory.html\">recently opined\u003c/a> to the L.A. Times.\u003c/p>\n\u003cp>The final legislative sessions for the year are planned for next week, ahead of elections scheduled for November. Many hope the spending will be approved before the break.\u003c/p>\n\u003cp>“We still have a few more days,” the Environmental Defense Fund’s \u003ca href=\"https://www.edf.org/people/erica-morehouse\">Erica Morehouse\u003c/a> optimistically pointed out\u003c/p>\n\u003cp>\u003cstrong>Is that the biggest problem for cap-and-trade?\u003c/strong>\u003c/p>\n\u003cp>Not even close.\u003c/p>\n\u003cp>A bigger problem is that the cap-and-trade program expires at the end of 2020. \u003ca href=\"http://www.climatecentral.org/news/legal-doubts-over-californias-cap-and-trade-20607\">Legal experts have concluded\u003c/a> that a two-thirds vote from the Assembly and Senate may be needed to extend the program after 2020.\u003c/p>\n\u003cp>That could see the program destroyed just when it’s needed the most — to help achieve increasingly ambitious climate goals.\u003c/p>\n\u003cp>“The important thing to recognize about the post-2020 market in California is that the level of effort fundamentally changes,” Stanford expert \u003ca href=\"https://law.stanford.edu/directory/michael-wara/\">Michael Wara\u003c/a> said.\u003c/p>\n\u003cp>The unlikelihood of supermajority lawmaker support for cap-and-trade may help to explain why just a small portion of pollution allowances were sold during California’s last two quarterly auctions, reducing anticipated funds flowing into California by nearly $1 billion.\u003c/p>\n\u003cp>\u003cstrong>Can California’s cap-and-trade program be saved?\u003c/strong>\u003c/p>\n\u003cp>California officials have been reluctant to even admit that the legal conundrum exists, perhaps wary of weakening their position in a future court battle. This week, though, senior Brown advisor \u003ca href=\"http://www.climatecentral.org/news/program-in-doubt-as-california-climate-bill-approved--20628\">Nancy McFadden\u003c/a> suggested a ballot measure might help circumvent the need for supermajority lawmaker support.\u003c/p>\n\u003cp>When a reporter asked Brown about the future of cap-and-trade on Wednesday, he said he expects California’s business community will eventually demand that lawmakers support it, because it would provide an efficient way of helping to comply with the new law.\u003c/p>\n\u003cp>“I think a lot of it’s going to be driven by the business interests themselves,” Brown said. “They’re going to plead for a market system called cap-and-trade.”\u003c/p>\n\u003cp>Independent experts also point out the program could probably continue operating after 2020 under current law, but only if it hands out the pollution allowances for free. Such an idea is likely be opposed as a handout by Californian lawmakers.\u003c/p>\n\u003cp>\u003c/p>\n\u003cp>\u003ca href=\"http://www.climatecentral.org/\">\u003cspan style=\"font-weight: 400\">Climate Central\u003c/span>\u003c/a> \u003ci>\u003cspan style=\"font-weight: 400\">is an independent organization that researches and reports on climate change.\u003c/span>\u003c/i>\u003c/p>\n\n",
"stats": {
"hasVideo": false,
"hasChartOrMap": false,
"hasAudio": false,
"hasPolis": false,
"wordCount": 981,
"hasGoogleForm": false,
"hasGallery": false,
"hasHearkenModule": false,
"iframeSrcs": [],
"paragraphCount": 37
},
"modified": 1704929707,
"excerpt": "A progressive culture and Silicon Valley-style innovation turned California into a climate leader.",
"headData": {
"twImgId": "",
"twTitle": "",
"ogTitle": "",
"ogImgId": "",
"twDescription": "",
"description": "A progressive culture and Silicon Valley-style innovation turned California into a climate leader.",
"title": "California’s New Climate Rules, Explained | KQED",
"ogDescription": "",
"schema": {
"@context": "https://schema.org",
"@type": "Article",
"headline": "California’s New Climate Rules, Explained",
"datePublished": "2016-08-26T11:58:43-07:00",
"dateModified": "2024-01-10T15:35:07-08:00",
"image": "https://cdn.kqed.org/wp-content/uploads/2020/02/KQED-OG-Image@1x.png"
}
},
"guestAuthors": [],
"slug": "californias-new-climate-rules-explained",
"status": "publish",
"sourceUrl": "http://www.climatecentral.org/",
"nprByline": "John Upton\u003c/br> Climate Central",
"sticky": false,
"source": "Climate Central",
"path": "/science/946591/californias-new-climate-rules-explained",
"audioTrackLength": null,
"parsedContent": [
{
"type": "contentString",
"content": "\u003cdiv class=\"post-body\">\u003cp>\u003cp>Following more than a year of legislative toing and froing, California’s leaders agreed this week on how ambitious the state will be in the fight against climate change after 2020.\u003c/p>\n\u003cp>Short answer: very.\u003c/p>\n\u003cp>A progressive culture and Silicon Valley-style innovation a decade ago thrust California toward the head of the worldwide pack when it comes to shifting away from polluting fossil fuels in favor of cleaner alternatives.\u003c/p>\n\u003cp>This week, the state Assembly and Senate ensured the state’s leadership will be strengthened when lawmakers approved two key bills.\u003c/p>\n\u003cp>The legislation will require Californian agencies take steps needed to reduce greenhouse gas pollution by 40 percent in 2030, compared with 1990 levels. Gov. Jerry Brown plans to sign it.\u003c/p>\n\u003cp>\u003c/p>\u003c/div>",
"attributes": {
"named": {},
"numeric": []
}
},
{
"type": "component",
"content": "",
"name": "ad",
"attributes": {
"named": {
"label": "fullwidth"
},
"numeric": [
"fullwidth"
]
}
},
{
"type": "contentString",
"content": "\u003cdiv class=\"post-body\">\u003cp>\u003c/p>\n\u003cp>\u003cstrong>How do California’s Goals Stack Up?\u003c/strong>\u003c/p>\n\u003cp>The state’s new climate goals are far more ambitious than those of the U.S. overall, and they’re in line with ambitions in Europe, which is a world leader on climate action.\u003c/p>\n\u003cp>Both the European Union and California are shooting for 40 percent pollution reductions in 2030 compared with 1990 levels. The Europeans got off to an earlier start, setting a more ambitious target for 2020 than California. That means California will have to work harder to reach its goals for 2030.\u003c/p>\n\u003cp>“This is exactly the right goal for California,” said \u003ca href=\"http://energyinnovation.org/team-member/chris-busch/\">Chris Busch\u003c/a>, director of research at Energy Innovation, a policy think tank in California. “It’s strong but undeniably achievable and beneficial.”\u003c/p>\n\u003cp>\u003cstrong>Are any countries or states more ambitious than California?\u003c/strong>\u003c/p>\n\u003cp>Just as California is the star of climate action in the U.S., the European Union has its own big shot — Germany. Germany aims to reduce its climate impacts by 40 percent by 2020 compared with 1990 levels, which is something California and the EU aim to achieve a decade later.\u003c/p>\n\u003cp>Still, per person, Californians and Germans continue to be heavier polluters than most Europeans, releasing the equivalent of about \u003ca href=\"http://www.arb.ca.gov/newsrel/newsrelease.php?id=740\">12 tons each\u003c/a> of heat-trapping carbon dioxide in 2013. That’s a third more than the \u003ca href=\"http://ec.europa.eu/eurostat/tgm/table.do?tab=table&init=1&language=en&pcode=t2020_rd300&plugin=1\">European Union average\u003c/a>.\u003c/p>\n\u003cp>For comparison, the \u003ca href=\"http://data.worldbank.org/indicator/EN.ATM.CO2E.PC\">average Indian\u003c/a> releases less than 2 tons a year, a figure that is rising as the country’s economy grows.\u003c/p>\n\u003cp>\u003cstrong>How will California hit its goals?\u003c/strong>\u003c/p>\n\u003cp>California runs a number of programs that help it reduce its climate pollution, including financial support for electric vehicle purchases, mandates on biofuels and requirements that utilities source a substantial amount of their power from renewable sources.\u003c/p>\n\u003cp>The new legislation requires the California Air Resources Board to strengthen these programs, or roll out new ones, to ensure that the new targets are met.\u003c/p>\n\u003cp>California also was among the first in the world to set up a cap-and-trade program, which imposes a limit on the amount of pollution that industry can release each year. By selling tradeable allowances needed to pollute, the state raises money that reduces electricity bills and that funds programs that can reduce climate pollution.\u003c/p>\n\u003cp>\u003cstrong>How is the cap-and-trade program faring?\u003c/strong>\u003c/p>\n\u003cp>The cap-and-trade program is withering like a Californian tomato left out in the sun.\u003c/p>\n\u003cp>One problem is that California’s notoriously dysfunctional legislature can’t agree on how to spend more than $1 billion in cap-and-trade funds, meaning the money is just sitting around instead of being put to work.\u003c/p>\n\u003cp>“It’s not like a savings account that we put in the bank and wait for retirement,” a frustrated Sen. Fran Pavley \u003ca href=\"http://www.latimes.com/politics/la-pol-sac-cap-trade-cash-businesses-20160817-snap-htmlstory.html\">recently opined\u003c/a> to the L.A. Times.\u003c/p>\n\u003cp>The final legislative sessions for the year are planned for next week, ahead of elections scheduled for November. Many hope the spending will be approved before the break.\u003c/p>\n\u003cp>“We still have a few more days,” the Environmental Defense Fund’s \u003ca href=\"https://www.edf.org/people/erica-morehouse\">Erica Morehouse\u003c/a> optimistically pointed out\u003c/p>\n\u003cp>\u003cstrong>Is that the biggest problem for cap-and-trade?\u003c/strong>\u003c/p>\n\u003cp>Not even close.\u003c/p>\n\u003cp>A bigger problem is that the cap-and-trade program expires at the end of 2020. \u003ca href=\"http://www.climatecentral.org/news/legal-doubts-over-californias-cap-and-trade-20607\">Legal experts have concluded\u003c/a> that a two-thirds vote from the Assembly and Senate may be needed to extend the program after 2020.\u003c/p>\n\u003cp>That could see the program destroyed just when it’s needed the most — to help achieve increasingly ambitious climate goals.\u003c/p>\n\u003cp>“The important thing to recognize about the post-2020 market in California is that the level of effort fundamentally changes,” Stanford expert \u003ca href=\"https://law.stanford.edu/directory/michael-wara/\">Michael Wara\u003c/a> said.\u003c/p>\n\u003cp>The unlikelihood of supermajority lawmaker support for cap-and-trade may help to explain why just a small portion of pollution allowances were sold during California’s last two quarterly auctions, reducing anticipated funds flowing into California by nearly $1 billion.\u003c/p>\n\u003cp>\u003cstrong>Can California’s cap-and-trade program be saved?\u003c/strong>\u003c/p>\n\u003cp>California officials have been reluctant to even admit that the legal conundrum exists, perhaps wary of weakening their position in a future court battle. This week, though, senior Brown advisor \u003ca href=\"http://www.climatecentral.org/news/program-in-doubt-as-california-climate-bill-approved--20628\">Nancy McFadden\u003c/a> suggested a ballot measure might help circumvent the need for supermajority lawmaker support.\u003c/p>\n\u003cp>When a reporter asked Brown about the future of cap-and-trade on Wednesday, he said he expects California’s business community will eventually demand that lawmakers support it, because it would provide an efficient way of helping to comply with the new law.\u003c/p>\n\u003cp>“I think a lot of it’s going to be driven by the business interests themselves,” Brown said. “They’re going to plead for a market system called cap-and-trade.”\u003c/p>\n\u003cp>Independent experts also point out the program could probably continue operating after 2020 under current law, but only if it hands out the pollution allowances for free. Such an idea is likely be opposed as a handout by Californian lawmakers.\u003c/p>\n\u003cp>\u003c/p>\n\u003cp>\u003ca href=\"http://www.climatecentral.org/\">\u003cspan style=\"font-weight: 400\">Climate Central\u003c/span>\u003c/a> \u003ci>\u003cspan style=\"font-weight: 400\">is an independent organization that researches and reports on climate change.\u003c/span>\u003c/i>\u003c/p>\n\n\u003c/div>\u003c/p>",
"attributes": {
"named": {},
"numeric": []
}
}
],
"link": "/science/946591/californias-new-climate-rules-explained",
"authors": [
"byline_science_946591"
],
"categories": [
"science_31",
"science_35",
"science_40"
],
"featImg": "science_946592",
"label": "source_science_946591"
},
"science_944002": {
"type": "posts",
"id": "science_944002",
"meta": {
"index": "posts_1716263798",
"site": "science",
"id": "944002",
"score": null,
"sort": [
1472150899000
]
},
"parent": 0,
"labelTerm": {
"site": "science"
},
"blocks": [],
"publishDate": 1472150899,
"format": "standard",
"title": "Human-Driven Global Warming Started as Early as the 1830s: Study",
"headTitle": "Human-Driven Global Warming Started as Early as the 1830s: Study | KQED",
"content": "\u003cp>To fully understand the warming of the planet that is being driven by human emissions of greenhouse gases, scientists need to examine the history of climate changes on Earth. Hampering this effort is the fact that direct measurements of temperature and other climate data only go back to about the late 19th century.\u003c/p>\n\u003cp>But by using records kept by the Earth itself, that history can be extended back hundreds or even thousands of years.\u003c/p>\n\u003cp>In a study published Wednesday in the journal Nature, a group of researchers has knitted together such natural records — found, for example, in coral reefs, ice sheets and caves. They used those records to trace the thread of human-driven warming back to what they say is its beginning, nearly 200 years ago, when the coal-burning that took off with the Industrial Revolution was still revving up.\u003c/p>\n\u003cp>Though the impact then on temperatures was small, it is measurable in certain regions, the researchers say.\u003c/p>\n\u003cp>Some climate scientists not involved in the research quibble with just how much of that early signal can actually be attributed to greenhouse gases. However, there is broad agreement that the study reinforces the importance of the starting point that is used when evaluating how much the Earth has already warmed and how close we are to breaching international climate goals.\u003c/p>\n\u003cfigure id=\"attachment_944019\" class=\"wp-caption aligncenter\" style=\"max-width: 400px\">\u003cimg loading=\"lazy\" decoding=\"async\" class=\"size-full wp-image-944019\" src=\"http://ww2.kqed.org/science/wp-content/uploads/sites/35/2016/08/8_24_16_Andrea_CC_icecore_400_533_s_c1_c_c.jpg\" alt=\"An ice core still sits inside a drill.\" width=\"400\" height=\"533\">\u003cfigcaption class=\"wp-caption-text\">An ice core still sits inside a drill. \u003ccite>(Nerilie Abram )\u003c/cite>\u003c/figcaption>\u003c/figure>\n\u003cp>“This early warming does mean that our instrumental records (which typically only begin in the 1880s) don’t allow us to see the picture of how humans have changed the climate,” study co-author Nerilie Abram, a paleoclimatologist at Australian National University, said in an email. “So when we are talking about targets of trying to limit climate warming to less than 1.5˚C, we are actually closer to that limit than what we would calculate from instrumental records alone.”\u003c/p>\n\u003ch3>\u003cstrong>What Is Pre-Industrial?\u003c/strong>\u003c/h3>\n\u003cp>When international negotiators forged an agreement last year on limiting temperature rise this century, they settled on a threshold of 2˚C from pre-industrial times (with some talk of tightening that limit to 1.5˚C). But exactly what period is picked to represent the pre-industrial era is key. Comparing temperatures today to the beginning of the instrumental record is problematic because at best that record goes back only to the 1880s, when some warming had likely already occurred.\u003c/p>\n\u003cp>[ad fullwidth]\u003c/p>\n\u003cp>But the Earth itself keeps records of how climate has changed over millennia, in the growth of coral reefs, the layers of ice laid down in glaciers, and the rings added each year to trees. The study authors worked with a consortium that has brought together records from different sources from spots all over the world and worked to put them together into a coherent picture of past climate change.\u003c/p>\n\u003cp>The record includes new reconstructions of sea surface temperatures, something often left out of such projects because of the difficulty of obtaining ocean records, Abram said.\u003c/p>\n\u003cp>The reconstruction allowed the group to examine global and regional temperature records going back 500 years. With that extended record, they picked the period 1622 to 1799 as their preindustrial era.\u003c/p>\n\u003cp>That period is “definitely before we really started burning any significant amount of fossil fuels,” NASA climate scientist Kate Marvel said.\u003c/p>\n\u003caside class=\"pullquote alignright\">‘The early warming is a small but detectable signal that can be explained by the small increases in greenhouse gases that were already happening in the mid 19th century.’\u003ccite>Nerilie Abram, Australian National University\u003c/cite>\u003c/aside>\n\u003cp>Using statistical analyses, the team picked out a small, but measureable, increase in temperatures as early as the 1830s for some regions, including the tropical oceans, as well as the Northern Hemisphere more broadly.\u003c/p>\n\u003cp>The findings are “further evidence that the climate has already changed significantly since the pre-industrial period,” Ed Hawkins, a climate scientist at the University of Reading in England, said in an email.\u003c/p>\n\u003ch3>\u003cstrong>Regional Differences\u003c/strong>\u003c/h3>\n\u003cp>These changes wouldn’t have been noticeable to people at the time. It was only in the 20th century that warming pushed the climate outside of what would be seen from natural variations. That natural variability also explains why the warming signal emerged first in the tropics — year-to-year variability in that region is very low, which means the signal is easier to tease out.\u003c/p>\n\u003cp>The study also found that the rate of warming of the tropical oceans was about the same as that of the continents in the Northern Hemisphere. Unsurprisingly, the Arctic showed the highest rate of warming.[contextly_sidebar id=”O7Ih1x43marWKs782O7VHmOuQ1dELSBB”]\u003c/p>\n\u003cp>Warming in the Southern Hemisphere, however, was delayed compared to the Northern Hemisphere in the reconstruction, though the researchers aren’t sure why, particularly as climate models don’t show that delay.\u003c/p>\n\u003cp>Some possible explanations include a higher variability of the Southern Hemisphere climate, as well as some unappreciated aspects of how sea ice might regulate the climate. There is also a relative dearth of data compared to the Northern Hemisphere.\u003c/p>\n\u003cp>More specifically, a clear warming signal has yet to emerge for Antarctica, which could be because the continent is somewhat isolated from broader climate changes by both atmospheric and oceanic currents that encircle it.\u003c/p>\n\u003cp>“Antarctica sort of does its own thing,” study co-author Nicholas McKay, a climatologist at Northern Arizona University, said.\u003c/p>\n\u003ch3>\u003cstrong>Baseline Matters\u003c/strong>\u003c/h3>\n\u003cp>The researchers were surprised that they found such an early onset of warming, both Abram and McKay said. At first they suspected that the initial warming was actually the climate rebounding from the cooling impact of two major volcanic eruptions in the early 1800s, and that greenhouse warming took over later.\u003c/p>\n\u003cp>“But by testing our methods, and by looking at when warming develops in climate model simulations where only greenhouse gases are changed, we were able to show that the early warming is a small but detectable signal that can be explained by the small increases in greenhouse gases that were already happening in the mid 19th century,” Abram said.\u003c/p>\n\u003cp>Michael Mann, a Penn State climatologist, who put together the famous “Hockey Stick” climate reconstruction, still thinks that more of that early warming is due to the rebound from volcanic cooling and that a more rigorous analysis is needed to tease out just how much warming can be attributed to greenhouse gas-driven warming.\u003c/p>\n\u003cfigure id=\"attachment_944020\" class=\"wp-caption aligncenter\" style=\"max-width: 800px\">\u003cimg loading=\"lazy\" decoding=\"async\" class=\"size-medium wp-image-944020\" src=\"http://ww2.kqed.org/science/wp-content/uploads/sites/35/2016/08/CC-hockeystickcurve_1050_727_s_c1_c_c-800x554.jpg\" alt='The so-called \"hockey stick\" graph, which shows temperatures both from the instrumental record (in red) and paleoclimate data.' width=\"800\" height=\"554\" srcset=\"https://cdn.kqed.org/wp-content/uploads/sites/35/2016/08/CC-hockeystickcurve_1050_727_s_c1_c_c-800x554.jpg 800w, https://cdn.kqed.org/wp-content/uploads/sites/35/2016/08/CC-hockeystickcurve_1050_727_s_c1_c_c-400x277.jpg 400w, https://cdn.kqed.org/wp-content/uploads/sites/35/2016/08/CC-hockeystickcurve_1050_727_s_c1_c_c-768x532.jpg 768w, https://cdn.kqed.org/wp-content/uploads/sites/35/2016/08/CC-hockeystickcurve_1050_727_s_c1_c_c-960x665.jpg 960w, https://cdn.kqed.org/wp-content/uploads/sites/35/2016/08/CC-hockeystickcurve_1050_727_s_c1_c_c.jpg 1050w\" sizes=\"(max-width: 800px) 100vw, 800px\">\u003cfigcaption class=\"wp-caption-text\">The so-called “hockey stick” graph, which shows temperatures both from the instrumental record (in red) and paleoclimate data. \u003ccite>(IPCC)\u003c/cite>\u003c/figcaption>\u003c/figure>\n\u003cp>In particular, Mann takes issue with a statement in the study that their findings indicate the Earth’s temperature may respond faster to changes in greenhouse gases levels than previously thought, which he says is “a really basic error in interpretation.”\u003c/p>\n\u003cp>Mann does agree, however, that warming goes back further than instrumental records can show and that today’s temperature rise should be compared to an earlier baseline than it currently is, or we risk underestimating warming. This was the point that other climate scientists said was the main contribution of the study.\u003c/p>\n\u003cp>[ad floatright]\u003c/p>\n\u003cp>\u003ca href=\"http://www.climatecentral.org/\">Climate Central\u003c/a> \u003cem>is an independent organization that researches and reports on climate change.\u003c/em>\u003c/p>\n\n",
"stats": {
"hasVideo": false,
"hasChartOrMap": false,
"hasAudio": false,
"hasPolis": false,
"wordCount": 1205,
"hasGoogleForm": false,
"hasGallery": false,
"hasHearkenModule": false,
"iframeSrcs": [],
"paragraphCount": 27
},
"modified": 1704929714,
"excerpt": "Climate models have been underestimating global warming, scientists say, in light of new research that shows an increase in temperatures as early as the 1830s for some regions.",
"headData": {
"twImgId": "",
"twTitle": "",
"ogTitle": "",
"ogImgId": "",
"twDescription": "",
"description": "Climate models have been underestimating global warming, scientists say, in light of new research that shows an increase in temperatures as early as the 1830s for some regions.",
"title": "Human-Driven Global Warming Started as Early as the 1830s: Study | KQED",
"ogDescription": "",
"schema": {
"@context": "https://schema.org",
"@type": "Article",
"headline": "Human-Driven Global Warming Started as Early as the 1830s: Study",
"datePublished": "2016-08-25T11:48:19-07:00",
"dateModified": "2024-01-10T15:35:14-08:00",
"image": "https://cdn.kqed.org/wp-content/uploads/2020/02/KQED-OG-Image@1x.png"
}
},
"guestAuthors": [],
"slug": "human-driven-global-warming-started-as-early-as-the-1830s-study",
"status": "publish",
"nprByline": "Andrea Thompson\u003c/br>Climate Central",
"sticky": false,
"path": "/science/944002/human-driven-global-warming-started-as-early-as-the-1830s-study",
"audioTrackLength": null,
"parsedContent": [
{
"type": "contentString",
"content": "\u003cdiv class=\"post-body\">\u003cp>\u003cp>To fully understand the warming of the planet that is being driven by human emissions of greenhouse gases, scientists need to examine the history of climate changes on Earth. Hampering this effort is the fact that direct measurements of temperature and other climate data only go back to about the late 19th century.\u003c/p>\n\u003cp>But by using records kept by the Earth itself, that history can be extended back hundreds or even thousands of years.\u003c/p>\n\u003cp>In a study published Wednesday in the journal Nature, a group of researchers has knitted together such natural records — found, for example, in coral reefs, ice sheets and caves. They used those records to trace the thread of human-driven warming back to what they say is its beginning, nearly 200 years ago, when the coal-burning that took off with the Industrial Revolution was still revving up.\u003c/p>\n\u003cp>Though the impact then on temperatures was small, it is measurable in certain regions, the researchers say.\u003c/p>\n\u003cp>Some climate scientists not involved in the research quibble with just how much of that early signal can actually be attributed to greenhouse gases. However, there is broad agreement that the study reinforces the importance of the starting point that is used when evaluating how much the Earth has already warmed and how close we are to breaching international climate goals.\u003c/p>\n\u003cfigure id=\"attachment_944019\" class=\"wp-caption aligncenter\" style=\"max-width: 400px\">\u003cimg loading=\"lazy\" decoding=\"async\" class=\"size-full wp-image-944019\" src=\"http://ww2.kqed.org/science/wp-content/uploads/sites/35/2016/08/8_24_16_Andrea_CC_icecore_400_533_s_c1_c_c.jpg\" alt=\"An ice core still sits inside a drill.\" width=\"400\" height=\"533\">\u003cfigcaption class=\"wp-caption-text\">An ice core still sits inside a drill. \u003ccite>(Nerilie Abram )\u003c/cite>\u003c/figcaption>\u003c/figure>\n\u003cp>“This early warming does mean that our instrumental records (which typically only begin in the 1880s) don’t allow us to see the picture of how humans have changed the climate,” study co-author Nerilie Abram, a paleoclimatologist at Australian National University, said in an email. “So when we are talking about targets of trying to limit climate warming to less than 1.5˚C, we are actually closer to that limit than what we would calculate from instrumental records alone.”\u003c/p>\n\u003ch3>\u003cstrong>What Is Pre-Industrial?\u003c/strong>\u003c/h3>\n\u003cp>When international negotiators forged an agreement last year on limiting temperature rise this century, they settled on a threshold of 2˚C from pre-industrial times (with some talk of tightening that limit to 1.5˚C). But exactly what period is picked to represent the pre-industrial era is key. Comparing temperatures today to the beginning of the instrumental record is problematic because at best that record goes back only to the 1880s, when some warming had likely already occurred.\u003c/p>\n\u003cp>\u003c/p>\u003c/div>",
"attributes": {
"named": {},
"numeric": []
}
},
{
"type": "component",
"content": "",
"name": "ad",
"attributes": {
"named": {
"label": "fullwidth"
},
"numeric": [
"fullwidth"
]
}
},
{
"type": "contentString",
"content": "\u003cdiv class=\"post-body\">\u003cp>\u003c/p>\n\u003cp>But the Earth itself keeps records of how climate has changed over millennia, in the growth of coral reefs, the layers of ice laid down in glaciers, and the rings added each year to trees. The study authors worked with a consortium that has brought together records from different sources from spots all over the world and worked to put them together into a coherent picture of past climate change.\u003c/p>\n\u003cp>The record includes new reconstructions of sea surface temperatures, something often left out of such projects because of the difficulty of obtaining ocean records, Abram said.\u003c/p>\n\u003cp>The reconstruction allowed the group to examine global and regional temperature records going back 500 years. With that extended record, they picked the period 1622 to 1799 as their preindustrial era.\u003c/p>\n\u003cp>That period is “definitely before we really started burning any significant amount of fossil fuels,” NASA climate scientist Kate Marvel said.\u003c/p>\n\u003caside class=\"pullquote alignright\">‘The early warming is a small but detectable signal that can be explained by the small increases in greenhouse gases that were already happening in the mid 19th century.’\u003ccite>Nerilie Abram, Australian National University\u003c/cite>\u003c/aside>\n\u003cp>Using statistical analyses, the team picked out a small, but measureable, increase in temperatures as early as the 1830s for some regions, including the tropical oceans, as well as the Northern Hemisphere more broadly.\u003c/p>\n\u003cp>The findings are “further evidence that the climate has already changed significantly since the pre-industrial period,” Ed Hawkins, a climate scientist at the University of Reading in England, said in an email.\u003c/p>\n\u003ch3>\u003cstrong>Regional Differences\u003c/strong>\u003c/h3>\n\u003cp>These changes wouldn’t have been noticeable to people at the time. It was only in the 20th century that warming pushed the climate outside of what would be seen from natural variations. That natural variability also explains why the warming signal emerged first in the tropics — year-to-year variability in that region is very low, which means the signal is easier to tease out.\u003c/p>\n\u003cp>The study also found that the rate of warming of the tropical oceans was about the same as that of the continents in the Northern Hemisphere. Unsurprisingly, the Arctic showed the highest rate of warming.\u003c/p>\u003cp>\u003c/p>\u003cp>\u003c/p>\n\u003cp>Warming in the Southern Hemisphere, however, was delayed compared to the Northern Hemisphere in the reconstruction, though the researchers aren’t sure why, particularly as climate models don’t show that delay.\u003c/p>\n\u003cp>Some possible explanations include a higher variability of the Southern Hemisphere climate, as well as some unappreciated aspects of how sea ice might regulate the climate. There is also a relative dearth of data compared to the Northern Hemisphere.\u003c/p>\n\u003cp>More specifically, a clear warming signal has yet to emerge for Antarctica, which could be because the continent is somewhat isolated from broader climate changes by both atmospheric and oceanic currents that encircle it.\u003c/p>\n\u003cp>“Antarctica sort of does its own thing,” study co-author Nicholas McKay, a climatologist at Northern Arizona University, said.\u003c/p>\n\u003ch3>\u003cstrong>Baseline Matters\u003c/strong>\u003c/h3>\n\u003cp>The researchers were surprised that they found such an early onset of warming, both Abram and McKay said. At first they suspected that the initial warming was actually the climate rebounding from the cooling impact of two major volcanic eruptions in the early 1800s, and that greenhouse warming took over later.\u003c/p>\n\u003cp>“But by testing our methods, and by looking at when warming develops in climate model simulations where only greenhouse gases are changed, we were able to show that the early warming is a small but detectable signal that can be explained by the small increases in greenhouse gases that were already happening in the mid 19th century,” Abram said.\u003c/p>\n\u003cp>Michael Mann, a Penn State climatologist, who put together the famous “Hockey Stick” climate reconstruction, still thinks that more of that early warming is due to the rebound from volcanic cooling and that a more rigorous analysis is needed to tease out just how much warming can be attributed to greenhouse gas-driven warming.\u003c/p>\n\u003cfigure id=\"attachment_944020\" class=\"wp-caption aligncenter\" style=\"max-width: 800px\">\u003cimg loading=\"lazy\" decoding=\"async\" class=\"size-medium wp-image-944020\" src=\"http://ww2.kqed.org/science/wp-content/uploads/sites/35/2016/08/CC-hockeystickcurve_1050_727_s_c1_c_c-800x554.jpg\" alt='The so-called \"hockey stick\" graph, which shows temperatures both from the instrumental record (in red) and paleoclimate data.' width=\"800\" height=\"554\" srcset=\"https://cdn.kqed.org/wp-content/uploads/sites/35/2016/08/CC-hockeystickcurve_1050_727_s_c1_c_c-800x554.jpg 800w, https://cdn.kqed.org/wp-content/uploads/sites/35/2016/08/CC-hockeystickcurve_1050_727_s_c1_c_c-400x277.jpg 400w, https://cdn.kqed.org/wp-content/uploads/sites/35/2016/08/CC-hockeystickcurve_1050_727_s_c1_c_c-768x532.jpg 768w, https://cdn.kqed.org/wp-content/uploads/sites/35/2016/08/CC-hockeystickcurve_1050_727_s_c1_c_c-960x665.jpg 960w, https://cdn.kqed.org/wp-content/uploads/sites/35/2016/08/CC-hockeystickcurve_1050_727_s_c1_c_c.jpg 1050w\" sizes=\"(max-width: 800px) 100vw, 800px\">\u003cfigcaption class=\"wp-caption-text\">The so-called “hockey stick” graph, which shows temperatures both from the instrumental record (in red) and paleoclimate data. \u003ccite>(IPCC)\u003c/cite>\u003c/figcaption>\u003c/figure>\n\u003cp>In particular, Mann takes issue with a statement in the study that their findings indicate the Earth’s temperature may respond faster to changes in greenhouse gases levels than previously thought, which he says is “a really basic error in interpretation.”\u003c/p>\n\u003cp>Mann does agree, however, that warming goes back further than instrumental records can show and that today’s temperature rise should be compared to an earlier baseline than it currently is, or we risk underestimating warming. This was the point that other climate scientists said was the main contribution of the study.\u003c/p>\n\u003cp>\u003c/p>\u003c/div>",
"attributes": {
"named": {},
"numeric": []
}
},
{
"type": "component",
"content": "",
"name": "ad",
"attributes": {
"named": {
"label": "floatright"
},
"numeric": [
"floatright"
]
}
},
{
"type": "contentString",
"content": "\u003cdiv class=\"post-body\">\u003cp>\u003c/p>\n\u003cp>\u003ca href=\"http://www.climatecentral.org/\">Climate Central\u003c/a> \u003cem>is an independent organization that researches and reports on climate change.\u003c/em>\u003c/p>\n\n\u003c/div>\u003c/p>",
"attributes": {
"named": {},
"numeric": []
}
}
],
"link": "/science/944002/human-driven-global-warming-started-as-early-as-the-1830s-study",
"authors": [
"byline_science_944002"
],
"categories": [
"science_31",
"science_35"
],
"tags": [
"science_194",
"science_556"
],
"featImg": "science_944018",
"label": "science"
},
"science_943904": {
"type": "posts",
"id": "science_943904",
"meta": {
"index": "posts_1716263798",
"site": "science",
"id": "943904",
"score": null,
"sort": [
1472146499000
]
},
"parent": 0,
"labelTerm": {},
"blocks": [],
"publishDate": 1472146499,
"format": "standard",
"title": "The Future of National Parks is Going to be a Lot Hotter",
"headTitle": "The Future of National Parks is Going to be a Lot Hotter | KQED",
"content": "\u003cp>Summertime is primetime for national parks. As snow melts, wildflowers bloom and waterfalls roar, generations of visitors have flocked to the natural wonders that dot the American landscape (to say nothing of all the amazing cultural sites the National Park Service protects).\u003c/p>\n\u003cp>The National Park Service was created a century ago — August 25, 1916 to be exact — to keep an eye on the growing treasure trove of national parks. It’s been a good century as more and more land has been set aside and annual visitors now number more than 300 million, but it’s also not been without challenges. Chief among them is \u003ca href=\"http://reports.climatecentral.org/nps/director/\">climate change\u003c/a>, which will drastically \u003ca href=\"http://reports.climatecentral.org/nps/quiz/\">alter national park landscapes\u003c/a> in the coming decades including cranking up the \u003ca href=\"http://www.climatecentral.org/gallery/graphics/100-years-of-warming-at-the-national-parks\">heat\u003c/a>.\u003c/p>\n\u003caside class=\"pullquote alignright\">Joshua Tree National Park in southern California will face the greatest geographical climate shift, with temperatures more like Abu Dhabi by 2100.\u003c/aside>\n\u003cp>As part of Climate Central’s ongoing \u003ca href=\"http://statesatrisk.org/\">States at Risk\u003c/a> project, we analyzed just how much hotter parks are projected to get later this century. We looked at the future summer temperatures in all the parks in the Lower 48 states except Dry Tortugas National Park (sorry, Fort Jefferson lovers!) assuming greenhouse gas emissions continue on their current trend.\u003c/p>\n\u003cp>The results could make you sweat. Parks are projected to have summers that are 8-12°F hotter by 2100. That means currently cool mountainous parks could be as hot as the plains. Parks in the Southeast, already a pretty hot place, will face even more extreme temperatures with a climate more like southern Texas. And otherworldly Joshua Tree National Park in southern California will face the greatest geographical climate shift, with temperatures more like Abu Dhabi by 2100.\u003c/p>\n\u003cp>We also analyzed how many more days with extreme heat the parks could face. \u003ca href=\"http://wxshift.com/climate-change/climate-indicators/extreme-heat\">Extreme heat\u003c/a> is a hallmark of global warming, and its impact will be most arresting in the national parks where people go, by design, to be outside in the summer. Like the rest of the country, parks are going to be seeing more dangerously hot days above 90°F, 95°F, and 100°F.\u003c/p>\n\u003cp>[ad fullwidth]\u003c/p>\n\u003cp>By 2100, the glaciers of Montana’s Glacier National Park \u003ca href=\"http://reports.climatecentral.org/nps/glacier/\">will be long gone\u003c/a> and rising temperatures will be one of the big reasons why. Visitors will not only have to contend with an ice-free landscape, but also hotter temperatures. Today the park sees an average of only one 90°F day each year. It could see 27 days with temperatures above 90°F by the end of the century.\u003c/p>\n\u003cp>Yosemite National Park, high in the Sierra Nevada mountains of California, currently sees about two weeks of 90°F weather every year. By 2050, it could see nearly a month of those temperatures, and by 2100 it could get nearly 50 such days each year.\u003c/p>\n\u003cp>And the Great Smoky Mountains, currently the most-visited National Park, could go from fewer than 10 days above 90°F each year, on average now, to three months with those scorching temperatures.\u003c/p>\n\u003cp>In numerous other parks, the number of days above 100°F is projected to skyrocket. Big Bend National Park in Texas could see more than 110 days above 100°F each year, on average. And Great Basin National Park in Nevada, which currently doesn’t have any days above 100°F in a typical year, could see a month of those temperatures each year by 2100.\u003c/p>\n\u003cp>It’s likely that parks on the more extreme end of the temperature scale will see a drop in summer visitation, but more visitors are \u003ca href=\"http://www.climatecentral.org/news/national-parks-warm-temps-19123\">likely to show up in fall\u003c/a> and spring when it won’t be fry-an-egg-on-the-sidewalk hot. That may stretch park resources thin as most parks are set up to handle summer crowds and quieter shoulder seasons. How parks deal with the change in visitation season is an open question.\u003c/p>\n\u003cp>And all this is to say nothing about the impacts extreme heat will have on the natural resources around which we created national parks in the first place. Joshua Tree could become too hot for its namesake trees and there’s evidence that extreme summer days could create more rockfalls in Yosemite, which could change the face of the stunning valley at the center of the park. \u003ca href=\"http://www.climatecentral.org/news/western-wildfires-climate-change-20475\">Wildfire risk\u003c/a> will also skyrocket across the West and could make summer park vacations not only more hot but \u003ca href=\"http://www.climatecentral.org/news/wildfires-national-park-service-birthday-19371\">more smoky\u003c/a>.\u003c/p>\n\u003cp>Those are just the most visible changes. Whole ecosystems are likely to be disrupted and there are consequences scientists probably haven’t even uncovered yet (those are the ones that \u003ca href=\"http://www.climatecentral.org/news/gradual-climate-changes-could-cause-sudden-impacts-16792\">could be the worst\u003c/a> since we’ll be least prepared).\u003c/p>\n\u003cp>Despite the daunting situation facing the National Park Service in its second century, there are signs it’s up for the challenge. It’s already addressing climate change from \u003ca href=\"http://reports.climatecentral.org/nps/new-york-parks-sea-level-rise/\">the coast\u003c/a> to the \u003ca href=\"http://reports.climatecentral.org/nps/glacier/\">high mountains\u003c/a> and has an \u003ca href=\"http://reports.climatecentral.org/nps/overview/\">A-Team team of experts\u003c/a> to help parks answer the gnarly questions they face.\u003c/p>\n\u003cp>There’s no denying that national parks will look a lot different by the end of the century, but that won’t make them any less a part of the fabric of American identity.\u003c/p>\n\u003cp>\u003ca href=\"http://www.climatecentral.org/\">Climate Central\u003c/a> \u003cem>is an independent organization that researches and reports on climate change.\u003c/em>\u003c/p>\n\u003cp>\u003cem>Analysis by James Bronzan and Alyson Kenward, PhD.\u003c/em>\u003c/p>\n\u003cp>\u003c/p>\n\u003cp>\u003cem>\u003cstrong>Methodology:\u003c/strong>\u003cem> Future temperatures for 47 National Parks were calculated based on the median of 29 spatially downscaled climate models (CMIP5) at 1/8 degree scale, then averaged within park boundaries. National parks in Alaska and Hawaii, along with Dry Tortugas National Park, were excluded because projections at this resolution were unavailable. Temperatures for 2050 are based on the 20-year average of 2041-2060 and for 2100 are based on the period 2080-2099. Projected temperatures assume that greenhouse gas emissions continue at their current rate (RCP8.5). The interactive map features the average summer daily high temperature (June-August), while days over 90\u003csup>o\u003c/sup>F, 95\u003csup>o\u003c/sup>F, and 100\u003csup>o\u003c/sup>F were counted annually. The current period values for parks and climate divisions are based on the 1991-2010 average calculated using a gridded observational dataset by Ed Maurer of Santa Clara University. \u003c/em>\u003c/em>\u003c/p>\n\n",
"stats": {
"hasVideo": false,
"hasChartOrMap": false,
"hasAudio": false,
"hasPolis": false,
"wordCount": 1049,
"hasGoogleForm": false,
"hasGallery": false,
"hasHearkenModule": false,
"iframeSrcs": [],
"paragraphCount": 19
},
"modified": 1704929716,
"excerpt": "National Parks' physical boundaries might not change, but their climate boundaries will as the world warms.",
"headData": {
"twImgId": "",
"twTitle": "",
"ogTitle": "",
"ogImgId": "",
"twDescription": "",
"description": "National Parks' physical boundaries might not change, but their climate boundaries will as the world warms.",
"title": "The Future of National Parks is Going to be a Lot Hotter | KQED",
"ogDescription": "",
"schema": {
"@context": "https://schema.org",
"@type": "Article",
"headline": "The Future of National Parks is Going to be a Lot Hotter",
"datePublished": "2016-08-25T10:34:59-07:00",
"dateModified": "2024-01-10T15:35:16-08:00",
"image": "https://cdn.kqed.org/wp-content/uploads/2020/02/KQED-OG-Image@1x.png"
}
},
"guestAuthors": [],
"slug": "the-future-of-national-parks-is-going-to-be-a-lot-hotter",
"status": "publish",
"sourceUrl": "http://www.climatecentral.org/",
"nprByline": "Brian Kahn\u003c/br>Climate Central",
"sticky": false,
"source": "Climate Central",
"path": "/science/943904/the-future-of-national-parks-is-going-to-be-a-lot-hotter",
"audioTrackLength": null,
"parsedContent": [
{
"type": "contentString",
"content": "\u003cdiv class=\"post-body\">\u003cp>\u003cp>Summertime is primetime for national parks. As snow melts, wildflowers bloom and waterfalls roar, generations of visitors have flocked to the natural wonders that dot the American landscape (to say nothing of all the amazing cultural sites the National Park Service protects).\u003c/p>\n\u003cp>The National Park Service was created a century ago — August 25, 1916 to be exact — to keep an eye on the growing treasure trove of national parks. It’s been a good century as more and more land has been set aside and annual visitors now number more than 300 million, but it’s also not been without challenges. Chief among them is \u003ca href=\"http://reports.climatecentral.org/nps/director/\">climate change\u003c/a>, which will drastically \u003ca href=\"http://reports.climatecentral.org/nps/quiz/\">alter national park landscapes\u003c/a> in the coming decades including cranking up the \u003ca href=\"http://www.climatecentral.org/gallery/graphics/100-years-of-warming-at-the-national-parks\">heat\u003c/a>.\u003c/p>\n\u003caside class=\"pullquote alignright\">Joshua Tree National Park in southern California will face the greatest geographical climate shift, with temperatures more like Abu Dhabi by 2100.\u003c/aside>\n\u003cp>As part of Climate Central’s ongoing \u003ca href=\"http://statesatrisk.org/\">States at Risk\u003c/a> project, we analyzed just how much hotter parks are projected to get later this century. We looked at the future summer temperatures in all the parks in the Lower 48 states except Dry Tortugas National Park (sorry, Fort Jefferson lovers!) assuming greenhouse gas emissions continue on their current trend.\u003c/p>\n\u003cp>The results could make you sweat. Parks are projected to have summers that are 8-12°F hotter by 2100. That means currently cool mountainous parks could be as hot as the plains. Parks in the Southeast, already a pretty hot place, will face even more extreme temperatures with a climate more like southern Texas. And otherworldly Joshua Tree National Park in southern California will face the greatest geographical climate shift, with temperatures more like Abu Dhabi by 2100.\u003c/p>\n\u003cp>We also analyzed how many more days with extreme heat the parks could face. \u003ca href=\"http://wxshift.com/climate-change/climate-indicators/extreme-heat\">Extreme heat\u003c/a> is a hallmark of global warming, and its impact will be most arresting in the national parks where people go, by design, to be outside in the summer. Like the rest of the country, parks are going to be seeing more dangerously hot days above 90°F, 95°F, and 100°F.\u003c/p>\n\u003cp>\u003c/p>\u003c/div>",
"attributes": {
"named": {},
"numeric": []
}
},
{
"type": "component",
"content": "",
"name": "ad",
"attributes": {
"named": {
"label": "fullwidth"
},
"numeric": [
"fullwidth"
]
}
},
{
"type": "contentString",
"content": "\u003cdiv class=\"post-body\">\u003cp>\u003c/p>\n\u003cp>By 2100, the glaciers of Montana’s Glacier National Park \u003ca href=\"http://reports.climatecentral.org/nps/glacier/\">will be long gone\u003c/a> and rising temperatures will be one of the big reasons why. Visitors will not only have to contend with an ice-free landscape, but also hotter temperatures. Today the park sees an average of only one 90°F day each year. It could see 27 days with temperatures above 90°F by the end of the century.\u003c/p>\n\u003cp>Yosemite National Park, high in the Sierra Nevada mountains of California, currently sees about two weeks of 90°F weather every year. By 2050, it could see nearly a month of those temperatures, and by 2100 it could get nearly 50 such days each year.\u003c/p>\n\u003cp>And the Great Smoky Mountains, currently the most-visited National Park, could go from fewer than 10 days above 90°F each year, on average now, to three months with those scorching temperatures.\u003c/p>\n\u003cp>In numerous other parks, the number of days above 100°F is projected to skyrocket. Big Bend National Park in Texas could see more than 110 days above 100°F each year, on average. And Great Basin National Park in Nevada, which currently doesn’t have any days above 100°F in a typical year, could see a month of those temperatures each year by 2100.\u003c/p>\n\u003cp>It’s likely that parks on the more extreme end of the temperature scale will see a drop in summer visitation, but more visitors are \u003ca href=\"http://www.climatecentral.org/news/national-parks-warm-temps-19123\">likely to show up in fall\u003c/a> and spring when it won’t be fry-an-egg-on-the-sidewalk hot. That may stretch park resources thin as most parks are set up to handle summer crowds and quieter shoulder seasons. How parks deal with the change in visitation season is an open question.\u003c/p>\n\u003cp>And all this is to say nothing about the impacts extreme heat will have on the natural resources around which we created national parks in the first place. Joshua Tree could become too hot for its namesake trees and there’s evidence that extreme summer days could create more rockfalls in Yosemite, which could change the face of the stunning valley at the center of the park. \u003ca href=\"http://www.climatecentral.org/news/western-wildfires-climate-change-20475\">Wildfire risk\u003c/a> will also skyrocket across the West and could make summer park vacations not only more hot but \u003ca href=\"http://www.climatecentral.org/news/wildfires-national-park-service-birthday-19371\">more smoky\u003c/a>.\u003c/p>\n\u003cp>Those are just the most visible changes. Whole ecosystems are likely to be disrupted and there are consequences scientists probably haven’t even uncovered yet (those are the ones that \u003ca href=\"http://www.climatecentral.org/news/gradual-climate-changes-could-cause-sudden-impacts-16792\">could be the worst\u003c/a> since we’ll be least prepared).\u003c/p>\n\u003cp>Despite the daunting situation facing the National Park Service in its second century, there are signs it’s up for the challenge. It’s already addressing climate change from \u003ca href=\"http://reports.climatecentral.org/nps/new-york-parks-sea-level-rise/\">the coast\u003c/a> to the \u003ca href=\"http://reports.climatecentral.org/nps/glacier/\">high mountains\u003c/a> and has an \u003ca href=\"http://reports.climatecentral.org/nps/overview/\">A-Team team of experts\u003c/a> to help parks answer the gnarly questions they face.\u003c/p>\n\u003cp>There’s no denying that national parks will look a lot different by the end of the century, but that won’t make them any less a part of the fabric of American identity.\u003c/p>\n\u003cp>\u003ca href=\"http://www.climatecentral.org/\">Climate Central\u003c/a> \u003cem>is an independent organization that researches and reports on climate change.\u003c/em>\u003c/p>\n\u003cp>\u003cem>Analysis by James Bronzan and Alyson Kenward, PhD.\u003c/em>\u003c/p>\n\u003cp>\u003c/p>\n\u003cp>\u003cem>\u003cstrong>Methodology:\u003c/strong>\u003cem> Future temperatures for 47 National Parks were calculated based on the median of 29 spatially downscaled climate models (CMIP5) at 1/8 degree scale, then averaged within park boundaries. National parks in Alaska and Hawaii, along with Dry Tortugas National Park, were excluded because projections at this resolution were unavailable. Temperatures for 2050 are based on the 20-year average of 2041-2060 and for 2100 are based on the period 2080-2099. Projected temperatures assume that greenhouse gas emissions continue at their current rate (RCP8.5). The interactive map features the average summer daily high temperature (June-August), while days over 90\u003csup>o\u003c/sup>F, 95\u003csup>o\u003c/sup>F, and 100\u003csup>o\u003c/sup>F were counted annually. The current period values for parks and climate divisions are based on the 1991-2010 average calculated using a gridded observational dataset by Ed Maurer of Santa Clara University. \u003c/em>\u003c/em>\u003c/p>\n\n\u003c/div>\u003c/p>",
"attributes": {
"named": {},
"numeric": []
}
}
],
"link": "/science/943904/the-future-of-national-parks-is-going-to-be-a-lot-hotter",
"authors": [
"byline_science_943904"
],
"series": [
"science_3081",
"science_3259"
],
"categories": [
"science_31",
"science_35",
"science_40"
],
"featImg": "science_943995",
"label": "source_science_943904"
},
"science_931634": {
"type": "posts",
"id": "science_931634",
"meta": {
"index": "posts_1716263798",
"site": "science",
"id": "931634",
"score": null,
"sort": [
1471643996000
]
},
"parent": 0,
"labelTerm": {},
"blocks": [],
"publishDate": 1471643996,
"format": "standard",
"title": "Western Fires May Sicken More People As Climate Warms",
"headTitle": "Western Fires May Sicken More People As Climate Warms | KQED",
"content": "\u003cp>Shrouded by smoke from a fire in California’s parched San Bernardino Mountains, schools in the Victor Valley closed their doors last week. The Pilot Fire was contained on Monday — shortly before the \u003ca href=\"http://www.latimes.com/local/lanow/la-me-ln-blue-cut-fire-20160819-snap-story.html\">Blue Cut Fire\u003c/a> broke out, billowing soot and ash over the valley afresh, forcing further closures.\u003c/p>\n\u003cp>“This is a pretty unprecedented situation,” said \u003ca href=\"http://www.mdaqmd.ca.gov/index.aspx?recordid=70&page=38\">Violette Roberts\u003c/a>, a Mojave Desert Air Quality Management District official whose job involves warning residents in the area about air pollution. On Monday, “the sky had turned dark,” she said. “It looked like it was sunset most of the day.”\u003c/p>\n\u003caside class=\"pullquote alignright\">A “smoke wave” describes the type of multiday impacts from wildfire pollution that were experienced this month in the Victor Valley.\u003c/aside>\n\u003cp>As the district warned valley residents to “limit time spent outdoors” and to seek medical care for respiratory ailments, school and health clinic closures and canceled sporting events were reminders that health impacts from wildfires carry further than the flames.\u003c/p>\n\u003cp>In the West, where populations living near forests and scrublands are growing, global warming is \u003ca href=\"http://www.climatecentral.org/news/western-wildfires-climate-change-20475\">projected to fuel worsening wildfires\u003c/a>, mostly by drying out the land. Research published this week showed how those forces will combine to cause wildfire pollution to threaten tens of millions more people during the years ahead than are currently at risk.\u003c/p>\n\u003cp>“When you have a wildfire, like a really bad wildfire, you can see that the air quality is reduced,” said \u003ca href=\"http://csu-cvmbs.colostate.edu/academics/erhs/Pages/brooke-anderson.aspx\">Brooke Anderson\u003c/a>, a Colorado State University epidemiologist who worked on the new study, \u003ca href=\"http://link.springer.com/article/10.1007%2Fs10584-016-1762-6\">published in the journal Climatic Change\u003c/a>. “These ambient air pollutants can reach a lot of people.”\u003c/p>\n\u003cp>[ad fullwidth]\u003c/p>\n\u003cp>Researchers like Anderson have taken to using the term “smoke wave” to describe the type of multiday impacts from wildfire pollution that were experienced this month in the Victor Valley. The valley contains hundreds of thousands of residents as well as the thoroughfare linking Las Vegas with Los Angeles.\u003c/p>\n\u003cp>Anderson and scientists from Yale and Harvard calculated that 82 million residents of the West will experience smoke waves that are two days or longer during a six-year period beginning in the late 2040s. That’s a 44 percent increase from a six-year period last decade.\u003c/p>\n\u003cp>“We discovered that, indeed, fires will become worse in the future, and that the number of people exposed to what we call smoke waves increases by about 35 million,” said \u003ca href=\"https://www.seas.harvard.edu/directory/mickley\">Loretta Mickley\u003c/a>, an atmospheric chemist at Harvard who helped lead the study.\u003c/p>\n\u003cp>The researchers combined population projections with the outputs of models designed to predict fire risks as greenhouse gas pollution continues to build up in the atmosphere. They also used a model to project the spread of plumes of air pollution from the flames.\u003c/p>\n\u003cp>On a per-county average, the group estimated that the number of smoke waves experienced in the West will increase to about 1.5 each year by the 2050s, up from about one today. The smoke waves are also projected to become more intense — with air pollution during the worst smoke waves expected to worsen more than 400 percent.\u003c/p>\n\u003cp>Not all counties will be equally affected. Some may experience fewer smoke waves as the climate changes, though most were projected to experience worsening conditions. Communities located in or near forests face the worst impacts.\u003c/p>\n\u003cp>“Arizona does get much bigger fires in the future, but because it’s so grassy there, there’s not a lot of fuel for those big fires,” Mickley said. “These fires can threaten homes, but you don’t get the same massive smoke events.”\u003c/p>\n\u003cp>The research was lauded by other scientists for its sophisticated and novel approach.\u003c/p>\n\u003cp>“It’s as good if not better than anyone else is doing,” said \u003ca href=\"https://staff.ucar.edu/users/christin\">Christine Wiedinmyer\u003c/a>, a National Center for Atmospheric Research scientist who was not involved with the study. “They’ve come up with a nice way of predicting fires — both now and into the future.”\u003c/p>\n\u003cp>Wiedinmyer said the findings point to a need to better manage Western forests with more prescribed burns, which simulate natural conditions and clear forest floors of potential fuel. “Of course, you’re going to get emissions there,” she said, but risks of smoke waves from wildfires “might be reduced.”\u003c/p>\n\u003cp>The research focused on fine sky-darkening particles called PM2.5 pollution. Such pollution is \u003ca href=\"http://www.who.int/mediacentre/news/releases/2014/air-pollution/en/\">one of the world’s main killers\u003c/a>, posing risks in particular to children, the elderly and the sick. It’s released by fossil fuel-burning power plants, internal combustion engines and wood burning.\u003c/p>\n\u003cp>“This type of approach provides a much more expansive and complete view of the potential consequences for humans as we change our climate,” said \u003ca href=\"http://www.u.arizona.edu/~kanchukaitis/people.html\">Kevin Anchukaitis\u003c/a>, a climatologist and geographer at the University of Arizona who wasn’t involved with the study. “It shows the complicated yet robust link between climate change and human health.”\u003c/p>\n\u003cp>The scientists didn’t focus on other kinds of air pollution created by wildfires, such as chemicals that combine in the atmosphere to form ozone pollution.\u003c/p>\n\u003cp>\u003c/p>\n\u003cp>“The direct effects on human health would be much greater for PM2.5 than for the ozone,” said \u003ca href=\"http://science.gsfc.nasa.gov/sed/bio/lesley.e.ott\">Lesley Ott\u003c/a>, a scientist at NASA who wasn’t involved with the study. “This is probably the most direct threat to human health.”\u003c/p>\n\n",
"stats": {
"hasVideo": false,
"hasChartOrMap": false,
"hasAudio": false,
"hasPolis": false,
"wordCount": 918,
"hasGoogleForm": false,
"hasGallery": false,
"hasHearkenModule": false,
"iframeSrcs": [],
"paragraphCount": 21
},
"modified": 1704929745,
"excerpt": null,
"headData": {
"twImgId": "",
"twTitle": "",
"ogTitle": "",
"ogImgId": "",
"twDescription": "",
"description": "Shrouded by smoke from a fire in California’s parched San Bernardino Mountains, schools in the Victor Valley closed their doors last week. The Pilot Fire was contained on Monday — shortly before the Blue Cut Fire broke out, billowing soot and ash over the valley afresh, forcing further closures. “This is a pretty unprecedented situation,”",
"title": "Western Fires May Sicken More People As Climate Warms | KQED",
"ogDescription": "",
"schema": {
"@context": "https://schema.org",
"@type": "Article",
"headline": "Western Fires May Sicken More People As Climate Warms",
"datePublished": "2016-08-19T14:59:56-07:00",
"dateModified": "2024-01-10T15:35:45-08:00",
"image": "https://cdn.kqed.org/wp-content/uploads/2020/02/KQED-OG-Image@1x.png"
}
},
"guestAuthors": [],
"slug": "western-fires-may-sicken-more-people-as-climate-warms",
"status": "publish",
"sourceUrl": "http://www.climatecentral.org/",
"nprByline": "John Upton\u003c/br>Climate Central",
"sticky": false,
"source": "Climate Central",
"path": "/science/931634/western-fires-may-sicken-more-people-as-climate-warms",
"audioTrackLength": null,
"parsedContent": [
{
"type": "contentString",
"content": "\u003cdiv class=\"post-body\">\u003cp>\u003cp>Shrouded by smoke from a fire in California’s parched San Bernardino Mountains, schools in the Victor Valley closed their doors last week. The Pilot Fire was contained on Monday — shortly before the \u003ca href=\"http://www.latimes.com/local/lanow/la-me-ln-blue-cut-fire-20160819-snap-story.html\">Blue Cut Fire\u003c/a> broke out, billowing soot and ash over the valley afresh, forcing further closures.\u003c/p>\n\u003cp>“This is a pretty unprecedented situation,” said \u003ca href=\"http://www.mdaqmd.ca.gov/index.aspx?recordid=70&page=38\">Violette Roberts\u003c/a>, a Mojave Desert Air Quality Management District official whose job involves warning residents in the area about air pollution. On Monday, “the sky had turned dark,” she said. “It looked like it was sunset most of the day.”\u003c/p>\n\u003caside class=\"pullquote alignright\">A “smoke wave” describes the type of multiday impacts from wildfire pollution that were experienced this month in the Victor Valley.\u003c/aside>\n\u003cp>As the district warned valley residents to “limit time spent outdoors” and to seek medical care for respiratory ailments, school and health clinic closures and canceled sporting events were reminders that health impacts from wildfires carry further than the flames.\u003c/p>\n\u003cp>In the West, where populations living near forests and scrublands are growing, global warming is \u003ca href=\"http://www.climatecentral.org/news/western-wildfires-climate-change-20475\">projected to fuel worsening wildfires\u003c/a>, mostly by drying out the land. Research published this week showed how those forces will combine to cause wildfire pollution to threaten tens of millions more people during the years ahead than are currently at risk.\u003c/p>\n\u003cp>“When you have a wildfire, like a really bad wildfire, you can see that the air quality is reduced,” said \u003ca href=\"http://csu-cvmbs.colostate.edu/academics/erhs/Pages/brooke-anderson.aspx\">Brooke Anderson\u003c/a>, a Colorado State University epidemiologist who worked on the new study, \u003ca href=\"http://link.springer.com/article/10.1007%2Fs10584-016-1762-6\">published in the journal Climatic Change\u003c/a>. “These ambient air pollutants can reach a lot of people.”\u003c/p>\n\u003cp>\u003c/p>\u003c/div>",
"attributes": {
"named": {},
"numeric": []
}
},
{
"type": "component",
"content": "",
"name": "ad",
"attributes": {
"named": {
"label": "fullwidth"
},
"numeric": [
"fullwidth"
]
}
},
{
"type": "contentString",
"content": "\u003cdiv class=\"post-body\">\u003cp>\u003c/p>\n\u003cp>Researchers like Anderson have taken to using the term “smoke wave” to describe the type of multiday impacts from wildfire pollution that were experienced this month in the Victor Valley. The valley contains hundreds of thousands of residents as well as the thoroughfare linking Las Vegas with Los Angeles.\u003c/p>\n\u003cp>Anderson and scientists from Yale and Harvard calculated that 82 million residents of the West will experience smoke waves that are two days or longer during a six-year period beginning in the late 2040s. That’s a 44 percent increase from a six-year period last decade.\u003c/p>\n\u003cp>“We discovered that, indeed, fires will become worse in the future, and that the number of people exposed to what we call smoke waves increases by about 35 million,” said \u003ca href=\"https://www.seas.harvard.edu/directory/mickley\">Loretta Mickley\u003c/a>, an atmospheric chemist at Harvard who helped lead the study.\u003c/p>\n\u003cp>The researchers combined population projections with the outputs of models designed to predict fire risks as greenhouse gas pollution continues to build up in the atmosphere. They also used a model to project the spread of plumes of air pollution from the flames.\u003c/p>\n\u003cp>On a per-county average, the group estimated that the number of smoke waves experienced in the West will increase to about 1.5 each year by the 2050s, up from about one today. The smoke waves are also projected to become more intense — with air pollution during the worst smoke waves expected to worsen more than 400 percent.\u003c/p>\n\u003cp>Not all counties will be equally affected. Some may experience fewer smoke waves as the climate changes, though most were projected to experience worsening conditions. Communities located in or near forests face the worst impacts.\u003c/p>\n\u003cp>“Arizona does get much bigger fires in the future, but because it’s so grassy there, there’s not a lot of fuel for those big fires,” Mickley said. “These fires can threaten homes, but you don’t get the same massive smoke events.”\u003c/p>\n\u003cp>The research was lauded by other scientists for its sophisticated and novel approach.\u003c/p>\n\u003cp>“It’s as good if not better than anyone else is doing,” said \u003ca href=\"https://staff.ucar.edu/users/christin\">Christine Wiedinmyer\u003c/a>, a National Center for Atmospheric Research scientist who was not involved with the study. “They’ve come up with a nice way of predicting fires — both now and into the future.”\u003c/p>\n\u003cp>Wiedinmyer said the findings point to a need to better manage Western forests with more prescribed burns, which simulate natural conditions and clear forest floors of potential fuel. “Of course, you’re going to get emissions there,” she said, but risks of smoke waves from wildfires “might be reduced.”\u003c/p>\n\u003cp>The research focused on fine sky-darkening particles called PM2.5 pollution. Such pollution is \u003ca href=\"http://www.who.int/mediacentre/news/releases/2014/air-pollution/en/\">one of the world’s main killers\u003c/a>, posing risks in particular to children, the elderly and the sick. It’s released by fossil fuel-burning power plants, internal combustion engines and wood burning.\u003c/p>\n\u003cp>“This type of approach provides a much more expansive and complete view of the potential consequences for humans as we change our climate,” said \u003ca href=\"http://www.u.arizona.edu/~kanchukaitis/people.html\">Kevin Anchukaitis\u003c/a>, a climatologist and geographer at the University of Arizona who wasn’t involved with the study. “It shows the complicated yet robust link between climate change and human health.”\u003c/p>\n\u003cp>The scientists didn’t focus on other kinds of air pollution created by wildfires, such as chemicals that combine in the atmosphere to form ozone pollution.\u003c/p>\n\u003cp>\u003c/p>\n\u003cp>“The direct effects on human health would be much greater for PM2.5 than for the ozone,” said \u003ca href=\"http://science.gsfc.nasa.gov/sed/bio/lesley.e.ott\">Lesley Ott\u003c/a>, a scientist at NASA who wasn’t involved with the study. “This is probably the most direct threat to human health.”\u003c/p>\n\n\u003c/div>\u003c/p>",
"attributes": {
"named": {},
"numeric": []
}
}
],
"link": "/science/931634/western-fires-may-sicken-more-people-as-climate-warms",
"authors": [
"byline_science_931634"
],
"categories": [
"science_31",
"science_40"
],
"featImg": "science_931732",
"label": "source_science_931634"
},
"science_929276": {
"type": "posts",
"id": "science_929276",
"meta": {
"index": "posts_1716263798",
"site": "science",
"id": "929276",
"score": null,
"sort": [
1471546797000
]
},
"parent": 0,
"labelTerm": {},
"blocks": [],
"publishDate": 1471546797,
"format": "standard",
"title": "California Climate Program Faces Uncertain Future Beyond 2020",
"headTitle": "California Climate Program Faces Uncertain Future Beyond 2020 | KQED",
"content": "\u003cp>The opinion of lawyers working for California’s lawmakers became clear in the spring. Without new laws, the state’s prominent cap-and-trade program would be dead after 2020.\u003c/p>\n\u003cp>Such a legal reality could put an end to the pollution reduction program, and with it billions in anticipated revenues and some of the Golden State’s vaunted global leadership on climate action.\u003c/p>\n\u003cp>[contextly_sidebar id=”GcfCjQQ8BZLuU22X1BlTnXqsfQx2AtKu”]Four months after the legislators’ law office \u003ca href=\"http://assets.climatecentral.org/pdfs/August2016_Upton_CapAndTradeLaw.pdf\">concluded\u003c/a> “the plain language” of state law dictates that the state’s cap-and-trade program “may not be applied or used” after 2020, officials in Gov. Jerry Brown’s administration are publicly ignoring the vexing legal questions affecting the flagship program’s future.\u003c/p>\n\u003cp>Under a \u003ca href=\"http://www.arb.ca.gov/regact/2016/capandtrade16/isor.pdf\">proposal prepared this month\u003c/a> by the California Air Resources Board, the cap-and-trade program that it oversees would simply continue operating beyond 2020 — without lawmaker blessing.\u003c/p>\n\u003cp>“They will absolutely be sued,” said \u003ca href=\"http://www.ghgpolicy.org/about/\">Danny Cullenward\u003c/a>, an energy economist and lawyer who researches climate policies at the Carnegie Institution for Science in Silicon Valley. “This is not a secret what they’re doing. The opponents of the system are well aware.”\u003c/p>\n\u003cp>[ad fullwidth]\u003c/p>\n\u003cp>California’s cap-and-trade program was launched in late 2012, immediately becoming one of the world’s highest-profile efforts to cap the amount of climate pollution released by an economy. Permits to release some of the allowed pollution are called allowances, and they’re auctioned off, then traded among large polluters and speculators, raising funds for state programs.\u003c/p>\n\u003cp>The results of California’s biggest cap-and-trade auction yet, which was held electronically Tuesday following the flop of a May auction that fell hundreds of millions of dollars short of expectations, may provide clues as to whether polluters expect the program to survive into 2021.\u003c/p>\n\u003cp>Even as California officials are outwardly nonchalant about the profound legal challenges, behind the scenes they are scrambling to find solutions, quietly consulting outside experts as they attempt to unearth a regulatory fix that could bypass lawmakers without falling afoul of existing law.\u003c/p>\n\u003cp>The \u003ca href=\"http://www.sacbee.com/news/politics-government/capitol-alert/article95752577.html\">Sacramento Bee reported Monday\u003c/a> that Brown’s office may amend high-profile climate legislation to extend cap-and-trade. For now, though, state officials are simply denying to the public that a legal problem even exists.\u003c/p>\n\u003cp>The cap-and-trade program was created by a 2006 climate law, \u003ca href=\"http://www.leginfo.ca.gov/pub/05-06/bill/asm/ab_0001-0050/ab_32_bill_20060927_chaptered.pdf\">AB32\u003c/a>, which stated that the “market-based” system for achieving pollution cuts was “applicable” until the end of 2020. The law requires that state officials “make recommendations” to lawmakers for reducing greenhouse gas emissions after that time.\u003c/p>\n\u003cp>Because of a \u003ca href=\"http://www.lao.ca.gov/ballot/2010/26_11_2010.aspx\">proposition passed\u003c/a> by state voters in 2010 regarding fees and taxes, lawmaker approval of a new or extended cap-and-trade program may require a two-thirds majority.\u003c/p>\n\u003cp>“The legal crisis is, ‘How do we fix that problem?’” Cullenward said. “The Air Resources Board is saying, ‘Oh, we don’t need any new authority, because we’ve got it — we just won’t really tell you what it is.’ ”\u003c/p>\n\u003cp>The board published a \u003ca href=\"http://www.arb.ca.gov/regact/2016/capandtrade16/appa.pdf\">334-page proposal\u003c/a> this month to extend cap-and-trade beyond 2020. It will be debated by the board’s directors next month.\u003c/p>\n\u003cp>The proposal doesn’t provide anything resembling a detailed legal defense. Instead, it notes that “the intent” of the legislature was stated in AB32 as being to “maintain and continue reductions” in climate pollution after 2020.\u003c/p>\n\u003cp>“We believe that under AB32 we have the legal authority to move forward,” Stanley Young, a spokesman for the board, said. “Climate change will not end in 2020, and AB32 explicitly states the intent to ‘maintain and continue reductions in emissions of greenhouse gases beyond 2020.’”\u003c/p>\n\u003cp>Young said the board’s legal position was “developed following a thorough review of the law by our lawyers.” Requests to interview lawyers or review detailed legal briefs were declined.\u003c/p>\n\u003cp>Doubts over cap-and-trade’s future are coinciding with \u003ca href=\"http://www.eenews.net/climatewire/2016/08/15/stories/1060041591\">long-running legislative battles\u003c/a> in Sacramento over efforts to enact California climate laws affecting the period after 2020.\u003c/p>\n\u003cp>Some lawmakers are pushing to require greenhouse gas emissions in the state be reduced to 40 percent below 1990 levels by 2030 — similar to plans adopted last year in the European Union. The legislation is strongly supported by Brown.\u003c/p>\n\u003cp>The battle over cap-and-trade, though, is more confounding than the battle over California’s climate targets.\u003c/p>\n\u003cp>While California’s climate targets would require simple majority support from lawmakers, extending cap-and-trade may require supermajority support. That’s because the cap-and-trade program charges fees, meaning it may be subject to the requirements of an anti-tax proposition endorsed by state voters in 2010.\u003c/p>\n\u003cp>Another shortfall during Tuesday’s allowance auction could indicate that the entities that are regulated by cap-and-trade in California — fuel refineries, factories, power plants and the like — have little confidence that the program will survive into 2021.\u003c/p>\n\u003cp>“If you have another very poor auction, I think what it tells you is that compliance entities lack certainty about what’s going on,” said Dan McGraw, an expert on U.S. carbon markets at \u003ca href=\"http://www.icis.com/\">ICIS Tschach Solutions\u003c/a>, which provides market intelligence.\u003c/p>\n\u003cp>Various theories explain why most of the pollution allowances went unsold during the last auction, which was held in May.\u003c/p>\n\u003cp>There may be many more allowances on the market than industry needs. Key legal victories in the spring by opponents of cap-and-trade and by opponents of EPA climate change rules could have given bidders the jitters. The poor results may have reflected profound uncertainty about the future of cap-and-trade in California after 2020.\u003c/p>\n\u003cp>It may be a week before the results of Tuesday’s online auction are known. “The results from this week are going to be very important,” said \u003ca href=\"https://law.stanford.edu/directory/michael-wara/\">Michael Wara\u003c/a>, a law expert at Stanford whose research focuses on climate and electricity policy.\u003c/p>\n\u003cp>Wara said that California could continue to pursue aggressive reductions in greenhouse gas pollution even without cap-and-trade. That would make such accomplishments harder, though — at a time of rapidly escalating ambitions.\u003c/p>\n\u003cp>Like others, Wara has been calling on the Air Resource Board to lay out its legal rationale for extending cap-and-trade without the support of lawmakers. He believes a public conversation could help, such as by restoring confidence in the allowance market.\u003c/p>\n\u003cp>“ARB is effectively the market regulator, and credibility with the market is incredibly important for it being effective,” Wara said. “It needs to more clearly explain itself.”\u003c/p>\n\u003cp>[ad floatright]\u003c/p>\n\u003cp>\u003ca href=\"http://www.climatecentral.org/\">\u003cspan style=\"font-weight: 400\">Climate Central\u003c/span>\u003c/a> \u003ci>\u003cspan style=\"font-weight: 400\">is an independent organization that researches and reports on climate change.\u003c/span>\u003c/i>\u003c/p>\n\n",
"stats": {
"hasVideo": false,
"hasChartOrMap": false,
"hasAudio": false,
"hasPolis": false,
"wordCount": 1167,
"hasGoogleForm": false,
"hasGallery": false,
"hasHearkenModule": false,
"iframeSrcs": [],
"paragraphCount": 31
},
"modified": 1704929750,
"excerpt": "California's cap-and-trade program is in legal doubt, but state officials are publicly ignoring the problem.",
"headData": {
"twImgId": "",
"twTitle": "",
"ogTitle": "",
"ogImgId": "",
"twDescription": "",
"description": "California's cap-and-trade program is in legal doubt, but state officials are publicly ignoring the problem.",
"title": "California Climate Program Faces Uncertain Future Beyond 2020 | KQED",
"ogDescription": "",
"schema": {
"@context": "https://schema.org",
"@type": "Article",
"headline": "California Climate Program Faces Uncertain Future Beyond 2020",
"datePublished": "2016-08-18T11:59:57-07:00",
"dateModified": "2024-01-10T15:35:50-08:00",
"image": "https://cdn.kqed.org/wp-content/uploads/2020/02/KQED-OG-Image@1x.png"
}
},
"guestAuthors": [],
"slug": "california-climate-program-faces-uncertain-future-beyond-2020",
"status": "publish",
"sourceUrl": "http://www.climatecentral.org/",
"nprByline": "John Upton\u003c/br>Climate Central",
"sticky": false,
"source": "Climate Central",
"path": "/science/929276/california-climate-program-faces-uncertain-future-beyond-2020",
"audioTrackLength": null,
"parsedContent": [
{
"type": "contentString",
"content": "\u003cdiv class=\"post-body\">\u003cp>\u003cp>The opinion of lawyers working for California’s lawmakers became clear in the spring. Without new laws, the state’s prominent cap-and-trade program would be dead after 2020.\u003c/p>\n\u003cp>Such a legal reality could put an end to the pollution reduction program, and with it billions in anticipated revenues and some of the Golden State’s vaunted global leadership on climate action.\u003c/p>\n\u003cp>\u003c/p>\u003cp>\u003c/p>\u003cp>Four months after the legislators’ law office \u003ca href=\"http://assets.climatecentral.org/pdfs/August2016_Upton_CapAndTradeLaw.pdf\">concluded\u003c/a> “the plain language” of state law dictates that the state’s cap-and-trade program “may not be applied or used” after 2020, officials in Gov. Jerry Brown’s administration are publicly ignoring the vexing legal questions affecting the flagship program’s future.\u003c/p>\n\u003cp>Under a \u003ca href=\"http://www.arb.ca.gov/regact/2016/capandtrade16/isor.pdf\">proposal prepared this month\u003c/a> by the California Air Resources Board, the cap-and-trade program that it oversees would simply continue operating beyond 2020 — without lawmaker blessing.\u003c/p>\n\u003cp>“They will absolutely be sued,” said \u003ca href=\"http://www.ghgpolicy.org/about/\">Danny Cullenward\u003c/a>, an energy economist and lawyer who researches climate policies at the Carnegie Institution for Science in Silicon Valley. “This is not a secret what they’re doing. The opponents of the system are well aware.”\u003c/p>\n\u003cp>\u003c/p>\u003c/div>",
"attributes": {
"named": {},
"numeric": []
}
},
{
"type": "component",
"content": "",
"name": "ad",
"attributes": {
"named": {
"label": "fullwidth"
},
"numeric": [
"fullwidth"
]
}
},
{
"type": "contentString",
"content": "\u003cdiv class=\"post-body\">\u003cp>\u003c/p>\n\u003cp>California’s cap-and-trade program was launched in late 2012, immediately becoming one of the world’s highest-profile efforts to cap the amount of climate pollution released by an economy. Permits to release some of the allowed pollution are called allowances, and they’re auctioned off, then traded among large polluters and speculators, raising funds for state programs.\u003c/p>\n\u003cp>The results of California’s biggest cap-and-trade auction yet, which was held electronically Tuesday following the flop of a May auction that fell hundreds of millions of dollars short of expectations, may provide clues as to whether polluters expect the program to survive into 2021.\u003c/p>\n\u003cp>Even as California officials are outwardly nonchalant about the profound legal challenges, behind the scenes they are scrambling to find solutions, quietly consulting outside experts as they attempt to unearth a regulatory fix that could bypass lawmakers without falling afoul of existing law.\u003c/p>\n\u003cp>The \u003ca href=\"http://www.sacbee.com/news/politics-government/capitol-alert/article95752577.html\">Sacramento Bee reported Monday\u003c/a> that Brown’s office may amend high-profile climate legislation to extend cap-and-trade. For now, though, state officials are simply denying to the public that a legal problem even exists.\u003c/p>\n\u003cp>The cap-and-trade program was created by a 2006 climate law, \u003ca href=\"http://www.leginfo.ca.gov/pub/05-06/bill/asm/ab_0001-0050/ab_32_bill_20060927_chaptered.pdf\">AB32\u003c/a>, which stated that the “market-based” system for achieving pollution cuts was “applicable” until the end of 2020. The law requires that state officials “make recommendations” to lawmakers for reducing greenhouse gas emissions after that time.\u003c/p>\n\u003cp>Because of a \u003ca href=\"http://www.lao.ca.gov/ballot/2010/26_11_2010.aspx\">proposition passed\u003c/a> by state voters in 2010 regarding fees and taxes, lawmaker approval of a new or extended cap-and-trade program may require a two-thirds majority.\u003c/p>\n\u003cp>“The legal crisis is, ‘How do we fix that problem?’” Cullenward said. “The Air Resources Board is saying, ‘Oh, we don’t need any new authority, because we’ve got it — we just won’t really tell you what it is.’ ”\u003c/p>\n\u003cp>The board published a \u003ca href=\"http://www.arb.ca.gov/regact/2016/capandtrade16/appa.pdf\">334-page proposal\u003c/a> this month to extend cap-and-trade beyond 2020. It will be debated by the board’s directors next month.\u003c/p>\n\u003cp>The proposal doesn’t provide anything resembling a detailed legal defense. Instead, it notes that “the intent” of the legislature was stated in AB32 as being to “maintain and continue reductions” in climate pollution after 2020.\u003c/p>\n\u003cp>“We believe that under AB32 we have the legal authority to move forward,” Stanley Young, a spokesman for the board, said. “Climate change will not end in 2020, and AB32 explicitly states the intent to ‘maintain and continue reductions in emissions of greenhouse gases beyond 2020.’”\u003c/p>\n\u003cp>Young said the board’s legal position was “developed following a thorough review of the law by our lawyers.” Requests to interview lawyers or review detailed legal briefs were declined.\u003c/p>\n\u003cp>Doubts over cap-and-trade’s future are coinciding with \u003ca href=\"http://www.eenews.net/climatewire/2016/08/15/stories/1060041591\">long-running legislative battles\u003c/a> in Sacramento over efforts to enact California climate laws affecting the period after 2020.\u003c/p>\n\u003cp>Some lawmakers are pushing to require greenhouse gas emissions in the state be reduced to 40 percent below 1990 levels by 2030 — similar to plans adopted last year in the European Union. The legislation is strongly supported by Brown.\u003c/p>\n\u003cp>The battle over cap-and-trade, though, is more confounding than the battle over California’s climate targets.\u003c/p>\n\u003cp>While California’s climate targets would require simple majority support from lawmakers, extending cap-and-trade may require supermajority support. That’s because the cap-and-trade program charges fees, meaning it may be subject to the requirements of an anti-tax proposition endorsed by state voters in 2010.\u003c/p>\n\u003cp>Another shortfall during Tuesday’s allowance auction could indicate that the entities that are regulated by cap-and-trade in California — fuel refineries, factories, power plants and the like — have little confidence that the program will survive into 2021.\u003c/p>\n\u003cp>“If you have another very poor auction, I think what it tells you is that compliance entities lack certainty about what’s going on,” said Dan McGraw, an expert on U.S. carbon markets at \u003ca href=\"http://www.icis.com/\">ICIS Tschach Solutions\u003c/a>, which provides market intelligence.\u003c/p>\n\u003cp>Various theories explain why most of the pollution allowances went unsold during the last auction, which was held in May.\u003c/p>\n\u003cp>There may be many more allowances on the market than industry needs. Key legal victories in the spring by opponents of cap-and-trade and by opponents of EPA climate change rules could have given bidders the jitters. The poor results may have reflected profound uncertainty about the future of cap-and-trade in California after 2020.\u003c/p>\n\u003cp>It may be a week before the results of Tuesday’s online auction are known. “The results from this week are going to be very important,” said \u003ca href=\"https://law.stanford.edu/directory/michael-wara/\">Michael Wara\u003c/a>, a law expert at Stanford whose research focuses on climate and electricity policy.\u003c/p>\n\u003cp>Wara said that California could continue to pursue aggressive reductions in greenhouse gas pollution even without cap-and-trade. That would make such accomplishments harder, though — at a time of rapidly escalating ambitions.\u003c/p>\n\u003cp>Like others, Wara has been calling on the Air Resource Board to lay out its legal rationale for extending cap-and-trade without the support of lawmakers. He believes a public conversation could help, such as by restoring confidence in the allowance market.\u003c/p>\n\u003cp>“ARB is effectively the market regulator, and credibility with the market is incredibly important for it being effective,” Wara said. “It needs to more clearly explain itself.”\u003c/p>\n\u003cp>\u003c/p>\u003c/div>",
"attributes": {
"named": {},
"numeric": []
}
},
{
"type": "component",
"content": "",
"name": "ad",
"attributes": {
"named": {
"label": "floatright"
},
"numeric": [
"floatright"
]
}
},
{
"type": "contentString",
"content": "\u003cdiv class=\"post-body\">\u003cp>\u003c/p>\n\u003cp>\u003ca href=\"http://www.climatecentral.org/\">\u003cspan style=\"font-weight: 400\">Climate Central\u003c/span>\u003c/a> \u003ci>\u003cspan style=\"font-weight: 400\">is an independent organization that researches and reports on climate change.\u003c/span>\u003c/i>\u003c/p>\n\n\u003c/div>\u003c/p>",
"attributes": {
"named": {},
"numeric": []
}
}
],
"link": "/science/929276/california-climate-program-faces-uncertain-future-beyond-2020",
"authors": [
"byline_science_929276"
],
"categories": [
"science_31",
"science_35",
"science_40"
],
"featImg": "science_929281",
"label": "source_science_929276"
},
"science_929164": {
"type": "posts",
"id": "science_929164",
"meta": {
"index": "posts_1716263798",
"site": "science",
"id": "929164",
"score": null,
"sort": [
1471542273000
]
},
"parent": 0,
"labelTerm": {},
"blocks": [],
"publishDate": 1471542273,
"format": "standard",
"title": "Should We Be Having Kids in the Age of Climate Change?",
"headTitle": "Should We Be Having Kids in the Age of Climate Change? | KQED",
"content": "\u003cp>Standing before several dozen students in a college classroom, Travis Rieder tries to convince them not to have children. Or at least not too many.\u003c/p>\n\u003cp>He’s at James Madison University in southwest Virginia to talk about a “small-family ethic” — to question the assumptions of a society that sees having children as good, throws parties for expecting parents, and in which parents then pressure their kids to “give them grandchildren.”\u003c/p>\n\u003caside class=\"pullquote alignright\">‘Maybe we should protect our kids by not having them.’\u003ccite>philosopher Travis Rieder\u003c/cite>\u003c/aside>\n\u003cp>Why question such assumptions? The prospect of climate catastrophe.\u003c/p>\n\u003cp>For years, people have lamented how bad things might get “for our grandchildren,” but Rieder tells the students that future isn’t so far off anymore.\u003c/p>\n\u003cp>He asks how old they will be in 2036, and, if they are thinking of having kids, how old their kids will be.\u003c/p>\n\u003cp>[ad fullwidth]\u003c/p>\n\u003cp>“Dangerous climate change \u003ca href=\"http://www.scientificamerican.com/article/earth-will-cross-the-climate-danger-threshold-by-2036/\">is going to be happening by then\u003c/a>,” he says. “Very, very soon.”\u003c/p>\n\u003cp>Rieder wears a tweedy jacket and tennis shoes, and he limps because of a motorcycle accident. He’s a philosopher with the \u003ca href=\"http://www.bioethicsinstitute.org/\">Berman Institute of Bioethics\u003c/a> at Johns Hopkins University in Baltimore, and his arguments against having children are moral.\u003c/p>\n\u003cp>Americans and other rich nations produce the most carbon emissions per capita, he says. Yet people in the world’s poorest nations are most likely to suffer severe climate impacts, “and that seems unfair,” he says.\u003c/p>\n\u003cp>There’s also a moral duty to future generations that will live amid the climate devastation being created now.\u003c/p>\n\u003cp>“Here’s a provocative thought: Maybe we should protect our kids by not having them,” Rieder says.\u003c/p>\n\u003cp>His arguments sound pretty persuasive in the classroom. At home, it was a different matter.\u003c/p>\n\u003cp>\u003cstrong>The Philosopher’s Personal Dilemma\u003c/strong>\u003c/p>\n\u003cp>“I have been one of those women who actually craved to have a baby,” says Sadiye Rieder, smiling as she sits next to her husband in the sunroom of their Maryland home. “To go through pregnancy and everything, that mattered to me a lot.”\u003c/p>\n\u003cp>Sadiye also wanted a big family. She grew up among extended relatives in the Turkish part of Cyprus and says she enjoyed having people around all the time.\u003c/p>\n\u003cp>This was not a problem early in their marriage, as each focused on their studies. But by the time Sadiye began feeling ready for motherhood, Travis’ research had delved into the morality of adoption, which led to the ethics of procreation and to its impact on the climate.\u003c/p>\n\u003cp>They knew they had to talk.\u003c/p>\n\u003cp>“It’s not easy to convince a philosopher!” Sadiye says with a laugh.\u003c/p>\n\u003cfigure id=\"attachment_929168\" class=\"wp-caption aligncenter\" style=\"max-width: 3000px\">\u003cimg loading=\"lazy\" decoding=\"async\" class=\"size-full wp-image-929168\" src=\"http://ww2.kqed.org/science/wp-content/uploads/sites/35/2016/08/2016-04-10-family-ethicist-rieder-0029-edit_custom-1a10f9a95f1400982ae78ee8b5d9b5cf0ecf1ec5-1.jpg\" alt=\"Travis and Sadiye Rieder read a book with their 2-year-old daughter, Sinem, in their Maryland home. Travis is a philosopher and ethicist who argues against having too many children, for moral and environmental reasons. His wife always wanted to have a big family.\" width=\"3000\" height=\"1998\" srcset=\"https://cdn.kqed.org/wp-content/uploads/sites/35/2016/08/2016-04-10-family-ethicist-rieder-0029-edit_custom-1a10f9a95f1400982ae78ee8b5d9b5cf0ecf1ec5-1.jpg 3000w, https://cdn.kqed.org/wp-content/uploads/sites/35/2016/08/2016-04-10-family-ethicist-rieder-0029-edit_custom-1a10f9a95f1400982ae78ee8b5d9b5cf0ecf1ec5-1-400x266.jpg 400w, https://cdn.kqed.org/wp-content/uploads/sites/35/2016/08/2016-04-10-family-ethicist-rieder-0029-edit_custom-1a10f9a95f1400982ae78ee8b5d9b5cf0ecf1ec5-1-800x533.jpg 800w, https://cdn.kqed.org/wp-content/uploads/sites/35/2016/08/2016-04-10-family-ethicist-rieder-0029-edit_custom-1a10f9a95f1400982ae78ee8b5d9b5cf0ecf1ec5-1-768x511.jpg 768w, https://cdn.kqed.org/wp-content/uploads/sites/35/2016/08/2016-04-10-family-ethicist-rieder-0029-edit_custom-1a10f9a95f1400982ae78ee8b5d9b5cf0ecf1ec5-1-1440x959.jpg 1440w, https://cdn.kqed.org/wp-content/uploads/sites/35/2016/08/2016-04-10-family-ethicist-rieder-0029-edit_custom-1a10f9a95f1400982ae78ee8b5d9b5cf0ecf1ec5-1-1920x1279.jpg 1920w, https://cdn.kqed.org/wp-content/uploads/sites/35/2016/08/2016-04-10-family-ethicist-rieder-0029-edit_custom-1a10f9a95f1400982ae78ee8b5d9b5cf0ecf1ec5-1-1180x786.jpg 1180w, https://cdn.kqed.org/wp-content/uploads/sites/35/2016/08/2016-04-10-family-ethicist-rieder-0029-edit_custom-1a10f9a95f1400982ae78ee8b5d9b5cf0ecf1ec5-1-960x639.jpg 960w\" sizes=\"(max-width: 3000px) 100vw, 3000px\">\u003cfigcaption class=\"wp-caption-text\">Travis and Sadiye Rieder read a book with their 2-year-old daughter, Sinem, in their Maryland home. Travis is a philosopher and ethicist who argues against having too many children, for moral and environmental reasons. His wife always wanted to have a big family. \u003ccite>(Ariel Zambelich/NPR)\u003c/cite>\u003c/figcaption>\u003c/figure>\n\u003cp>Scientists warn that a catastrophic tipping point is possible in the next few decades. By midcentury, possibly before, the average global temperature is projected to rise by more than \u003ca href=\"http://www.npr.org/sections/thetwo-way/2015/12/12/459502597/2-degrees-100-billion-the-world-climate-agreement-by-the-numbers\">2 degrees Celsius\u003c/a>, the point scientists and world leaders agree would trigger cataclysmic consequences. Last year’s historic \u003ca href=\"http://www.npr.org/sections/thetwo-way/2015/12/12/459464621/final-draft-of-world-climate-agreement-goes-to-a-vote-in-paris-saturday\">Paris climate agreement\u003c/a> falls short of preventing that, so more drastic cuts in carbon emissions are needed.\u003c/p>\n\u003cp>Adding to that challenge, the world is expected to add several billion people in the next few decades, each one producing more emissions.\u003c/p>\n\u003cp>In fact, without dramatic action, climatologists say, the world is on track to hit 4 degrees Celsius of warming by the end of the century, and worse beyond that. A \u003ca href=\"http://www-wds.worldbank.org/external/default/WDSContentServer/WDSP/IB/2013/03/26/000445729_20130326120429/Rendered/PDF/632190WP0Turn000Box374367B00PUBLIC0.pdf\">World Bank report\u003c/a> says this must be avoided, and warns of unprecedented heat waves, severe drought and serious impacts on ecosystems and “human systems.”\u003c/p>\n\u003cp>Back in the classroom, Rieder puts this in less technical terms: 4 degrees of warming would be “largely uninhabitable for humans.”\u003c/p>\n\u003cp>“It’s gonna be post-apocalyptic movie time,” he says.\u003c/p>\n\u003cp>The room is quiet. No one fidgets. Later, a few students say they had no idea the situation was so bad. One says he appreciated the talk but found it terrifying, and hadn’t planned on being so shaken before heading off to start the weekend.\u003c/p>\n\u003cp>Still. Even given the apocalyptic scenarios: Can you actually expect people to forgo something as deeply personal as having children? To deny the biological imperative that’s driven civilization?\u003c/p>\n\u003cp>Rieder and two colleagues, Colin Hickey and Jake Earl of Georgetown University, have \u003ca href=\"http://www.npr.org/documents/2016/jun/population_engineering.pdf\">a strategy for trying to do just that\u003c/a>. Rieder is \u003ca href=\"http://www.springer.com/us/book/9783319338699\">publishing a book\u003c/a> on the subject later this year, and expects to take plenty of heat. But he’s hardly alone in thinking the climate crisis has come to this.\u003c/p>\n\u003cp>\u003cstrong>“The Climate Crisis Is a Reproductive Crisis”\u003c/strong>\u003c/p>\n\u003cp>Meghan Hoskins is among a dozen people gathered in the spare office of an environmental group in Keene, N.H., earlier this year. They sit on folding chairs in a circle, the room humming with multiple conversations.\u003c/p>\n\u003cp>“If I had told my boyfriend at the time, ‘I’m not ready to have children because I don’t know what the climate’s gonna be like in 50 years,’ he wouldn’t have understood. There’s no way,” says Hoskins, a 23-year-old whose red hair is twisted in a long braid.\u003c/p>\n\u003cfigure id=\"attachment_929169\" class=\"wp-caption aligncenter\" style=\"max-width: 3262px\">\u003cimg loading=\"lazy\" decoding=\"async\" class=\"size-full wp-image-929169\" src=\"http://ww2.kqed.org/science/wp-content/uploads/sites/35/2016/08/img_3377-edit-178c9ad1462417f07c63451fb15142318a874939-1.jpg\" alt='Josephine Ferorelli (left) and Meghan Kallman are the co-founders of Conceivable Future, a nonprofit founded on the notion that \"the climate crisis is a reproductive crisis.\"' width=\"3262\" height=\"2446\" srcset=\"https://cdn.kqed.org/wp-content/uploads/sites/35/2016/08/img_3377-edit-178c9ad1462417f07c63451fb15142318a874939-1.jpg 3262w, https://cdn.kqed.org/wp-content/uploads/sites/35/2016/08/img_3377-edit-178c9ad1462417f07c63451fb15142318a874939-1-400x300.jpg 400w, https://cdn.kqed.org/wp-content/uploads/sites/35/2016/08/img_3377-edit-178c9ad1462417f07c63451fb15142318a874939-1-800x600.jpg 800w, https://cdn.kqed.org/wp-content/uploads/sites/35/2016/08/img_3377-edit-178c9ad1462417f07c63451fb15142318a874939-1-768x576.jpg 768w, https://cdn.kqed.org/wp-content/uploads/sites/35/2016/08/img_3377-edit-178c9ad1462417f07c63451fb15142318a874939-1-1440x1080.jpg 1440w, https://cdn.kqed.org/wp-content/uploads/sites/35/2016/08/img_3377-edit-178c9ad1462417f07c63451fb15142318a874939-1-1920x1440.jpg 1920w, https://cdn.kqed.org/wp-content/uploads/sites/35/2016/08/img_3377-edit-178c9ad1462417f07c63451fb15142318a874939-1-1180x885.jpg 1180w, https://cdn.kqed.org/wp-content/uploads/sites/35/2016/08/img_3377-edit-178c9ad1462417f07c63451fb15142318a874939-1-960x720.jpg 960w\" sizes=\"(max-width: 3262px) 100vw, 3262px\">\u003cfigcaption class=\"wp-caption-text\">Josephine Ferorelli (left) and Meghan Kallman are the co-founders of Conceivable Future, a nonprofit founded on the notion that “the climate crisis is a reproductive crisis.” \u003ccite>(Jennifer Ludden/NPR)\u003c/cite>\u003c/figcaption>\u003c/figure>\n\u003cp>This is one of 16 meetings over the past year and a half organized by \u003ca href=\"http://conceivablefuture.org/\">Conceivable Future\u003c/a>, a nonprofit founded on the notion that “the climate crisis is a reproductive crisis.”\u003c/p>\n\u003cp>Hoskins says she’s always wanted “little redheaded babies” — as do her parents, the sooner the better.\u003c/p>\n\u003cp>But she’s a grad student in environmental studies, and the more she learns, the more she questions what kind of life those babies would have.\u003c/p>\n\u003cp>In a country where even the idea of climate change can be polarizing and political, Hoskins has never shared that fear until now.\u003c/p>\n\u003cp>Meghan Kallman is a co-founder of Conceivable Future. “I can’t count the number of times people have said, ‘Oh, my God, it’s so nice to know I’m not the only person that worries about this,’ ” she says.\u003c/p>\n\u003cp>In November 2014, Kallman and Josephine Ferorelli created Conceivable Future to make these personal struggles public. The group’s ultimate goal is ending U.S. fossil fuel subsidies, though its immediate role seems one of commiseration.\u003c/p>\n\u003cp>Conceivable Future targets climate activists immersed in scary data. \u003ca href=\"https://www.newsecuritybeat.org/2015/09/droughts-floods-die-offs-proliferate-climate-trauma-growing-phenomenon/\">There’s already a term for how some feel: climate trauma\u003c/a>.\u003c/p>\n\u003cp>But Kallman and Ferorelli say the focus on numbers fails to capture the emotion that drives many to work on the issue in the first place. For activists of childbearing age, Ferorelli says, climate change isn’t just an intellectual problem but “a heart problem.”\u003c/p>\n\u003cp>Ferorelli, 33, and Kallman, 32, are both in committed relationships, and in the throes of this problem. Ferorelli recently helped her widowed mother pack up her house, saving cherished items with the unspoken assumption that they are for a next generation.\u003c/p>\n\u003cp>And yet, when she imagines raising a child, Ferorelli says she can’t help but envision the nightmare scenarios that have dogged her since she first heard the term “global warming” in elementary school.\u003c/p>\n\u003cp>“Knowing that I gave that future to somebody is something that just doesn’t sit very well,” she says.\u003c/p>\n\u003cfigure id=\"attachment_929165\" class=\"wp-caption aligncenter\" style=\"max-width: 3000px\">\u003cimg loading=\"lazy\" decoding=\"async\" class=\"size-full wp-image-929165\" src=\"http://ww2.kqed.org/science/wp-content/uploads/sites/35/2016/08/2016-04-10-family-ethicist-rieder-0157-edit_custom-a9acc0f91efa6293ac35199118d66c92120c742e-1.jpg\" alt=\"Travis and Sadiye Rieder play with Sinem in their home. They've agreed that if they want more children, they'll adopt.\" width=\"3000\" height=\"1998\" srcset=\"https://cdn.kqed.org/wp-content/uploads/sites/35/2016/08/2016-04-10-family-ethicist-rieder-0157-edit_custom-a9acc0f91efa6293ac35199118d66c92120c742e-1.jpg 3000w, https://cdn.kqed.org/wp-content/uploads/sites/35/2016/08/2016-04-10-family-ethicist-rieder-0157-edit_custom-a9acc0f91efa6293ac35199118d66c92120c742e-1-400x266.jpg 400w, https://cdn.kqed.org/wp-content/uploads/sites/35/2016/08/2016-04-10-family-ethicist-rieder-0157-edit_custom-a9acc0f91efa6293ac35199118d66c92120c742e-1-800x533.jpg 800w, https://cdn.kqed.org/wp-content/uploads/sites/35/2016/08/2016-04-10-family-ethicist-rieder-0157-edit_custom-a9acc0f91efa6293ac35199118d66c92120c742e-1-768x511.jpg 768w, https://cdn.kqed.org/wp-content/uploads/sites/35/2016/08/2016-04-10-family-ethicist-rieder-0157-edit_custom-a9acc0f91efa6293ac35199118d66c92120c742e-1-1440x959.jpg 1440w, https://cdn.kqed.org/wp-content/uploads/sites/35/2016/08/2016-04-10-family-ethicist-rieder-0157-edit_custom-a9acc0f91efa6293ac35199118d66c92120c742e-1-1920x1279.jpg 1920w, https://cdn.kqed.org/wp-content/uploads/sites/35/2016/08/2016-04-10-family-ethicist-rieder-0157-edit_custom-a9acc0f91efa6293ac35199118d66c92120c742e-1-1180x786.jpg 1180w, https://cdn.kqed.org/wp-content/uploads/sites/35/2016/08/2016-04-10-family-ethicist-rieder-0157-edit_custom-a9acc0f91efa6293ac35199118d66c92120c742e-1-960x639.jpg 960w\" sizes=\"(max-width: 3000px) 100vw, 3000px\">\u003cfigcaption class=\"wp-caption-text\">Travis and Sadiye Rieder play with Sinem in their home. They’ve agreed that if they want more children, they’ll adopt. \u003ccite>(Ariel Zambelich/NPR)\u003c/cite>\u003c/figcaption>\u003c/figure>\n\u003cp>At the New Hampshire meeting, 67-year-old Nancy Nolan tells two younger women that people didn’t know about climate change in the 1980s when she had her kids. Once her children were grown, “I said to them, ‘I hope you never have children,’ which is an awful thing to say,” Nolan says, her voice wavering. “It can bring me to tears easily.”\u003c/p>\n\u003cp>She adds that of course people are driven to procreate, and you can’t really tell them not to.\u003c/p>\n\u003cp>One woman looks a little stunned. She’s not a climate activist — just tagged along with a friend — and says she had no idea that deciding not to have kids because of the climate was even a thing.\u003c/p>\n\u003cp>These aren’t the first would-be parents to ask whether it’s fair to bring a child into the world. U.S. birth rates plummeted during the Great Depression. Many also must have thought twice amid warnings of overpopulation in the 1960s and ’70s, and under the threat of nuclear holocaust.\u003c/p>\n\u003cp>Kallman says she’s heard from women who remember that; their reaction surprised her.\u003c/p>\n\u003cp>“Things like, ‘Oh, I thought we were gonna blow ourselves up in nuclear war, but it didn’t happen. And therefore, just be quiet and have some babies, and, see, everything will be all right,’ ” she says.\u003c/p>\n\u003cp>The comments may be well-intentioned, but as Kallman and Ferorelli see it, the threat from climate change is worse. It’s not a possibility. It’s happening.\u003c/p>\n\u003cp>Not everyone at the New Hampshire meeting is as pessimistic about the future. Becky Whitley still plans to have a second child. She’s with the advocacy group \u003ca href=\"http://www.momscleanairforce.org/\">Moms Clean Air Force\u003c/a> and says becoming a parent is precisely what motivated her to care about the climate.\u003c/p>\n\u003cp>“I think I really do come from a place of hope because I am a mother,” she says.\u003c/p>\n\u003cp>Kallman and Ferorelli say they don’t want to tell anyone what to do. In fact, neither is ready to rule out children herself.\u003c/p>\n\u003cp>“I’m not ready to get rid of the fantasy,” says Ferorelli. “In certain versions of the future, I would love to have a kid.”\u003c/p>\n\u003cp>\u003cstrong>An Easier Way?\u003c/strong>\u003c/p>\n\u003cp>Back at James Madison University, Travis Rieder explains a PowerPoint graph that seems to offer hope. Bringing down global fertility by just half a child per woman “could be the thing that saves us,” he says.\u003c/p>\n\u003cp>He cites a \u003ca href=\"http://www.pnas.org/content/107/41/17521.full\">study from 2010\u003c/a> that looked at the impact of demographic change on global carbon emissions. It found that slowing population growth could eliminate one-fifth to one-quarter of all the carbon emissions that need to be cut by midcentury to avoid that potentially catastrophic tipping point.\u003c/p>\n\u003cp>Rieder’s audience seems to want an easier way. A student asks about the carbon savings from not eating meat.\u003c/p>\n\u003cp>Excellent idea, Rieder says. But no amount of conservation gives you a pass. Oregon State University researchers \u003ca href=\"http://blog.oregonlive.com/environment_impact/2009/07/carbon%20legacy.pdf\">have calculated the savings\u003c/a> from all kinds of conservation measures: driving a hybrid, driving less, recycling, using energy-efficient appliances, windows and light bulbs.\u003c/p>\n\u003cp>For an American, the total metric tons of carbon dioxide saved by all of those measures over an entire lifetime of 80 years: 488. By contrast, the metric tons saved when a person chooses to have one fewer child: 9,441.\u003c/p>\n\u003cp>Another student asks: “What happens if that kid you decided not to have would have been the person who grew up and essentially cured this?”\u003c/p>\n\u003cp>Again, great question, says Rieder, but the answer is still no. First, the chances are slim. More to the point, he says, valuing children as a means to an end — be it to cure climate change or, say, provide soldiers for the state — is ethically problematic.\u003c/p>\n\u003cp>With all that’s at stake, he says, we need to shift our cultural attitudes. “It’s not the childless who must justify their lifestyle. It’s the rest of us.”\u003c/p>\n\u003cp>And that includes Rieder.\u003c/p>\n\u003cp>\u003cstrong>“One and Done”\u003c/strong>\u003c/p>\n\u003cp>At home, Travis Rieder’s face lights up when his 2-year-old daughter, Sinem, sings a favorite song. She stands at her mother’s knee, bouncing up and down on her toes, giggling as her parents clap.\u003c/p>\n\u003cp>After many conversations, he and Sadiye ended up convincing each other. Travis decided you can’t deny someone the hard-wired human fulfillment of creating a child.\u003c/p>\n\u003cp>But Sadiye agreed that the moral bar for a second child is much higher. The couple is “one and done.” Any more children will come through adoption.\u003c/p>\n\u003cp>Travis also argues that someone who doesn’t feel that deep longing to procreate is morally compelled to think twice before having any children at all.\u003c/p>\n\u003cp>When he writes online, Rieder often gets nasty comments, and inevitably people will say he must not have children. He believes it’s important that he understand viscerally what he’s asking of people. His daughter, he says, is “the most amazing thing we’ve ever done with our lives.”\u003c/p>\n\u003cp>So how do you persuade millions or billions of people around the world to sacrifice that? To avert climate disaster, the fertility rate would have to fall much faster than it has been. It would require more than educating women and expanding access to contraception, as aid agencies have been doing for decades.\u003c/p>\n\u003cp>\u003cstrong>Carrots for the Poor, Sticks for the Rich\u003c/strong>\u003c/p>\n\u003cp>Rieder and his Georgetown collaborators have a proposal, and the first thing they stress is that it’s not like China’s abusive \u003ca href=\"http://www.npr.org/sections/parallels/2013/11/29/247782924/chinese-welcome-two-child-policy-but-can-they-afford-it\">one-child policy\u003c/a>. It aims to persuade people to choose fewer children with a strategy that boils down to \u003ca href=\"http://www.npr.org/documents/2016/jun/population_engineering.pdf\">carrots for the poor, sticks for the rich.\u003c/a>\u003c/p>\n\u003cp>Ethically, Rieder says poor nations get some slack because they’re still developing, and because their per capita emissions are a sliver of the developed world’s. Plus, it just doesn’t look good for rich, Western nations to tell people in poor ones not to have kids. He suggests things like paying poor women to refill their birth control and — something that’s had proven success — widespread media campaigns.\u003c/p>\n\u003cp>In the 1970s and ’80s, a wave of educational soap operas in Latin America, Asia and Africa wove family planning into their plot lines. Some countries did this when they faced economic crisis. The shows are credited with actually \u003ca href=\"http://www.apa.org/monitor/oct02/theory.aspx\">changing people’s opinions\u003c/a> about family size.\u003c/p>\n\u003cp>For the sticks part of the plan, Rieder proposes that richer nations do away with tax breaks for having children and actually penalize new parents. He says the penalty should be progressive, based on income, and could increase with each additional child.\u003c/p>\n\u003cp>Think of it like a carbon tax, on kids. He knows that sounds crazy.\u003c/p>\n\u003cp>“But children, in a kind of cold way of looking at it, are an externality,” he says. “We as parents, we as family members, we get the good. And the world, the community, pays the cost.”\u003c/p>\n\u003cp>Of course, there are ethical concerns. \u003ca href=\"https://kennedyinstitute.georgetown.edu/people/rebecca-kukla/\">Rebecca Kukla\u003c/a> of Georgetown University worries about stigma, especially against poor and minority women. If cultural norms do change, she says, there could be a backlash against families with more children than is deemed socially appropriate.\u003c/p>\n\u003cp>Kukla appreciates that Rieder’s penalty on procreation would be progressive. But since it could not be so high as to be coercive, she says \u003ca href=\"https://www.academia.edu/27846638/Whose_Job_Is_It_to_Fight_Climate_Change_A_Response_to_Hickey_Rieder_and_Earl\" target=\"_blank\" rel=\"noopener\">it would inevitably be unfair\u003c/a>.\u003c/p>\n\u003cp>“What that will actually translate into is it becoming much easier for wealthy people to have children than for other people to have children,” Kukla says.\u003c/p>\n\u003cp>An even bigger hurdle is the sheer unlikelihood of it all. Rieder has no illusions. In fact, he says, some countries that have successfully reduced fertility rates have since reversed course, afraid that falling population will hurt their economies. (He has an answer — just as controversial — to that, too. He would have nations open up immigration to allow in the expected tens of millions of climate refugees.) Rieder’s real hope is to change people’s way of thinking about childbearing.\u003c/p>\n\u003cp>But if his idea seems like a last-ditch Hail Mary play, he wouldn’t disagree.\u003c/p>\n\u003cp>“The situation is bleak, it’s just dark,” he says. “Population engineering, maybe it’s an extreme move. But it gives us a chance.”\u003c/p>\n\u003cp>Still, Rieder wonders: Is it really so crazy? Scientists have proposed incredibly risky schemes to \u003ca href=\"http://www.npr.org/2013/10/20/238548240/turning-to-scientists-to-engineer-a-cooler-climate\">geoengineer the clouds and oceans\u003c/a>. They’re researching ways to suck carbon out of the air on a mass scale. Some have even called for overhauling the global system of \u003ca href=\"http://www.nybooks.com/articles/2014/12/04/can-climate-change-cure-capitalism/\">free-market capitalism\u003c/a>.\u003c/p>\n\u003cp>Compared to all that, Rieder says, bringing down the fertility rate seems downright easy.\u003c/p>\n\u003cp>[ad floatright]\u003c/p>\n\u003cp>“We know exactly how to make fewer babies,” he says. And it’s something people can start doing today.\u003c/p>\n\u003cdiv class=\"fullattribution\">Copyright 2016 NPR. To see more, visit http://www.npr.org/.\u003cimg decoding=\"async\" src=\"http://www.google-analytics.com/__utm.gif?utmac=UA-5828686-4&utmdt=Should+We+Be+Having+Kids+In+The+Age+Of+Climate+Change%3F+&utme=8(APIKey)9(MDAxOTAwOTE4MDEyMTkxMDAzNjczZDljZA004)\">\u003c/div>\n\n",
"stats": {
"hasVideo": false,
"hasChartOrMap": false,
"hasAudio": false,
"hasPolis": false,
"wordCount": 2902,
"hasGoogleForm": false,
"hasGallery": false,
"hasHearkenModule": false,
"iframeSrcs": [],
"paragraphCount": 85
},
"modified": 1704929756,
"excerpt": "For some climate activists, the personal decision to have a child is also fraught with moral consequences: the negative impact on the environment, and on the quality of life for those children.",
"headData": {
"twImgId": "",
"twTitle": "",
"ogTitle": "",
"ogImgId": "",
"twDescription": "",
"description": "For some climate activists, the personal decision to have a child is also fraught with moral consequences: the negative impact on the environment, and on the quality of life for those children.",
"title": "Should We Be Having Kids in the Age of Climate Change? | KQED",
"ogDescription": "",
"schema": {
"@context": "https://schema.org",
"@type": "Article",
"headline": "Should We Be Having Kids in the Age of Climate Change?",
"datePublished": "2016-08-18T10:44:33-07:00",
"dateModified": "2024-01-10T15:35:56-08:00",
"image": "https://cdn.kqed.org/wp-content/uploads/2020/02/KQED-OG-Image@1x.png"
}
},
"guestAuthors": [],
"slug": "should-we-be-having-kids-in-the-age-of-climate-change",
"status": "publish",
"nprApiLink": "http://api.npr.org/query?id=479349760&apiKey=MDAxOTAwOTE4MDEyMTkxMDAzNjczZDljZA004",
"nprStoryDate": "Thu, 18 Aug 2016 11:09:00 -0400",
"nprLastModifiedDate": "Thu, 18 Aug 2016 12:24:33 -0400",
"nprHtmlLink": "http://www.npr.org/2016/08/18/479349760/should-we-be-having-kids-in-the-age-of-climate-change?ft=nprml&f=479349760",
"nprImageAgency": "NPR",
"source": "NPR",
"nprStoryId": "479349760",
"sourceUrl": "http://www.npr.org/",
"nprByline": "Jennifer Ludden\u003c/br>NPR",
"sticky": false,
"nprImageCredit": "Ariel Zambelich",
"nprRetrievedStory": "1",
"nprPubDate": "Thu, 18 Aug 2016 12:24:00 -0400",
"path": "/science/929164/should-we-be-having-kids-in-the-age-of-climate-change",
"audioTrackLength": null,
"parsedContent": [
{
"type": "contentString",
"content": "\u003cdiv class=\"post-body\">\u003cp>\u003cp>Standing before several dozen students in a college classroom, Travis Rieder tries to convince them not to have children. Or at least not too many.\u003c/p>\n\u003cp>He’s at James Madison University in southwest Virginia to talk about a “small-family ethic” — to question the assumptions of a society that sees having children as good, throws parties for expecting parents, and in which parents then pressure their kids to “give them grandchildren.”\u003c/p>\n\u003caside class=\"pullquote alignright\">‘Maybe we should protect our kids by not having them.’\u003ccite>philosopher Travis Rieder\u003c/cite>\u003c/aside>\n\u003cp>Why question such assumptions? The prospect of climate catastrophe.\u003c/p>\n\u003cp>For years, people have lamented how bad things might get “for our grandchildren,” but Rieder tells the students that future isn’t so far off anymore.\u003c/p>\n\u003cp>He asks how old they will be in 2036, and, if they are thinking of having kids, how old their kids will be.\u003c/p>\n\u003cp>\u003c/p>\u003c/div>",
"attributes": {
"named": {},
"numeric": []
}
},
{
"type": "component",
"content": "",
"name": "ad",
"attributes": {
"named": {
"label": "fullwidth"
},
"numeric": [
"fullwidth"
]
}
},
{
"type": "contentString",
"content": "\u003cdiv class=\"post-body\">\u003cp>\u003c/p>\n\u003cp>“Dangerous climate change \u003ca href=\"http://www.scientificamerican.com/article/earth-will-cross-the-climate-danger-threshold-by-2036/\">is going to be happening by then\u003c/a>,” he says. “Very, very soon.”\u003c/p>\n\u003cp>Rieder wears a tweedy jacket and tennis shoes, and he limps because of a motorcycle accident. He’s a philosopher with the \u003ca href=\"http://www.bioethicsinstitute.org/\">Berman Institute of Bioethics\u003c/a> at Johns Hopkins University in Baltimore, and his arguments against having children are moral.\u003c/p>\n\u003cp>Americans and other rich nations produce the most carbon emissions per capita, he says. Yet people in the world’s poorest nations are most likely to suffer severe climate impacts, “and that seems unfair,” he says.\u003c/p>\n\u003cp>There’s also a moral duty to future generations that will live amid the climate devastation being created now.\u003c/p>\n\u003cp>“Here’s a provocative thought: Maybe we should protect our kids by not having them,” Rieder says.\u003c/p>\n\u003cp>His arguments sound pretty persuasive in the classroom. At home, it was a different matter.\u003c/p>\n\u003cp>\u003cstrong>The Philosopher’s Personal Dilemma\u003c/strong>\u003c/p>\n\u003cp>“I have been one of those women who actually craved to have a baby,” says Sadiye Rieder, smiling as she sits next to her husband in the sunroom of their Maryland home. “To go through pregnancy and everything, that mattered to me a lot.”\u003c/p>\n\u003cp>Sadiye also wanted a big family. She grew up among extended relatives in the Turkish part of Cyprus and says she enjoyed having people around all the time.\u003c/p>\n\u003cp>This was not a problem early in their marriage, as each focused on their studies. But by the time Sadiye began feeling ready for motherhood, Travis’ research had delved into the morality of adoption, which led to the ethics of procreation and to its impact on the climate.\u003c/p>\n\u003cp>They knew they had to talk.\u003c/p>\n\u003cp>“It’s not easy to convince a philosopher!” Sadiye says with a laugh.\u003c/p>\n\u003cfigure id=\"attachment_929168\" class=\"wp-caption aligncenter\" style=\"max-width: 3000px\">\u003cimg loading=\"lazy\" decoding=\"async\" class=\"size-full wp-image-929168\" src=\"http://ww2.kqed.org/science/wp-content/uploads/sites/35/2016/08/2016-04-10-family-ethicist-rieder-0029-edit_custom-1a10f9a95f1400982ae78ee8b5d9b5cf0ecf1ec5-1.jpg\" alt=\"Travis and Sadiye Rieder read a book with their 2-year-old daughter, Sinem, in their Maryland home. Travis is a philosopher and ethicist who argues against having too many children, for moral and environmental reasons. His wife always wanted to have a big family.\" width=\"3000\" height=\"1998\" srcset=\"https://cdn.kqed.org/wp-content/uploads/sites/35/2016/08/2016-04-10-family-ethicist-rieder-0029-edit_custom-1a10f9a95f1400982ae78ee8b5d9b5cf0ecf1ec5-1.jpg 3000w, https://cdn.kqed.org/wp-content/uploads/sites/35/2016/08/2016-04-10-family-ethicist-rieder-0029-edit_custom-1a10f9a95f1400982ae78ee8b5d9b5cf0ecf1ec5-1-400x266.jpg 400w, https://cdn.kqed.org/wp-content/uploads/sites/35/2016/08/2016-04-10-family-ethicist-rieder-0029-edit_custom-1a10f9a95f1400982ae78ee8b5d9b5cf0ecf1ec5-1-800x533.jpg 800w, https://cdn.kqed.org/wp-content/uploads/sites/35/2016/08/2016-04-10-family-ethicist-rieder-0029-edit_custom-1a10f9a95f1400982ae78ee8b5d9b5cf0ecf1ec5-1-768x511.jpg 768w, https://cdn.kqed.org/wp-content/uploads/sites/35/2016/08/2016-04-10-family-ethicist-rieder-0029-edit_custom-1a10f9a95f1400982ae78ee8b5d9b5cf0ecf1ec5-1-1440x959.jpg 1440w, https://cdn.kqed.org/wp-content/uploads/sites/35/2016/08/2016-04-10-family-ethicist-rieder-0029-edit_custom-1a10f9a95f1400982ae78ee8b5d9b5cf0ecf1ec5-1-1920x1279.jpg 1920w, https://cdn.kqed.org/wp-content/uploads/sites/35/2016/08/2016-04-10-family-ethicist-rieder-0029-edit_custom-1a10f9a95f1400982ae78ee8b5d9b5cf0ecf1ec5-1-1180x786.jpg 1180w, https://cdn.kqed.org/wp-content/uploads/sites/35/2016/08/2016-04-10-family-ethicist-rieder-0029-edit_custom-1a10f9a95f1400982ae78ee8b5d9b5cf0ecf1ec5-1-960x639.jpg 960w\" sizes=\"(max-width: 3000px) 100vw, 3000px\">\u003cfigcaption class=\"wp-caption-text\">Travis and Sadiye Rieder read a book with their 2-year-old daughter, Sinem, in their Maryland home. Travis is a philosopher and ethicist who argues against having too many children, for moral and environmental reasons. His wife always wanted to have a big family. \u003ccite>(Ariel Zambelich/NPR)\u003c/cite>\u003c/figcaption>\u003c/figure>\n\u003cp>Scientists warn that a catastrophic tipping point is possible in the next few decades. By midcentury, possibly before, the average global temperature is projected to rise by more than \u003ca href=\"http://www.npr.org/sections/thetwo-way/2015/12/12/459502597/2-degrees-100-billion-the-world-climate-agreement-by-the-numbers\">2 degrees Celsius\u003c/a>, the point scientists and world leaders agree would trigger cataclysmic consequences. Last year’s historic \u003ca href=\"http://www.npr.org/sections/thetwo-way/2015/12/12/459464621/final-draft-of-world-climate-agreement-goes-to-a-vote-in-paris-saturday\">Paris climate agreement\u003c/a> falls short of preventing that, so more drastic cuts in carbon emissions are needed.\u003c/p>\n\u003cp>Adding to that challenge, the world is expected to add several billion people in the next few decades, each one producing more emissions.\u003c/p>\n\u003cp>In fact, without dramatic action, climatologists say, the world is on track to hit 4 degrees Celsius of warming by the end of the century, and worse beyond that. A \u003ca href=\"http://www-wds.worldbank.org/external/default/WDSContentServer/WDSP/IB/2013/03/26/000445729_20130326120429/Rendered/PDF/632190WP0Turn000Box374367B00PUBLIC0.pdf\">World Bank report\u003c/a> says this must be avoided, and warns of unprecedented heat waves, severe drought and serious impacts on ecosystems and “human systems.”\u003c/p>\n\u003cp>Back in the classroom, Rieder puts this in less technical terms: 4 degrees of warming would be “largely uninhabitable for humans.”\u003c/p>\n\u003cp>“It’s gonna be post-apocalyptic movie time,” he says.\u003c/p>\n\u003cp>The room is quiet. No one fidgets. Later, a few students say they had no idea the situation was so bad. One says he appreciated the talk but found it terrifying, and hadn’t planned on being so shaken before heading off to start the weekend.\u003c/p>\n\u003cp>Still. Even given the apocalyptic scenarios: Can you actually expect people to forgo something as deeply personal as having children? To deny the biological imperative that’s driven civilization?\u003c/p>\n\u003cp>Rieder and two colleagues, Colin Hickey and Jake Earl of Georgetown University, have \u003ca href=\"http://www.npr.org/documents/2016/jun/population_engineering.pdf\">a strategy for trying to do just that\u003c/a>. Rieder is \u003ca href=\"http://www.springer.com/us/book/9783319338699\">publishing a book\u003c/a> on the subject later this year, and expects to take plenty of heat. But he’s hardly alone in thinking the climate crisis has come to this.\u003c/p>\n\u003cp>\u003cstrong>“The Climate Crisis Is a Reproductive Crisis”\u003c/strong>\u003c/p>\n\u003cp>Meghan Hoskins is among a dozen people gathered in the spare office of an environmental group in Keene, N.H., earlier this year. They sit on folding chairs in a circle, the room humming with multiple conversations.\u003c/p>\n\u003cp>“If I had told my boyfriend at the time, ‘I’m not ready to have children because I don’t know what the climate’s gonna be like in 50 years,’ he wouldn’t have understood. There’s no way,” says Hoskins, a 23-year-old whose red hair is twisted in a long braid.\u003c/p>\n\u003cfigure id=\"attachment_929169\" class=\"wp-caption aligncenter\" style=\"max-width: 3262px\">\u003cimg loading=\"lazy\" decoding=\"async\" class=\"size-full wp-image-929169\" src=\"http://ww2.kqed.org/science/wp-content/uploads/sites/35/2016/08/img_3377-edit-178c9ad1462417f07c63451fb15142318a874939-1.jpg\" alt='Josephine Ferorelli (left) and Meghan Kallman are the co-founders of Conceivable Future, a nonprofit founded on the notion that \"the climate crisis is a reproductive crisis.\"' width=\"3262\" height=\"2446\" srcset=\"https://cdn.kqed.org/wp-content/uploads/sites/35/2016/08/img_3377-edit-178c9ad1462417f07c63451fb15142318a874939-1.jpg 3262w, https://cdn.kqed.org/wp-content/uploads/sites/35/2016/08/img_3377-edit-178c9ad1462417f07c63451fb15142318a874939-1-400x300.jpg 400w, https://cdn.kqed.org/wp-content/uploads/sites/35/2016/08/img_3377-edit-178c9ad1462417f07c63451fb15142318a874939-1-800x600.jpg 800w, https://cdn.kqed.org/wp-content/uploads/sites/35/2016/08/img_3377-edit-178c9ad1462417f07c63451fb15142318a874939-1-768x576.jpg 768w, https://cdn.kqed.org/wp-content/uploads/sites/35/2016/08/img_3377-edit-178c9ad1462417f07c63451fb15142318a874939-1-1440x1080.jpg 1440w, https://cdn.kqed.org/wp-content/uploads/sites/35/2016/08/img_3377-edit-178c9ad1462417f07c63451fb15142318a874939-1-1920x1440.jpg 1920w, https://cdn.kqed.org/wp-content/uploads/sites/35/2016/08/img_3377-edit-178c9ad1462417f07c63451fb15142318a874939-1-1180x885.jpg 1180w, https://cdn.kqed.org/wp-content/uploads/sites/35/2016/08/img_3377-edit-178c9ad1462417f07c63451fb15142318a874939-1-960x720.jpg 960w\" sizes=\"(max-width: 3262px) 100vw, 3262px\">\u003cfigcaption class=\"wp-caption-text\">Josephine Ferorelli (left) and Meghan Kallman are the co-founders of Conceivable Future, a nonprofit founded on the notion that “the climate crisis is a reproductive crisis.” \u003ccite>(Jennifer Ludden/NPR)\u003c/cite>\u003c/figcaption>\u003c/figure>\n\u003cp>This is one of 16 meetings over the past year and a half organized by \u003ca href=\"http://conceivablefuture.org/\">Conceivable Future\u003c/a>, a nonprofit founded on the notion that “the climate crisis is a reproductive crisis.”\u003c/p>\n\u003cp>Hoskins says she’s always wanted “little redheaded babies” — as do her parents, the sooner the better.\u003c/p>\n\u003cp>But she’s a grad student in environmental studies, and the more she learns, the more she questions what kind of life those babies would have.\u003c/p>\n\u003cp>In a country where even the idea of climate change can be polarizing and political, Hoskins has never shared that fear until now.\u003c/p>\n\u003cp>Meghan Kallman is a co-founder of Conceivable Future. “I can’t count the number of times people have said, ‘Oh, my God, it’s so nice to know I’m not the only person that worries about this,’ ” she says.\u003c/p>\n\u003cp>In November 2014, Kallman and Josephine Ferorelli created Conceivable Future to make these personal struggles public. The group’s ultimate goal is ending U.S. fossil fuel subsidies, though its immediate role seems one of commiseration.\u003c/p>\n\u003cp>Conceivable Future targets climate activists immersed in scary data. \u003ca href=\"https://www.newsecuritybeat.org/2015/09/droughts-floods-die-offs-proliferate-climate-trauma-growing-phenomenon/\">There’s already a term for how some feel: climate trauma\u003c/a>.\u003c/p>\n\u003cp>But Kallman and Ferorelli say the focus on numbers fails to capture the emotion that drives many to work on the issue in the first place. For activists of childbearing age, Ferorelli says, climate change isn’t just an intellectual problem but “a heart problem.”\u003c/p>\n\u003cp>Ferorelli, 33, and Kallman, 32, are both in committed relationships, and in the throes of this problem. Ferorelli recently helped her widowed mother pack up her house, saving cherished items with the unspoken assumption that they are for a next generation.\u003c/p>\n\u003cp>And yet, when she imagines raising a child, Ferorelli says she can’t help but envision the nightmare scenarios that have dogged her since she first heard the term “global warming” in elementary school.\u003c/p>\n\u003cp>“Knowing that I gave that future to somebody is something that just doesn’t sit very well,” she says.\u003c/p>\n\u003cfigure id=\"attachment_929165\" class=\"wp-caption aligncenter\" style=\"max-width: 3000px\">\u003cimg loading=\"lazy\" decoding=\"async\" class=\"size-full wp-image-929165\" src=\"http://ww2.kqed.org/science/wp-content/uploads/sites/35/2016/08/2016-04-10-family-ethicist-rieder-0157-edit_custom-a9acc0f91efa6293ac35199118d66c92120c742e-1.jpg\" alt=\"Travis and Sadiye Rieder play with Sinem in their home. They've agreed that if they want more children, they'll adopt.\" width=\"3000\" height=\"1998\" srcset=\"https://cdn.kqed.org/wp-content/uploads/sites/35/2016/08/2016-04-10-family-ethicist-rieder-0157-edit_custom-a9acc0f91efa6293ac35199118d66c92120c742e-1.jpg 3000w, https://cdn.kqed.org/wp-content/uploads/sites/35/2016/08/2016-04-10-family-ethicist-rieder-0157-edit_custom-a9acc0f91efa6293ac35199118d66c92120c742e-1-400x266.jpg 400w, https://cdn.kqed.org/wp-content/uploads/sites/35/2016/08/2016-04-10-family-ethicist-rieder-0157-edit_custom-a9acc0f91efa6293ac35199118d66c92120c742e-1-800x533.jpg 800w, https://cdn.kqed.org/wp-content/uploads/sites/35/2016/08/2016-04-10-family-ethicist-rieder-0157-edit_custom-a9acc0f91efa6293ac35199118d66c92120c742e-1-768x511.jpg 768w, https://cdn.kqed.org/wp-content/uploads/sites/35/2016/08/2016-04-10-family-ethicist-rieder-0157-edit_custom-a9acc0f91efa6293ac35199118d66c92120c742e-1-1440x959.jpg 1440w, https://cdn.kqed.org/wp-content/uploads/sites/35/2016/08/2016-04-10-family-ethicist-rieder-0157-edit_custom-a9acc0f91efa6293ac35199118d66c92120c742e-1-1920x1279.jpg 1920w, https://cdn.kqed.org/wp-content/uploads/sites/35/2016/08/2016-04-10-family-ethicist-rieder-0157-edit_custom-a9acc0f91efa6293ac35199118d66c92120c742e-1-1180x786.jpg 1180w, https://cdn.kqed.org/wp-content/uploads/sites/35/2016/08/2016-04-10-family-ethicist-rieder-0157-edit_custom-a9acc0f91efa6293ac35199118d66c92120c742e-1-960x639.jpg 960w\" sizes=\"(max-width: 3000px) 100vw, 3000px\">\u003cfigcaption class=\"wp-caption-text\">Travis and Sadiye Rieder play with Sinem in their home. They’ve agreed that if they want more children, they’ll adopt. \u003ccite>(Ariel Zambelich/NPR)\u003c/cite>\u003c/figcaption>\u003c/figure>\n\u003cp>At the New Hampshire meeting, 67-year-old Nancy Nolan tells two younger women that people didn’t know about climate change in the 1980s when she had her kids. Once her children were grown, “I said to them, ‘I hope you never have children,’ which is an awful thing to say,” Nolan says, her voice wavering. “It can bring me to tears easily.”\u003c/p>\n\u003cp>She adds that of course people are driven to procreate, and you can’t really tell them not to.\u003c/p>\n\u003cp>One woman looks a little stunned. She’s not a climate activist — just tagged along with a friend — and says she had no idea that deciding not to have kids because of the climate was even a thing.\u003c/p>\n\u003cp>These aren’t the first would-be parents to ask whether it’s fair to bring a child into the world. U.S. birth rates plummeted during the Great Depression. Many also must have thought twice amid warnings of overpopulation in the 1960s and ’70s, and under the threat of nuclear holocaust.\u003c/p>\n\u003cp>Kallman says she’s heard from women who remember that; their reaction surprised her.\u003c/p>\n\u003cp>“Things like, ‘Oh, I thought we were gonna blow ourselves up in nuclear war, but it didn’t happen. And therefore, just be quiet and have some babies, and, see, everything will be all right,’ ” she says.\u003c/p>\n\u003cp>The comments may be well-intentioned, but as Kallman and Ferorelli see it, the threat from climate change is worse. It’s not a possibility. It’s happening.\u003c/p>\n\u003cp>Not everyone at the New Hampshire meeting is as pessimistic about the future. Becky Whitley still plans to have a second child. She’s with the advocacy group \u003ca href=\"http://www.momscleanairforce.org/\">Moms Clean Air Force\u003c/a> and says becoming a parent is precisely what motivated her to care about the climate.\u003c/p>\n\u003cp>“I think I really do come from a place of hope because I am a mother,” she says.\u003c/p>\n\u003cp>Kallman and Ferorelli say they don’t want to tell anyone what to do. In fact, neither is ready to rule out children herself.\u003c/p>\n\u003cp>“I’m not ready to get rid of the fantasy,” says Ferorelli. “In certain versions of the future, I would love to have a kid.”\u003c/p>\n\u003cp>\u003cstrong>An Easier Way?\u003c/strong>\u003c/p>\n\u003cp>Back at James Madison University, Travis Rieder explains a PowerPoint graph that seems to offer hope. Bringing down global fertility by just half a child per woman “could be the thing that saves us,” he says.\u003c/p>\n\u003cp>He cites a \u003ca href=\"http://www.pnas.org/content/107/41/17521.full\">study from 2010\u003c/a> that looked at the impact of demographic change on global carbon emissions. It found that slowing population growth could eliminate one-fifth to one-quarter of all the carbon emissions that need to be cut by midcentury to avoid that potentially catastrophic tipping point.\u003c/p>\n\u003cp>Rieder’s audience seems to want an easier way. A student asks about the carbon savings from not eating meat.\u003c/p>\n\u003cp>Excellent idea, Rieder says. But no amount of conservation gives you a pass. Oregon State University researchers \u003ca href=\"http://blog.oregonlive.com/environment_impact/2009/07/carbon%20legacy.pdf\">have calculated the savings\u003c/a> from all kinds of conservation measures: driving a hybrid, driving less, recycling, using energy-efficient appliances, windows and light bulbs.\u003c/p>\n\u003cp>For an American, the total metric tons of carbon dioxide saved by all of those measures over an entire lifetime of 80 years: 488. By contrast, the metric tons saved when a person chooses to have one fewer child: 9,441.\u003c/p>\n\u003cp>Another student asks: “What happens if that kid you decided not to have would have been the person who grew up and essentially cured this?”\u003c/p>\n\u003cp>Again, great question, says Rieder, but the answer is still no. First, the chances are slim. More to the point, he says, valuing children as a means to an end — be it to cure climate change or, say, provide soldiers for the state — is ethically problematic.\u003c/p>\n\u003cp>With all that’s at stake, he says, we need to shift our cultural attitudes. “It’s not the childless who must justify their lifestyle. It’s the rest of us.”\u003c/p>\n\u003cp>And that includes Rieder.\u003c/p>\n\u003cp>\u003cstrong>“One and Done”\u003c/strong>\u003c/p>\n\u003cp>At home, Travis Rieder’s face lights up when his 2-year-old daughter, Sinem, sings a favorite song. She stands at her mother’s knee, bouncing up and down on her toes, giggling as her parents clap.\u003c/p>\n\u003cp>After many conversations, he and Sadiye ended up convincing each other. Travis decided you can’t deny someone the hard-wired human fulfillment of creating a child.\u003c/p>\n\u003cp>But Sadiye agreed that the moral bar for a second child is much higher. The couple is “one and done.” Any more children will come through adoption.\u003c/p>\n\u003cp>Travis also argues that someone who doesn’t feel that deep longing to procreate is morally compelled to think twice before having any children at all.\u003c/p>\n\u003cp>When he writes online, Rieder often gets nasty comments, and inevitably people will say he must not have children. He believes it’s important that he understand viscerally what he’s asking of people. His daughter, he says, is “the most amazing thing we’ve ever done with our lives.”\u003c/p>\n\u003cp>So how do you persuade millions or billions of people around the world to sacrifice that? To avert climate disaster, the fertility rate would have to fall much faster than it has been. It would require more than educating women and expanding access to contraception, as aid agencies have been doing for decades.\u003c/p>\n\u003cp>\u003cstrong>Carrots for the Poor, Sticks for the Rich\u003c/strong>\u003c/p>\n\u003cp>Rieder and his Georgetown collaborators have a proposal, and the first thing they stress is that it’s not like China’s abusive \u003ca href=\"http://www.npr.org/sections/parallels/2013/11/29/247782924/chinese-welcome-two-child-policy-but-can-they-afford-it\">one-child policy\u003c/a>. It aims to persuade people to choose fewer children with a strategy that boils down to \u003ca href=\"http://www.npr.org/documents/2016/jun/population_engineering.pdf\">carrots for the poor, sticks for the rich.\u003c/a>\u003c/p>\n\u003cp>Ethically, Rieder says poor nations get some slack because they’re still developing, and because their per capita emissions are a sliver of the developed world’s. Plus, it just doesn’t look good for rich, Western nations to tell people in poor ones not to have kids. He suggests things like paying poor women to refill their birth control and — something that’s had proven success — widespread media campaigns.\u003c/p>\n\u003cp>In the 1970s and ’80s, a wave of educational soap operas in Latin America, Asia and Africa wove family planning into their plot lines. Some countries did this when they faced economic crisis. The shows are credited with actually \u003ca href=\"http://www.apa.org/monitor/oct02/theory.aspx\">changing people’s opinions\u003c/a> about family size.\u003c/p>\n\u003cp>For the sticks part of the plan, Rieder proposes that richer nations do away with tax breaks for having children and actually penalize new parents. He says the penalty should be progressive, based on income, and could increase with each additional child.\u003c/p>\n\u003cp>Think of it like a carbon tax, on kids. He knows that sounds crazy.\u003c/p>\n\u003cp>“But children, in a kind of cold way of looking at it, are an externality,” he says. “We as parents, we as family members, we get the good. And the world, the community, pays the cost.”\u003c/p>\n\u003cp>Of course, there are ethical concerns. \u003ca href=\"https://kennedyinstitute.georgetown.edu/people/rebecca-kukla/\">Rebecca Kukla\u003c/a> of Georgetown University worries about stigma, especially against poor and minority women. If cultural norms do change, she says, there could be a backlash against families with more children than is deemed socially appropriate.\u003c/p>\n\u003cp>Kukla appreciates that Rieder’s penalty on procreation would be progressive. But since it could not be so high as to be coercive, she says \u003ca href=\"https://www.academia.edu/27846638/Whose_Job_Is_It_to_Fight_Climate_Change_A_Response_to_Hickey_Rieder_and_Earl\" target=\"_blank\" rel=\"noopener\">it would inevitably be unfair\u003c/a>.\u003c/p>\n\u003cp>“What that will actually translate into is it becoming much easier for wealthy people to have children than for other people to have children,” Kukla says.\u003c/p>\n\u003cp>An even bigger hurdle is the sheer unlikelihood of it all. Rieder has no illusions. In fact, he says, some countries that have successfully reduced fertility rates have since reversed course, afraid that falling population will hurt their economies. (He has an answer — just as controversial — to that, too. He would have nations open up immigration to allow in the expected tens of millions of climate refugees.) Rieder’s real hope is to change people’s way of thinking about childbearing.\u003c/p>\n\u003cp>But if his idea seems like a last-ditch Hail Mary play, he wouldn’t disagree.\u003c/p>\n\u003cp>“The situation is bleak, it’s just dark,” he says. “Population engineering, maybe it’s an extreme move. But it gives us a chance.”\u003c/p>\n\u003cp>Still, Rieder wonders: Is it really so crazy? Scientists have proposed incredibly risky schemes to \u003ca href=\"http://www.npr.org/2013/10/20/238548240/turning-to-scientists-to-engineer-a-cooler-climate\">geoengineer the clouds and oceans\u003c/a>. They’re researching ways to suck carbon out of the air on a mass scale. Some have even called for overhauling the global system of \u003ca href=\"http://www.nybooks.com/articles/2014/12/04/can-climate-change-cure-capitalism/\">free-market capitalism\u003c/a>.\u003c/p>\n\u003cp>Compared to all that, Rieder says, bringing down the fertility rate seems downright easy.\u003c/p>\n\u003cp>\u003c/p>\u003c/div>",
"attributes": {
"named": {},
"numeric": []
}
},
{
"type": "component",
"content": "",
"name": "ad",
"attributes": {
"named": {
"label": "floatright"
},
"numeric": [
"floatright"
]
}
},
{
"type": "contentString",
"content": "\u003cdiv class=\"post-body\">\u003cp>\u003c/p>\n\u003cp>“We know exactly how to make fewer babies,” he says. And it’s something people can start doing today.\u003c/p>\n\u003cdiv class=\"fullattribution\">Copyright 2016 NPR. To see more, visit http://www.npr.org/.\u003cimg decoding=\"async\" src=\"http://www.google-analytics.com/__utm.gif?utmac=UA-5828686-4&utmdt=Should+We+Be+Having+Kids+In+The+Age+Of+Climate+Change%3F+&utme=8(APIKey)9(MDAxOTAwOTE4MDEyMTkxMDAzNjczZDljZA004)\">\u003c/div>\n\n\u003c/div>\u003c/p>",
"attributes": {
"named": {},
"numeric": []
}
}
],
"link": "/science/929164/should-we-be-having-kids-in-the-age-of-climate-change",
"authors": [
"byline_science_929164"
],
"categories": [
"science_31",
"science_40"
],
"featImg": "science_929167",
"label": "source_science_929164"
},
"science_907490": {
"type": "posts",
"id": "science_907490",
"meta": {
"index": "posts_1716263798",
"site": "science",
"id": "907490",
"score": null,
"sort": [
1470760326000
]
},
"parent": 0,
"labelTerm": {},
"blocks": [],
"publishDate": 1470760326,
"format": "standard",
"title": "Heat Wave Boosts U.S. to Third Warmest Year on Record Through July",
"headTitle": "Heat Wave Boosts U.S. to Third Warmest Year on Record Through July | KQED",
"content": "\u003cp>In the midst of the \u003ca href=\"http://www.climatecentral.org/news/map-peak-summer-heat-17671\">dog days of summer\u003c/a>, the U.S. is still having its third-hottest year on record through July. The month also saw two states — New Mexico and Florida — clinch their hottest July, while Alaska continued to stay on track for its warmest year in the books.\u003c/p>\n\u003cp>For the contiguous U.S., the year-to-date temperature was 54.3°F (12.4°C), or 3.0°F (1.7°C) above the 20th century average, according to \u003ca href=\"https://www.ncdc.noaa.gov/sotc/national/201607\">data released Monday\u003c/a> by the National Oceanic and Atmospheric Administration. Every state was warmer than average for the same period.\u003c/p>\n\u003cp>“The January-July period was the third warmest by a fairly wide margin,” NOAA climatologist Jake Crouch said in an email.\u003c/p>\n\u003cp>The U.S. has been just one hotspot on the planet, which is having its \u003ca href=\"http://www.climatecentral.org/news/first-half-of-2016-record-hot-by-far-20540\">warmest year on record\u003c/a> by a good margin. The globally hot year is largely the \u003ca href=\"http://www.climatecentral.org/2015-global-temp-record\">result of the excess heat trapped\u003c/a> by ever increasing amounts of greenhouse gases in the atmosphere.\u003c/p>\n\u003cfigure id=\"attachment_909589\" class=\"wp-caption aligncenter\" style=\"max-width: 650px\">\u003cimg loading=\"lazy\" decoding=\"async\" class=\"size-full wp-image-909589\" src=\"http://ww2.kqed.org/science/wp-content/uploads/sites/35/2016/08/NOAA_US_map.jpg\" alt=\"How temperatuers across the contiguous U.S. have compared to the 20th century average through July. \" width=\"650\" height=\"490\" srcset=\"https://cdn.kqed.org/wp-content/uploads/sites/35/2016/08/NOAA_US_map.jpg 650w, https://cdn.kqed.org/wp-content/uploads/sites/35/2016/08/NOAA_US_map-400x302.jpg 400w\" sizes=\"(max-width: 650px) 100vw, 650px\">\u003cfigcaption class=\"wp-caption-text\">How temperatuers across the contiguous U.S. have compared to the 20th century average through July. \u003ccite>(NOAA)\u003c/cite>\u003c/figcaption>\u003c/figure>\n\u003cp>Temperatures this year have \u003ca href=\"http://www.climatecentral.org/news/see-earths-temperature-spiral-toward-2c-20332\">edged close to 1.5°C\u003c/a> above the average for the late 19th century, before warming had much of an impact. Nations have agreed to limit warming this century to \u003ca href=\"http://www.climatecentral.org/news/see-earths-temperature-spiral-toward-2c-20332\">below 2°C\u003c/a>, with some discussion of aiming for the tougher 1.5°C threshold.\u003c/p>\n\u003cp>[ad fullwidth]\u003c/p>\n\u003cp>For the Lower 48, July was 75.3°F (24°C), or 1.6°F (0.9°C) above the 20th century average, the 14th warmest on record.\u003c/p>\n\u003cp>The hottest areas of the country were in the southern and eastern regions, courtesy of a ridge of high pressure that ushered in a \u003ca href=\"http://wxshift.com/news/heat-wave-to-blanket-us-next-week\">widespread heat wave\u003c/a> and dry conditions. That heat boosted New Mexico and Florida to their hottest July on record (New Mexico tied with July 2003.) July was the second warmest of any month for Florida, behind only June 1998.\u003c/p>\n\u003cp>“During summer, a dry month is typically accompanied by a warm month with the sun’s energy going into heating the surface, instead of evaporating water,” Crouch said. “The ridge also contributed to more cloud-free days, which caused daytime temperatures to soar.”\u003c/p>\n\u003cp>While much of the country sweltered, “that heat wasn’t felt by everyone,” Crouch said.\u003c/p>\n\u003cp>Parts of the Northwest and central U.S. had above-average precipitation, which helped keep temperatures down to near average. They also partly offset the heat elsewhere and kept July from ranking higher nationwide.\u003c/p>\n\u003cp>While the U.S. has stayed hot all year, it’s too early to say where 2016 will end up in the record books. One source of uncertainty is the possibility of a La Niña developing, which tends to lead to cooler temperatures in some areas. Forecasts have recently backed off on predictions for a La Niña event and have predicted a later appearance for the climate phenomenon than previously.\u003c/p>\n\u003cp>The outlook for the \u003ca href=\"http://www.climatecentral.org/news/warmer-temps-favored-across-entire-us-20561\">next few months\u003c/a> is for above-average temperatures across the U.S., so “it is likely that 2016 year-to-date temperature averages will remain in the top five category during the next couple of months,” Crouch said.\u003c/p>\n\u003cp>Alaska, meanwhile, has continued to be a standout spot for unusually hot temperatures and is on track to see its hottest year on record. Statewide, July was the fourth warmest on record, and several spots surpassed previous marks. Ted Stevens Anchorage International Airport had a monthly average temperature of 62.7°F (17°C), the warmest month observed there since records began in 1953.\u003c/p>\n\u003cp>\u003c/p>\n\u003cp>\u003ca href=\"http://www.climatecentral.org/\">\u003cspan style=\"font-weight: 400\">Climate Central\u003c/span>\u003c/a> \u003ci>\u003cspan style=\"font-weight: 400\">is an independent organization that researches and reports on climate change.\u003c/span>\u003c/i>\u003c/p>\n\n",
"stats": {
"hasVideo": false,
"hasChartOrMap": false,
"hasAudio": false,
"hasPolis": false,
"wordCount": 639,
"hasGoogleForm": false,
"hasGallery": false,
"hasHearkenModule": false,
"iframeSrcs": [],
"paragraphCount": 16
},
"modified": 1704929800,
"excerpt": "The U.S. is having its third-warmest year through July, in part thanks to a major heat wave across much of the country.",
"headData": {
"twImgId": "",
"twTitle": "",
"ogTitle": "",
"ogImgId": "",
"twDescription": "",
"description": "The U.S. is having its third-warmest year through July, in part thanks to a major heat wave across much of the country.",
"title": "Heat Wave Boosts U.S. to Third Warmest Year on Record Through July | KQED",
"ogDescription": "",
"schema": {
"@context": "https://schema.org",
"@type": "Article",
"headline": "Heat Wave Boosts U.S. to Third Warmest Year on Record Through July",
"datePublished": "2016-08-09T09:32:06-07:00",
"dateModified": "2024-01-10T15:36:40-08:00",
"image": "https://cdn.kqed.org/wp-content/uploads/2020/02/KQED-OG-Image@1x.png"
}
},
"guestAuthors": [],
"slug": "heat-wave-boosts-u-s-to-third-warmest-year-on-record-through-july",
"status": "publish",
"sourceUrl": "http://www.climatecentral.org/",
"nprByline": "Andrea Thompson\u003c/br>Climate Central",
"sticky": false,
"source": "Climate Central",
"path": "/science/907490/heat-wave-boosts-u-s-to-third-warmest-year-on-record-through-july",
"audioTrackLength": null,
"parsedContent": [
{
"type": "contentString",
"content": "\u003cdiv class=\"post-body\">\u003cp>\u003cp>In the midst of the \u003ca href=\"http://www.climatecentral.org/news/map-peak-summer-heat-17671\">dog days of summer\u003c/a>, the U.S. is still having its third-hottest year on record through July. The month also saw two states — New Mexico and Florida — clinch their hottest July, while Alaska continued to stay on track for its warmest year in the books.\u003c/p>\n\u003cp>For the contiguous U.S., the year-to-date temperature was 54.3°F (12.4°C), or 3.0°F (1.7°C) above the 20th century average, according to \u003ca href=\"https://www.ncdc.noaa.gov/sotc/national/201607\">data released Monday\u003c/a> by the National Oceanic and Atmospheric Administration. Every state was warmer than average for the same period.\u003c/p>\n\u003cp>“The January-July period was the third warmest by a fairly wide margin,” NOAA climatologist Jake Crouch said in an email.\u003c/p>\n\u003cp>The U.S. has been just one hotspot on the planet, which is having its \u003ca href=\"http://www.climatecentral.org/news/first-half-of-2016-record-hot-by-far-20540\">warmest year on record\u003c/a> by a good margin. The globally hot year is largely the \u003ca href=\"http://www.climatecentral.org/2015-global-temp-record\">result of the excess heat trapped\u003c/a> by ever increasing amounts of greenhouse gases in the atmosphere.\u003c/p>\n\u003cfigure id=\"attachment_909589\" class=\"wp-caption aligncenter\" style=\"max-width: 650px\">\u003cimg loading=\"lazy\" decoding=\"async\" class=\"size-full wp-image-909589\" src=\"http://ww2.kqed.org/science/wp-content/uploads/sites/35/2016/08/NOAA_US_map.jpg\" alt=\"How temperatuers across the contiguous U.S. have compared to the 20th century average through July. \" width=\"650\" height=\"490\" srcset=\"https://cdn.kqed.org/wp-content/uploads/sites/35/2016/08/NOAA_US_map.jpg 650w, https://cdn.kqed.org/wp-content/uploads/sites/35/2016/08/NOAA_US_map-400x302.jpg 400w\" sizes=\"(max-width: 650px) 100vw, 650px\">\u003cfigcaption class=\"wp-caption-text\">How temperatuers across the contiguous U.S. have compared to the 20th century average through July. \u003ccite>(NOAA)\u003c/cite>\u003c/figcaption>\u003c/figure>\n\u003cp>Temperatures this year have \u003ca href=\"http://www.climatecentral.org/news/see-earths-temperature-spiral-toward-2c-20332\">edged close to 1.5°C\u003c/a> above the average for the late 19th century, before warming had much of an impact. Nations have agreed to limit warming this century to \u003ca href=\"http://www.climatecentral.org/news/see-earths-temperature-spiral-toward-2c-20332\">below 2°C\u003c/a>, with some discussion of aiming for the tougher 1.5°C threshold.\u003c/p>\n\u003cp>\u003c/p>\u003c/div>",
"attributes": {
"named": {},
"numeric": []
}
},
{
"type": "component",
"content": "",
"name": "ad",
"attributes": {
"named": {
"label": "fullwidth"
},
"numeric": [
"fullwidth"
]
}
},
{
"type": "contentString",
"content": "\u003cdiv class=\"post-body\">\u003cp>\u003c/p>\n\u003cp>For the Lower 48, July was 75.3°F (24°C), or 1.6°F (0.9°C) above the 20th century average, the 14th warmest on record.\u003c/p>\n\u003cp>The hottest areas of the country were in the southern and eastern regions, courtesy of a ridge of high pressure that ushered in a \u003ca href=\"http://wxshift.com/news/heat-wave-to-blanket-us-next-week\">widespread heat wave\u003c/a> and dry conditions. That heat boosted New Mexico and Florida to their hottest July on record (New Mexico tied with July 2003.) July was the second warmest of any month for Florida, behind only June 1998.\u003c/p>\n\u003cp>“During summer, a dry month is typically accompanied by a warm month with the sun’s energy going into heating the surface, instead of evaporating water,” Crouch said. “The ridge also contributed to more cloud-free days, which caused daytime temperatures to soar.”\u003c/p>\n\u003cp>While much of the country sweltered, “that heat wasn’t felt by everyone,” Crouch said.\u003c/p>\n\u003cp>Parts of the Northwest and central U.S. had above-average precipitation, which helped keep temperatures down to near average. They also partly offset the heat elsewhere and kept July from ranking higher nationwide.\u003c/p>\n\u003cp>While the U.S. has stayed hot all year, it’s too early to say where 2016 will end up in the record books. One source of uncertainty is the possibility of a La Niña developing, which tends to lead to cooler temperatures in some areas. Forecasts have recently backed off on predictions for a La Niña event and have predicted a later appearance for the climate phenomenon than previously.\u003c/p>\n\u003cp>The outlook for the \u003ca href=\"http://www.climatecentral.org/news/warmer-temps-favored-across-entire-us-20561\">next few months\u003c/a> is for above-average temperatures across the U.S., so “it is likely that 2016 year-to-date temperature averages will remain in the top five category during the next couple of months,” Crouch said.\u003c/p>\n\u003cp>Alaska, meanwhile, has continued to be a standout spot for unusually hot temperatures and is on track to see its hottest year on record. Statewide, July was the fourth warmest on record, and several spots surpassed previous marks. Ted Stevens Anchorage International Airport had a monthly average temperature of 62.7°F (17°C), the warmest month observed there since records began in 1953.\u003c/p>\n\u003cp>\u003c/p>\n\u003cp>\u003ca href=\"http://www.climatecentral.org/\">\u003cspan style=\"font-weight: 400\">Climate Central\u003c/span>\u003c/a> \u003ci>\u003cspan style=\"font-weight: 400\">is an independent organization that researches and reports on climate change.\u003c/span>\u003c/i>\u003c/p>\n\n\u003c/div>\u003c/p>",
"attributes": {
"named": {},
"numeric": []
}
}
],
"link": "/science/907490/heat-wave-boosts-u-s-to-third-warmest-year-on-record-through-july",
"authors": [
"byline_science_907490"
],
"categories": [
"science_31",
"science_40"
],
"featImg": "science_909583",
"label": "source_science_907490"
},
"science_899859": {
"type": "posts",
"id": "science_899859",
"meta": {
"index": "posts_1716263798",
"site": "science",
"id": "899859",
"score": null,
"sort": [
1470410855000
]
},
"parent": 0,
"labelTerm": {},
"blocks": [],
"publishDate": 1470410855,
"format": "standard",
"title": "Scientists Tease Out Climate Change’s Role in Zika Spread",
"headTitle": "Scientists Tease Out Climate Change’s Role in Zika Spread | KQED",
"content": "\u003cp>Athletes and tourists converging on Brazil this week are crowding into a country where rapid environmental change and natural weather fluctuations nurtured a viral epidemic that has gone global.\u003c/p>\n\u003cp>The Zika virus has exploded throughout South America, up through Mexico and Puerto Rico and into Florida, but the conditions it needed to fester in northern Brazil were rooted in urbanization and poverty. The initial Brazilian outbreak appears to have been aided by a drought driven by El Niño, and by higher temperatures caused by longer-term weather cycles and by rising levels of greenhouse gas pollution.\u003c/p>\n\u003caside class=\"pullquote alignright\">Warming temperatures have lengthened the mosquito seasons in three quarters of major U.S. cities.\u003c/aside>\n\u003cp>This combination of human and natural forces is emerging as the possible incubator of a disease that’s painfully elusive to detect, despite its cruel effects on unborn children.\u003c/p>\n\u003cp>The U.S. Centers for Disease Control and Prevention issued an \u003ca href=\"http://www.nytimes.com/2016/08/02/health/zika-florida.html\">unprecedented domestic travel advisory\u003c/a> this week, warning pregnant women to avoid a Miami neighborhood where more than a dozen Zika cases were confirmed.\u003c/p>\n\u003cp>The warning came six months after the \u003ca href=\"http://www.who.int/mediacentre/news/statements/2016/1st-emergency-committee-zika/en/\">World Health Organization declared\u003c/a> a public health emergency “of international concern” in Brazil, where the opening ceremony for the Summer Olympics is scheduled for Friday.\u003c/p>\n\u003cp>[ad fullwidth]\u003c/p>\n\u003cp>Most Zika infections produce no symptoms, turning their hosts into unwitting harbors for the disease, which is mainly spread through mosquito bites. Unborn children risk microcephaly when their mothers are infected, meaning their heads are small — the result of unusual brain development.\u003c/p>\n\u003cp>While the effects of El Niño and other weather cycles are beyond the control of humans, the recent spread of the disease into the U.S. is a savage reminder of the heavy toll that humans are taking on their planet — and of the potential for those changes to bite back.\u003c/p>\n\u003cp>Climate Central \u003ca href=\"http://www.climatecentral.org/news/more-mosquito-days-increasing-zika-risk-in-us-20553\">research recently showed\u003c/a> that warming temperatures have lengthened the mosquito seasons in three quarters of major cities in the U.S.\u003c/p>\n\u003cp>For Americans unaccustomed to fearing tropical diseases at home, the northward march of the outbreak is delivering an exotic threat. \u003ca href=\"http://undark.org/2016/08/02/peak-mosquito-time-atlantic-coast-will-zika-follow/\">Researchers are warning\u003c/a> that the disease could reach the halls of power in Washington D.C. and the dense metropolis of New York.\u003c/p>\n\u003cp>Mosquitoes rely on water to breed and flourish, yet a drought that beset northern Brazil amid a heatwave in 2014 and 2015 — while the disease was stealthily taking root — is thought to have worked in the mosquitoes’ favor.\u003c/p>\n\u003cp>That’s because households began storing more water, ushering breeding mosquitoes and their larvae inside their homes. Like other developing countries, many in Brazil lack regular access to piped water.\u003c/p>\n\u003cp>“If you have a drought, you don’t have reliable water access, and that makes you go and get water and store,” said \u003ca href=\"http://geog.ufl.edu/faculty/ryan/\">Sadie Ryan\u003c/a>, a medical geographer at the University of Florida. “By storing it, you’re creating mosquito habitat.”\u003c/p>\n\u003cp>Small puddles and ponds of water that accumulate in urbanized areas also tend to favor the lifestyles of the types of mosquitoes that spread Zika, compared with those that tend to thrive in more remote regions. Ryan called these types of mosquitoes “urban capable.”\u003c/p>\n\u003cp>“In South America up to the ‘70s, there was a really big push for vector control,” Ryan said, referring to efforts to control mosquito populations, such as spraying insecticides. “Then the money went away for it.”\u003c/p>\n\u003cp>Meanwhile, temperatures have been rising globally because of the polluting effects of fossil fuel-powered industrialization, deforestation and livestock farming, and natural climate cycles have been exacerbating the rate of warming in some places, such as in northern Brazil and California. That’s significant, because mosquitoes can only survive above certain temperatures.\u003c/p>\n\u003cp>“Once you’re over that minimum temperature, there’s nothing killing the vector,” Ryan said. “There’s nothing slowing it down.”\u003c/p>\n\u003cp>In a February letter \u003ca href=\"http://thelancet.com/journals/lancet/article/PIIS0140-6736(16)00256-7/fulltext\">published in The Lancet\u003c/a>, a British medical journal, the University of Haifa’s \u003ca href=\"http://geo.haifa.ac.il/~spaz/\">Shlomit Paz\u003c/a> and \u003ca href=\"https://www.sei-international.org/staff?staffid=393\">Jan Semenza\u003c/a> of the Stockholm Environment Institute and the European Centre for Disease Prevention and Control reported discovering a “striking overlap” between areas in Brazil that were afflicted by extreme weather linked to El Niño, and areas where Zika was lurking one month later.\u003c/p>\n\u003cp>“We definitely think temperature and climate have an impact on transmission, but that relationship is often complex,” Semenza said. “It’s always very difficult to attribute one single climatic event to climate change, and then draw a causal link to health outcomes.”\u003c/p>\n\u003cp>More recently, a team of American and Venezuelan scientists took a closer statistical look at the relationship between climate and the Zika outbreak, and reported that El Niño and climate change were not the only important factors — though they were both important.\u003c/p>\n\u003cp>While the team blamed El Niño for the drought that fueled the Zika outbreak, they concluded that climate change and long-term weather cycles, such as the Pacific Decadal Oscillation, which is a long-term cycle in trade winds that \u003ca href=\"http://www.climatecentral.org/news/scientists-say-warming-slowdown-was-real-20068\">influences surface temperatures globally\u003c/a>, played important roles in pushing temperatures up to those favored by Zika-carrying mosquitoes.\u003c/p>\n\u003cp>The findings were hurriedly pre-published without being peer reviewed \u003ca href=\"http://biorxiv.org/content/early/2016/06/19/059808\">on the website bioRxiv\u003c/a>. That provided health officials and policymakers with rapid information about the findings while the details continue to be reviewed and improved.\u003c/p>\n\u003cp>\u003ca href=\"http://www.bu.edu/pardee/community/staff/janetos/\">Anthony Janetos\u003c/a>, a professor of earth and environmental studies at Boston University, who wasn’t involved with the recent study, warned that it does not definitively prove the links that the researchers reported.\u003c/p>\n\u003cp>Because of that, Janetos criticized the researchers for their choice of headline for the paper, which states that the Zika epidemic was “fueled by climate variations.”\u003c/p>\n\u003cp>“If they’d been able to show that the same patterns occurred in other outbreak regions, such as Puerto Rico, then their circumstantial case would be stronger,” Janetos said. “But they haven’t done that.”\u003c/p>\n\u003cp>\u003ca href=\"https://www.princeton.edu/cics/people/display_person.xml?netid=agms&display=All\">Ángel Muñoz\u003c/a>, a climate scientist with affiliations at Princeton and Columbia universities who led the research, acknowledged Janetos’s criticisms, and he said the headline would be changed prior to final publication.\u003c/p>\n\u003cp>“This paper is not an answer for a lot of the questions that we have, but it’s an important step,” Muñoz said.\u003c/p>\n\u003cp>“It’s not possible right now to show a formal link between Zika and climate, because no one has enough data,” Muñoz said. “You need years, not months.”\u003c/p>\n\u003cp>With models warning that the epidemic will worsen before it begins to improve, the human suffering that’s expected in the months and years to come may help scientists continue to tease apart roles of natural forces in driving the outbreak from those of climate change and other problems caused by humans.\u003c/p>\n\u003cp>[ad floatright]\u003c/p>\n\u003cp>\u003ca href=\"http://www.climatecentral.org/\">Climate Central\u003c/a> \u003cem>is an independent organization that researches and reports on climate change.\u003c/em>\u003c/p>\n\n",
"stats": {
"hasVideo": false,
"hasChartOrMap": false,
"hasAudio": false,
"hasPolis": false,
"wordCount": 1192,
"hasGoogleForm": false,
"hasGallery": false,
"hasHearkenModule": false,
"iframeSrcs": [],
"paragraphCount": 31
},
"modified": 1704929813,
"excerpt": "As Zika spreads northward, scientists are beginning to understand how human greenhouse gas emissions stoked the epidemic.",
"headData": {
"twImgId": "",
"twTitle": "",
"ogTitle": "",
"ogImgId": "",
"twDescription": "",
"description": "As Zika spreads northward, scientists are beginning to understand how human greenhouse gas emissions stoked the epidemic.",
"title": "Scientists Tease Out Climate Change’s Role in Zika Spread | KQED",
"ogDescription": "",
"schema": {
"@context": "https://schema.org",
"@type": "Article",
"headline": "Scientists Tease Out Climate Change’s Role in Zika Spread",
"datePublished": "2016-08-05T08:27:35-07:00",
"dateModified": "2024-01-10T15:36:53-08:00",
"image": "https://cdn.kqed.org/wp-content/uploads/2020/02/KQED-OG-Image@1x.png"
}
},
"guestAuthors": [],
"slug": "scientists-tease-out-climate-changes-role-in-zika-spread",
"status": "publish",
"sourceUrl": "http://www.climatecentral.org/",
"nprByline": "John Upton\u003c/br>Climate Central",
"sticky": false,
"source": "Climate Central",
"path": "/science/899859/scientists-tease-out-climate-changes-role-in-zika-spread",
"audioTrackLength": null,
"parsedContent": [
{
"type": "contentString",
"content": "\u003cdiv class=\"post-body\">\u003cp>\u003cp>Athletes and tourists converging on Brazil this week are crowding into a country where rapid environmental change and natural weather fluctuations nurtured a viral epidemic that has gone global.\u003c/p>\n\u003cp>The Zika virus has exploded throughout South America, up through Mexico and Puerto Rico and into Florida, but the conditions it needed to fester in northern Brazil were rooted in urbanization and poverty. The initial Brazilian outbreak appears to have been aided by a drought driven by El Niño, and by higher temperatures caused by longer-term weather cycles and by rising levels of greenhouse gas pollution.\u003c/p>\n\u003caside class=\"pullquote alignright\">Warming temperatures have lengthened the mosquito seasons in three quarters of major U.S. cities.\u003c/aside>\n\u003cp>This combination of human and natural forces is emerging as the possible incubator of a disease that’s painfully elusive to detect, despite its cruel effects on unborn children.\u003c/p>\n\u003cp>The U.S. Centers for Disease Control and Prevention issued an \u003ca href=\"http://www.nytimes.com/2016/08/02/health/zika-florida.html\">unprecedented domestic travel advisory\u003c/a> this week, warning pregnant women to avoid a Miami neighborhood where more than a dozen Zika cases were confirmed.\u003c/p>\n\u003cp>The warning came six months after the \u003ca href=\"http://www.who.int/mediacentre/news/statements/2016/1st-emergency-committee-zika/en/\">World Health Organization declared\u003c/a> a public health emergency “of international concern” in Brazil, where the opening ceremony for the Summer Olympics is scheduled for Friday.\u003c/p>\n\u003cp>\u003c/p>\u003c/div>",
"attributes": {
"named": {},
"numeric": []
}
},
{
"type": "component",
"content": "",
"name": "ad",
"attributes": {
"named": {
"label": "fullwidth"
},
"numeric": [
"fullwidth"
]
}
},
{
"type": "contentString",
"content": "\u003cdiv class=\"post-body\">\u003cp>\u003c/p>\n\u003cp>Most Zika infections produce no symptoms, turning their hosts into unwitting harbors for the disease, which is mainly spread through mosquito bites. Unborn children risk microcephaly when their mothers are infected, meaning their heads are small — the result of unusual brain development.\u003c/p>\n\u003cp>While the effects of El Niño and other weather cycles are beyond the control of humans, the recent spread of the disease into the U.S. is a savage reminder of the heavy toll that humans are taking on their planet — and of the potential for those changes to bite back.\u003c/p>\n\u003cp>Climate Central \u003ca href=\"http://www.climatecentral.org/news/more-mosquito-days-increasing-zika-risk-in-us-20553\">research recently showed\u003c/a> that warming temperatures have lengthened the mosquito seasons in three quarters of major cities in the U.S.\u003c/p>\n\u003cp>For Americans unaccustomed to fearing tropical diseases at home, the northward march of the outbreak is delivering an exotic threat. \u003ca href=\"http://undark.org/2016/08/02/peak-mosquito-time-atlantic-coast-will-zika-follow/\">Researchers are warning\u003c/a> that the disease could reach the halls of power in Washington D.C. and the dense metropolis of New York.\u003c/p>\n\u003cp>Mosquitoes rely on water to breed and flourish, yet a drought that beset northern Brazil amid a heatwave in 2014 and 2015 — while the disease was stealthily taking root — is thought to have worked in the mosquitoes’ favor.\u003c/p>\n\u003cp>That’s because households began storing more water, ushering breeding mosquitoes and their larvae inside their homes. Like other developing countries, many in Brazil lack regular access to piped water.\u003c/p>\n\u003cp>“If you have a drought, you don’t have reliable water access, and that makes you go and get water and store,” said \u003ca href=\"http://geog.ufl.edu/faculty/ryan/\">Sadie Ryan\u003c/a>, a medical geographer at the University of Florida. “By storing it, you’re creating mosquito habitat.”\u003c/p>\n\u003cp>Small puddles and ponds of water that accumulate in urbanized areas also tend to favor the lifestyles of the types of mosquitoes that spread Zika, compared with those that tend to thrive in more remote regions. Ryan called these types of mosquitoes “urban capable.”\u003c/p>\n\u003cp>“In South America up to the ‘70s, there was a really big push for vector control,” Ryan said, referring to efforts to control mosquito populations, such as spraying insecticides. “Then the money went away for it.”\u003c/p>\n\u003cp>Meanwhile, temperatures have been rising globally because of the polluting effects of fossil fuel-powered industrialization, deforestation and livestock farming, and natural climate cycles have been exacerbating the rate of warming in some places, such as in northern Brazil and California. That’s significant, because mosquitoes can only survive above certain temperatures.\u003c/p>\n\u003cp>“Once you’re over that minimum temperature, there’s nothing killing the vector,” Ryan said. “There’s nothing slowing it down.”\u003c/p>\n\u003cp>In a February letter \u003ca href=\"http://thelancet.com/journals/lancet/article/PIIS0140-6736(16)00256-7/fulltext\">published in The Lancet\u003c/a>, a British medical journal, the University of Haifa’s \u003ca href=\"http://geo.haifa.ac.il/~spaz/\">Shlomit Paz\u003c/a> and \u003ca href=\"https://www.sei-international.org/staff?staffid=393\">Jan Semenza\u003c/a> of the Stockholm Environment Institute and the European Centre for Disease Prevention and Control reported discovering a “striking overlap” between areas in Brazil that were afflicted by extreme weather linked to El Niño, and areas where Zika was lurking one month later.\u003c/p>\n\u003cp>“We definitely think temperature and climate have an impact on transmission, but that relationship is often complex,” Semenza said. “It’s always very difficult to attribute one single climatic event to climate change, and then draw a causal link to health outcomes.”\u003c/p>\n\u003cp>More recently, a team of American and Venezuelan scientists took a closer statistical look at the relationship between climate and the Zika outbreak, and reported that El Niño and climate change were not the only important factors — though they were both important.\u003c/p>\n\u003cp>While the team blamed El Niño for the drought that fueled the Zika outbreak, they concluded that climate change and long-term weather cycles, such as the Pacific Decadal Oscillation, which is a long-term cycle in trade winds that \u003ca href=\"http://www.climatecentral.org/news/scientists-say-warming-slowdown-was-real-20068\">influences surface temperatures globally\u003c/a>, played important roles in pushing temperatures up to those favored by Zika-carrying mosquitoes.\u003c/p>\n\u003cp>The findings were hurriedly pre-published without being peer reviewed \u003ca href=\"http://biorxiv.org/content/early/2016/06/19/059808\">on the website bioRxiv\u003c/a>. That provided health officials and policymakers with rapid information about the findings while the details continue to be reviewed and improved.\u003c/p>\n\u003cp>\u003ca href=\"http://www.bu.edu/pardee/community/staff/janetos/\">Anthony Janetos\u003c/a>, a professor of earth and environmental studies at Boston University, who wasn’t involved with the recent study, warned that it does not definitively prove the links that the researchers reported.\u003c/p>\n\u003cp>Because of that, Janetos criticized the researchers for their choice of headline for the paper, which states that the Zika epidemic was “fueled by climate variations.”\u003c/p>\n\u003cp>“If they’d been able to show that the same patterns occurred in other outbreak regions, such as Puerto Rico, then their circumstantial case would be stronger,” Janetos said. “But they haven’t done that.”\u003c/p>\n\u003cp>\u003ca href=\"https://www.princeton.edu/cics/people/display_person.xml?netid=agms&display=All\">Ángel Muñoz\u003c/a>, a climate scientist with affiliations at Princeton and Columbia universities who led the research, acknowledged Janetos’s criticisms, and he said the headline would be changed prior to final publication.\u003c/p>\n\u003cp>“This paper is not an answer for a lot of the questions that we have, but it’s an important step,” Muñoz said.\u003c/p>\n\u003cp>“It’s not possible right now to show a formal link between Zika and climate, because no one has enough data,” Muñoz said. “You need years, not months.”\u003c/p>\n\u003cp>With models warning that the epidemic will worsen before it begins to improve, the human suffering that’s expected in the months and years to come may help scientists continue to tease apart roles of natural forces in driving the outbreak from those of climate change and other problems caused by humans.\u003c/p>\n\u003cp>\u003c/p>\u003c/div>",
"attributes": {
"named": {},
"numeric": []
}
},
{
"type": "component",
"content": "",
"name": "ad",
"attributes": {
"named": {
"label": "floatright"
},
"numeric": [
"floatright"
]
}
},
{
"type": "contentString",
"content": "\u003cdiv class=\"post-body\">\u003cp>\u003c/p>\n\u003cp>\u003ca href=\"http://www.climatecentral.org/\">Climate Central\u003c/a> \u003cem>is an independent organization that researches and reports on climate change.\u003c/em>\u003c/p>\n\n\u003c/div>\u003c/p>",
"attributes": {
"named": {},
"numeric": []
}
}
],
"link": "/science/899859/scientists-tease-out-climate-changes-role-in-zika-spread",
"authors": [
"byline_science_899859"
],
"categories": [
"science_31",
"science_39",
"science_40"
],
"featImg": "science_899863",
"label": "source_science_899859"
},
"science_880923": {
"type": "posts",
"id": "science_880923",
"meta": {
"index": "posts_1716263798",
"site": "science",
"id": "880923",
"score": null,
"sort": [
1470350880000
]
},
"parent": 0,
"labelTerm": {
"site": "science"
},
"blocks": [],
"publishDate": 1470350880,
"format": "image",
"title": "Blue Whale Recovery Signals Improving Ocean Conditions",
"headTitle": "Blue Whale Recovery Signals Improving Ocean Conditions | KQED",
"content": "\u003cp>Twenty six nautical miles outside the Golden Gate, the spindly peaks of the Farallon Islands bobbing in view, the \u003ca href=\"http://www.sanctuarysimon.org/regional_sections/fulmar/\">R/V Fulmar\u003c/a> research vessel has made space for me to observe how researchers carry out their commitment to keep our oceans healthy.\u003c/p>\n\u003cp>Still working on developing my sea legs, I clamber up a ladder to the top deck, and as gingerly as possible, stumble to the bow of the boat.\u003c/p>\n\u003cp>This vessel is run by a marine conservation partnership called \u003ca href=\"http://www.accessoceans.org/\">ACCESS\u003c/a>, or the Applied California Current Ecosystem Studies. The crew, comprised of marine researchers from the National Ocean and Atmospheric Administration (\u003ca href=\"http://www.noaa.gov/\">NOAA)\u003c/a> and the non-profit agency \u003ca href=\"http://www.pointblue.org/\">Point Blue\u003c/a>, is scanning the horizon for signs of life, which they are finding in abundance. [contextly_sidebar id=”bwAQS8zN4wV2Q3mMQXirOa6vGPpNfj18″]\u003c/p>\n\u003cp>On this brilliant July afternoon, the scientists on board are deploying nets and hauling in microscopic forms of life from the ocean. They pull in tiny krill and their even tinier food source, plankton, the marine plants that form the foundation of the ocean’s food chain and shed light on the health of the vital marine habitat off the coast of Northern California.\u003c/p>\n\u003cp>One researcher records the number of wildlife that surround the boat, while the others gaze through binoculars and call out species names as they see them — like puffins, white-sided dolphins and \u003ca href=\"http://www.audubon.org/field-guide/bird/red-necked-phalarope\" target=\"_blank\" rel=\"noopener\">red-necked phalaropes\u003c/a>.\u003c/p>\n\u003cfigure id=\"attachment_897891\" class=\"wp-caption aligncenter\" style=\"max-width: 800px\">\u003cimg loading=\"lazy\" decoding=\"async\" class=\"wp-image-897891 size-medium\" src=\"http://ww2.kqed.org/science/wp-content/uploads/sites/35/2016/08/ACCESS-Research-Cruise-Pix-157-800x450.jpg\" alt=\"Taylor Nairn, of the Greater Farallones Association, records wildlife sightings along an observational transect as a member of the AV Fulmar's marine research crew.\" width=\"800\" height=\"450\" srcset=\"https://cdn.kqed.org/wp-content/uploads/sites/35/2016/08/ACCESS-Research-Cruise-Pix-157-800x450.jpg 800w, https://cdn.kqed.org/wp-content/uploads/sites/35/2016/08/ACCESS-Research-Cruise-Pix-157-400x225.jpg 400w, https://cdn.kqed.org/wp-content/uploads/sites/35/2016/08/ACCESS-Research-Cruise-Pix-157-768x432.jpg 768w, https://cdn.kqed.org/wp-content/uploads/sites/35/2016/08/ACCESS-Research-Cruise-Pix-157-1440x810.jpg 1440w, https://cdn.kqed.org/wp-content/uploads/sites/35/2016/08/ACCESS-Research-Cruise-Pix-157-1920x1080.jpg 1920w, https://cdn.kqed.org/wp-content/uploads/sites/35/2016/08/ACCESS-Research-Cruise-Pix-157-1180x664.jpg 1180w, https://cdn.kqed.org/wp-content/uploads/sites/35/2016/08/ACCESS-Research-Cruise-Pix-157-960x540.jpg 960w\" sizes=\"(max-width: 800px) 100vw, 800px\">\u003cfigcaption class=\"wp-caption-text\">Taylor Nairn, of the Greater Farallones Association, records wildlife sightings along an observational transect as a member of the R/V Fulmar’s marine research crew. \u003ccite>(Aurora MacRae-Crerar/KQED)\u003c/cite>\u003c/figcaption>\u003c/figure>\n\u003cp>First mate Marshall Stein offers me his front-row swivel seat and moments later, there’s a wave of excitement as one, two, three, four blue whales come into focus. Mouth agape, I stare at the largest animals the planet has ever seen as they spout water from their blowholes, the silhouettes of their majestic blue backs against the backdrop of the Farallon Islands. I am speechless. So are the marine biologists. This is extraordinary, not only for a novice like me, but also for seasoned researchers.\u003c/p>\n\u003cfigure id=\"attachment_880927\" class=\"wp-caption aligncenter\" style=\"max-width: 800px\">\u003cimg loading=\"lazy\" decoding=\"async\" class=\"size-medium wp-image-880927\" src=\"http://ww2.kqed.org/science/wp-content/uploads/sites/35/2016/07/iStock_33627068_XXLARGE-800x600.jpg\" alt=\"Blue whales have been on Earth for over 53 million years. The largest animal ever to have graced our planet, they are massive, majestic and endangered, but making a comeback on the California coast. They can grow to be over 100 feet long and can weigh over 200 tons. They have a lifespan of up to 90 years. \" width=\"800\" height=\"600\" srcset=\"https://cdn.kqed.org/wp-content/uploads/sites/35/2016/07/iStock_33627068_XXLARGE-800x600.jpg 800w, https://cdn.kqed.org/wp-content/uploads/sites/35/2016/07/iStock_33627068_XXLARGE-400x300.jpg 400w, https://cdn.kqed.org/wp-content/uploads/sites/35/2016/07/iStock_33627068_XXLARGE-768x576.jpg 768w, https://cdn.kqed.org/wp-content/uploads/sites/35/2016/07/iStock_33627068_XXLARGE-1440x1080.jpg 1440w, https://cdn.kqed.org/wp-content/uploads/sites/35/2016/07/iStock_33627068_XXLARGE-1920x1440.jpg 1920w, https://cdn.kqed.org/wp-content/uploads/sites/35/2016/07/iStock_33627068_XXLARGE-1180x885.jpg 1180w, https://cdn.kqed.org/wp-content/uploads/sites/35/2016/07/iStock_33627068_XXLARGE-960x720.jpg 960w\" sizes=\"(max-width: 800px) 100vw, 800px\">\u003cfigcaption class=\"wp-caption-text\">Blue whales have been on Earth for over 53 million years. The largest animal to have ever graced our planet, they are massive, majestic and endangered, but making a comeback on the California coast. They can grow to be over 100 feet long and can weigh over 200 tons. They have a lifespan of up to 90 years. \u003ccite>(iStock)\u003c/cite>\u003c/figcaption>\u003c/figure>\n\u003cp>Since April, there have been a \u003ca href=\"http://ww2.kqed.org/science/2016/06/03/humpback-whales-exploring-the-bay-in-unprecedented-numbers/\">record number\u003c/a> of whale sightings in San Francisco Bay—including \u003ca href=\"http://kron4.com/2016/07/11/stunning-video-close-encounter-with-whales-near-treasure-island/\">this\u003c/a> breathtaking encounter filmed by a local kayaker.\u003c/p>\n\u003cp>[ad fullwidth]\u003c/p>\n\u003cp>“Yesterday was gangbusters,” exclaims Jan Roletto, the research coordinator for the \u003ca href=\"http://farallones.noaa.gov/\">Greater Farallones National Marine Sanctuary\u003c/a>, which falls under the NOAA umbrella. On their first day out, the crew saw 85 blue and humpback whales. On the second day, I was there as the crew made 48 more whale observations. Such sightings suggest that the whales are making a strong comeback.\u003c/p>\n\u003caside class=\"pullquote alignright\">‘It’s a real story of recovery.’\u003ccite> Jaime Jahncke, Point Blue \u003c/cite>\u003c/aside>\n\u003cp>This July alone, the crew of the R/V Fulmar has seen more whales (around 237) than scientists recorded during the entire summer last year — about \u003ca href=\"http://accessoceans.org/uploads/Ocean_Climate_Indicators_Report_2015.pdf\" target=\"_blank\" rel=\"noopener\">180\u003c/a>.\u003c/p>\n\u003cp>The \u003ca href=\"http://farallones.noaa.gov/\" target=\"_blank\" rel=\"noopener\">Greater Farallones Marine Sanctuary\u003c/a> is lush with nutrients, making it the place where whales meet and eat.\u003c/p>\n\u003caside class=\"pullquote alignright\">\u003c/aside>\n\u003cp>“It’s a real story of recovery,” says Jaime Jahncke, a lead scientist at Point Blue. But what are they recovering from?\u003c/p>\n\u003cp>The lower whale abundance in 2015 was a consequence of two natural phenomena: a sprawling mass of anomalously warm water known as \u003ca href=\"http://ww2.kqed.org/science/2015/08/09/possible-spoiler-for-el-nino-a-battle-of-the-blobs/\">the Blob, and El Niño\u003c/a>, a periodic shift in both ocean and atmospheric conditions. Together, they raised ocean temperatures and had mostly negative effects on marine life, \u003ca href=\"http://ww2.kqed.org/science/2015/11/23/how-warmer-waters-have-led-to-emaciated-seals-on-california-beaches/\">such as California seals\u003c/a> and sea lions. Thousands of sea lion pups were stranded or killed in February and March 2015.\u003c/p>\n\u003cfigure id=\"attachment_894517\" class=\"wp-caption aligncenter\" style=\"max-width: 800px\">\u003cimg loading=\"lazy\" decoding=\"async\" class=\"size-medium wp-image-894517\" src=\"http://ww2.kqed.org/science/wp-content/uploads/sites/35/2016/08/sea-lion-pup-800x533.jpg\" alt=\"Unusually warm waters brought in by a combination of El Ñino and the Blob in late 2015 to early 2016 were not good for sea lion pups. These anomalously high temperatures disrupted the marine food chain, leaving the pups malnourished. This has lead to the recent high rates of sea lion pup mortality.\" width=\"800\" height=\"533\" srcset=\"https://cdn.kqed.org/wp-content/uploads/sites/35/2016/08/sea-lion-pup-800x533.jpg 800w, https://cdn.kqed.org/wp-content/uploads/sites/35/2016/08/sea-lion-pup-400x267.jpg 400w, https://cdn.kqed.org/wp-content/uploads/sites/35/2016/08/sea-lion-pup-768x512.jpg 768w, https://cdn.kqed.org/wp-content/uploads/sites/35/2016/08/sea-lion-pup-1440x960.jpg 1440w, https://cdn.kqed.org/wp-content/uploads/sites/35/2016/08/sea-lion-pup-1920x1280.jpg 1920w, https://cdn.kqed.org/wp-content/uploads/sites/35/2016/08/sea-lion-pup-1180x787.jpg 1180w, https://cdn.kqed.org/wp-content/uploads/sites/35/2016/08/sea-lion-pup-960x640.jpg 960w\" sizes=\"(max-width: 800px) 100vw, 800px\">\u003cfigcaption class=\"wp-caption-text\">Unusually warm ocean conditions in late 2015 led to high rates of sea lion pup mortality. \u003ccite>(iStock)\u003c/cite>\u003c/figcaption>\u003c/figure>\n\u003cp>Now the oceans have cooled and the wind is gusting, a trend scientists are happy to see.\u003c/p>\n\u003cp>“The winds are strong enough to cause upwelling. They are pushing that water to the south and offshore, and it allows the cold, nutrient-rich water to come to the surface,” explains \u003ca href=\"http://cordellbank.noaa.gov/contact/staff.html\" target=\"_blank\" rel=\"noopener\">Danielle Lipski\u003c/a>, research coordinator for \u003ca href=\"http://cordellbank.noaa.gov/\" target=\"_blank\" rel=\"noopener\">Cordell Bank National Marine Sanctuary\u003c/a>, another branch of NOAA. The nutrients act like fertilizer and increase the abundance of \u003ca href=\"http://oceanservice.noaa.gov/facts/phyto.html\">phytoplankton.\u003c/a>\u003c/p>\n\u003cfigure id=\"attachment_881027\" class=\"wp-caption aligncenter\" style=\"max-width: 800px\">\u003cimg loading=\"lazy\" decoding=\"async\" class=\"size-medium wp-image-881027\" src=\"http://ww2.kqed.org/science/wp-content/uploads/sites/35/2016/07/Krill-iStock_86347053_LARGE-800x533.jpg\" alt=\"Tiny, but mighty, invertebrate krill are smaller than a fingertip and are also the primary food source for blue and humpback whales.\" width=\"800\" height=\"533\" srcset=\"https://cdn.kqed.org/wp-content/uploads/sites/35/2016/07/Krill-iStock_86347053_LARGE-800x533.jpg 800w, https://cdn.kqed.org/wp-content/uploads/sites/35/2016/07/Krill-iStock_86347053_LARGE-400x267.jpg 400w, https://cdn.kqed.org/wp-content/uploads/sites/35/2016/07/Krill-iStock_86347053_LARGE-768x512.jpg 768w, https://cdn.kqed.org/wp-content/uploads/sites/35/2016/07/Krill-iStock_86347053_LARGE-1440x960.jpg 1440w, https://cdn.kqed.org/wp-content/uploads/sites/35/2016/07/Krill-iStock_86347053_LARGE-1920x1280.jpg 1920w, https://cdn.kqed.org/wp-content/uploads/sites/35/2016/07/Krill-iStock_86347053_LARGE-1180x787.jpg 1180w, https://cdn.kqed.org/wp-content/uploads/sites/35/2016/07/Krill-iStock_86347053_LARGE-960x640.jpg 960w\" sizes=\"(max-width: 800px) 100vw, 800px\">\u003cfigcaption class=\"wp-caption-text\">Tiny but mighty, invertebrate krill are smaller than a fingertip and are also the primary food source for blue and humpback whales. \u003ccite>( Andrea Izzotti/iStock)\u003c/cite>\u003c/figcaption>\u003c/figure>\n\u003cp>\u003c/p>\n\u003cp>\u003ca href=\"https://www.nwfsc.noaa.gov/sem/zooplankton.cfm\">Zooplankton\u003c/a> feed on the phytoplankton, which are then eaten by tiny shrimplike animals called \u003ca href=\"http://oceanexplorer.noaa.gov/explorations/lewis_clark01/background/midwater_realm/media/krill.html\">krill\u003c/a>. The whales gobble up the krill in a beautiful relationship where one of the smallest of lifeforms sustains the largest.\u003c/p>\n\n",
"stats": {
"hasVideo": false,
"hasChartOrMap": false,
"hasAudio": false,
"hasPolis": false,
"wordCount": 823,
"hasGoogleForm": false,
"hasGallery": false,
"hasHearkenModule": false,
"iframeSrcs": [],
"paragraphCount": 17
},
"modified": 1704929816,
"excerpt": "On a research voyage to the Farallon Islands, scientists encounter far more whales than expected. Here's what's driving the recovery.",
"headData": {
"twImgId": "",
"twTitle": "",
"ogTitle": "",
"ogImgId": "",
"twDescription": "",
"description": "On a research voyage to the Farallon Islands, scientists encounter far more whales than expected. Here's what's driving the recovery.",
"title": "Blue Whale Recovery Signals Improving Ocean Conditions | KQED",
"ogDescription": "",
"schema": {
"@context": "https://schema.org",
"@type": "Article",
"headline": "Blue Whale Recovery Signals Improving Ocean Conditions",
"datePublished": "2016-08-04T15:48:00-07:00",
"dateModified": "2024-01-10T15:36:56-08:00",
"image": "https://cdn.kqed.org/wp-content/uploads/2020/02/KQED-OG-Image@1x.png"
}
},
"guestAuthors": [],
"slug": "blue-whale-recovery-signals-improving-ocean-conditions",
"status": "publish",
"sticky": false,
"path": "/science/880923/blue-whale-recovery-signals-improving-ocean-conditions",
"audioTrackLength": null,
"parsedContent": [
{
"type": "contentString",
"content": "\u003cdiv class=\"post-body\">\u003cp>\u003cp>Twenty six nautical miles outside the Golden Gate, the spindly peaks of the Farallon Islands bobbing in view, the \u003ca href=\"http://www.sanctuarysimon.org/regional_sections/fulmar/\">R/V Fulmar\u003c/a> research vessel has made space for me to observe how researchers carry out their commitment to keep our oceans healthy.\u003c/p>\n\u003cp>Still working on developing my sea legs, I clamber up a ladder to the top deck, and as gingerly as possible, stumble to the bow of the boat.\u003c/p>\n\u003cp>This vessel is run by a marine conservation partnership called \u003ca href=\"http://www.accessoceans.org/\">ACCESS\u003c/a>, or the Applied California Current Ecosystem Studies. The crew, comprised of marine researchers from the National Ocean and Atmospheric Administration (\u003ca href=\"http://www.noaa.gov/\">NOAA)\u003c/a> and the non-profit agency \u003ca href=\"http://www.pointblue.org/\">Point Blue\u003c/a>, is scanning the horizon for signs of life, which they are finding in abundance. \u003c/p>\u003cp>\u003c/p>\u003cp>\u003c/p>\n\u003cp>On this brilliant July afternoon, the scientists on board are deploying nets and hauling in microscopic forms of life from the ocean. They pull in tiny krill and their even tinier food source, plankton, the marine plants that form the foundation of the ocean’s food chain and shed light on the health of the vital marine habitat off the coast of Northern California.\u003c/p>\n\u003cp>One researcher records the number of wildlife that surround the boat, while the others gaze through binoculars and call out species names as they see them — like puffins, white-sided dolphins and \u003ca href=\"http://www.audubon.org/field-guide/bird/red-necked-phalarope\" target=\"_blank\" rel=\"noopener\">red-necked phalaropes\u003c/a>.\u003c/p>\n\u003cfigure id=\"attachment_897891\" class=\"wp-caption aligncenter\" style=\"max-width: 800px\">\u003cimg loading=\"lazy\" decoding=\"async\" class=\"wp-image-897891 size-medium\" src=\"http://ww2.kqed.org/science/wp-content/uploads/sites/35/2016/08/ACCESS-Research-Cruise-Pix-157-800x450.jpg\" alt=\"Taylor Nairn, of the Greater Farallones Association, records wildlife sightings along an observational transect as a member of the AV Fulmar's marine research crew.\" width=\"800\" height=\"450\" srcset=\"https://cdn.kqed.org/wp-content/uploads/sites/35/2016/08/ACCESS-Research-Cruise-Pix-157-800x450.jpg 800w, https://cdn.kqed.org/wp-content/uploads/sites/35/2016/08/ACCESS-Research-Cruise-Pix-157-400x225.jpg 400w, https://cdn.kqed.org/wp-content/uploads/sites/35/2016/08/ACCESS-Research-Cruise-Pix-157-768x432.jpg 768w, https://cdn.kqed.org/wp-content/uploads/sites/35/2016/08/ACCESS-Research-Cruise-Pix-157-1440x810.jpg 1440w, https://cdn.kqed.org/wp-content/uploads/sites/35/2016/08/ACCESS-Research-Cruise-Pix-157-1920x1080.jpg 1920w, https://cdn.kqed.org/wp-content/uploads/sites/35/2016/08/ACCESS-Research-Cruise-Pix-157-1180x664.jpg 1180w, https://cdn.kqed.org/wp-content/uploads/sites/35/2016/08/ACCESS-Research-Cruise-Pix-157-960x540.jpg 960w\" sizes=\"(max-width: 800px) 100vw, 800px\">\u003cfigcaption class=\"wp-caption-text\">Taylor Nairn, of the Greater Farallones Association, records wildlife sightings along an observational transect as a member of the R/V Fulmar’s marine research crew. \u003ccite>(Aurora MacRae-Crerar/KQED)\u003c/cite>\u003c/figcaption>\u003c/figure>\n\u003cp>First mate Marshall Stein offers me his front-row swivel seat and moments later, there’s a wave of excitement as one, two, three, four blue whales come into focus. Mouth agape, I stare at the largest animals the planet has ever seen as they spout water from their blowholes, the silhouettes of their majestic blue backs against the backdrop of the Farallon Islands. I am speechless. So are the marine biologists. This is extraordinary, not only for a novice like me, but also for seasoned researchers.\u003c/p>\n\u003cfigure id=\"attachment_880927\" class=\"wp-caption aligncenter\" style=\"max-width: 800px\">\u003cimg loading=\"lazy\" decoding=\"async\" class=\"size-medium wp-image-880927\" src=\"http://ww2.kqed.org/science/wp-content/uploads/sites/35/2016/07/iStock_33627068_XXLARGE-800x600.jpg\" alt=\"Blue whales have been on Earth for over 53 million years. The largest animal ever to have graced our planet, they are massive, majestic and endangered, but making a comeback on the California coast. They can grow to be over 100 feet long and can weigh over 200 tons. They have a lifespan of up to 90 years. \" width=\"800\" height=\"600\" srcset=\"https://cdn.kqed.org/wp-content/uploads/sites/35/2016/07/iStock_33627068_XXLARGE-800x600.jpg 800w, https://cdn.kqed.org/wp-content/uploads/sites/35/2016/07/iStock_33627068_XXLARGE-400x300.jpg 400w, https://cdn.kqed.org/wp-content/uploads/sites/35/2016/07/iStock_33627068_XXLARGE-768x576.jpg 768w, https://cdn.kqed.org/wp-content/uploads/sites/35/2016/07/iStock_33627068_XXLARGE-1440x1080.jpg 1440w, https://cdn.kqed.org/wp-content/uploads/sites/35/2016/07/iStock_33627068_XXLARGE-1920x1440.jpg 1920w, https://cdn.kqed.org/wp-content/uploads/sites/35/2016/07/iStock_33627068_XXLARGE-1180x885.jpg 1180w, https://cdn.kqed.org/wp-content/uploads/sites/35/2016/07/iStock_33627068_XXLARGE-960x720.jpg 960w\" sizes=\"(max-width: 800px) 100vw, 800px\">\u003cfigcaption class=\"wp-caption-text\">Blue whales have been on Earth for over 53 million years. The largest animal to have ever graced our planet, they are massive, majestic and endangered, but making a comeback on the California coast. They can grow to be over 100 feet long and can weigh over 200 tons. They have a lifespan of up to 90 years. \u003ccite>(iStock)\u003c/cite>\u003c/figcaption>\u003c/figure>\n\u003cp>Since April, there have been a \u003ca href=\"http://ww2.kqed.org/science/2016/06/03/humpback-whales-exploring-the-bay-in-unprecedented-numbers/\">record number\u003c/a> of whale sightings in San Francisco Bay—including \u003ca href=\"http://kron4.com/2016/07/11/stunning-video-close-encounter-with-whales-near-treasure-island/\">this\u003c/a> breathtaking encounter filmed by a local kayaker.\u003c/p>\n\u003cp>\u003c/p>\u003c/div>",
"attributes": {
"named": {},
"numeric": []
}
},
{
"type": "component",
"content": "",
"name": "ad",
"attributes": {
"named": {
"label": "fullwidth"
},
"numeric": [
"fullwidth"
]
}
},
{
"type": "contentString",
"content": "\u003cdiv class=\"post-body\">\u003cp>\u003c/p>\n\u003cp>“Yesterday was gangbusters,” exclaims Jan Roletto, the research coordinator for the \u003ca href=\"http://farallones.noaa.gov/\">Greater Farallones National Marine Sanctuary\u003c/a>, which falls under the NOAA umbrella. On their first day out, the crew saw 85 blue and humpback whales. On the second day, I was there as the crew made 48 more whale observations. Such sightings suggest that the whales are making a strong comeback.\u003c/p>\n\u003caside class=\"pullquote alignright\">‘It’s a real story of recovery.’\u003ccite> Jaime Jahncke, Point Blue \u003c/cite>\u003c/aside>\n\u003cp>This July alone, the crew of the R/V Fulmar has seen more whales (around 237) than scientists recorded during the entire summer last year — about \u003ca href=\"http://accessoceans.org/uploads/Ocean_Climate_Indicators_Report_2015.pdf\" target=\"_blank\" rel=\"noopener\">180\u003c/a>.\u003c/p>\n\u003cp>The \u003ca href=\"http://farallones.noaa.gov/\" target=\"_blank\" rel=\"noopener\">Greater Farallones Marine Sanctuary\u003c/a> is lush with nutrients, making it the place where whales meet and eat.\u003c/p>\n\u003caside class=\"pullquote alignright\">\u003c/aside>\n\u003cp>“It’s a real story of recovery,” says Jaime Jahncke, a lead scientist at Point Blue. But what are they recovering from?\u003c/p>\n\u003cp>The lower whale abundance in 2015 was a consequence of two natural phenomena: a sprawling mass of anomalously warm water known as \u003ca href=\"http://ww2.kqed.org/science/2015/08/09/possible-spoiler-for-el-nino-a-battle-of-the-blobs/\">the Blob, and El Niño\u003c/a>, a periodic shift in both ocean and atmospheric conditions. Together, they raised ocean temperatures and had mostly negative effects on marine life, \u003ca href=\"http://ww2.kqed.org/science/2015/11/23/how-warmer-waters-have-led-to-emaciated-seals-on-california-beaches/\">such as California seals\u003c/a> and sea lions. Thousands of sea lion pups were stranded or killed in February and March 2015.\u003c/p>\n\u003cfigure id=\"attachment_894517\" class=\"wp-caption aligncenter\" style=\"max-width: 800px\">\u003cimg loading=\"lazy\" decoding=\"async\" class=\"size-medium wp-image-894517\" src=\"http://ww2.kqed.org/science/wp-content/uploads/sites/35/2016/08/sea-lion-pup-800x533.jpg\" alt=\"Unusually warm waters brought in by a combination of El Ñino and the Blob in late 2015 to early 2016 were not good for sea lion pups. These anomalously high temperatures disrupted the marine food chain, leaving the pups malnourished. This has lead to the recent high rates of sea lion pup mortality.\" width=\"800\" height=\"533\" srcset=\"https://cdn.kqed.org/wp-content/uploads/sites/35/2016/08/sea-lion-pup-800x533.jpg 800w, https://cdn.kqed.org/wp-content/uploads/sites/35/2016/08/sea-lion-pup-400x267.jpg 400w, https://cdn.kqed.org/wp-content/uploads/sites/35/2016/08/sea-lion-pup-768x512.jpg 768w, https://cdn.kqed.org/wp-content/uploads/sites/35/2016/08/sea-lion-pup-1440x960.jpg 1440w, https://cdn.kqed.org/wp-content/uploads/sites/35/2016/08/sea-lion-pup-1920x1280.jpg 1920w, https://cdn.kqed.org/wp-content/uploads/sites/35/2016/08/sea-lion-pup-1180x787.jpg 1180w, https://cdn.kqed.org/wp-content/uploads/sites/35/2016/08/sea-lion-pup-960x640.jpg 960w\" sizes=\"(max-width: 800px) 100vw, 800px\">\u003cfigcaption class=\"wp-caption-text\">Unusually warm ocean conditions in late 2015 led to high rates of sea lion pup mortality. \u003ccite>(iStock)\u003c/cite>\u003c/figcaption>\u003c/figure>\n\u003cp>Now the oceans have cooled and the wind is gusting, a trend scientists are happy to see.\u003c/p>\n\u003cp>“The winds are strong enough to cause upwelling. They are pushing that water to the south and offshore, and it allows the cold, nutrient-rich water to come to the surface,” explains \u003ca href=\"http://cordellbank.noaa.gov/contact/staff.html\" target=\"_blank\" rel=\"noopener\">Danielle Lipski\u003c/a>, research coordinator for \u003ca href=\"http://cordellbank.noaa.gov/\" target=\"_blank\" rel=\"noopener\">Cordell Bank National Marine Sanctuary\u003c/a>, another branch of NOAA. The nutrients act like fertilizer and increase the abundance of \u003ca href=\"http://oceanservice.noaa.gov/facts/phyto.html\">phytoplankton.\u003c/a>\u003c/p>\n\u003cfigure id=\"attachment_881027\" class=\"wp-caption aligncenter\" style=\"max-width: 800px\">\u003cimg loading=\"lazy\" decoding=\"async\" class=\"size-medium wp-image-881027\" src=\"http://ww2.kqed.org/science/wp-content/uploads/sites/35/2016/07/Krill-iStock_86347053_LARGE-800x533.jpg\" alt=\"Tiny, but mighty, invertebrate krill are smaller than a fingertip and are also the primary food source for blue and humpback whales.\" width=\"800\" height=\"533\" srcset=\"https://cdn.kqed.org/wp-content/uploads/sites/35/2016/07/Krill-iStock_86347053_LARGE-800x533.jpg 800w, https://cdn.kqed.org/wp-content/uploads/sites/35/2016/07/Krill-iStock_86347053_LARGE-400x267.jpg 400w, https://cdn.kqed.org/wp-content/uploads/sites/35/2016/07/Krill-iStock_86347053_LARGE-768x512.jpg 768w, https://cdn.kqed.org/wp-content/uploads/sites/35/2016/07/Krill-iStock_86347053_LARGE-1440x960.jpg 1440w, https://cdn.kqed.org/wp-content/uploads/sites/35/2016/07/Krill-iStock_86347053_LARGE-1920x1280.jpg 1920w, https://cdn.kqed.org/wp-content/uploads/sites/35/2016/07/Krill-iStock_86347053_LARGE-1180x787.jpg 1180w, https://cdn.kqed.org/wp-content/uploads/sites/35/2016/07/Krill-iStock_86347053_LARGE-960x640.jpg 960w\" sizes=\"(max-width: 800px) 100vw, 800px\">\u003cfigcaption class=\"wp-caption-text\">Tiny but mighty, invertebrate krill are smaller than a fingertip and are also the primary food source for blue and humpback whales. \u003ccite>( Andrea Izzotti/iStock)\u003c/cite>\u003c/figcaption>\u003c/figure>\n\u003cp>\u003c/p>\n\u003cp>\u003ca href=\"https://www.nwfsc.noaa.gov/sem/zooplankton.cfm\">Zooplankton\u003c/a> feed on the phytoplankton, which are then eaten by tiny shrimplike animals called \u003ca href=\"http://oceanexplorer.noaa.gov/explorations/lewis_clark01/background/midwater_realm/media/krill.html\">krill\u003c/a>. The whales gobble up the krill in a beautiful relationship where one of the smallest of lifeforms sustains the largest.\u003c/p>\n\n\u003c/div>\u003c/p>",
"attributes": {
"named": {},
"numeric": []
}
}
],
"link": "/science/880923/blue-whale-recovery-signals-improving-ocean-conditions",
"authors": [
"11253"
],
"categories": [
"science_2874",
"science_30",
"science_31",
"science_35",
"science_2873"
],
"tags": [
"science_371"
],
"featImg": "science_898106",
"label": "science"
},
"science_893464": {
"type": "posts",
"id": "science_893464",
"meta": {
"index": "posts_1716263798",
"site": "science",
"id": "893464",
"score": null,
"sort": [
1470173982000
]
},
"parent": 0,
"labelTerm": {},
"blocks": [],
"publishDate": 1470173982,
"format": "standard",
"title": "Well, It's Official: 2015 Set Multiple Climate Records",
"headTitle": "Well, It’s Official: 2015 Set Multiple Climate Records | KQED",
"content": "\u003cp>The warming of the world’s climate has reached a fever pitch in recent years, causing records to fall like dominoes. In 2015, the planet saw a number of such records set, from the hottest global temperature measured to the largest annual increase in carbon dioxide.\u003c/p>\n\u003cp>Those records — along with numerous other indicators of the considerable change wrought on land, in the oceans and air, and to ecosystems — are detailed in the annual \u003ca href=\"https://www.ametsoc.org/ams/index.cfm/publications/bulletin-of-the-american-meteorological-society-bams/state-of-the-climate/\">State of the Climate Report\u003c/a> released Tuesday by the U.S. National Oceanic and Atmospheric Administration.\u003c/p>\n\u003caside class=\"pullquote alignright\">‘We have to understand how the planet is changing and varying…in order to understand where we may be going in the future.’\u003ccite>Thomas Karl, NOAA\u003c/cite>\u003c/aside>\n\u003cp>The report, now in its 26th year and published as a special edition of the journal Bulletin of the American Meteorological Society, was put together by 456 authors in 62 countries and provides a checkup of Earth’s health.\u003c/p>\n\u003cp>“We have to understand how the planet is changing and varying . . . in order to understand where we may be going in the future,” Thomas Karl, director of NOAA’s National Centers for Environmental Information, said during a press teleconference.\u003c/p>\n\u003cp>While a strong El Niño provided a boost to global temperatures last year, the \u003ca href=\"http://www.climatecentral.org/news/global-warming-key-driver-record-heat-19734\">main driver of the planet’s temperature surge\u003c/a>, as well as other climate trends, is the warming caused by the buildup of greenhouse gases in the atmosphere.\u003c/p>\n\u003cp>[ad fullwidth]\u003c/p>\n\u003cp>And just as many of the records of 2015 broke those set only one year earlier, 2016 has broken or is poised to break several of 2015’s records:\u003c/p>\n\u003cp>\u003cstrong>Global Temperature\u003c/strong>\u003c/p>\n\u003cp>The average temperature for the world in 2015 was record warm in all four major datasets, which are run independently by different U.S. and international agencies. The year beat out 2014 by 0.2°F (0.1°C) — the highest margin for such a record since 1998.\u003c/p>\n\u003cp>From the perspective of how much temperatures have risen since preindustrial times, 2015 was more than 1°C (1.8°F) above temperatures from the mid- to late-19th century. Nations have pledged to \u003ca href=\"http://www.climatecentral.org/news/see-earths-temperature-spiral-toward-2c-20332\">limit warming to 2°C\u003c/a> above preindustrial temperatures by the end of this century, with some discussion of tightening that cap to 1.5°C.\u003c/p>\n\u003cp>Global temperatures have continued to soar in 2016, which for the first half of the year is \u003ca href=\"http://www.climatecentral.org/news/first-half-of-2016-record-hot-by-far-20540\">ahead of 2015 by a long shot\u003c/a>and has nudged the planet even closer to the \u003ca href=\"http://www.climatecentral.org/news/world-flirts-with-1.5C-threshold-20260\">1.5°C benchmark\u003c/a>.\u003c/p>\n\u003cp>Whether 2016 takes the title of hottest year or not depends on how the second half of the year plays out, with a La Niña event possibly forming in the wake of the exceptionally strong El Niño that held sway in 2015 and early 2016. La Niñas have a cooling effect on global temperatures. The latest model forecasts are less confident that a La Niña will form, which would mean 2016 has a better chance of besting 2015.\u003c/p>\n\u003cp>“It’s quite possible that 2016 will set a new global temperature record,” Jessica Blunden, a NOAA climatologist and lead author of the report, said.\u003c/p>\n\u003cp>\u003cstrong>Carbon Dioxide\u003c/strong>\u003c/p>\n\u003cp>Greenhouse gas levels — the driver behind the steady warming of the planet — also set records in 2015.\u003c/p>\n\u003cp>The annual average of carbon dioxide levels at the Mauna Loa Observatory in Hawaii, which keeps the longest-running record of atmospheric CO2, was 400.8 parts per million. That was the first time the measurement was over 400 ppm for the year. While that benchmark is somewhat symbolic, it shows how far those levels have risen since preindustrial times, when CO2 measured about 280 ppm.\u003c/p>\n\u003cp>The year also saw the \u003ca href=\"http://www.climatecentral.org/news/unprecedented-spike-co2-levels-2015-20125\">biggest year-over-year increase\u003c/a> on record at Mauna Loa, 3.1 ppm. While 2016 is only halfway over, it is slightly ahead of 2015 by this measure.\u003c/p>\n\u003cp>The global CO2 average for 2015 was just under 400 ppm, “which means that 2016 is easily going to surpass this milestone,” Blunden said. In fact, one of the last places on Earth that had yet to cross that mark, the South Pole, finally\u003ca href=\"http://www.climatecentral.org/news/antarctica-co2-400-ppm-million-years-20451\">did so this year\u003c/a>.\u003c/p>\n\u003cp>\u003cstrong>Ocean Heat\u003c/strong>\u003c/p>\n\u003cp>One of the key drivers of 2015’s record heat was the global oceans, which take up \u003ca href=\"http://www.climatecentral.org/news/global-warming-ocean-heat-18905\">90 percent of the excess heat\u003c/a> trapped by the atmosphere.\u003c/p>\n\u003cp>Sea surface temperatures and the heat contained in the upper portion of the oceans both set global records, surpassing those set in 2014.\u003c/p>\n\u003cp>Because water expands as it warms, that heat also meant that sea surface heights were record high, measuring about 2.75 inches higher than at the beginning of the satellite altimeter record in 1993. \u003ca href=\"http://sealevel.climatecentral.org/\">Rising seas\u003c/a> are one of the key concerns of global warming, as they stand to inundate coastal areas that are currently home to millions.\u003c/p>\n\u003cp>\u003cstrong>Arctic Sea Ice\u003c/strong>\u003c/p>\n\u003cp>One of the planet’s hotspots has been the outsized warming in the Arctic, which is seeing a temperature rise double that of the global average.\u003c/p>\n\u003cp>This rapid warming has caused substantial changes, perhaps most notably to the ice that covers the Arctic Ocean. Loss of this ice has ramifications for polar ecosystems, as well as potentially to weather patterns in Europe, Asia, and North America.\u003c/p>\n\u003cp>Arctic sea ice reaches its peak at the end of the winter; last year that winter peak \u003ca href=\"http://www.climatecentral.org/news/arctic-sea-hits-record-low-winter-peak-18795\">set a record low\u003c/a>. That record has \u003ca href=\"http://www.climatecentral.org/news/arctic-sea-ice-peak-record-low-again-20183\">already been beaten this year\u003c/a>.\u003c/p>\n\u003cp>\u003ca href=\"http://www.climatecentral.org/news/arctic-sea-ice-breaks-may-record-20415\">May\u003c/a> and \u003ca href=\"http://www.climatecentral.org/news/arctic-sea-ice-record-low-for-june-20508\">June\u003c/a> this year also saw record low sea ice levels, though the decline eased off in July. Still, sea ice is far below the long-term average and stands to rank among the lowest years on record at its end-of-summer nadir.\u003c/p>\n\u003cp>This spate of records won’t necessarily continue over the next few years, particularly if a La Niña does materialize. Even with a long-term background trend of rising temperatures, other climate factors contribute to yearly ups and downs. But as long as greenhouse gases continue to build up in the atmosphere unabated, the scales are heavily weighted toward \u003ca href=\"http://www.climatecentral.org/news/2014-set-for-record-hot-record-cold-thing-of-the-past-18360\">more record heat\u003c/a>, ever lower sea ice levels and ever higher seas.\u003c/p>\n\u003cp>\u003c/p>\n\u003cp>\u003ca href=\"http://www.climatecentral.org/\">\u003cspan style=\"font-weight: 400\">Climate Central\u003c/span>\u003c/a> \u003ci>\u003cspan style=\"font-weight: 400\">is an independent organization that researches and reports on climate change.\u003c/span>\u003c/i>\u003c/p>\n\n",
"stats": {
"hasVideo": false,
"hasChartOrMap": false,
"hasAudio": false,
"hasPolis": false,
"wordCount": 1055,
"hasGoogleForm": false,
"hasGallery": false,
"hasHearkenModule": false,
"iframeSrcs": [],
"paragraphCount": 30
},
"modified": 1704929824,
"excerpt": null,
"headData": {
"twImgId": "",
"twTitle": "",
"ogTitle": "",
"ogImgId": "",
"twDescription": "",
"description": "The warming of the world’s climate has reached a fever pitch in recent years, causing records to fall like dominoes. In 2015, the planet saw a number of such records set, from the hottest global temperature measured to the largest annual increase in carbon dioxide. Those records — along with numerous other indicators of the",
"title": "Well, It's Official: 2015 Set Multiple Climate Records | KQED",
"ogDescription": "",
"schema": {
"@context": "https://schema.org",
"@type": "Article",
"headline": "Well, It's Official: 2015 Set Multiple Climate Records",
"datePublished": "2016-08-02T14:39:42-07:00",
"dateModified": "2024-01-10T15:37:04-08:00",
"image": "https://cdn.kqed.org/wp-content/uploads/2020/02/KQED-OG-Image@1x.png"
}
},
"guestAuthors": [],
"slug": "well-its-official-2015-set-multiple-climate-records",
"status": "publish",
"sourceUrl": "http://www.climatecentral.org/",
"nprByline": "Andrea Thompson\u003c/br>Climate Central",
"sticky": false,
"source": "Climate Central",
"path": "/science/893464/well-its-official-2015-set-multiple-climate-records",
"audioTrackLength": null,
"parsedContent": [
{
"type": "contentString",
"content": "\u003cdiv class=\"post-body\">\u003cp>\u003cp>The warming of the world’s climate has reached a fever pitch in recent years, causing records to fall like dominoes. In 2015, the planet saw a number of such records set, from the hottest global temperature measured to the largest annual increase in carbon dioxide.\u003c/p>\n\u003cp>Those records — along with numerous other indicators of the considerable change wrought on land, in the oceans and air, and to ecosystems — are detailed in the annual \u003ca href=\"https://www.ametsoc.org/ams/index.cfm/publications/bulletin-of-the-american-meteorological-society-bams/state-of-the-climate/\">State of the Climate Report\u003c/a> released Tuesday by the U.S. National Oceanic and Atmospheric Administration.\u003c/p>\n\u003caside class=\"pullquote alignright\">‘We have to understand how the planet is changing and varying…in order to understand where we may be going in the future.’\u003ccite>Thomas Karl, NOAA\u003c/cite>\u003c/aside>\n\u003cp>The report, now in its 26th year and published as a special edition of the journal Bulletin of the American Meteorological Society, was put together by 456 authors in 62 countries and provides a checkup of Earth’s health.\u003c/p>\n\u003cp>“We have to understand how the planet is changing and varying . . . in order to understand where we may be going in the future,” Thomas Karl, director of NOAA’s National Centers for Environmental Information, said during a press teleconference.\u003c/p>\n\u003cp>While a strong El Niño provided a boost to global temperatures last year, the \u003ca href=\"http://www.climatecentral.org/news/global-warming-key-driver-record-heat-19734\">main driver of the planet’s temperature surge\u003c/a>, as well as other climate trends, is the warming caused by the buildup of greenhouse gases in the atmosphere.\u003c/p>\n\u003cp>\u003c/p>\u003c/div>",
"attributes": {
"named": {},
"numeric": []
}
},
{
"type": "component",
"content": "",
"name": "ad",
"attributes": {
"named": {
"label": "fullwidth"
},
"numeric": [
"fullwidth"
]
}
},
{
"type": "contentString",
"content": "\u003cdiv class=\"post-body\">\u003cp>\u003c/p>\n\u003cp>And just as many of the records of 2015 broke those set only one year earlier, 2016 has broken or is poised to break several of 2015’s records:\u003c/p>\n\u003cp>\u003cstrong>Global Temperature\u003c/strong>\u003c/p>\n\u003cp>The average temperature for the world in 2015 was record warm in all four major datasets, which are run independently by different U.S. and international agencies. The year beat out 2014 by 0.2°F (0.1°C) — the highest margin for such a record since 1998.\u003c/p>\n\u003cp>From the perspective of how much temperatures have risen since preindustrial times, 2015 was more than 1°C (1.8°F) above temperatures from the mid- to late-19th century. Nations have pledged to \u003ca href=\"http://www.climatecentral.org/news/see-earths-temperature-spiral-toward-2c-20332\">limit warming to 2°C\u003c/a> above preindustrial temperatures by the end of this century, with some discussion of tightening that cap to 1.5°C.\u003c/p>\n\u003cp>Global temperatures have continued to soar in 2016, which for the first half of the year is \u003ca href=\"http://www.climatecentral.org/news/first-half-of-2016-record-hot-by-far-20540\">ahead of 2015 by a long shot\u003c/a>and has nudged the planet even closer to the \u003ca href=\"http://www.climatecentral.org/news/world-flirts-with-1.5C-threshold-20260\">1.5°C benchmark\u003c/a>.\u003c/p>\n\u003cp>Whether 2016 takes the title of hottest year or not depends on how the second half of the year plays out, with a La Niña event possibly forming in the wake of the exceptionally strong El Niño that held sway in 2015 and early 2016. La Niñas have a cooling effect on global temperatures. The latest model forecasts are less confident that a La Niña will form, which would mean 2016 has a better chance of besting 2015.\u003c/p>\n\u003cp>“It’s quite possible that 2016 will set a new global temperature record,” Jessica Blunden, a NOAA climatologist and lead author of the report, said.\u003c/p>\n\u003cp>\u003cstrong>Carbon Dioxide\u003c/strong>\u003c/p>\n\u003cp>Greenhouse gas levels — the driver behind the steady warming of the planet — also set records in 2015.\u003c/p>\n\u003cp>The annual average of carbon dioxide levels at the Mauna Loa Observatory in Hawaii, which keeps the longest-running record of atmospheric CO2, was 400.8 parts per million. That was the first time the measurement was over 400 ppm for the year. While that benchmark is somewhat symbolic, it shows how far those levels have risen since preindustrial times, when CO2 measured about 280 ppm.\u003c/p>\n\u003cp>The year also saw the \u003ca href=\"http://www.climatecentral.org/news/unprecedented-spike-co2-levels-2015-20125\">biggest year-over-year increase\u003c/a> on record at Mauna Loa, 3.1 ppm. While 2016 is only halfway over, it is slightly ahead of 2015 by this measure.\u003c/p>\n\u003cp>The global CO2 average for 2015 was just under 400 ppm, “which means that 2016 is easily going to surpass this milestone,” Blunden said. In fact, one of the last places on Earth that had yet to cross that mark, the South Pole, finally\u003ca href=\"http://www.climatecentral.org/news/antarctica-co2-400-ppm-million-years-20451\">did so this year\u003c/a>.\u003c/p>\n\u003cp>\u003cstrong>Ocean Heat\u003c/strong>\u003c/p>\n\u003cp>One of the key drivers of 2015’s record heat was the global oceans, which take up \u003ca href=\"http://www.climatecentral.org/news/global-warming-ocean-heat-18905\">90 percent of the excess heat\u003c/a> trapped by the atmosphere.\u003c/p>\n\u003cp>Sea surface temperatures and the heat contained in the upper portion of the oceans both set global records, surpassing those set in 2014.\u003c/p>\n\u003cp>Because water expands as it warms, that heat also meant that sea surface heights were record high, measuring about 2.75 inches higher than at the beginning of the satellite altimeter record in 1993. \u003ca href=\"http://sealevel.climatecentral.org/\">Rising seas\u003c/a> are one of the key concerns of global warming, as they stand to inundate coastal areas that are currently home to millions.\u003c/p>\n\u003cp>\u003cstrong>Arctic Sea Ice\u003c/strong>\u003c/p>\n\u003cp>One of the planet’s hotspots has been the outsized warming in the Arctic, which is seeing a temperature rise double that of the global average.\u003c/p>\n\u003cp>This rapid warming has caused substantial changes, perhaps most notably to the ice that covers the Arctic Ocean. Loss of this ice has ramifications for polar ecosystems, as well as potentially to weather patterns in Europe, Asia, and North America.\u003c/p>\n\u003cp>Arctic sea ice reaches its peak at the end of the winter; last year that winter peak \u003ca href=\"http://www.climatecentral.org/news/arctic-sea-hits-record-low-winter-peak-18795\">set a record low\u003c/a>. That record has \u003ca href=\"http://www.climatecentral.org/news/arctic-sea-ice-peak-record-low-again-20183\">already been beaten this year\u003c/a>.\u003c/p>\n\u003cp>\u003ca href=\"http://www.climatecentral.org/news/arctic-sea-ice-breaks-may-record-20415\">May\u003c/a> and \u003ca href=\"http://www.climatecentral.org/news/arctic-sea-ice-record-low-for-june-20508\">June\u003c/a> this year also saw record low sea ice levels, though the decline eased off in July. Still, sea ice is far below the long-term average and stands to rank among the lowest years on record at its end-of-summer nadir.\u003c/p>\n\u003cp>This spate of records won’t necessarily continue over the next few years, particularly if a La Niña does materialize. Even with a long-term background trend of rising temperatures, other climate factors contribute to yearly ups and downs. But as long as greenhouse gases continue to build up in the atmosphere unabated, the scales are heavily weighted toward \u003ca href=\"http://www.climatecentral.org/news/2014-set-for-record-hot-record-cold-thing-of-the-past-18360\">more record heat\u003c/a>, ever lower sea ice levels and ever higher seas.\u003c/p>\n\u003cp>\u003c/p>\n\u003cp>\u003ca href=\"http://www.climatecentral.org/\">\u003cspan style=\"font-weight: 400\">Climate Central\u003c/span>\u003c/a> \u003ci>\u003cspan style=\"font-weight: 400\">is an independent organization that researches and reports on climate change.\u003c/span>\u003c/i>\u003c/p>\n\n\u003c/div>\u003c/p>",
"attributes": {
"named": {},
"numeric": []
}
}
],
"link": "/science/893464/well-its-official-2015-set-multiple-climate-records",
"authors": [
"byline_science_893464"
],
"categories": [
"science_31",
"science_40"
],
"featImg": "science_893469",
"label": "source_science_893464"
}
},
"podcastsReducer": {
"isFetching": false,
"fetchFailed": false,
"hasFetched": false,
"podcasts": {}
},
"radioProgramsReducer": {
"isFetching": false,
"fetchFailed": false,
"hasFetched": false,
"radioPrograms": {}
},
"radioSearchSegmentsReducer": {},
"programsReducer": {
"all-things-considered": {
"id": "all-things-considered",
"title": "All Things Considered",
"info": "Every weekday, \u003cem>All Things Considered\u003c/em> hosts Robert Siegel, Audie Cornish, Ari Shapiro, and Kelly McEvers present the program's trademark mix of news, interviews, commentaries, reviews, and offbeat features. Michel Martin hosts on the weekends.",
"airtime": "MON-FRI 1pm-2pm, 4:30pm-6:30pm\u003cbr />SAT-SUN 5pm-6pm",
"imageSrc": "https://cdn.kqed.org/wp-content/uploads/2024/04/All-Things-Considered-Podcast-Tile-360x360-1.jpg",
"officialWebsiteLink": "https://www.npr.org/programs/all-things-considered/",
"meta": {
"site": "news",
"source": "npr"
},
"link": "/radio/program/all-things-considered"
},
"american-suburb-podcast": {
"id": "american-suburb-podcast",
"title": "American Suburb: The Podcast",
"tagline": "The flip side of gentrification, told through one town",
"info": "Gentrification is changing cities across America, forcing people from neighborhoods they have long called home. Call them the displaced. Now those priced out of the Bay Area are looking for a better life in an unlikely place. American Suburb follows this migration to one California town along the Delta, 45 miles from San Francisco. But is this once sleepy suburb ready for them?",
"imageSrc": "https://cdn.kqed.org/wp-content/uploads/2024/04/American-Suburb-Podcast-Tile-703x703-1.jpg",
"officialWebsiteLink": "/news/series/american-suburb-podcast",
"meta": {
"site": "news",
"source": "kqed",
"order": 19
},
"link": "/news/series/american-suburb-podcast/",
"subscribe": {
"npr": "https://rpb3r.app.goo.gl/RBrW",
"apple": "https://itunes.apple.com/WebObjects/MZStore.woa/wa/viewPodcast?mt=2&id=1287748328",
"tuneIn": "https://tunein.com/radio/American-Suburb-p1086805/",
"rss": "https://ww2.kqed.org/news/series/american-suburb-podcast/feed/podcast",
"google": "https://podcasts.google.com/feed/aHR0cHM6Ly9mZWVkcy5tZWdhcGhvbmUuZm0vS1FJTkMzMDExODgxNjA5"
}
},
"baycurious": {
"id": "baycurious",
"title": "Bay Curious",
"tagline": "Exploring the Bay Area, one question at a time",
"info": "KQED’s new podcast, Bay Curious, gets to the bottom of the mysteries — both profound and peculiar — that give the Bay Area its unique identity. And we’ll do it with your help! You ask the questions. You decide what Bay Curious investigates. And you join us on the journey to find the answers.",
"imageSrc": "https://cdn.kqed.org/wp-content/uploads/2024/04/Bay-Curious-Podcast-Tile-703x703-1.jpg",
"imageAlt": "KQED Bay Curious",
"officialWebsiteLink": "/news/series/baycurious",
"meta": {
"site": "news",
"source": "kqed",
"order": 3
},
"link": "/podcasts/baycurious",
"subscribe": {
"apple": "https://podcasts.apple.com/us/podcast/bay-curious/id1172473406",
"npr": "https://www.npr.org/podcasts/500557090/bay-curious",
"rss": "https://ww2.kqed.org/news/category/bay-curious-podcast/feed/podcast",
"amazon": "https://music.amazon.com/podcasts/9a90d476-aa04-455d-9a4c-0871ed6216d4/bay-curious",
"stitcher": "https://www.stitcher.com/podcast/kqed/bay-curious",
"spotify": "https://open.spotify.com/show/6O76IdmhixfijmhTZLIJ8k"
}
},
"bbc-world-service": {
"id": "bbc-world-service",
"title": "BBC World Service",
"info": "The day's top stories from BBC News compiled twice daily in the week, once at weekends.",
"airtime": "MON-FRI 9pm-10pm, TUE-FRI 1am-2am",
"imageSrc": "https://cdn.kqed.org/wp-content/uploads/2024/04/BBC-World-Service-Podcast-Tile-360x360-1.jpg",
"officialWebsiteLink": "https://www.bbc.co.uk/sounds/play/live:bbc_world_service",
"meta": {
"site": "news",
"source": "BBC World Service"
},
"link": "/radio/program/bbc-world-service",
"subscribe": {
"apple": "https://itunes.apple.com/us/podcast/global-news-podcast/id135067274?mt=2",
"tuneIn": "https://tunein.com/radio/BBC-World-Service-p455581/",
"rss": "https://podcasts.files.bbci.co.uk/p02nq0gn.rss"
}
},
"californiareport": {
"id": "californiareport",
"title": "The California Report",
"tagline": "California, day by day",
"info": "KQED’s statewide radio news program providing daily coverage of issues, trends and public policy decisions.",
"imageSrc": "https://cdn.kqed.org/wp-content/uploads/2024/04/The-California-Report-Podcast-Tile-703x703-1.jpg",
"imageAlt": "KQED The California Report",
"officialWebsiteLink": "/californiareport",
"meta": {
"site": "news",
"source": "kqed",
"order": 8
},
"link": "/californiareport",
"subscribe": {
"apple": "https://podcasts.apple.com/us/podcast/kqeds-the-california-report/id79681292",
"amazon": "https://music.amazon.com/podcasts/26099305-72af-4542-9dde-ac1807fe36d5/kqed-s-the-california-report",
"npr": "https://www.npr.org/podcasts/432285393/the-california-report",
"stitcher": "https://www.stitcher.com/podcast/kqedfm-kqeds-the-california-report-podcast-8838",
"rss": "https://ww2.kqed.org/news/tag/tcram/feed/podcast"
}
},
"californiareportmagazine": {
"id": "californiareportmagazine",
"title": "The California Report Magazine",
"tagline": "Your state, your stories",
"info": "Every week, The California Report Magazine takes you on a road trip for the ears: to visit the places and meet the people who make California unique. The in-depth storytelling podcast from the California Report.",
"airtime": "FRI 4:30pm-5pm, 6:30pm-7pm, 11pm-11:30pm",
"imageSrc": "https://cdn.kqed.org/wp-content/uploads/2024/04/The-California-Report-Magazine-Podcast-Tile-703x703-1.jpg",
"imageAlt": "KQED The California Report Magazine",
"officialWebsiteLink": "/californiareportmagazine",
"meta": {
"site": "news",
"source": "kqed",
"order": 10
},
"link": "/californiareportmagazine",
"subscribe": {
"apple": "https://podcasts.apple.com/us/podcast/the-california-report-magazine/id1314750545",
"google": "https://podcasts.google.com/feed/aHR0cHM6Ly9mZWVkcy5tZWdhcGhvbmUuZm0vS1FJTkM3NjkwNjk1OTAz",
"npr": "https://www.npr.org/podcasts/564733126/the-california-report-magazine",
"stitcher": "https://www.stitcher.com/podcast/kqed/the-california-report-magazine",
"rss": "https://ww2.kqed.org/news/tag/tcrmag/feed/podcast"
}
},
"city-arts": {
"id": "city-arts",
"title": "City Arts & Lectures",
"info": "A one-hour radio program to hear celebrated writers, artists and thinkers address contemporary ideas and values, often discussing the creative process. Please note: tapes or transcripts are not available",
"imageSrc": "https://ww2.kqed.org/radio/wp-content/uploads/sites/50/2018/05/cityartsandlecture-300x300.jpg",
"officialWebsiteLink": "https://www.cityarts.net/",
"airtime": "SUN 1pm-2pm, TUE 10pm, WED 1am",
"meta": {
"site": "news",
"source": "City Arts & Lectures"
},
"link": "https://www.cityarts.net",
"subscribe": {
"tuneIn": "https://tunein.com/radio/City-Arts-and-Lectures-p692/",
"rss": "https://www.cityarts.net/feed/"
}
},
"closealltabs": {
"id": "closealltabs",
"title": "Close All Tabs",
"tagline": "Your irreverent guide to the trends redefining our world",
"info": "Close All Tabs breaks down how digital culture shapes our world through thoughtful insights and irreverent humor.",
"imageSrc": "https://cdn.kqed.org/wp-content/uploads/2025/02/CAT_2_Tile-scaled.jpg",
"imageAlt": "KQED Close All Tabs",
"officialWebsiteLink": "/podcasts/closealltabs",
"meta": {
"site": "news",
"source": "kqed",
"order": 1
},
"link": "/podcasts/closealltabs",
"subscribe": {
"apple": "https://podcasts.apple.com/us/podcast/close-all-tabs/id214663465",
"rss": "https://feeds.megaphone.fm/KQINC6993880386",
"amazon": "https://music.amazon.com/podcasts/92d9d4ac-67a3-4eed-b10a-fb45d45b1ef2/close-all-tabs",
"spotify": "https://open.spotify.com/show/6LAJFHnGK1pYXYzv6SIol6?si=deb0cae19813417c"
}
},
"code-switch-life-kit": {
"id": "code-switch-life-kit",
"title": "Code Switch / Life Kit",
"info": "\u003cem>Code Switch\u003c/em>, which listeners will hear in the first part of the hour, has fearless and much-needed conversations about race. Hosted by journalists of color, the show tackles the subject of race head-on, exploring how it impacts every part of society — from politics and pop culture to history, sports and more.\u003cbr />\u003cbr />\u003cem>Life Kit\u003c/em>, which will be in the second part of the hour, guides you through spaces and feelings no one prepares you for — from finances to mental health, from workplace microaggressions to imposter syndrome, from relationships to parenting. The show features experts with real world experience and shares their knowledge. Because everyone needs a little help being human.\u003cbr />\u003cbr />\u003ca href=\"https://www.npr.org/podcasts/510312/codeswitch\">\u003cem>Code Switch\u003c/em> offical site and podcast\u003c/a>\u003cbr />\u003ca href=\"https://www.npr.org/lifekit\">\u003cem>Life Kit\u003c/em> offical site and podcast\u003c/a>\u003cbr />",
"airtime": "SUN 9pm-10pm",
"imageSrc": "https://cdn.kqed.org/wp-content/uploads/2024/04/Code-Switch-Life-Kit-Podcast-Tile-360x360-1.jpg",
"meta": {
"site": "radio",
"source": "npr"
},
"link": "/radio/program/code-switch-life-kit",
"subscribe": {
"apple": "https://podcasts.apple.com/podcast/1112190608?mt=2&at=11l79Y&ct=nprdirectory",
"google": "https://podcasts.google.com/feed/aHR0cHM6Ly93d3cubnByLm9yZy9yc3MvcG9kY2FzdC5waHA_aWQ9NTEwMzEy",
"spotify": "https://open.spotify.com/show/3bExJ9JQpkwNhoHvaIIuyV",
"rss": "https://feeds.npr.org/510312/podcast.xml"
}
},
"commonwealth-club": {
"id": "commonwealth-club",
"title": "Commonwealth Club of California Podcast",
"info": "The Commonwealth Club of California is the nation's oldest and largest public affairs forum. As a non-partisan forum, The Club brings to the public airwaves diverse viewpoints on important topics. The Club's weekly radio broadcast - the oldest in the U.S., dating back to 1924 - is carried across the nation on public radio stations and is now podcasting. Our website archive features audio of our recent programs, as well as selected speeches from our long and distinguished history. This podcast feed is usually updated twice a week and is always un-edited.",
"airtime": "THU 10pm, FRI 1am",
"imageSrc": "https://cdn.kqed.org/wp-content/uploads/2024/04/Commonwealth-Club-Podcast-Tile-360x360-1.jpg",
"officialWebsiteLink": "https://www.commonwealthclub.org/podcasts",
"meta": {
"site": "news",
"source": "Commonwealth Club of California"
},
"link": "/radio/program/commonwealth-club",
"subscribe": {
"apple": "https://itunes.apple.com/us/podcast/commonwealth-club-of-california-podcast/id976334034?mt=2",
"google": "https://podcasts.google.com/feed/aHR0cDovL3d3dy5jb21tb253ZWFsdGhjbHViLm9yZy9hdWRpby9wb2RjYXN0L3dlZWtseS54bWw",
"tuneIn": "https://tunein.com/radio/Commonwealth-Club-of-California-p1060/"
}
},
"forum": {
"id": "forum",
"title": "Forum",
"tagline": "The conversation starts here",
"info": "KQED’s live call-in program discussing local, state, national and international issues, as well as in-depth interviews.",
"airtime": "MON-FRI 9am-11am, 10pm-11pm",
"imageSrc": "https://cdn.kqed.org/wp-content/uploads/2024/04/Forum-Podcast-Tile-703x703-1.jpg",
"imageAlt": "KQED Forum with Mina Kim and Alexis Madrigal",
"officialWebsiteLink": "/forum",
"meta": {
"site": "news",
"source": "kqed",
"order": 9
},
"link": "/forum",
"subscribe": {
"apple": "https://podcasts.apple.com/us/podcast/kqeds-forum/id73329719",
"google": "https://podcasts.google.com/feed/aHR0cHM6Ly9mZWVkcy5tZWdhcGhvbmUuZm0vS1FJTkM5NTU3MzgxNjMz",
"npr": "https://www.npr.org/podcasts/432307980/forum",
"stitcher": "https://www.stitcher.com/podcast/kqedfm-kqeds-forum-podcast",
"rss": "https://feeds.megaphone.fm/KQINC9557381633"
}
},
"freakonomics-radio": {
"id": "freakonomics-radio",
"title": "Freakonomics Radio",
"info": "Freakonomics Radio is a one-hour award-winning podcast and public-radio project hosted by Stephen Dubner, with co-author Steve Levitt as a regular guest. It is produced in partnership with WNYC.",
"imageSrc": "https://ww2.kqed.org/news/wp-content/uploads/sites/10/2018/05/freakonomicsRadio.png",
"officialWebsiteLink": "http://freakonomics.com/",
"airtime": "SUN 1am-2am, SAT 3pm-4pm",
"meta": {
"site": "radio",
"source": "WNYC"
},
"link": "/radio/program/freakonomics-radio",
"subscribe": {
"npr": "https://rpb3r.app.goo.gl/4s8b",
"apple": "https://itunes.apple.com/us/podcast/freakonomics-radio/id354668519",
"tuneIn": "https://tunein.com/podcasts/WNYC-Podcasts/Freakonomics-Radio-p272293/",
"rss": "https://feeds.feedburner.com/freakonomicsradio"
}
},
"fresh-air": {
"id": "fresh-air",
"title": "Fresh Air",
"info": "Hosted by Terry Gross, \u003cem>Fresh Air from WHYY\u003c/em> is the Peabody Award-winning weekday magazine of contemporary arts and issues. One of public radio's most popular programs, Fresh Air features intimate conversations with today's biggest luminaries.",
"airtime": "MON-FRI 7pm-8pm",
"imageSrc": "https://cdn.kqed.org/wp-content/uploads/2024/04/Fresh-Air-Podcast-Tile-360x360-1.jpg",
"officialWebsiteLink": "https://www.npr.org/programs/fresh-air/",
"meta": {
"site": "radio",
"source": "npr"
},
"link": "/radio/program/fresh-air",
"subscribe": {
"npr": "https://rpb3r.app.goo.gl/4s8b",
"apple": "https://itunes.apple.com/WebObjects/MZStore.woa/wa/viewPodcast?s=143441&mt=2&id=214089682&at=11l79Y&ct=nprdirectory",
"tuneIn": "https://tunein.com/radio/Fresh-Air-p17/",
"rss": "https://feeds.npr.org/381444908/podcast.xml"
}
},
"here-and-now": {
"id": "here-and-now",
"title": "Here & Now",
"info": "A live production of NPR and WBUR Boston, in collaboration with stations across the country, Here & Now reflects the fluid world of news as it's happening in the middle of the day, with timely, in-depth news, interviews and conversation. Hosted by Robin Young, Jeremy Hobson and Tonya Mosley.",
"airtime": "MON-THU 11am-12pm",
"imageSrc": "https://cdn.kqed.org/wp-content/uploads/2024/04/Here-And-Now-Podcast-Tile-360x360-1.jpg",
"officialWebsiteLink": "http://www.wbur.org/hereandnow",
"meta": {
"site": "news",
"source": "npr"
},
"link": "/radio/program/here-and-now",
"subsdcribe": {
"apple": "https://itunes.apple.com/WebObjects/MZStore.woa/wa/viewPodcast?mt=2&id=426698661",
"tuneIn": "https://tunein.com/radio/Here--Now-p211/",
"rss": "https://feeds.npr.org/510051/podcast.xml"
}
},
"hidden-brain": {
"id": "hidden-brain",
"title": "Hidden Brain",
"info": "Shankar Vedantam uses science and storytelling to reveal the unconscious patterns that drive human behavior, shape our choices and direct our relationships.",
"imageSrc": "https://ww2.kqed.org/radio/wp-content/uploads/sites/50/2018/05/hiddenbrain.jpg",
"officialWebsiteLink": "https://www.npr.org/series/423302056/hidden-brain",
"airtime": "SUN 7pm-8pm",
"meta": {
"site": "news",
"source": "NPR"
},
"link": "/radio/program/hidden-brain",
"subscribe": {
"apple": "https://itunes.apple.com/us/podcast/hidden-brain/id1028908750?mt=2",
"tuneIn": "https://tunein.com/podcasts/Science-Podcasts/Hidden-Brain-p787503/",
"rss": "https://feeds.npr.org/510308/podcast.xml"
}
},
"how-i-built-this": {
"id": "how-i-built-this",
"title": "How I Built This with Guy Raz",
"info": "Guy Raz dives into the stories behind some of the world's best known companies. How I Built This weaves a narrative journey about innovators, entrepreneurs and idealists—and the movements they built.",
"imageSrc": "https://ww2.kqed.org/news/wp-content/uploads/sites/10/2018/05/howIBuiltThis.png",
"officialWebsiteLink": "https://www.npr.org/podcasts/510313/how-i-built-this",
"airtime": "SUN 7:30pm-8pm",
"meta": {
"site": "news",
"source": "npr"
},
"link": "/radio/program/how-i-built-this",
"subscribe": {
"npr": "https://rpb3r.app.goo.gl/3zxy",
"apple": "https://itunes.apple.com/us/podcast/how-i-built-this-with-guy-raz/id1150510297?mt=2",
"tuneIn": "https://tunein.com/podcasts/Arts--Culture-Podcasts/How-I-Built-This-p910896/",
"rss": "https://feeds.npr.org/510313/podcast.xml"
}
},
"hyphenacion": {
"id": "hyphenacion",
"title": "Hyphenación",
"tagline": "Where conversation and cultura meet",
"info": "What kind of no sabo word is Hyphenación? For us, it’s about living within a hyphenation. Like being a third-gen Mexican-American from the Texas border now living that Bay Area Chicano life. Like Xorje! Each week we bring together a couple of hyphenated Latinos to talk all about personal life choices: family, careers, relationships, belonging … everything is on the table. ",
"imageSrc": "https://cdn.kqed.org/wp-content/uploads/2025/03/Hyphenacion_FinalAssets_PodcastTile.png",
"imageAlt": "KQED Hyphenación",
"officialWebsiteLink": "/podcasts/hyphenacion",
"meta": {
"site": "news",
"source": "kqed",
"order": 15
},
"link": "/podcasts/hyphenacion",
"subscribe": {
"apple": "https://podcasts.apple.com/us/podcast/hyphenaci%C3%B3n/id1191591838",
"spotify": "https://open.spotify.com/show/2p3Fifq96nw9BPcmFdIq0o?si=39209f7b25774f38",
"youtube": "https://www.youtube.com/c/kqedarts",
"amazon": "https://music.amazon.com/podcasts/6c3dd23c-93fb-4aab-97ba-1725fa6315f1/hyphenaci%C3%B3n",
"rss": "https://feeds.megaphone.fm/KQINC2275451163"
}
},
"jerrybrown": {
"id": "jerrybrown",
"title": "The Political Mind of Jerry Brown",
"tagline": "Lessons from a lifetime in politics",
"info": "The Political Mind of Jerry Brown brings listeners the wisdom of the former Governor, Mayor, and presidential candidate. Scott Shafer interviewed Brown for more than 40 hours, covering the former governor's life and half-century in the political game – and Brown has some lessons he'd like to share. ",
"imageSrc": "https://cdn.kqed.org/wp-content/uploads/2024/04/The-Political-Mind-of-Jerry-Brown-Podcast-Tile-703x703-1.jpg",
"imageAlt": "KQED The Political Mind of Jerry Brown",
"officialWebsiteLink": "/podcasts/jerrybrown",
"meta": {
"site": "news",
"source": "kqed",
"order": 18
},
"link": "/podcasts/jerrybrown",
"subscribe": {
"npr": "https://www.npr.org/podcasts/790253322/the-political-mind-of-jerry-brown",
"apple": "https://itunes.apple.com/us/podcast/id1492194549",
"rss": "https://ww2.kqed.org/news/series/jerrybrown/feed/podcast/",
"tuneIn": "http://tun.in/pjGcK",
"stitcher": "https://www.stitcher.com/podcast/kqed/the-political-mind-of-jerry-brown",
"spotify": "https://open.spotify.com/show/54C1dmuyFyKMFttY6X2j6r?si=K8SgRCoISNK6ZbjpXrX5-w",
"amazon": "https://music.amazon.com/podcasts/44420f75-3b0e-4301-ab3b-16da6b09e543/the-political-mind-of-jerry-brown"
}
},
"latino-usa": {
"id": "latino-usa",
"title": "Latino USA",
"airtime": "MON 1am-2am, SUN 6pm-7pm",
"info": "Latino USA, the radio journal of news and culture, is the only national, English-language radio program produced from a Latino perspective.",
"imageSrc": "https://ww2.kqed.org/radio/wp-content/uploads/sites/50/2018/04/latinoUsa.jpg",
"officialWebsiteLink": "http://latinousa.org/",
"meta": {
"site": "news",
"source": "npr"
},
"link": "/radio/program/latino-usa",
"subscribe": {
"npr": "https://rpb3r.app.goo.gl/xtTd",
"apple": "https://itunes.apple.com/WebObjects/MZStore.woa/wa/viewPodcast?s=143441&mt=2&id=79681317&at=11l79Y&ct=nprdirectory",
"tuneIn": "https://tunein.com/radio/Latino-USA-p621/",
"rss": "https://feeds.npr.org/510016/podcast.xml"
}
},
"marketplace": {
"id": "marketplace",
"title": "Marketplace",
"info": "Our flagship program, helmed by Kai Ryssdal, examines what the day in money delivered, through stories, conversations, newsworthy numbers and more. Updated Monday through Friday at about 3:30 p.m. PT.",
"airtime": "MON-FRI 4pm-4:30pm, MON-WED 6:30pm-7pm",
"imageSrc": "https://cdn.kqed.org/wp-content/uploads/2024/04/Marketplace-Podcast-Tile-360x360-1.jpg",
"officialWebsiteLink": "https://www.marketplace.org/",
"meta": {
"site": "news",
"source": "American Public Media"
},
"link": "/radio/program/marketplace",
"subscribe": {
"apple": "https://itunes.apple.com/WebObjects/MZStore.woa/wa/viewPodcast?s=143441&mt=2&id=201853034&at=11l79Y&ct=nprdirectory",
"tuneIn": "https://tunein.com/radio/APM-Marketplace-p88/",
"rss": "https://feeds.publicradio.org/public_feeds/marketplace-pm/rss/rss"
}
},
"masters-of-scale": {
"id": "masters-of-scale",
"title": "Masters of Scale",
"info": "Masters of Scale is an original podcast in which LinkedIn co-founder and Greylock Partner Reid Hoffman sets out to describe and prove theories that explain how great entrepreneurs take their companies from zero to a gazillion in ingenious fashion.",
"airtime": "Every other Wednesday June 12 through October 16 at 8pm (repeats Thursdays at 2am)",
"imageSrc": "https://cdn.kqed.org/wp-content/uploads/2024/04/Masters-of-Scale-Podcast-Tile-360x360-1.jpg",
"officialWebsiteLink": "https://mastersofscale.com/",
"meta": {
"site": "radio",
"source": "WaitWhat"
},
"link": "/radio/program/masters-of-scale",
"subscribe": {
"apple": "http://mastersofscale.app.link/",
"rss": "https://rss.art19.com/masters-of-scale"
}
},
"mindshift": {
"id": "mindshift",
"title": "MindShift",
"tagline": "A podcast about the future of learning and how we raise our kids",
"info": "The MindShift podcast explores the innovations in education that are shaping how kids learn. Hosts Ki Sung and Katrina Schwartz introduce listeners to educators, researchers, parents and students who are developing effective ways to improve how kids learn. We cover topics like how fed-up administrators are developing surprising tactics to deal with classroom disruptions; how listening to podcasts are helping kids develop reading skills; the consequences of overparenting; and why interdisciplinary learning can engage students on all ends of the traditional achievement spectrum. This podcast is part of the MindShift education site, a division of KQED News. KQED is an NPR/PBS member station based in San Francisco. You can also visit the MindShift website for episodes and supplemental blog posts or tweet us \u003ca href=\"https://twitter.com/MindShiftKQED\">@MindShiftKQED\u003c/a> or visit us at \u003ca href=\"/mindshift\">MindShift.KQED.org\u003c/a>",
"imageSrc": "https://cdn.kqed.org/wp-content/uploads/2024/04/Mindshift-Podcast-Tile-703x703-1.jpg",
"imageAlt": "KQED MindShift: How We Will Learn",
"officialWebsiteLink": "/mindshift/",
"meta": {
"site": "news",
"source": "kqed",
"order": 12
},
"link": "/podcasts/mindshift",
"subscribe": {
"apple": "https://podcasts.apple.com/us/podcast/mindshift-podcast/id1078765985",
"google": "https://podcasts.google.com/feed/aHR0cHM6Ly9mZWVkcy5tZWdhcGhvbmUuZm0vS1FJTkM1NzY0NjAwNDI5",
"npr": "https://www.npr.org/podcasts/464615685/mind-shift-podcast",
"stitcher": "https://www.stitcher.com/podcast/kqed/stories-teachers-share",
"spotify": "https://open.spotify.com/show/0MxSpNYZKNprFLCl7eEtyx"
}
},
"morning-edition": {
"id": "morning-edition",
"title": "Morning Edition",
"info": "\u003cem>Morning Edition\u003c/em> takes listeners around the country and the world with multi-faceted stories and commentaries every weekday. Hosts Steve Inskeep, David Greene and Rachel Martin bring you the latest breaking news and features to prepare you for the day.",
"airtime": "MON-FRI 3am-9am",
"imageSrc": "https://cdn.kqed.org/wp-content/uploads/2024/04/Morning-Edition-Podcast-Tile-360x360-1.jpg",
"officialWebsiteLink": "https://www.npr.org/programs/morning-edition/",
"meta": {
"site": "news",
"source": "npr"
},
"link": "/radio/program/morning-edition"
},
"onourwatch": {
"id": "onourwatch",
"title": "On Our Watch",
"tagline": "Deeply-reported investigative journalism",
"info": "For decades, the process for how police police themselves has been inconsistent – if not opaque. In some states, like California, these proceedings were completely hidden. After a new police transparency law unsealed scores of internal affairs files, our reporters set out to examine these cases and the shadow world of police discipline. On Our Watch brings listeners into the rooms where officers are questioned and witnesses are interrogated to find out who this system is really protecting. Is it the officers, or the public they've sworn to serve?",
"imageSrc": "https://cdn.kqed.org/wp-content/uploads/2024/04/On-Our-Watch-Podcast-Tile-703x703-1.jpg",
"imageAlt": "On Our Watch from NPR and KQED",
"officialWebsiteLink": "/podcasts/onourwatch",
"meta": {
"site": "news",
"source": "kqed",
"order": 11
},
"link": "/podcasts/onourwatch",
"subscribe": {
"apple": "https://podcasts.apple.com/podcast/id1567098962",
"google": "https://podcasts.google.com/feed/aHR0cHM6Ly9mZWVkcy5ucHIub3JnLzUxMDM2MC9wb2RjYXN0LnhtbD9zYz1nb29nbGVwb2RjYXN0cw",
"npr": "https://rpb3r.app.goo.gl/onourwatch",
"spotify": "https://open.spotify.com/show/0OLWoyizopu6tY1XiuX70x",
"tuneIn": "https://tunein.com/radio/On-Our-Watch-p1436229/",
"stitcher": "https://www.stitcher.com/show/on-our-watch",
"rss": "https://feeds.npr.org/510360/podcast.xml"
}
},
"on-the-media": {
"id": "on-the-media",
"title": "On The Media",
"info": "Our weekly podcast explores how the media 'sausage' is made, casts an incisive eye on fluctuations in the marketplace of ideas, and examines threats to the freedom of information and expression in America and abroad. For one hour a week, the show tries to lift the veil from the process of \"making media,\" especially news media, because it's through that lens that we see the world and the world sees us",
"airtime": "SUN 2pm-3pm, MON 12am-1am",
"imageSrc": "https://ww2.kqed.org/radio/wp-content/uploads/sites/50/2018/04/onTheMedia.png",
"officialWebsiteLink": "https://www.wnycstudios.org/shows/otm",
"meta": {
"site": "news",
"source": "wnyc"
},
"link": "/radio/program/on-the-media",
"subscribe": {
"apple": "https://itunes.apple.com/us/podcast/on-the-media/id73330715?mt=2",
"tuneIn": "https://tunein.com/radio/On-the-Media-p69/",
"rss": "http://feeds.wnyc.org/onthemedia"
}
},
"pbs-newshour": {
"id": "pbs-newshour",
"title": "PBS NewsHour",
"info": "Analysis, background reports and updates from the PBS NewsHour putting today's news in context.",
"airtime": "MON-FRI 3pm-4pm",
"imageSrc": "https://cdn.kqed.org/wp-content/uploads/2024/04/PBS-News-Hour-Podcast-Tile-360x360-1.jpg",
"officialWebsiteLink": "https://www.pbs.org/newshour/",
"meta": {
"site": "news",
"source": "pbs"
},
"link": "/radio/program/pbs-newshour",
"subscribe": {
"apple": "https://itunes.apple.com/us/podcast/pbs-newshour-full-show/id394432287?mt=2",
"tuneIn": "https://tunein.com/radio/PBS-NewsHour---Full-Show-p425698/",
"rss": "https://www.pbs.org/newshour/feeds/rss/podcasts/show"
}
},
"perspectives": {
"id": "perspectives",
"title": "Perspectives",
"tagline": "KQED's series of daily listener commentaries since 1991",
"info": "KQED's series of daily listener commentaries since 1991.",
"imageSrc": "https://cdn.kqed.org/wp-content/uploads/2025/01/Perspectives_Tile_Final.jpg",
"imageAlt": "KQED Perspectives",
"officialWebsiteLink": "/perspectives/",
"meta": {
"site": "radio",
"source": "kqed",
"order": 14
},
"link": "/perspectives",
"subscribe": {
"apple": "https://podcasts.apple.com/us/podcast/id73801135",
"npr": "https://www.npr.org/podcasts/432309616/perspectives",
"rss": "https://ww2.kqed.org/perspectives/category/perspectives/feed/",
"google": "https://podcasts.google.com/feed/aHR0cHM6Ly93dzIua3FlZC5vcmcvcGVyc3BlY3RpdmVzL2NhdGVnb3J5L3BlcnNwZWN0aXZlcy9mZWVkLw"
}
},
"planet-money": {
"id": "planet-money",
"title": "Planet Money",
"info": "The economy explained. Imagine you could call up a friend and say, Meet me at the bar and tell me what's going on with the economy. Now imagine that's actually a fun evening.",
"airtime": "SUN 3pm-4pm",
"imageSrc": "https://ww2.kqed.org/radio/wp-content/uploads/sites/50/2018/04/planetmoney.jpg",
"officialWebsiteLink": "https://www.npr.org/sections/money/",
"meta": {
"site": "news",
"source": "npr"
},
"link": "/radio/program/planet-money",
"subscribe": {
"npr": "https://rpb3r.app.goo.gl/M4f5",
"apple": "https://itunes.apple.com/us/podcast/planet-money/id290783428?mt=2",
"tuneIn": "https://tunein.com/podcasts/Business--Economics-Podcasts/Planet-Money-p164680/",
"rss": "https://feeds.npr.org/510289/podcast.xml"
}
},
"politicalbreakdown": {
"id": "politicalbreakdown",
"title": "Political Breakdown",
"tagline": "Politics from a personal perspective",
"info": "Political Breakdown is a new series that explores the political intersection of California and the nation. Each week hosts Scott Shafer and Marisa Lagos are joined with a new special guest to unpack politics -- with personality — and offer an insider’s glimpse at how politics happens.",
"airtime": "THU 6:30pm-7pm",
"imageSrc": "https://cdn.kqed.org/wp-content/uploads/2024/04/Political-Breakdown-2024-Podcast-Tile-703x703-1.jpg",
"imageAlt": "KQED Political Breakdown",
"officialWebsiteLink": "/podcasts/politicalbreakdown",
"meta": {
"site": "radio",
"source": "kqed",
"order": 5
},
"link": "/podcasts/politicalbreakdown",
"subscribe": {
"apple": "https://podcasts.apple.com/us/podcast/political-breakdown/id1327641087",
"amazon": "https://music.amazon.com/podcasts/e0c2d153-ad36-4c8d-901d-f1da6a724824/political-breakdown",
"npr": "https://www.npr.org/podcasts/572155894/political-breakdown",
"stitcher": "https://www.stitcher.com/podcast/kqed/political-breakdown",
"spotify": "https://open.spotify.com/show/07RVyIjIdk2WDuVehvBMoN",
"rss": "https://ww2.kqed.org/news/tag/political-breakdown/feed/podcast"
}
},
"possible": {
"id": "possible",
"title": "Possible",
"info": "Possible is hosted by entrepreneur Reid Hoffman and writer Aria Finger. Together in Possible, Hoffman and Finger lead enlightening discussions about building a brighter collective future. The show features interviews with visionary guests like Trevor Noah, Sam Altman and Janette Sadik-Khan. Possible paints an optimistic portrait of the world we can create through science, policy, business, art and our shared humanity. It asks: What if everything goes right for once? How can we get there? Each episode also includes a short fiction story generated by advanced AI GPT-4, serving as a thought-provoking springboard to speculate how humanity could leverage technology for good.",
"airtime": "SUN 2pm",
"imageSrc": "https://cdn.kqed.org/wp-content/uploads/2024/04/Possible-Podcast-Tile-360x360-1.jpg",
"officialWebsiteLink": "https://www.possible.fm/",
"meta": {
"site": "news",
"source": "Possible"
},
"link": "/radio/program/possible",
"subscribe": {
"apple": "https://podcasts.apple.com/us/podcast/possible/id1677184070",
"spotify": "https://open.spotify.com/show/730YpdUSNlMyPQwNnyjp4k"
}
},
"pri-the-world": {
"id": "pri-the-world",
"title": "PRI's The World: Latest Edition",
"info": "Each weekday, host Marco Werman and his team of producers bring you the world's most interesting stories in an hour of radio that reminds us just how small our planet really is.",
"airtime": "MON-FRI 2pm-3pm",
"imageSrc": "https://cdn.kqed.org/wp-content/uploads/2024/04/The-World-Podcast-Tile-360x360-1.jpg",
"officialWebsiteLink": "https://www.pri.org/programs/the-world",
"meta": {
"site": "news",
"source": "PRI"
},
"link": "/radio/program/pri-the-world",
"subscribe": {
"apple": "https://itunes.apple.com/us/podcast/pris-the-world-latest-edition/id278196007?mt=2",
"tuneIn": "https://tunein.com/podcasts/News--Politics-Podcasts/PRIs-The-World-p24/",
"rss": "http://feeds.feedburner.com/pri/theworld"
}
},
"radiolab": {
"id": "radiolab",
"title": "Radiolab",
"info": "A two-time Peabody Award-winner, Radiolab is an investigation told through sounds and stories, and centered around one big idea. In the Radiolab world, information sounds like music and science and culture collide. Hosted by Jad Abumrad and Robert Krulwich, the show is designed for listeners who demand skepticism, but appreciate wonder. WNYC Studios is the producer of other leading podcasts including Freakonomics Radio, Death, Sex & Money, On the Media and many more.",
"airtime": "SUN 12am-1am, SAT 2pm-3pm",
"imageSrc": "https://ww2.kqed.org/radio/wp-content/uploads/sites/50/2018/04/radiolab1400.png",
"officialWebsiteLink": "https://www.wnycstudios.org/shows/radiolab/",
"meta": {
"site": "science",
"source": "WNYC"
},
"link": "/radio/program/radiolab",
"subscribe": {
"apple": "https://itunes.apple.com/us/podcast/radiolab/id152249110?mt=2",
"tuneIn": "https://tunein.com/radio/RadioLab-p68032/",
"rss": "https://feeds.wnyc.org/radiolab"
}
},
"reveal": {
"id": "reveal",
"title": "Reveal",
"info": "Created by The Center for Investigative Reporting and PRX, Reveal is public radios first one-hour weekly radio show and podcast dedicated to investigative reporting. Credible, fact based and without a partisan agenda, Reveal combines the power and artistry of driveway moment storytelling with data-rich reporting on critically important issues. The result is stories that inform and inspire, arming our listeners with information to right injustices, hold the powerful accountable and improve lives.Reveal is hosted by Al Letson and showcases the award-winning work of CIR and newsrooms large and small across the nation. In a radio and podcast market crowded with choices, Reveal focuses on important and often surprising stories that illuminate the world for our listeners.",
"airtime": "SAT 4pm-5pm",
"imageSrc": "https://ww2.kqed.org/radio/wp-content/uploads/sites/50/2018/04/reveal300px.png",
"officialWebsiteLink": "https://www.revealnews.org/episodes/",
"meta": {
"site": "news",
"source": "npr"
},
"link": "/radio/program/reveal",
"subscribe": {
"apple": "https://itunes.apple.com/us/podcast/reveal/id886009669",
"tuneIn": "https://tunein.com/radio/Reveal-p679597/",
"rss": "http://feeds.revealradio.org/revealpodcast"
}
},
"rightnowish": {
"id": "rightnowish",
"title": "Rightnowish",
"tagline": "Art is where you find it",
"info": "Rightnowish digs into life in the Bay Area right now… ish. Journalist Pendarvis Harshaw takes us to galleries painted on the sides of liquor stores in West Oakland. We'll dance in warehouses in the Bayview, make smoothies with kids in South Berkeley, and listen to classical music in a 1984 Cutlass Supreme in Richmond. Every week, Pen talks to movers and shakers about how the Bay Area shapes what they create, and how they shape the place we call home.",
"imageSrc": "https://cdn.kqed.org/wp-content/uploads/2024/04/Rightnowish-Podcast-Tile-500x500-1.jpg",
"imageAlt": "KQED Rightnowish with Pendarvis Harshaw",
"officialWebsiteLink": "/podcasts/rightnowish",
"meta": {
"site": "arts",
"source": "kqed",
"order": 16
},
"link": "/podcasts/rightnowish",
"subscribe": {
"npr": "https://www.npr.org/podcasts/721590300/rightnowish",
"rss": "https://ww2.kqed.org/arts/programs/rightnowish/feed/podcast",
"apple": "https://podcasts.apple.com/us/podcast/rightnowish/id1482187648",
"stitcher": "https://www.stitcher.com/podcast/kqed/rightnowish",
"google": "https://podcasts.google.com/feed/aHR0cHM6Ly9mZWVkcy5tZWdhcGhvbmUuZm0vS1FJTkMxMjU5MTY3NDc4",
"spotify": "https://open.spotify.com/show/7kEJuafTzTVan7B78ttz1I"
}
},
"science-friday": {
"id": "science-friday",
"title": "Science Friday",
"info": "Science Friday is a weekly science talk show, broadcast live over public radio stations nationwide. Each week, the show focuses on science topics that are in the news and tries to bring an educated, balanced discussion to bear on the scientific issues at hand. Panels of expert guests join host Ira Flatow, a veteran science journalist, to discuss science and to take questions from listeners during the call-in portion of the program.",
"airtime": "FRI 11am-1pm",
"imageSrc": "https://cdn.kqed.org/wp-content/uploads/2024/04/Science-Friday-Podcast-Tile-360x360-1.jpg",
"officialWebsiteLink": "https://www.wnycstudios.org/shows/science-friday",
"meta": {
"site": "news",
"source": "npr"
},
"link": "/radio/program/science-friday",
"subscribe": {
"apple": "https://itunes.apple.com/WebObjects/MZStore.woa/wa/viewPodcast?s=143441&mt=2&id=73329284&at=11l79Y&ct=nprdirectory",
"tuneIn": "https://tunein.com/radio/Science-Friday-p394/",
"rss": "http://feeds.wnyc.org/science-friday"
}
},
"snap-judgment": {
"id": "snap-judgment",
"title": "Snap Judgment",
"tagline": "Real stories with killer beats",
"info": "The Snap Judgment radio show and podcast mixes real stories with killer beats to produce cinematic, dramatic radio. Snap's musical brand of storytelling dares listeners to see the world through the eyes of another. This is storytelling... with a BEAT!! Snap first aired on public radio stations nationwide in July 2010. Today, Snap Judgment airs on over 450 public radio stations and is brought to the airwaves by KQED & PRX.",
"airtime": "SAT 1pm-2pm, 9pm-10pm",
"imageSrc": "https://cdn.kqed.org/wp-content/uploads/2024/05/Snap-Judgment-Podcast-Tile-703x703-1.jpg",
"imageAlt": "KQED Snap Judgment",
"officialWebsiteLink": "https://snapjudgment.org",
"meta": {
"site": "arts",
"source": "kqed",
"order": 4
},
"link": "https://snapjudgment.org",
"subscribe": {
"apple": "https://podcasts.apple.com/us/podcast/snap-judgment/id283657561",
"npr": "https://www.npr.org/podcasts/449018144/snap-judgment",
"stitcher": "https://www.pandora.com/podcast/snap-judgment/PC:241?source=stitcher-sunset",
"spotify": "https://open.spotify.com/show/3Cct7ZWmxHNAtLgBTqjC5v",
"rss": "https://snap.feed.snapjudgment.org/"
}
},
"soldout": {
"id": "soldout",
"title": "SOLD OUT: Rethinking Housing in America",
"tagline": "A new future for housing",
"info": "Sold Out: Rethinking Housing in America",
"imageSrc": "https://cdn.kqed.org/wp-content/uploads/2024/04/Sold-Out-Podcast-Tile-703x703-1.jpg",
"imageAlt": "KQED Sold Out: Rethinking Housing in America",
"officialWebsiteLink": "/podcasts/soldout",
"meta": {
"site": "news",
"source": "kqed",
"order": 13
},
"link": "/podcasts/soldout",
"subscribe": {
"npr": "https://www.npr.org/podcasts/911586047/s-o-l-d-o-u-t-a-new-future-for-housing",
"apple": "https://podcasts.apple.com/us/podcast/introducing-sold-out-rethinking-housing-in-america/id1531354937",
"rss": "https://feeds.megaphone.fm/soldout",
"spotify": "https://open.spotify.com/show/38dTBSk2ISFoPiyYNoKn1X",
"stitcher": "https://www.stitcher.com/podcast/kqed/sold-out-rethinking-housing-in-america",
"tunein": "https://tunein.com/radio/SOLD-OUT-Rethinking-Housing-in-America-p1365871/"
}
},
"spooked": {
"id": "spooked",
"title": "Spooked",
"tagline": "True-life supernatural stories",
"info": "",
"imageSrc": "https://cdn.kqed.org/wp-content/uploads/2024/10/Spooked-Podcast-Tile-703x703-1.jpg",
"imageAlt": "KQED Spooked",
"officialWebsiteLink": "https://spookedpodcast.org/",
"meta": {
"site": "news",
"source": "kqed",
"order": 7
},
"link": "https://spookedpodcast.org/",
"subscribe": {
"apple": "https://podcasts.apple.com/us/podcast/spooked/id1279361017",
"npr": "https://www.npr.org/podcasts/549547848/snap-judgment-presents-spooked",
"spotify": "https://open.spotify.com/show/76571Rfl3m7PLJQZKQIGCT",
"rss": "https://feeds.simplecast.com/TBotaapn"
}
},
"tech-nation": {
"id": "tech-nation",
"title": "Tech Nation Radio Podcast",
"info": "Tech Nation is a weekly public radio program, hosted by Dr. Moira Gunn. Founded in 1993, it has grown from a simple interview show to a multi-faceted production, featuring conversations with noted technology and science leaders, and a weekly science and technology-related commentary.",
"airtime": "FRI 10pm",
"imageSrc": "https://cdn.kqed.org/wp-content/uploads/2024/04/Tech-Nation-Radio-Podcast-Tile-360x360-1.jpg",
"officialWebsiteLink": "http://technation.podomatic.com/",
"meta": {
"site": "science",
"source": "Tech Nation Media"
},
"link": "/radio/program/tech-nation",
"subscribe": {
"rss": "https://technation.podomatic.com/rss2.xml"
}
},
"ted-radio-hour": {
"id": "ted-radio-hour",
"title": "TED Radio Hour",
"info": "The TED Radio Hour is a journey through fascinating ideas, astonishing inventions, fresh approaches to old problems, and new ways to think and create.",
"airtime": "SUN 3pm-4pm, SAT 10pm-11pm",
"imageSrc": "https://ww2.kqed.org/radio/wp-content/uploads/sites/50/2018/04/tedRadioHour.jpg",
"officialWebsiteLink": "https://www.npr.org/programs/ted-radio-hour/?showDate=2018-06-22",
"meta": {
"site": "news",
"source": "npr"
},
"link": "/radio/program/ted-radio-hour",
"subscribe": {
"npr": "https://rpb3r.app.goo.gl/8vsS",
"apple": "https://itunes.apple.com/WebObjects/MZStore.woa/wa/viewPodcast?s=143441&mt=2&id=523121474&at=11l79Y&ct=nprdirectory",
"tuneIn": "https://tunein.com/radio/TED-Radio-Hour-p418021/",
"rss": "https://feeds.npr.org/510298/podcast.xml"
}
},
"thebay": {
"id": "thebay",
"title": "The Bay",
"tagline": "Local news to keep you rooted",
"info": "Host Devin Katayama walks you through the biggest story of the day with reporters and newsmakers.",
"imageSrc": "https://cdn.kqed.org/wp-content/uploads/2024/04/The-Bay-Podcast-Tile-703x703-1.jpg",
"imageAlt": "KQED The Bay",
"officialWebsiteLink": "/podcasts/thebay",
"meta": {
"site": "radio",
"source": "kqed",
"order": 2
},
"link": "/podcasts/thebay",
"subscribe": {
"apple": "https://podcasts.apple.com/us/podcast/the-bay/id1350043452",
"amazon": "https://music.amazon.com/podcasts/d800ea4c-7a2c-42f2-b861-edaf78a5db0b/the-bay",
"npr": "https://www.npr.org/podcasts/586725995/the-bay",
"stitcher": "https://www.stitcher.com/podcast/kqed/the-bay",
"spotify": "https://open.spotify.com/show/4BIKBKIujizLHlIlBNaAqQ",
"rss": "https://feeds.megaphone.fm/KQINC8259786327"
}
},
"thelatest": {
"id": "thelatest",
"title": "The Latest",
"tagline": "Trusted local news in real time",
"info": "",
"imageSrc": "https://cdn.kqed.org/wp-content/uploads/2025/05/The-Latest-2025-Podcast-Tile-703x703-1.jpg",
"imageAlt": "KQED The Latest",
"officialWebsiteLink": "/thelatest",
"meta": {
"site": "news",
"source": "kqed",
"order": 6
},
"link": "/thelatest",
"subscribe": {
"apple": "https://podcasts.apple.com/us/podcast/the-latest-from-kqed/id1197721799",
"npr": "https://www.npr.org/podcasts/1257949365/the-latest-from-k-q-e-d",
"spotify": "https://open.spotify.com/show/5KIIXMgM9GTi5AepwOYvIZ?si=bd3053fec7244dba",
"rss": "https://feeds.megaphone.fm/KQINC9137121918"
}
},
"theleap": {
"id": "theleap",
"title": "The Leap",
"tagline": "What if you closed your eyes, and jumped?",
"info": "Stories about people making dramatic, risky changes, told by award-winning public radio reporter Judy Campbell.",
"imageSrc": "https://cdn.kqed.org/wp-content/uploads/2024/04/The-Leap-Podcast-Tile-703x703-1.jpg",
"imageAlt": "KQED The Leap",
"officialWebsiteLink": "/podcasts/theleap",
"meta": {
"site": "news",
"source": "kqed",
"order": 17
},
"link": "/podcasts/theleap",
"subscribe": {
"apple": "https://podcasts.apple.com/us/podcast/the-leap/id1046668171",
"npr": "https://www.npr.org/podcasts/447248267/the-leap",
"stitcher": "https://www.stitcher.com/podcast/kqed/the-leap",
"spotify": "https://open.spotify.com/show/3sSlVHHzU0ytLwuGs1SD1U",
"rss": "https://ww2.kqed.org/news/programs/the-leap/feed/podcast"
}
},
"the-moth-radio-hour": {
"id": "the-moth-radio-hour",
"title": "The Moth Radio Hour",
"info": "Since its launch in 1997, The Moth has presented thousands of true stories, told live and without notes, to standing-room-only crowds worldwide. Moth storytellers stand alone, under a spotlight, with only a microphone and a roomful of strangers. The storyteller and the audience embark on a high-wire act of shared experience which is both terrifying and exhilarating. Since 2008, The Moth podcast has featured many of our favorite stories told live on Moth stages around the country. For information on all of our programs and live events, visit themoth.org.",
"airtime": "SAT 8pm-9pm and SUN 11am-12pm",
"imageSrc": "https://ww2.kqed.org/radio/wp-content/uploads/sites/50/2018/04/theMoth.jpg",
"officialWebsiteLink": "https://themoth.org/",
"meta": {
"site": "arts",
"source": "prx"
},
"link": "/radio/program/the-moth-radio-hour",
"subscribe": {
"apple": "https://itunes.apple.com/us/podcast/the-moth-podcast/id275699983?mt=2",
"tuneIn": "https://tunein.com/radio/The-Moth-p273888/",
"rss": "http://feeds.themoth.org/themothpodcast"
}
},
"the-new-yorker-radio-hour": {
"id": "the-new-yorker-radio-hour",
"title": "The New Yorker Radio Hour",
"info": "The New Yorker Radio Hour is a weekly program presented by the magazine's editor, David Remnick, and produced by WNYC Studios and The New Yorker. Each episode features a diverse mix of interviews, profiles, storytelling, and an occasional burst of humor inspired by the magazine, and shaped by its writers, artists, and editors. This isn't a radio version of a magazine, but something all its own, reflecting the rich possibilities of audio storytelling and conversation. Theme music for the show was composed and performed by Merrill Garbus of tUnE-YArDs.",
"airtime": "SAT 10am-11am",
"imageSrc": "https://cdn.kqed.org/wp-content/uploads/2024/04/The-New-Yorker-Podcast-Tile-360x360-1.jpg",
"officialWebsiteLink": "https://www.wnycstudios.org/shows/tnyradiohour",
"meta": {
"site": "arts",
"source": "WNYC"
},
"link": "/radio/program/the-new-yorker-radio-hour",
"subscribe": {
"apple": "https://itunes.apple.com/us/podcast/id1050430296",
"tuneIn": "https://tunein.com/podcasts/WNYC-Podcasts/New-Yorker-Radio-Hour-p803804/",
"rss": "https://feeds.feedburner.com/newyorkerradiohour"
}
},
"the-sam-sanders-show": {
"id": "the-sam-sanders-show",
"title": "The Sam Sanders Show",
"info": "One of public radio's most dynamic voices, Sam Sanders helped launch The NPR Politics Podcast and hosted NPR's hit show It's Been A Minute. Now, the award-winning host returns with something brand new, The Sam Sanders Show. Every week, Sam Sanders and friends dig into the culture that shapes our lives: what's driving the biggest trends, how artists really think, and even the memes you can't stop scrolling past. Sam is beloved for his way of unpacking the world and bringing you up close to fresh currents and engaging conversations. The Sam Sanders Show is smart, funny and always a good time.",
"airtime": "FRI 12-1pm AND SAT 11am-12pm",
"imageSrc": "https://cdn.kqed.org/wp-content/uploads/2025/11/The-Sam-Sanders-Show-Podcast-Tile-400x400-1.jpg",
"officialWebsiteLink": "https://www.kcrw.com/shows/the-sam-sanders-show/latest",
"meta": {
"site": "arts",
"source": "KCRW"
},
"link": "https://www.kcrw.com/shows/the-sam-sanders-show/latest",
"subscribe": {
"rss": "https://feed.cdnstream1.com/zjb/feed/download/ac/28/59/ac28594c-e1d0-4231-8728-61865cdc80e8.xml"
}
},
"the-splendid-table": {
"id": "the-splendid-table",
"title": "The Splendid Table",
"info": "\u003cem>The Splendid Table\u003c/em> hosts our nation's conversations about cooking, sustainability and food culture.",
"imageSrc": "https://cdn.kqed.org/wp-content/uploads/2024/04/The-Splendid-Table-Podcast-Tile-360x360-1.jpg",
"officialWebsiteLink": "https://www.splendidtable.org/",
"airtime": "SUN 10-11 pm",
"meta": {
"site": "radio",
"source": "npr"
},
"link": "/radio/program/the-splendid-table"
},
"this-american-life": {
"id": "this-american-life",
"title": "This American Life",
"info": "This American Life is a weekly public radio show, heard by 2.2 million people on more than 500 stations. Another 2.5 million people download the weekly podcast. It is hosted by Ira Glass, produced in collaboration with Chicago Public Media, delivered to stations by PRX The Public Radio Exchange, and has won all of the major broadcasting awards.",
"airtime": "SAT 12pm-1pm, 7pm-8pm",
"imageSrc": "https://ww2.kqed.org/radio/wp-content/uploads/sites/50/2018/04/thisAmericanLife.png",
"officialWebsiteLink": "https://www.thisamericanlife.org/",
"meta": {
"site": "news",
"source": "wbez"
},
"link": "/radio/program/this-american-life",
"subscribe": {
"apple": "https://itunes.apple.com/WebObjects/MZStore.woa/wa/viewPodcast?s=143441&mt=2&id=201671138&at=11l79Y&ct=nprdirectory",
"rss": "https://www.thisamericanlife.org/podcast/rss.xml"
}
},
"tinydeskradio": {
"id": "tinydeskradio",
"title": "Tiny Desk Radio",
"info": "We're bringing the best of Tiny Desk to the airwaves, only on public radio.",
"airtime": "SUN 8pm and SAT 9pm",
"imageSrc": "https://cdn.kqed.org/wp-content/uploads/2025/04/300x300-For-Member-Station-Logo-Tiny-Desk-Radio-@2x.png",
"officialWebsiteLink": "https://www.npr.org/series/g-s1-52030/tiny-desk-radio",
"meta": {
"site": "news",
"source": "npr"
},
"link": "/radio/program/tinydeskradio",
"subscribe": {
"rss": "https://feeds.npr.org/g-s1-52030/rss.xml"
}
},
"wait-wait-dont-tell-me": {
"id": "wait-wait-dont-tell-me",
"title": "Wait Wait... Don't Tell Me!",
"info": "Peter Sagal and Bill Kurtis host the weekly NPR News quiz show alongside some of the best and brightest news and entertainment personalities.",
"airtime": "SUN 10am-11am, SAT 11am-12pm, SAT 6pm-7pm",
"imageSrc": "https://cdn.kqed.org/wp-content/uploads/2024/04/Wait-Wait-Podcast-Tile-300x300-1.jpg",
"officialWebsiteLink": "https://www.npr.org/programs/wait-wait-dont-tell-me/",
"meta": {
"site": "news",
"source": "npr"
},
"link": "/radio/program/wait-wait-dont-tell-me",
"subscribe": {
"npr": "https://rpb3r.app.goo.gl/Xogv",
"apple": "https://itunes.apple.com/WebObjects/MZStore.woa/wa/viewPodcast?s=143441&mt=2&id=121493804&at=11l79Y&ct=nprdirectory",
"tuneIn": "https://tunein.com/radio/Wait-Wait-Dont-Tell-Me-p46/",
"rss": "https://feeds.npr.org/344098539/podcast.xml"
}
},
"weekend-edition-saturday": {
"id": "weekend-edition-saturday",
"title": "Weekend Edition Saturday",
"info": "Weekend Edition Saturday wraps up the week's news and offers a mix of analysis and features on a wide range of topics, including arts, sports, entertainment, and human interest stories. The two-hour program is hosted by NPR's Peabody Award-winning Scott Simon.",
"airtime": "SAT 5am-10am",
"imageSrc": "https://cdn.kqed.org/wp-content/uploads/2024/04/Weekend-Edition-Podcast-Tile-360x360-1.jpg",
"officialWebsiteLink": "https://www.npr.org/programs/weekend-edition-saturday/",
"meta": {
"site": "news",
"source": "npr"
},
"link": "/radio/program/weekend-edition-saturday"
},
"weekend-edition-sunday": {
"id": "weekend-edition-sunday",
"title": "Weekend Edition Sunday",
"info": "Weekend Edition Sunday features interviews with newsmakers, artists, scientists, politicians, musicians, writers, theologians and historians. The program has covered news events from Nelson Mandela's 1990 release from a South African prison to the capture of Saddam Hussein.",
"airtime": "SUN 5am-10am",
"imageSrc": "https://cdn.kqed.org/wp-content/uploads/2024/04/Weekend-Edition-Podcast-Tile-360x360-1.jpg",
"officialWebsiteLink": "https://www.npr.org/programs/weekend-edition-sunday/",
"meta": {
"site": "news",
"source": "npr"
},
"link": "/radio/program/weekend-edition-sunday"
}
},
"racesReducer": {},
"racesGenElectionReducer": {},
"racesGenElection2026Reducer": {},
"radioSchedulesReducer": {},
"listsReducer": {
"posts/science?category=climate": {
"isFetching": false,
"latestQuery": {
"from": 1152,
"size": 12
},
"vitalsOnly": false,
"totalRequested": 12,
"isLoading": false,
"isLoadingMore": true,
"total": {
"value": 1586,
"relation": "eq"
},
"items": [
"science_958786",
"science_959253",
"science_946591",
"science_944002",
"science_943904",
"science_931634",
"science_929276",
"science_929164",
"science_907490",
"science_899859",
"science_880923",
"science_893464"
],
"complete": true
}
},
"recallGuideReducer": {
"intros": {},
"policy": {},
"candidates": {}
},
"savedArticleReducer": {
"articles": [],
"status": {}
},
"newslettersReducer": {
"isFetching": false,
"fetchFailed": false,
"hasFetched": false,
"newsletters": {},
"isSubscribing": false,
"isUnsubscribing": false,
"subscribedNewsletters": {}
},
"termsReducer": {
"about": {
"name": "About",
"type": "terms",
"id": "about",
"slug": "about",
"link": "/about",
"taxonomy": "site"
},
"arts": {
"name": "Arts & Culture",
"grouping": [
"arts",
"pop",
"trulyca"
],
"description": "KQED Arts provides daily in-depth coverage of the Bay Area's music, art, film, performing arts, literature and arts news, as well as cultural commentary and criticism.",
"type": "terms",
"id": "arts",
"slug": "arts",
"link": "/arts",
"taxonomy": "site"
},
"artschool": {
"name": "Art School",
"parent": "arts",
"type": "terms",
"id": "artschool",
"slug": "artschool",
"link": "/artschool",
"taxonomy": "site"
},
"bayareabites": {
"name": "KQED food",
"grouping": [
"food",
"bayareabites",
"checkplease"
],
"parent": "food",
"type": "terms",
"id": "bayareabites",
"slug": "bayareabites",
"link": "/food",
"taxonomy": "site"
},
"bayareahiphop": {
"name": "Bay Area Hiphop",
"type": "terms",
"id": "bayareahiphop",
"slug": "bayareahiphop",
"link": "/bayareahiphop",
"taxonomy": "site"
},
"campaign21": {
"name": "Campaign 21",
"type": "terms",
"id": "campaign21",
"slug": "campaign21",
"link": "/campaign21",
"taxonomy": "site"
},
"careers": {
"name": "Careers",
"type": "terms",
"id": "careers",
"slug": "careers",
"link": "/careers",
"taxonomy": "site"
},
"checkplease": {
"name": "KQED food",
"grouping": [
"food",
"bayareabites",
"checkplease"
],
"parent": "food",
"type": "terms",
"id": "checkplease",
"slug": "checkplease",
"link": "/food",
"taxonomy": "site"
},
"education": {
"name": "Education",
"grouping": [
"education"
],
"type": "terms",
"id": "education",
"slug": "education",
"link": "/education",
"taxonomy": "site"
},
"elections": {
"name": "Elections",
"type": "terms",
"id": "elections",
"slug": "elections",
"link": "/elections",
"taxonomy": "site"
},
"events": {
"name": "Events",
"type": "terms",
"id": "events",
"slug": "events",
"link": "/events",
"taxonomy": "site"
},
"event": {
"name": "Event",
"alias": "events",
"type": "terms",
"id": "event",
"slug": "event",
"link": "/event",
"taxonomy": "site"
},
"filmschoolshorts": {
"name": "Film School Shorts",
"type": "terms",
"id": "filmschoolshorts",
"slug": "filmschoolshorts",
"link": "/filmschoolshorts",
"taxonomy": "site"
},
"food": {
"name": "KQED food",
"grouping": [
"food",
"bayareabites",
"checkplease"
],
"type": "terms",
"id": "food",
"slug": "food",
"link": "/food",
"taxonomy": "site"
},
"forum": {
"name": "Forum",
"relatedContentQuery": "posts/forum?",
"parent": "news",
"type": "terms",
"id": "forum",
"slug": "forum",
"link": "/forum",
"taxonomy": "site"
},
"futureofyou": {
"name": "Future of You",
"grouping": [
"science",
"futureofyou"
],
"parent": "science",
"type": "terms",
"id": "futureofyou",
"slug": "futureofyou",
"link": "/futureofyou",
"taxonomy": "site"
},
"jpepinheart": {
"name": "KQED food",
"relatedContentQuery": "posts/food,bayareabites,checkplease",
"parent": "food",
"type": "terms",
"id": "jpepinheart",
"slug": "jpepinheart",
"link": "/food",
"taxonomy": "site"
},
"liveblog": {
"name": "Live Blog",
"type": "terms",
"id": "liveblog",
"slug": "liveblog",
"link": "/liveblog",
"taxonomy": "site"
},
"livetv": {
"name": "Live TV",
"parent": "tv",
"type": "terms",
"id": "livetv",
"slug": "livetv",
"link": "/livetv",
"taxonomy": "site"
},
"lowdown": {
"name": "The Lowdown",
"relatedContentQuery": "posts/lowdown?",
"parent": "news",
"type": "terms",
"id": "lowdown",
"slug": "lowdown",
"link": "/lowdown",
"taxonomy": "site"
},
"mindshift": {
"name": "Mindshift",
"parent": "news",
"description": "MindShift explores the future of education by highlighting the innovative – and sometimes counterintuitive – ways educators and parents are helping all children succeed.",
"type": "terms",
"id": "mindshift",
"slug": "mindshift",
"link": "/mindshift",
"taxonomy": "site"
},
"news": {
"name": "News",
"grouping": [
"news",
"forum"
],
"type": "terms",
"id": "news",
"slug": "news",
"link": "/news",
"taxonomy": "site"
},
"newsletters": {
"name": "newsletters",
"type": "terms",
"id": "newsletters",
"slug": "newsletters",
"link": "/newsletters",
"taxonomy": "site"
},
"perspectives": {
"name": "Perspectives",
"parent": "radio",
"type": "terms",
"id": "perspectives",
"slug": "perspectives",
"link": "/perspectives",
"taxonomy": "site"
},
"podcasts": {
"name": "Podcasts",
"type": "terms",
"id": "podcasts",
"slug": "podcasts",
"link": "/podcasts",
"taxonomy": "site"
},
"pop": {
"name": "Pop",
"parent": "arts",
"type": "terms",
"id": "pop",
"slug": "pop",
"link": "/pop",
"taxonomy": "site"
},
"pressroom": {
"name": "Pressroom",
"type": "terms",
"id": "pressroom",
"slug": "pressroom",
"link": "/pressroom",
"taxonomy": "site"
},
"quest": {
"name": "Quest",
"parent": "science",
"type": "terms",
"id": "quest",
"slug": "quest",
"link": "/quest",
"taxonomy": "site"
},
"radio": {
"name": "Radio",
"grouping": [
"forum",
"perspectives"
],
"description": "Listen to KQED Public Radio – home of Forum and The California Report – on 88.5 FM in San Francisco, 89.3 FM in Sacramento, 88.3 FM in Santa Rosa and 88.1 FM in Martinez.",
"type": "terms",
"id": "radio",
"slug": "radio",
"link": "/radio",
"taxonomy": "site"
},
"root": {
"name": "KQED",
"image": "https://ww2.kqed.org/app/uploads/2020/02/KQED-OG-Image@1x.png",
"imageWidth": 1200,
"imageHeight": 630,
"headData": {
"title": "KQED | News, Radio, Podcasts, TV | Public Media for Northern California",
"description": "KQED provides public radio, television, and independent reporting on issues that matter to the Bay Area. We’re the NPR and PBS member station for Northern California."
},
"type": "terms",
"id": "root",
"slug": "root",
"link": "/root",
"taxonomy": "site"
},
"science": {
"name": "Science",
"grouping": [
"science",
"futureofyou"
],
"description": "KQED Science brings you award-winning science and environment coverage from the Bay Area and beyond.",
"type": "terms",
"id": "science",
"slug": "science",
"link": "/science",
"taxonomy": "site"
},
"stateofhealth": {
"name": "State of Health",
"parent": "science",
"type": "terms",
"id": "stateofhealth",
"slug": "stateofhealth",
"link": "/stateofhealth",
"taxonomy": "site"
},
"support": {
"name": "Support",
"type": "terms",
"id": "support",
"slug": "support",
"link": "/support",
"taxonomy": "site"
},
"thedolist": {
"name": "The Do List",
"parent": "arts",
"type": "terms",
"id": "thedolist",
"slug": "thedolist",
"link": "/thedolist",
"taxonomy": "site"
},
"trulyca": {
"name": "Truly CA",
"grouping": [
"arts",
"pop",
"trulyca"
],
"parent": "arts",
"type": "terms",
"id": "trulyca",
"slug": "trulyca",
"link": "/trulyca",
"taxonomy": "site"
},
"tv": {
"name": "TV",
"type": "terms",
"id": "tv",
"slug": "tv",
"link": "/tv",
"taxonomy": "site"
},
"voterguide": {
"name": "Voter Guide",
"parent": "elections",
"alias": "elections",
"type": "terms",
"id": "voterguide",
"slug": "voterguide",
"link": "/voterguide",
"taxonomy": "site"
},
"guiaelectoral": {
"name": "Guia Electoral",
"parent": "elections",
"alias": "elections",
"type": "terms",
"id": "guiaelectoral",
"slug": "guiaelectoral",
"link": "/guiaelectoral",
"taxonomy": "site"
},
"science_category_climate": {
"isLoading": true
},
"science_31": {
"type": "terms",
"id": "science_31",
"meta": {
"index": "terms_1716263798",
"site": "science",
"id": "31",
"found": true
},
"relationships": {},
"featImg": null,
"name": "Climate",
"description": null,
"taxonomy": "category",
"headData": {
"twImgId": null,
"twTitle": null,
"ogTitle": null,
"ogImgId": null,
"twDescription": null,
"description": null,
"title": "Climate Archives | KQED Science",
"ogDescription": null
},
"ttid": 33,
"slug": "climate",
"isLoading": false,
"link": "/science/category/climate"
},
"source_science_946591": {
"type": "terms",
"id": "source_science_946591",
"meta": {
"override": true
},
"name": "Climate Central",
"link": "http://www.climatecentral.org/",
"isLoading": false
},
"source_science_943904": {
"type": "terms",
"id": "source_science_943904",
"meta": {
"override": true
},
"name": "Climate Central",
"link": "http://www.climatecentral.org/",
"isLoading": false
},
"source_science_931634": {
"type": "terms",
"id": "source_science_931634",
"meta": {
"override": true
},
"name": "Climate Central",
"link": "http://www.climatecentral.org/",
"isLoading": false
},
"source_science_929276": {
"type": "terms",
"id": "source_science_929276",
"meta": {
"override": true
},
"name": "Climate Central",
"link": "http://www.climatecentral.org/",
"isLoading": false
},
"source_science_929164": {
"type": "terms",
"id": "source_science_929164",
"meta": {
"override": true
},
"name": "NPR",
"link": "http://www.npr.org/",
"isLoading": false
},
"source_science_907490": {
"type": "terms",
"id": "source_science_907490",
"meta": {
"override": true
},
"name": "Climate Central",
"link": "http://www.climatecentral.org/",
"isLoading": false
},
"source_science_899859": {
"type": "terms",
"id": "source_science_899859",
"meta": {
"override": true
},
"name": "Climate Central",
"link": "http://www.climatecentral.org/",
"isLoading": false
},
"source_science_893464": {
"type": "terms",
"id": "source_science_893464",
"meta": {
"override": true
},
"name": "Climate Central",
"link": "http://www.climatecentral.org/",
"isLoading": false
},
"science_33": {
"type": "terms",
"id": "science_33",
"meta": {
"index": "terms_1716263798",
"site": "science",
"id": "33",
"found": true
},
"relationships": {},
"featImg": null,
"name": "Energy",
"description": null,
"taxonomy": "category",
"headData": {
"twImgId": null,
"twTitle": null,
"ogTitle": null,
"ogImgId": null,
"twDescription": null,
"description": null,
"title": "Energy Archives | KQED Science",
"ogDescription": null
},
"ttid": 35,
"slug": "energy",
"isLoading": false,
"link": "/science/category/energy"
},
"science_35": {
"type": "terms",
"id": "science_35",
"meta": {
"index": "terms_1716263798",
"site": "science",
"id": "35",
"found": true
},
"relationships": {},
"featImg": null,
"name": "Environment",
"description": null,
"taxonomy": "category",
"headData": {
"twImgId": null,
"twTitle": null,
"ogTitle": null,
"ogImgId": null,
"twDescription": null,
"description": null,
"title": "Environment Archives | KQED Science",
"ogDescription": null
},
"ttid": 37,
"slug": "environment",
"isLoading": false,
"link": "/science/category/environment"
},
"science_40": {
"type": "terms",
"id": "science_40",
"meta": {
"index": "terms_1716263798",
"site": "science",
"id": "40",
"found": true
},
"relationships": {},
"featImg": null,
"name": "News",
"description": null,
"taxonomy": "category",
"headData": {
"twImgId": null,
"twTitle": null,
"ogTitle": null,
"ogImgId": null,
"twDescription": null,
"description": null,
"title": "News Archives | KQED Science",
"ogDescription": null
},
"ttid": 42,
"slug": "news",
"isLoading": false,
"link": "/science/category/news"
},
"science_43": {
"type": "terms",
"id": "science_43",
"meta": {
"index": "terms_1716263798",
"site": "science",
"id": "43",
"found": true
},
"relationships": {},
"featImg": null,
"name": "Radio",
"description": null,
"taxonomy": "category",
"headData": {
"twImgId": null,
"twTitle": null,
"ogTitle": null,
"ogImgId": null,
"twDescription": null,
"description": null,
"title": "Radio Archives | KQED Science",
"ogDescription": null
},
"ttid": 45,
"slug": "radio",
"isLoading": false,
"link": "/science/category/radio"
},
"science_98": {
"type": "terms",
"id": "science_98",
"meta": {
"index": "terms_1716263798",
"site": "science",
"id": "98",
"found": true
},
"relationships": {},
"featImg": null,
"name": "Water",
"description": null,
"taxonomy": "category",
"headData": {
"twImgId": null,
"twTitle": null,
"ogTitle": null,
"ogImgId": null,
"twDescription": null,
"description": null,
"title": "Water Archives | KQED Science",
"ogDescription": null
},
"ttid": 102,
"slug": "water",
"isLoading": false,
"link": "/science/category/water"
},
"science_5185": {
"type": "terms",
"id": "science_5185",
"meta": {
"index": "terms_1716263798",
"site": "science",
"id": "5185",
"found": true
},
"relationships": {},
"featImg": null,
"name": "Lake Tahoe",
"description": null,
"taxonomy": "tag",
"headData": {
"twImgId": null,
"twTitle": null,
"ogTitle": null,
"ogImgId": null,
"twDescription": null,
"description": null,
"title": "Lake Tahoe Archives | KQED Science",
"ogDescription": null
},
"ttid": 5185,
"slug": "lake-tahoe",
"isLoading": false,
"link": "/science/tag/lake-tahoe"
},
"science_1151": {
"type": "terms",
"id": "science_1151",
"meta": {
"index": "terms_1716263798",
"site": "science",
"id": "1151",
"found": true
},
"relationships": {},
"featImg": null,
"name": "Drought Watch",
"description": "\u003cem>What California's reservoirs look like right now (From KQED's \u003ca href=\"http://ww2.kqed.org/lowdown/\">The Lowdown\u003c/a>)\u003c/em>\r\n\r\n[iframe src=\"http://kroodsma.com/KQED/water-supply-master/public/map.html\" width=\"640\" height=\"720\" frameborder=\"0\" scrolling=\"no\"]\r\n\r\n\u003cem>We’re collecting all of our California drought coverage here, starting with the current state of the drought, then providing the \u003ca href=\"#background\">background\u003c/a> and rounding up \u003ca href=\"#river\">all the stories\u003c/a> we’ve produced.\u003c/em>\r\n\r\n\u003cstrong>Relief at Last\r\n\u003c/strong>\r\n\r\nIn early April, after more than five years of the most withering drought on record, California Governor Jerry Brown finally lifted the emergency drought order he issued in January of 2014. By that time, the record-setting winter of 2016-17 had removed all doubt that the drought was over, though concerns over depleted groundwater levels still remain. According to the \u003ca href=\"http://droughtmonitor.unl.edu/\" target=\"_blank\">U.S. Drought Monitor\u003c/a>, less than 10 percent of California remains in “moderate drought” — compared to nearly 100 percent of the state a year ago.\r\n\r\n[http_redir]",
"taxonomy": "series",
"headData": {
"twImgId": null,
"twTitle": null,
"ogTitle": null,
"ogImgId": null,
"twDescription": null,
"description": "What California's reservoirs look like right now (From KQED's The Lowdown) [iframe src=\"http://kroodsma.com/KQED/water-supply-master/public/map.html\" width=\"640\" height=\"720\" frameborder=\"0\" scrolling=\"no\"] We’re collecting all of our California drought coverage here, starting with the current state of the drought, then providing the background and rounding up all the stories we’ve produced. Relief at Last In early April, after more than five years of the most withering drought on record, California Governor Jerry Brown finally lifted the emergency drought order he issued in January of 2014. By that time, the record-setting winter of 2016-17 had removed all doubt that the drought was over, though concerns over depleted groundwater levels still remain. According to the U.S. Drought Monitor, less than 10 percent of California remains in “moderate drought” — compared to nearly 100 percent of the state a year ago. [http_redir]",
"title": "Drought Watch Archives | KQED Science",
"ogDescription": null
},
"ttid": 1160,
"slug": "california-drought-watch",
"isLoading": false,
"link": "/science/series/california-drought-watch"
},
"science_39": {
"type": "terms",
"id": "science_39",
"meta": {
"index": "terms_1716263798",
"site": "science",
"id": "39",
"found": true
},
"relationships": {},
"featImg": null,
"name": "Health",
"description": null,
"taxonomy": "category",
"headData": {
"twImgId": null,
"twTitle": null,
"ogTitle": null,
"ogImgId": null,
"twDescription": null,
"description": null,
"title": "Health Archives | KQED Science",
"ogDescription": null
},
"ttid": 41,
"slug": "health",
"isLoading": false,
"link": "/science/category/health"
},
"science_572": {
"type": "terms",
"id": "science_572",
"meta": {
"index": "terms_1716263798",
"site": "science",
"id": "572",
"found": true
},
"relationships": {},
"featImg": null,
"name": "drought",
"description": null,
"taxonomy": "tag",
"headData": {
"twImgId": null,
"twTitle": null,
"ogTitle": null,
"ogImgId": null,
"twDescription": null,
"description": null,
"title": "drought Archives | KQED Science",
"ogDescription": null
},
"ttid": 578,
"slug": "drought",
"isLoading": false,
"link": "/science/tag/drought"
},
"science_194": {
"type": "terms",
"id": "science_194",
"meta": {
"index": "terms_1716263798",
"site": "science",
"id": "194",
"found": true
},
"relationships": {},
"featImg": null,
"name": "climate change",
"description": null,
"taxonomy": "tag",
"headData": {
"twImgId": null,
"twTitle": null,
"ogTitle": null,
"ogImgId": null,
"twDescription": null,
"description": null,
"title": "climate change Archives | KQED Science",
"ogDescription": null
},
"ttid": 198,
"slug": "climate-change",
"isLoading": false,
"link": "/science/tag/climate-change"
},
"science_556": {
"type": "terms",
"id": "science_556",
"meta": {
"index": "terms_1716263798",
"site": "science",
"id": "556",
"found": true
},
"relationships": {},
"featImg": null,
"name": "global warming",
"description": null,
"taxonomy": "tag",
"headData": {
"twImgId": null,
"twTitle": null,
"ogTitle": null,
"ogImgId": null,
"twDescription": null,
"description": null,
"title": "global warming Archives | KQED Science",
"ogDescription": null
},
"ttid": 562,
"slug": "global-warming",
"isLoading": false,
"link": "/science/tag/global-warming"
},
"science_3081": {
"type": "terms",
"id": "science_3081",
"meta": {
"index": "terms_1716263798",
"site": "science",
"id": "3081",
"found": true
},
"relationships": {},
"featImg": null,
"name": "National Parks",
"description": null,
"taxonomy": "series",
"headData": {
"twImgId": null,
"twTitle": null,
"ogTitle": null,
"ogImgId": null,
"twDescription": null,
"description": null,
"title": "National Parks Archives | KQED Science",
"ogDescription": null
},
"ttid": 3081,
"slug": "national-parks",
"isLoading": false,
"link": "/science/series/national-parks"
},
"science_3259": {
"type": "terms",
"id": "science_3259",
"meta": {
"index": "terms_1716263798",
"site": "science",
"id": "3259",
"found": true
},
"relationships": {},
"featImg": null,
"name": "PBS Nature Presents Yosemite",
"description": "\u003ciframe width=\"640\" height=\"470\" src=\"https://player.pbs.org/viralplayer/2365985049/?chapter=1\" frameborder=\"0\" marginwidth=\"0\" marginheight=\"0\" scrolling=\"no\" seamless allowfullscreen>\u003c/iframe>\r\n\r\nYosemite Valley is a land forged in wildfire and sculpted by water, the delicate balance of these two elements are essential to the creatures and trees that call this land their home. But with climates changing and temperatures rising, the Sierras are under siege. Water is scarcer and the threat of fire is more common. Join scientists, experts, and adventurers as they trudge through mountains of snow, climb trees as tall as buildings, and soar high in the air to spy just how these global changes are affecting one of America’s greatest wildernesses.\r\n\r\nPBS NATURE'S \u003cem>\u003cstrong>YOSEMITE\u003c/strong>\u003c/em> airs Wednesday, March 29 at 8PM on KQED 9.\r\n\r\n[youtube https://www.youtube.com/watch?v=HwMPQjTZFLg]\r\n\r\n\u003cstrong>Featured Stories\u003c/strong>",
"taxonomy": "series",
"headData": {
"twImgId": null,
"twTitle": null,
"ogTitle": null,
"ogImgId": null,
"twDescription": null,
"description": "Yosemite Valley is a land forged in wildfire and sculpted by water, the delicate balance of these two elements are essential to the creatures and trees that call this land their home. But with climates changing and temperatures rising, the Sierras are under siege. Water is scarcer and the threat of fire is more common. Join scientists, experts, and adventurers as they trudge through mountains of snow, climb trees as tall as buildings, and soar high in the air to spy just how these global changes are affecting one of America’s greatest wildernesses. PBS NATURE'S YOSEMITE airs Wednesday, March 29 at 8PM on KQED 9. [youtube https://www.youtube.com/watch?v=HwMPQjTZFLg] Featured Stories",
"title": "PBS Nature Presents Yosemite Archives | KQED Science",
"ogDescription": null
},
"ttid": 3259,
"slug": "yosemite",
"isLoading": false,
"link": "/science/series/yosemite"
},
"science_2874": {
"type": "terms",
"id": "science_2874",
"meta": {
"index": "terms_1716263798",
"site": "science",
"id": "2874",
"found": true
},
"relationships": {},
"featImg": null,
"name": "Animals",
"description": null,
"taxonomy": "category",
"headData": {
"twImgId": null,
"twTitle": null,
"ogTitle": null,
"ogImgId": null,
"twDescription": null,
"description": null,
"title": "Animals Archives | KQED Science",
"ogDescription": null
},
"ttid": 2874,
"slug": "animals",
"isLoading": false,
"link": "/science/category/animals"
},
"science_30": {
"type": "terms",
"id": "science_30",
"meta": {
"index": "terms_1716263798",
"site": "science",
"id": "30",
"found": true
},
"relationships": {},
"featImg": null,
"name": "Biology",
"description": null,
"taxonomy": "category",
"headData": {
"twImgId": null,
"twTitle": null,
"ogTitle": null,
"ogImgId": null,
"twDescription": null,
"description": null,
"title": "Biology Archives | KQED Science",
"ogDescription": null
},
"ttid": 32,
"slug": "biology",
"isLoading": false,
"link": "/science/category/biology"
},
"science_2873": {
"type": "terms",
"id": "science_2873",
"meta": {
"index": "terms_1716263798",
"site": "science",
"id": "2873",
"found": true
},
"relationships": {},
"featImg": null,
"name": "Oceans",
"description": null,
"taxonomy": "category",
"headData": {
"twImgId": null,
"twTitle": null,
"ogTitle": null,
"ogImgId": null,
"twDescription": null,
"description": null,
"title": "Oceans Archives | KQED Science",
"ogDescription": null
},
"ttid": 2873,
"slug": "oceans",
"isLoading": false,
"link": "/science/category/oceans"
},
"science_371": {
"type": "terms",
"id": "science_371",
"meta": {
"index": "terms_1716263798",
"site": "science",
"id": "371",
"found": true
},
"relationships": {},
"featImg": null,
"name": "el nino",
"description": null,
"taxonomy": "tag",
"headData": {
"twImgId": null,
"twTitle": null,
"ogTitle": null,
"ogImgId": null,
"twDescription": null,
"description": null,
"title": "el nino Archives | KQED Science",
"ogDescription": null
},
"ttid": 377,
"slug": "el-nino",
"isLoading": false,
"link": "/science/tag/el-nino"
}
},
"userPermissionsReducer": {
"wpLoggedIn": false
},
"eventsReducer": {},
"fssReducer": {},
"tvDailyScheduleReducer": {},
"tvWeeklyScheduleReducer": {},
"tvPrimetimeScheduleReducer": {},
"tvMonthlyScheduleReducer": {},
"userAccountReducer": {
"user": {
"email": null,
"emailStatus": "EMAIL_UNVALIDATED",
"loggedStatus": "LOGGED_OUT",
"loggingChecked": false,
"articles": [],
"firstName": null,
"lastName": null,
"phoneNumber": null,
"fetchingMembership": false,
"membershipError": false,
"memberships": [
{
"id": null,
"startDate": null,
"firstName": null,
"lastName": null,
"familyNumber": null,
"memberNumber": null,
"memberSince": null,
"expirationDate": null,
"pfsEligible": false,
"isSustaining": false,
"membershipLevel": "Prospect",
"membershipStatus": "Non Member",
"lastGiftDate": null,
"renewalDate": null,
"lastDonationAmount": null
}
]
},
"authModal": {
"isOpen": false,
"view": "LANDING_VIEW"
},
"error": null
},
"youthMediaReducer": {},
"checkPleaseReducer": {
"filterData": {
"region": {
"key": "Restaurant Region",
"filters": [
"Any Region"
]
},
"cuisine": {
"key": "Restaurant Cuisine",
"filters": [
"Any Cuisine"
]
}
},
"restaurantDataById": {},
"restaurantIdsSorted": [],
"error": null
},
"userAgentReducer": {
"userAgent": "Mozilla/5.0 AppleWebKit/537.36 (KHTML, like Gecko; compatible; ClaudeBot/1.0; +claudebot@anthropic.com)",
"isBot": true
},
"requestOutcomesReducer": {
"notFound": []
}
}