window.__IS_SSR__=true
window.__INITIAL_STATE__={
"attachmentsReducer": {
"audio_0": {
"type": "attachments",
"id": "audio_0",
"imgSizes": {
"kqedFullSize": {
"file": "https://ww2.kqed.org/news/wp-content/themes/KQED-unified/img/audio_bgs/background0.jpg"
}
}
},
"audio_1": {
"type": "attachments",
"id": "audio_1",
"imgSizes": {
"kqedFullSize": {
"file": "https://ww2.kqed.org/news/wp-content/themes/KQED-unified/img/audio_bgs/background1.jpg"
}
}
},
"audio_2": {
"type": "attachments",
"id": "audio_2",
"imgSizes": {
"kqedFullSize": {
"file": "https://ww2.kqed.org/news/wp-content/themes/KQED-unified/img/audio_bgs/background2.jpg"
}
}
},
"audio_3": {
"type": "attachments",
"id": "audio_3",
"imgSizes": {
"kqedFullSize": {
"file": "https://ww2.kqed.org/news/wp-content/themes/KQED-unified/img/audio_bgs/background3.jpg"
}
}
},
"audio_4": {
"type": "attachments",
"id": "audio_4",
"imgSizes": {
"kqedFullSize": {
"file": "https://ww2.kqed.org/news/wp-content/themes/KQED-unified/img/audio_bgs/background4.jpg"
}
}
},
"placeholder": {
"type": "attachments",
"id": "placeholder",
"imgSizes": {
"thumbnail": {
"file": "https://cdn.kqed.org/wp-content/uploads/2024/12/KQED-Default-Image-816638274-2000x1333-1-160x107.jpg",
"width": 160,
"height": 107,
"mimeType": "image/jpeg"
},
"medium": {
"file": "https://cdn.kqed.org/wp-content/uploads/2024/12/KQED-Default-Image-816638274-2000x1333-1-800x533.jpg",
"width": 800,
"height": 533,
"mimeType": "image/jpeg"
},
"medium_large": {
"file": "https://cdn.kqed.org/wp-content/uploads/2024/12/KQED-Default-Image-816638274-2000x1333-1-768x512.jpg",
"width": 768,
"height": 512,
"mimeType": "image/jpeg"
},
"large": {
"file": "https://cdn.kqed.org/wp-content/uploads/2024/12/KQED-Default-Image-816638274-2000x1333-1-1020x680.jpg",
"width": 1020,
"height": 680,
"mimeType": "image/jpeg"
},
"1536x1536": {
"file": "https://cdn.kqed.org/wp-content/uploads/2024/12/KQED-Default-Image-816638274-2000x1333-1-1536x1024.jpg",
"width": 1536,
"height": 1024,
"mimeType": "image/jpeg"
},
"fd-lrg": {
"file": "https://cdn.kqed.org/wp-content/uploads/2024/12/KQED-Default-Image-816638274-2000x1333-1-1536x1024.jpg",
"width": 1536,
"height": 1024,
"mimeType": "image/jpeg"
},
"fd-med": {
"file": "https://cdn.kqed.org/wp-content/uploads/2024/12/KQED-Default-Image-816638274-2000x1333-1-1020x680.jpg",
"width": 1020,
"height": 680,
"mimeType": "image/jpeg"
},
"fd-sm": {
"file": "https://cdn.kqed.org/wp-content/uploads/2024/12/KQED-Default-Image-816638274-2000x1333-1-800x533.jpg",
"width": 800,
"height": 533,
"mimeType": "image/jpeg"
},
"post-thumbnail": {
"file": "https://cdn.kqed.org/wp-content/uploads/2024/12/KQED-Default-Image-816638274-2000x1333-1-672x372.jpg",
"width": 672,
"height": 372,
"mimeType": "image/jpeg"
},
"twentyfourteen-full-width": {
"file": "https://cdn.kqed.org/wp-content/uploads/2024/12/KQED-Default-Image-816638274-2000x1333-1-1038x576.jpg",
"width": 1038,
"height": 576,
"mimeType": "image/jpeg"
},
"xxsmall": {
"file": "https://cdn.kqed.org/wp-content/uploads/2024/12/KQED-Default-Image-816638274-2000x1333-1-160x107.jpg",
"width": 160,
"height": 107,
"mimeType": "image/jpeg"
},
"xsmall": {
"file": "https://cdn.kqed.org/wp-content/uploads/2024/12/KQED-Default-Image-816638274-2000x1333-1-672x372.jpg",
"width": 672,
"height": 372,
"mimeType": "image/jpeg"
},
"small": {
"file": "https://cdn.kqed.org/wp-content/uploads/2024/12/KQED-Default-Image-816638274-2000x1333-1-672x372.jpg",
"width": 672,
"height": 372,
"mimeType": "image/jpeg"
},
"xlarge": {
"file": "https://cdn.kqed.org/wp-content/uploads/2024/12/KQED-Default-Image-816638274-2000x1333-1-1020x680.jpg",
"width": 1020,
"height": 680,
"mimeType": "image/jpeg"
},
"full-width": {
"file": "https://cdn.kqed.org/wp-content/uploads/2024/12/KQED-Default-Image-816638274-2000x1333-1-1920x1280.jpg",
"width": 1920,
"height": 1280,
"mimeType": "image/jpeg"
},
"guest-author-32": {
"file": "https://cdn.kqed.org/wp-content/uploads/2025/01/KQED-Default-Image-816638274-1333x1333-1-160x160.jpg",
"width": 32,
"height": 32,
"mimeType": "image/jpeg"
},
"guest-author-50": {
"file": "https://cdn.kqed.org/wp-content/uploads/2025/01/KQED-Default-Image-816638274-1333x1333-1-160x160.jpg",
"width": 50,
"height": 50,
"mimeType": "image/jpeg"
},
"guest-author-64": {
"file": "https://cdn.kqed.org/wp-content/uploads/2025/01/KQED-Default-Image-816638274-1333x1333-1-160x160.jpg",
"width": 64,
"height": 64,
"mimeType": "image/jpeg"
},
"guest-author-96": {
"file": "https://cdn.kqed.org/wp-content/uploads/2025/01/KQED-Default-Image-816638274-1333x1333-1-160x160.jpg",
"width": 96,
"height": 96,
"mimeType": "image/jpeg"
},
"guest-author-128": {
"file": "https://cdn.kqed.org/wp-content/uploads/2025/01/KQED-Default-Image-816638274-1333x1333-1-160x160.jpg",
"width": 128,
"height": 128,
"mimeType": "image/jpeg"
},
"detail": {
"file": "https://cdn.kqed.org/wp-content/uploads/2025/01/KQED-Default-Image-816638274-1333x1333-1-160x160.jpg",
"width": 160,
"height": 160,
"mimeType": "image/jpeg"
},
"kqedFullSize": {
"file": "https://cdn.kqed.org/wp-content/uploads/2024/12/KQED-Default-Image-816638274-2000x1333-1.jpg",
"width": 2000,
"height": 1333
}
}
},
"science_725754": {
"type": "attachments",
"id": "science_725754",
"meta": {
"index": "attachments_1716263798",
"site": "science",
"id": "725754",
"found": true
},
"parent": 725648,
"imgSizes": {
"thumbnail": {
"file": "https://ww2.kqed.org/app/uploads/sites/35/2016/05/Arches_ArchesNP-400x267.jpg",
"width": 400,
"mimeType": "image/jpeg",
"height": 267
},
"post-thumbnail": {
"file": "https://ww2.kqed.org/app/uploads/sites/35/2016/05/Arches_ArchesNP-672x372.jpg",
"width": 672,
"mimeType": "image/jpeg",
"height": 372
},
"kqedFullSize": {
"file": "https://ww2.kqed.org/app/uploads/sites/35/2016/05/Arches_ArchesNP.jpg",
"width": 705,
"height": 470
},
"guest-author-50": {
"file": "https://ww2.kqed.org/app/uploads/sites/35/2016/05/Arches_ArchesNP-50x50.jpg",
"width": 50,
"mimeType": "image/jpeg",
"height": 50
},
"guest-author-96": {
"file": "https://ww2.kqed.org/app/uploads/sites/35/2016/05/Arches_ArchesNP-96x96.jpg",
"width": 96,
"mimeType": "image/jpeg",
"height": 96
},
"guest-author-64": {
"file": "https://ww2.kqed.org/app/uploads/sites/35/2016/05/Arches_ArchesNP-64x64.jpg",
"width": 64,
"mimeType": "image/jpeg",
"height": 64
},
"detail": {
"file": "https://ww2.kqed.org/app/uploads/sites/35/2016/05/Arches_ArchesNP-150x150.jpg",
"width": 150,
"mimeType": "image/jpeg",
"height": 150
},
"guest-author-32": {
"file": "https://ww2.kqed.org/app/uploads/sites/35/2016/05/Arches_ArchesNP-32x32.jpg",
"width": 32,
"mimeType": "image/jpeg",
"height": 32
},
"guest-author-128": {
"file": "https://ww2.kqed.org/app/uploads/sites/35/2016/05/Arches_ArchesNP-128x128.jpg",
"width": 128,
"mimeType": "image/jpeg",
"height": 128
}
},
"publishDate": 1464200593,
"modified": 1464200605,
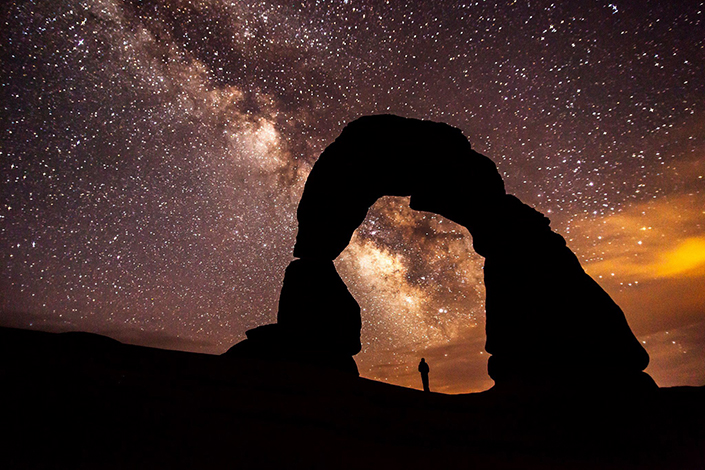
"caption": "Delicate Arch at night in Arches National Park. ",
"description": null,
"title": "Arches_ArchesNP",
"credit": "Arches National Park",
"status": "inherit",
"isLoading": false,
"fetchFailed": false
},
"science_687769": {
"type": "attachments",
"id": "science_687769",
"meta": {
"index": "attachments_1716263798",
"site": "science",
"id": "687769",
"found": true
},
"parent": 687703,
"imgSizes": {
"twentyfourteen-full-width": {
"file": "https://ww2.kqed.org/app/uploads/sites/35/2016/05/IMG_3725-1038x576.jpg",
"width": 1038,
"mimeType": "image/jpeg",
"height": 576
},
"thumbnail": {
"file": "https://ww2.kqed.org/app/uploads/sites/35/2016/05/IMG_3725-400x300.jpg",
"width": 400,
"mimeType": "image/jpeg",
"height": 300
},
"fd-sm": {
"file": "https://ww2.kqed.org/app/uploads/sites/35/2016/05/IMG_3725-960x720.jpg",
"width": 960,
"mimeType": "image/jpeg",
"height": 720
},
"post-thumbnail": {
"file": "https://ww2.kqed.org/app/uploads/sites/35/2016/05/IMG_3725-672x372.jpg",
"width": 672,
"mimeType": "image/jpeg",
"height": 372
},
"kqedFullSize": {
"file": "https://ww2.kqed.org/app/uploads/sites/35/2016/05/IMG_3725.jpg",
"width": 3264,
"height": 2448
},
"large": {
"file": "https://ww2.kqed.org/app/uploads/sites/35/2016/05/IMG_3725-1440x1080.jpg",
"width": 1440,
"mimeType": "image/jpeg",
"height": 1080
},
"guest-author-96": {
"file": "https://ww2.kqed.org/app/uploads/sites/35/2016/05/IMG_3725-96x96.jpg",
"width": 96,
"mimeType": "image/jpeg",
"height": 96
},
"medium": {
"file": "https://ww2.kqed.org/app/uploads/sites/35/2016/05/IMG_3725-800x600.jpg",
"width": 800,
"mimeType": "image/jpeg",
"height": 600
},
"guest-author-64": {
"file": "https://ww2.kqed.org/app/uploads/sites/35/2016/05/IMG_3725-64x64.jpg",
"width": 64,
"mimeType": "image/jpeg",
"height": 64
},
"guest-author-32": {
"file": "https://ww2.kqed.org/app/uploads/sites/35/2016/05/IMG_3725-32x32.jpg",
"width": 32,
"mimeType": "image/jpeg",
"height": 32
},
"fd-lrg": {
"file": "https://ww2.kqed.org/app/uploads/sites/35/2016/05/IMG_3725-1920x1440.jpg",
"width": 1920,
"mimeType": "image/jpeg",
"height": 1440
},
"fd-med": {
"file": "https://ww2.kqed.org/app/uploads/sites/35/2016/05/IMG_3725-1180x885.jpg",
"width": 1180,
"mimeType": "image/jpeg",
"height": 885
},
"detail": {
"file": "https://ww2.kqed.org/app/uploads/sites/35/2016/05/IMG_3725-150x150.jpg",
"width": 150,
"mimeType": "image/jpeg",
"height": 150
},
"medium_large": {
"file": "https://ww2.kqed.org/app/uploads/sites/35/2016/05/IMG_3725-768x576.jpg",
"width": 768,
"mimeType": "image/jpeg",
"height": 576
},
"guest-author-128": {
"file": "https://ww2.kqed.org/app/uploads/sites/35/2016/05/IMG_3725-128x128.jpg",
"width": 128,
"mimeType": "image/jpeg",
"height": 128
}
},
"publishDate": 1462824876,
"modified": 1462825001,
"caption": "Landscaping watering that produces runoff is now permanently banned in California.",
"description": "Landscaping watering that produces runoff is now permanently banned in California.",
"title": "IMG_3725",
"credit": "Craig Miller/KQED",
"status": "inherit",
"isLoading": false,
"fetchFailed": false
},
"science_677502": {
"type": "attachments",
"id": "science_677502",
"meta": {
"index": "attachments_1716263798",
"site": "science",
"id": "677502",
"found": true
},
"parent": 677501,
"imgSizes": {
"twentyfourteen-full-width": {
"file": "https://ww2.kqed.org/app/uploads/sites/35/2016/05/Marsh-1038x576.jpg",
"width": 1038,
"mimeType": "image/jpeg",
"height": 576
},
"thumbnail": {
"file": "https://ww2.kqed.org/app/uploads/sites/35/2016/05/Marsh-400x225.jpg",
"width": 400,
"mimeType": "image/jpeg",
"height": 225
},
"fd-sm": {
"file": "https://ww2.kqed.org/app/uploads/sites/35/2016/05/Marsh-960x540.jpg",
"width": 960,
"mimeType": "image/jpeg",
"height": 540
},
"post-thumbnail": {
"file": "https://ww2.kqed.org/app/uploads/sites/35/2016/05/Marsh-672x372.jpg",
"width": 672,
"mimeType": "image/jpeg",
"height": 372
},
"kqedFullSize": {
"file": "https://ww2.kqed.org/app/uploads/sites/35/2016/05/Marsh.jpg",
"width": 1920,
"height": 1080
},
"large": {
"file": "https://ww2.kqed.org/app/uploads/sites/35/2016/05/Marsh-1440x810.jpg",
"width": 1440,
"mimeType": "image/jpeg",
"height": 810
},
"guest-author-96": {
"file": "https://ww2.kqed.org/app/uploads/sites/35/2016/05/Marsh-96x96.jpg",
"width": 96,
"mimeType": "image/jpeg",
"height": 96
},
"medium": {
"file": "https://ww2.kqed.org/app/uploads/sites/35/2016/05/Marsh-800x450.jpg",
"width": 800,
"mimeType": "image/jpeg",
"height": 450
},
"guest-author-64": {
"file": "https://ww2.kqed.org/app/uploads/sites/35/2016/05/Marsh-64x64.jpg",
"width": 64,
"mimeType": "image/jpeg",
"height": 64
},
"guest-author-32": {
"file": "https://ww2.kqed.org/app/uploads/sites/35/2016/05/Marsh-32x32.jpg",
"width": 32,
"mimeType": "image/jpeg",
"height": 32
},
"fd-lrg": {
"file": "https://ww2.kqed.org/app/uploads/sites/35/2016/05/Marsh-1920x1080.jpg",
"width": 1920,
"mimeType": "image/jpeg",
"height": 1080
},
"fd-med": {
"file": "https://ww2.kqed.org/app/uploads/sites/35/2016/05/Marsh-1180x664.jpg",
"width": 1180,
"mimeType": "image/jpeg",
"height": 664
},
"detail": {
"file": "https://ww2.kqed.org/app/uploads/sites/35/2016/05/Marsh-150x150.jpg",
"width": 150,
"mimeType": "image/jpeg",
"height": 150
},
"medium_large": {
"file": "https://ww2.kqed.org/app/uploads/sites/35/2016/05/Marsh-768x432.jpg",
"width": 768,
"mimeType": "image/jpeg",
"height": 432
},
"guest-author-128": {
"file": "https://ww2.kqed.org/app/uploads/sites/35/2016/05/Marsh-128x128.jpg",
"width": 128,
"mimeType": "image/jpeg",
"height": 128
}
},
"publishDate": 1462409798,
"modified": 1462409822,
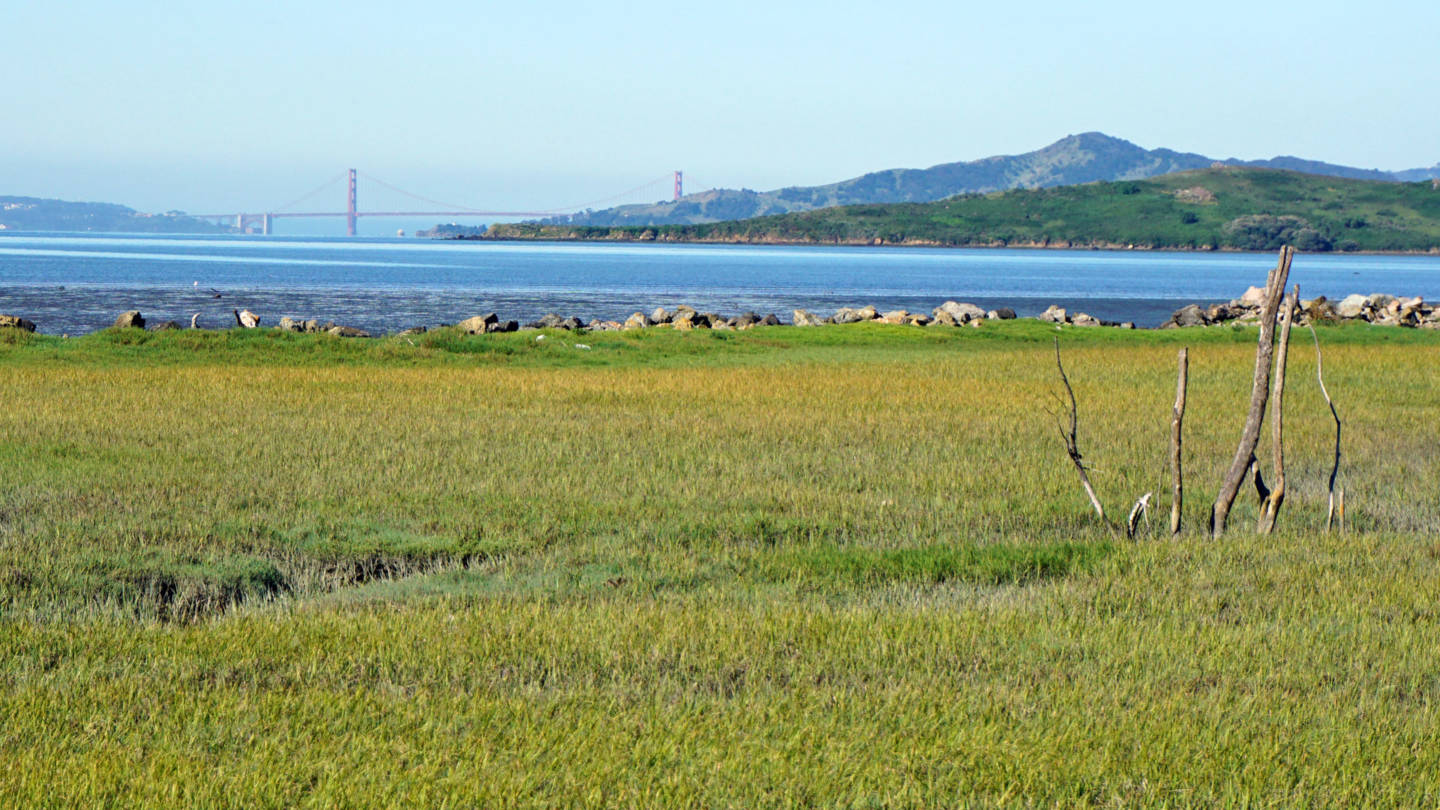
"caption": "A tidal marsh on the Richmond shoreline.",
"description": null,
"title": "Marsh",
"credit": "Lauren Sommer/KQED",
"status": "inherit",
"isLoading": false,
"fetchFailed": false
},
"science_680994": {
"type": "attachments",
"id": "science_680994",
"meta": {
"index": "attachments_1716263798",
"site": "science",
"id": "680994",
"found": true
},
"parent": 679581,
"imgSizes": {
"twentyfourteen-full-width": {
"file": "https://ww2.kqed.org/app/uploads/sites/35/2016/05/SierraOAP_2105-1038x576.jpeg",
"width": 1038,
"mimeType": "image/jpeg",
"height": 576
},
"thumbnail": {
"file": "https://ww2.kqed.org/app/uploads/sites/35/2016/05/SierraOAP_2105-400x192.jpeg",
"width": 400,
"mimeType": "image/jpeg",
"height": 192
},
"fd-sm": {
"file": "https://ww2.kqed.org/app/uploads/sites/35/2016/05/SierraOAP_2105-960x461.jpeg",
"width": 960,
"mimeType": "image/jpeg",
"height": 461
},
"post-thumbnail": {
"file": "https://ww2.kqed.org/app/uploads/sites/35/2016/05/SierraOAP_2105-672x372.jpeg",
"width": 672,
"mimeType": "image/jpeg",
"height": 372
},
"kqedFullSize": {
"file": "https://ww2.kqed.org/app/uploads/sites/35/2016/05/SierraOAP_2105.jpeg",
"width": 4032,
"height": 1935
},
"large": {
"file": "https://ww2.kqed.org/app/uploads/sites/35/2016/05/SierraOAP_2105-1440x691.jpeg",
"width": 1440,
"mimeType": "image/jpeg",
"height": 691
},
"guest-author-96": {
"file": "https://ww2.kqed.org/app/uploads/sites/35/2016/05/SierraOAP_2105-96x96.jpeg",
"width": 96,
"mimeType": "image/jpeg",
"height": 96
},
"medium": {
"file": "https://ww2.kqed.org/app/uploads/sites/35/2016/05/SierraOAP_2105-800x384.jpeg",
"width": 800,
"mimeType": "image/jpeg",
"height": 384
},
"guest-author-64": {
"file": "https://ww2.kqed.org/app/uploads/sites/35/2016/05/SierraOAP_2105-64x64.jpeg",
"width": 64,
"mimeType": "image/jpeg",
"height": 64
},
"guest-author-32": {
"file": "https://ww2.kqed.org/app/uploads/sites/35/2016/05/SierraOAP_2105-32x32.jpeg",
"width": 32,
"mimeType": "image/jpeg",
"height": 32
},
"fd-lrg": {
"file": "https://ww2.kqed.org/app/uploads/sites/35/2016/05/SierraOAP_2105-1920x921.jpeg",
"width": 1920,
"mimeType": "image/jpeg",
"height": 921
},
"fd-med": {
"file": "https://ww2.kqed.org/app/uploads/sites/35/2016/05/SierraOAP_2105-1180x566.jpeg",
"width": 1180,
"mimeType": "image/jpeg",
"height": 566
},
"detail": {
"file": "https://ww2.kqed.org/app/uploads/sites/35/2016/05/SierraOAP_2105-150x150.jpeg",
"width": 150,
"mimeType": "image/jpeg",
"height": 150
},
"medium_large": {
"file": "https://ww2.kqed.org/app/uploads/sites/35/2016/05/SierraOAP_2105-768x369.jpeg",
"width": 768,
"mimeType": "image/jpeg",
"height": 369
},
"guest-author-128": {
"file": "https://ww2.kqed.org/app/uploads/sites/35/2016/05/SierraOAP_2105-128x128.jpeg",
"width": 128,
"mimeType": "image/jpeg",
"height": 128
}
},
"publishDate": 1462549859,
"modified": 1462549932,
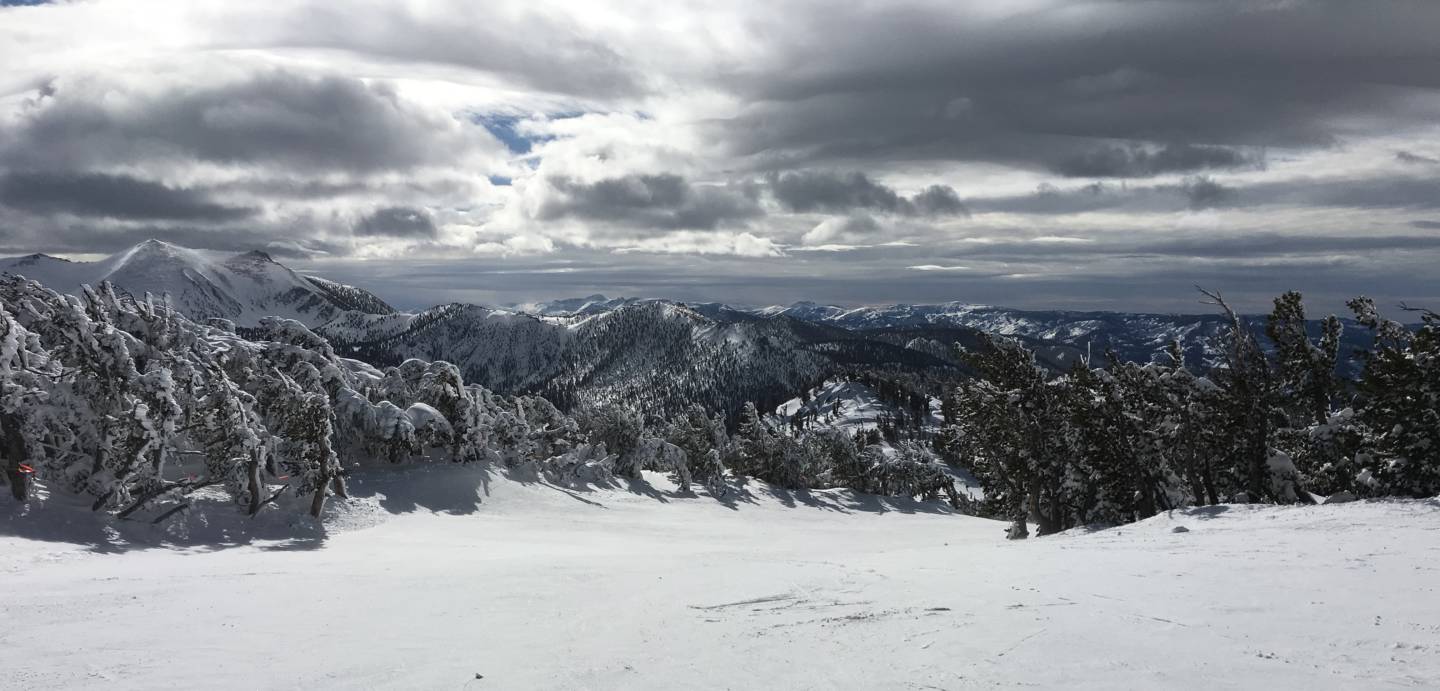
"caption": "Last winter's Sierra snowpack fell just short of the long-term average.",
"description": "Last winter's Sierra snowpack fell just short of the long-term average.",
"title": "SierraOAP_2105",
"credit": "Olivia Allen-Price",
"status": "inherit",
"isLoading": false,
"fetchFailed": false
},
"science_679297": {
"type": "attachments",
"id": "science_679297",
"meta": {
"index": "attachments_1716263798",
"site": "science",
"id": "679297",
"found": true
},
"parent": 679114,
"imgSizes": {
"twentyfourteen-full-width": {
"file": "https://ww2.kqed.org/app/uploads/sites/35/2016/05/RS4110_aqueduct20120131-1038x576.jpg",
"width": 1038,
"mimeType": "image/jpeg",
"height": 576
},
"thumbnail": {
"file": "https://ww2.kqed.org/app/uploads/sites/35/2016/05/RS4110_aqueduct20120131-400x267.jpg",
"width": 400,
"mimeType": "image/jpeg",
"height": 267
},
"fd-sm": {
"file": "https://ww2.kqed.org/app/uploads/sites/35/2016/05/RS4110_aqueduct20120131-960x640.jpg",
"width": 960,
"mimeType": "image/jpeg",
"height": 640
},
"post-thumbnail": {
"file": "https://ww2.kqed.org/app/uploads/sites/35/2016/05/RS4110_aqueduct20120131-672x372.jpg",
"width": 672,
"mimeType": "image/jpeg",
"height": 372
},
"kqedFullSize": {
"file": "https://ww2.kqed.org/app/uploads/sites/35/2016/05/RS4110_aqueduct20120131-e1462480095317.jpg",
"width": 2000,
"height": 1333
},
"large": {
"file": "https://ww2.kqed.org/app/uploads/sites/35/2016/05/RS4110_aqueduct20120131-1440x960.jpg",
"width": 1440,
"mimeType": "image/jpeg",
"height": 960
},
"guest-author-96": {
"file": "https://ww2.kqed.org/app/uploads/sites/35/2016/05/RS4110_aqueduct20120131-96x96.jpg",
"width": 96,
"mimeType": "image/jpeg",
"height": 96
},
"medium": {
"file": "https://ww2.kqed.org/app/uploads/sites/35/2016/05/RS4110_aqueduct20120131-800x533.jpg",
"width": 800,
"mimeType": "image/jpeg",
"height": 533
},
"guest-author-64": {
"file": "https://ww2.kqed.org/app/uploads/sites/35/2016/05/RS4110_aqueduct20120131-64x64.jpg",
"width": 64,
"mimeType": "image/jpeg",
"height": 64
},
"guest-author-32": {
"file": "https://ww2.kqed.org/app/uploads/sites/35/2016/05/RS4110_aqueduct20120131-32x32.jpg",
"width": 32,
"mimeType": "image/jpeg",
"height": 32
},
"fd-lrg": {
"file": "https://ww2.kqed.org/app/uploads/sites/35/2016/05/RS4110_aqueduct20120131-1920x1280.jpg",
"width": 1920,
"mimeType": "image/jpeg",
"height": 1280
},
"fd-med": {
"file": "https://ww2.kqed.org/app/uploads/sites/35/2016/05/RS4110_aqueduct20120131-1180x787.jpg",
"width": 1180,
"mimeType": "image/jpeg",
"height": 787
},
"detail": {
"file": "https://ww2.kqed.org/app/uploads/sites/35/2016/05/RS4110_aqueduct20120131-150x150.jpg",
"width": 150,
"mimeType": "image/jpeg",
"height": 150
},
"medium_large": {
"file": "https://ww2.kqed.org/app/uploads/sites/35/2016/05/RS4110_aqueduct20120131-768x512.jpg",
"width": 768,
"mimeType": "image/jpeg",
"height": 512
},
"guest-author-128": {
"file": "https://ww2.kqed.org/app/uploads/sites/35/2016/05/RS4110_aqueduct20120131-128x128.jpg",
"width": 128,
"mimeType": "image/jpeg",
"height": 128
}
},
"publishDate": 1462480073,
"modified": 1522941218,
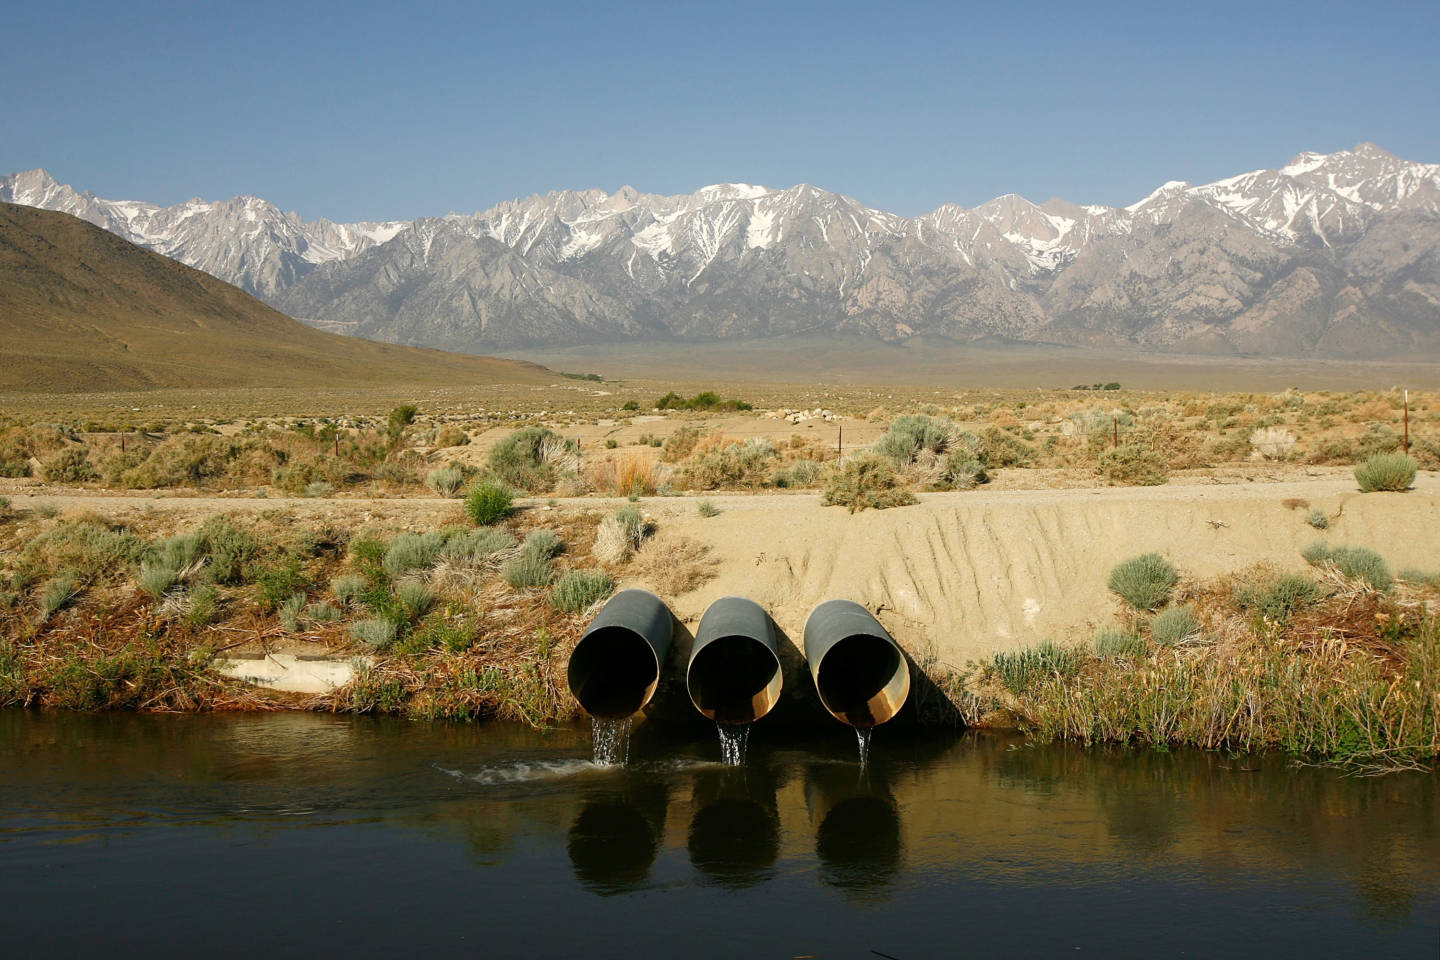
"caption": "Californians depend on the Sierra snowpack for about a third of their water supply. ",
"description": "Californians depend on the Sierra snowpack for about a third of their water supply.",
"title": "California Agriculture Faces Challenges As Drought Continues",
"credit": "David McNew/Getty Images",
"status": "inherit",
"isLoading": false,
"fetchFailed": false
},
"science_679023": {
"type": "attachments",
"id": "science_679023",
"meta": {
"index": "attachments_1716263798",
"site": "science",
"id": "679023",
"found": true
},
"parent": 679017,
"imgSizes": {
"twentyfourteen-full-width": {
"file": "https://ww2.kqed.org/app/uploads/sites/35/2016/05/LaNina-Jet-Wintertime-Pattern-small-1038x576.jpeg",
"width": 1038,
"mimeType": "image/jpeg",
"height": 576
},
"thumbnail": {
"file": "https://ww2.kqed.org/app/uploads/sites/35/2016/05/LaNina-Jet-Wintertime-Pattern-small-400x211.jpeg",
"width": 400,
"mimeType": "image/jpeg",
"height": 211
},
"fd-sm": {
"file": "https://ww2.kqed.org/app/uploads/sites/35/2016/05/LaNina-Jet-Wintertime-Pattern-small-960x507.jpeg",
"width": 960,
"mimeType": "image/jpeg",
"height": 507
},
"post-thumbnail": {
"file": "https://ww2.kqed.org/app/uploads/sites/35/2016/05/LaNina-Jet-Wintertime-Pattern-small-672x372.jpeg",
"width": 672,
"mimeType": "image/jpeg",
"height": 372
},
"kqedFullSize": {
"file": "https://ww2.kqed.org/app/uploads/sites/35/2016/05/LaNina-Jet-Wintertime-Pattern-small.jpeg",
"width": 2051,
"height": 1084
},
"large": {
"file": "https://ww2.kqed.org/app/uploads/sites/35/2016/05/LaNina-Jet-Wintertime-Pattern-small-1440x761.jpeg",
"width": 1440,
"mimeType": "image/jpeg",
"height": 761
},
"guest-author-96": {
"file": "https://ww2.kqed.org/app/uploads/sites/35/2016/05/LaNina-Jet-Wintertime-Pattern-small-96x96.jpeg",
"width": 96,
"mimeType": "image/jpeg",
"height": 96
},
"medium": {
"file": "https://ww2.kqed.org/app/uploads/sites/35/2016/05/LaNina-Jet-Wintertime-Pattern-small-800x423.jpeg",
"width": 800,
"mimeType": "image/jpeg",
"height": 423
},
"guest-author-64": {
"file": "https://ww2.kqed.org/app/uploads/sites/35/2016/05/LaNina-Jet-Wintertime-Pattern-small-64x64.jpeg",
"width": 64,
"mimeType": "image/jpeg",
"height": 64
},
"guest-author-32": {
"file": "https://ww2.kqed.org/app/uploads/sites/35/2016/05/LaNina-Jet-Wintertime-Pattern-small-32x32.jpeg",
"width": 32,
"mimeType": "image/jpeg",
"height": 32
},
"fd-lrg": {
"file": "https://ww2.kqed.org/app/uploads/sites/35/2016/05/LaNina-Jet-Wintertime-Pattern-small-1920x1015.jpeg",
"width": 1920,
"mimeType": "image/jpeg",
"height": 1015
},
"fd-med": {
"file": "https://ww2.kqed.org/app/uploads/sites/35/2016/05/LaNina-Jet-Wintertime-Pattern-small-1180x624.jpeg",
"width": 1180,
"mimeType": "image/jpeg",
"height": 624
},
"detail": {
"file": "https://ww2.kqed.org/app/uploads/sites/35/2016/05/LaNina-Jet-Wintertime-Pattern-small-150x150.jpeg",
"width": 150,
"mimeType": "image/jpeg",
"height": 150
},
"medium_large": {
"file": "https://ww2.kqed.org/app/uploads/sites/35/2016/05/LaNina-Jet-Wintertime-Pattern-small-768x406.jpeg",
"width": 768,
"mimeType": "image/jpeg",
"height": 406
},
"guest-author-128": {
"file": "https://ww2.kqed.org/app/uploads/sites/35/2016/05/LaNina-Jet-Wintertime-Pattern-small-128x128.jpeg",
"width": 128,
"mimeType": "image/jpeg",
"height": 128
}
},
"publishDate": 1462471694,
"modified": 1462471714,
"caption": "This image shows \"typical\" conditions during La Niña in North America, indicating that wet conditions sometimes result in Northern California.",
"description": null,
"title": "LaNina-Jet-Wintertime-Pattern-small",
"credit": "National Weather Service",
"status": "inherit",
"isLoading": false,
"fetchFailed": false
},
"science_675101": {
"type": "attachments",
"id": "science_675101",
"meta": {
"index": "attachments_1716263798",
"site": "science",
"id": "675101",
"found": true
},
"parent": 674987,
"imgSizes": {
"twentyfourteen-full-width": {
"file": "https://ww2.kqed.org/app/uploads/sites/35/2016/05/SonomaFlood_4694-1038x576.jpeg",
"width": 1038,
"mimeType": "image/jpeg",
"height": 576
},
"thumbnail": {
"file": "https://ww2.kqed.org/app/uploads/sites/35/2016/05/SonomaFlood_4694-400x300.jpeg",
"width": 400,
"mimeType": "image/jpeg",
"height": 300
},
"fd-sm": {
"file": "https://ww2.kqed.org/app/uploads/sites/35/2016/05/SonomaFlood_4694-960x720.jpeg",
"width": 960,
"mimeType": "image/jpeg",
"height": 720
},
"post-thumbnail": {
"file": "https://ww2.kqed.org/app/uploads/sites/35/2016/05/SonomaFlood_4694-672x372.jpeg",
"width": 672,
"mimeType": "image/jpeg",
"height": 372
},
"kqedFullSize": {
"file": "https://ww2.kqed.org/app/uploads/sites/35/2016/05/SonomaFlood_4694.jpeg",
"width": 1632,
"height": 1224
},
"large": {
"file": "https://ww2.kqed.org/app/uploads/sites/35/2016/05/SonomaFlood_4694-1440x1080.jpeg",
"width": 1440,
"mimeType": "image/jpeg",
"height": 1080
},
"guest-author-96": {
"file": "https://ww2.kqed.org/app/uploads/sites/35/2016/05/SonomaFlood_4694-96x96.jpeg",
"width": 96,
"mimeType": "image/jpeg",
"height": 96
},
"medium": {
"file": "https://ww2.kqed.org/app/uploads/sites/35/2016/05/SonomaFlood_4694-800x600.jpeg",
"width": 800,
"mimeType": "image/jpeg",
"height": 600
},
"guest-author-64": {
"file": "https://ww2.kqed.org/app/uploads/sites/35/2016/05/SonomaFlood_4694-64x64.jpeg",
"width": 64,
"mimeType": "image/jpeg",
"height": 64
},
"guest-author-32": {
"file": "https://ww2.kqed.org/app/uploads/sites/35/2016/05/SonomaFlood_4694-32x32.jpeg",
"width": 32,
"mimeType": "image/jpeg",
"height": 32
},
"fd-med": {
"file": "https://ww2.kqed.org/app/uploads/sites/35/2016/05/SonomaFlood_4694-1180x885.jpeg",
"width": 1180,
"mimeType": "image/jpeg",
"height": 885
},
"detail": {
"file": "https://ww2.kqed.org/app/uploads/sites/35/2016/05/SonomaFlood_4694-150x150.jpeg",
"width": 150,
"mimeType": "image/jpeg",
"height": 150
},
"medium_large": {
"file": "https://ww2.kqed.org/app/uploads/sites/35/2016/05/SonomaFlood_4694-768x576.jpeg",
"width": 768,
"mimeType": "image/jpeg",
"height": 576
},
"guest-author-128": {
"file": "https://ww2.kqed.org/app/uploads/sites/35/2016/05/SonomaFlood_4694-128x128.jpeg",
"width": 128,
"mimeType": "image/jpeg",
"height": 128
}
},
"publishDate": 1462310058,
"modified": 1462310128,
"caption": "A wet March helped boost water conservation, especially in Northern California.",
"description": "A wet March helped boost water conservation, especially in Northern California.",
"title": "SonomaFlood_4694",
"credit": "Craig Miller/KQED",
"status": "inherit",
"isLoading": false,
"fetchFailed": false
},
"science_674811": {
"type": "attachments",
"id": "science_674811",
"meta": {
"index": "attachments_1716263798",
"site": "science",
"id": "674811",
"found": true
},
"parent": 674809,
"imgSizes": {
"thumbnail": {
"file": "https://ww2.kqed.org/app/uploads/sites/35/2016/05/climate-Central_fish_image-400x225.jpg",
"width": 400,
"mimeType": "image/jpeg",
"height": 225
},
"post-thumbnail": {
"file": "https://ww2.kqed.org/app/uploads/sites/35/2016/05/climate-Central_fish_image-672x372.jpg",
"width": 672,
"mimeType": "image/jpeg",
"height": 372
},
"kqedFullSize": {
"file": "https://ww2.kqed.org/app/uploads/sites/35/2016/05/climate-Central_fish_image.jpg",
"width": 720,
"height": 405
},
"guest-author-96": {
"file": "https://ww2.kqed.org/app/uploads/sites/35/2016/05/climate-Central_fish_image-96x96.jpg",
"width": 96,
"mimeType": "image/jpeg",
"height": 96
},
"guest-author-64": {
"file": "https://ww2.kqed.org/app/uploads/sites/35/2016/05/climate-Central_fish_image-64x64.jpg",
"width": 64,
"mimeType": "image/jpeg",
"height": 64
},
"detail": {
"file": "https://ww2.kqed.org/app/uploads/sites/35/2016/05/climate-Central_fish_image-150x150.jpg",
"width": 150,
"mimeType": "image/jpeg",
"height": 150
},
"guest-author-32": {
"file": "https://ww2.kqed.org/app/uploads/sites/35/2016/05/climate-Central_fish_image-32x32.jpg",
"width": 32,
"mimeType": "image/jpeg",
"height": 32
},
"guest-author-128": {
"file": "https://ww2.kqed.org/app/uploads/sites/35/2016/05/climate-Central_fish_image-128x128.jpg",
"width": 128,
"mimeType": "image/jpeg",
"height": 128
}
},
"publishDate": 1462297970,
"modified": 1462297988,
"caption": "Cowcod are recovering from overfishing off the southern California coast, but oxygen declines threaten their revival.\n",
"description": null,
"title": "climate Central_fish_image",
"credit": "John Butler/NOAA",
"status": "inherit",
"isLoading": false,
"fetchFailed": false
},
"science_662890": {
"type": "attachments",
"id": "science_662890",
"meta": {
"index": "attachments_1716263798",
"site": "science",
"id": "662890",
"found": true
},
"parent": 662813,
"imgSizes": {
"twentyfourteen-full-width": {
"file": "https://ww2.kqed.org/app/uploads/sites/35/2016/04/indoor-heater-1038x576.jpg",
"width": 1038,
"mimeType": "image/jpeg",
"height": 576
},
"thumbnail": {
"file": "https://ww2.kqed.org/app/uploads/sites/35/2016/04/indoor-heater-400x267.jpg",
"width": 400,
"mimeType": "image/jpeg",
"height": 267
},
"fd-sm": {
"file": "https://ww2.kqed.org/app/uploads/sites/35/2016/04/indoor-heater-960x640.jpg",
"width": 960,
"mimeType": "image/jpeg",
"height": 640
},
"post-thumbnail": {
"file": "https://ww2.kqed.org/app/uploads/sites/35/2016/04/indoor-heater-672x372.jpg",
"width": 672,
"mimeType": "image/jpeg",
"height": 372
},
"kqedFullSize": {
"file": "https://ww2.kqed.org/app/uploads/sites/35/2016/04/indoor-heater.jpg",
"width": 2048,
"height": 1365
},
"large": {
"file": "https://ww2.kqed.org/app/uploads/sites/35/2016/04/indoor-heater-1440x960.jpg",
"width": 1440,
"mimeType": "image/jpeg",
"height": 960
},
"guest-author-96": {
"file": "https://ww2.kqed.org/app/uploads/sites/35/2016/04/indoor-heater-96x96.jpg",
"width": 96,
"mimeType": "image/jpeg",
"height": 96
},
"medium": {
"file": "https://ww2.kqed.org/app/uploads/sites/35/2016/04/indoor-heater-800x533.jpg",
"width": 800,
"mimeType": "image/jpeg",
"height": 533
},
"guest-author-64": {
"file": "https://ww2.kqed.org/app/uploads/sites/35/2016/04/indoor-heater-64x64.jpg",
"width": 64,
"mimeType": "image/jpeg",
"height": 64
},
"guest-author-32": {
"file": "https://ww2.kqed.org/app/uploads/sites/35/2016/04/indoor-heater-32x32.jpg",
"width": 32,
"mimeType": "image/jpeg",
"height": 32
},
"fd-lrg": {
"file": "https://ww2.kqed.org/app/uploads/sites/35/2016/04/indoor-heater-1920x1280.jpg",
"width": 1920,
"mimeType": "image/jpeg",
"height": 1280
},
"fd-med": {
"file": "https://ww2.kqed.org/app/uploads/sites/35/2016/04/indoor-heater-1180x786.jpg",
"width": 1180,
"mimeType": "image/jpeg",
"height": 786
},
"detail": {
"file": "https://ww2.kqed.org/app/uploads/sites/35/2016/04/indoor-heater-150x150.jpg",
"width": 150,
"mimeType": "image/jpeg",
"height": 150
},
"medium_large": {
"file": "https://ww2.kqed.org/app/uploads/sites/35/2016/04/indoor-heater-768x512.jpg",
"width": 768,
"mimeType": "image/jpeg",
"height": 512
},
"guest-author-128": {
"file": "https://ww2.kqed.org/app/uploads/sites/35/2016/04/indoor-heater-128x128.jpg",
"width": 128,
"mimeType": "image/jpeg",
"height": 128
}
},
"publishDate": 1461777969,
"modified": 1461778366,
"caption": "Heating demand in February was 17 percent below normal and March was 26 percent below normal when compared to the previous 10 winter average in the U.S.",
"description": null,
"title": "indoor heater",
"credit": "\u003ca href=\"https://www.flickr.com/photos/126594334@N02/14957861355/in/photolist-oMLX4i-6Znz8Q-o5XGki-9BjaoS-edRn53-9tiWfs-6Znzo7-zveSp-5Tzb3X-e29C1K-72b2gv-5TDwGb-7xrK4b-AWjFj-9nmNi6-8AXChG-5DJCTW-fPBV3r-5QsFtU-5C59DL-4JEUmS-5QsF5N-bkc7YE-KJp9Z-9eeXp-2c5T4-9Ekxrv-kyrrc4-5aHuoV-5Qop32-RmYBX-6Znzgj-5DwBWV-tKAWC-b9ZswB-fiLPyL-4iZTHK-dVT6jB-rTtqb-8vVjuh-gp454G-ejWMSq-4JEUk9-dFnb4w-9iRcPY-wxZFA-7iNaxU-h5bvf-bB1zGH-wxZFy\">Nick Rhyder\u003c/a>/flickr",
"status": "inherit",
"isLoading": false,
"fetchFailed": false
},
"science_654306": {
"type": "attachments",
"id": "science_654306",
"meta": {
"index": "attachments_1716263798",
"site": "science",
"id": "654306",
"found": true
},
"parent": 0,
"imgSizes": {
"twentyfourteen-full-width": {
"file": "https://ww2.kqed.org/app/uploads/sites/35/2016/04/hot-day_web-1038x576.jpg",
"width": 1038,
"mimeType": "image/jpeg",
"height": 576
},
"thumbnail": {
"file": "https://ww2.kqed.org/app/uploads/sites/35/2016/04/hot-day_web-400x210.jpg",
"width": 400,
"mimeType": "image/jpeg",
"height": 210
},
"fd-sm": {
"file": "https://ww2.kqed.org/app/uploads/sites/35/2016/04/hot-day_web-960x504.jpg",
"width": 960,
"mimeType": "image/jpeg",
"height": 504
},
"post-thumbnail": {
"file": "https://ww2.kqed.org/app/uploads/sites/35/2016/04/hot-day_web-672x372.jpg",
"width": 672,
"mimeType": "image/jpeg",
"height": 372
},
"kqedFullSize": {
"file": "https://ww2.kqed.org/app/uploads/sites/35/2016/04/hot-day_web.jpg",
"width": 1600,
"height": 840
},
"large": {
"file": "https://ww2.kqed.org/app/uploads/sites/35/2016/04/hot-day_web-1440x756.jpg",
"width": 1440,
"mimeType": "image/jpeg",
"height": 756
},
"guest-author-96": {
"file": "https://ww2.kqed.org/app/uploads/sites/35/2016/04/hot-day_web-96x96.jpg",
"width": 96,
"mimeType": "image/jpeg",
"height": 96
},
"medium": {
"file": "https://ww2.kqed.org/app/uploads/sites/35/2016/04/hot-day_web-800x420.jpg",
"width": 800,
"mimeType": "image/jpeg",
"height": 420
},
"guest-author-64": {
"file": "https://ww2.kqed.org/app/uploads/sites/35/2016/04/hot-day_web-64x64.jpg",
"width": 64,
"mimeType": "image/jpeg",
"height": 64
},
"guest-author-32": {
"file": "https://ww2.kqed.org/app/uploads/sites/35/2016/04/hot-day_web-32x32.jpg",
"width": 32,
"mimeType": "image/jpeg",
"height": 32
},
"fd-med": {
"file": "https://ww2.kqed.org/app/uploads/sites/35/2016/04/hot-day_web-1180x620.jpg",
"width": 1180,
"mimeType": "image/jpeg",
"height": 620
},
"detail": {
"file": "https://ww2.kqed.org/app/uploads/sites/35/2016/04/hot-day_web-75x75.jpg",
"width": 75,
"mimeType": "image/jpeg",
"height": 75
},
"medium_large": {
"file": "https://ww2.kqed.org/app/uploads/sites/35/2016/04/hot-day_web-768x403.jpg",
"width": 768,
"mimeType": "image/jpeg",
"height": 403
},
"guest-author-128": {
"file": "https://ww2.kqed.org/app/uploads/sites/35/2016/04/hot-day_web-128x128.jpg",
"width": 128,
"mimeType": "image/jpeg",
"height": 128
}
},
"publishDate": 1461349490,
"modified": 1461349825,
"caption": "California's average annual temperature has increased 2.4°C since the first Earth Day in 1970.",
"description": null,
"title": "hot day_web",
"credit": "Kylie Jaxxon/flickr",
"status": "inherit",
"isLoading": false,
"fetchFailed": false
},
"science_650654": {
"type": "attachments",
"id": "science_650654",
"meta": {
"index": "attachments_1716263798",
"site": "science",
"id": "650654",
"found": true
},
"parent": 650571,
"imgSizes": {
"twentyfourteen-full-width": {
"file": "https://ww2.kqed.org/app/uploads/sites/35/2016/04/drought_car-1038x576.jpg",
"width": 1038,
"mimeType": "image/jpeg",
"height": 576
},
"thumbnail": {
"file": "https://ww2.kqed.org/app/uploads/sites/35/2016/04/drought_car-400x269.jpg",
"width": 400,
"mimeType": "image/jpeg",
"height": 269
},
"fd-sm": {
"file": "https://ww2.kqed.org/app/uploads/sites/35/2016/04/drought_car-960x645.jpg",
"width": 960,
"mimeType": "image/jpeg",
"height": 645
},
"post-thumbnail": {
"file": "https://ww2.kqed.org/app/uploads/sites/35/2016/04/drought_car-672x372.jpg",
"width": 672,
"mimeType": "image/jpeg",
"height": 372
},
"kqedFullSize": {
"file": "https://ww2.kqed.org/app/uploads/sites/35/2016/04/drought_car.jpg",
"width": 3000,
"height": 2015
},
"large": {
"file": "https://ww2.kqed.org/app/uploads/sites/35/2016/04/drought_car-1440x967.jpg",
"width": 1440,
"mimeType": "image/jpeg",
"height": 967
},
"guest-author-96": {
"file": "https://ww2.kqed.org/app/uploads/sites/35/2016/04/drought_car-96x96.jpg",
"width": 96,
"mimeType": "image/jpeg",
"height": 96
},
"medium": {
"file": "https://ww2.kqed.org/app/uploads/sites/35/2016/04/drought_car-800x537.jpg",
"width": 800,
"mimeType": "image/jpeg",
"height": 537
},
"guest-author-64": {
"file": "https://ww2.kqed.org/app/uploads/sites/35/2016/04/drought_car-64x64.jpg",
"width": 64,
"mimeType": "image/jpeg",
"height": 64
},
"guest-author-32": {
"file": "https://ww2.kqed.org/app/uploads/sites/35/2016/04/drought_car-32x32.jpg",
"width": 32,
"mimeType": "image/jpeg",
"height": 32
},
"fd-lrg": {
"file": "https://ww2.kqed.org/app/uploads/sites/35/2016/04/drought_car-1920x1290.jpg",
"width": 1920,
"mimeType": "image/jpeg",
"height": 1290
},
"fd-med": {
"file": "https://ww2.kqed.org/app/uploads/sites/35/2016/04/drought_car-1180x793.jpg",
"width": 1180,
"mimeType": "image/jpeg",
"height": 793
},
"detail": {
"file": "https://ww2.kqed.org/app/uploads/sites/35/2016/04/drought_car-75x75.jpg",
"width": 75,
"mimeType": "image/jpeg",
"height": 75
},
"medium_large": {
"file": "https://ww2.kqed.org/app/uploads/sites/35/2016/04/drought_car-768x516.jpg",
"width": 768,
"mimeType": "image/jpeg",
"height": 516
},
"guest-author-128": {
"file": "https://ww2.kqed.org/app/uploads/sites/35/2016/04/drought_car-128x128.jpg",
"width": 128,
"mimeType": "image/jpeg",
"height": 128
}
},
"publishDate": 1461176586,
"modified": 1520096323,
"caption": "A car sits in dried and cracked earth of what was the bottom of the Almaden Reservoir on January 28, 2014 in San Jose, California. ",
"description": null,
"title": "California Drought Dries Up Bay Area Reservoirs",
"credit": "Justin Sullivan/ Getty Images",
"status": "inherit",
"isLoading": false,
"fetchFailed": false
},
"science_650569": {
"type": "attachments",
"id": "science_650569",
"meta": {
"index": "attachments_1716263798",
"site": "science",
"id": "650569",
"found": true
},
"parent": 650562,
"imgSizes": {
"twentyfourteen-full-width": {
"file": "https://ww2.kqed.org/app/uploads/sites/35/2016/04/Dolores-Park-1038x576.jpg",
"width": 1038,
"mimeType": "image/jpeg",
"height": 576
},
"thumbnail": {
"file": "https://ww2.kqed.org/app/uploads/sites/35/2016/04/Dolores-Park-400x200.jpg",
"width": 400,
"mimeType": "image/jpeg",
"height": 200
},
"fd-sm": {
"file": "https://ww2.kqed.org/app/uploads/sites/35/2016/04/Dolores-Park-960x480.jpg",
"width": 960,
"mimeType": "image/jpeg",
"height": 480
},
"post-thumbnail": {
"file": "https://ww2.kqed.org/app/uploads/sites/35/2016/04/Dolores-Park-672x372.jpg",
"width": 672,
"mimeType": "image/jpeg",
"height": 372
},
"kqedFullSize": {
"file": "https://ww2.kqed.org/app/uploads/sites/35/2016/04/Dolores-Park.jpg",
"width": 2800,
"height": 1400
},
"large": {
"file": "https://ww2.kqed.org/app/uploads/sites/35/2016/04/Dolores-Park-1440x720.jpg",
"width": 1440,
"mimeType": "image/jpeg",
"height": 720
},
"guest-author-96": {
"file": "https://ww2.kqed.org/app/uploads/sites/35/2016/04/Dolores-Park-96x96.jpg",
"width": 96,
"mimeType": "image/jpeg",
"height": 96
},
"medium": {
"file": "https://ww2.kqed.org/app/uploads/sites/35/2016/04/Dolores-Park-800x400.jpg",
"width": 800,
"mimeType": "image/jpeg",
"height": 400
},
"guest-author-64": {
"file": "https://ww2.kqed.org/app/uploads/sites/35/2016/04/Dolores-Park-64x64.jpg",
"width": 64,
"mimeType": "image/jpeg",
"height": 64
},
"guest-author-32": {
"file": "https://ww2.kqed.org/app/uploads/sites/35/2016/04/Dolores-Park-32x32.jpg",
"width": 32,
"mimeType": "image/jpeg",
"height": 32
},
"fd-lrg": {
"file": "https://ww2.kqed.org/app/uploads/sites/35/2016/04/Dolores-Park-1920x960.jpg",
"width": 1920,
"mimeType": "image/jpeg",
"height": 960
},
"fd-med": {
"file": "https://ww2.kqed.org/app/uploads/sites/35/2016/04/Dolores-Park-1180x590.jpg",
"width": 1180,
"mimeType": "image/jpeg",
"height": 590
},
"detail": {
"file": "https://ww2.kqed.org/app/uploads/sites/35/2016/04/Dolores-Park-75x75.jpg",
"width": 75,
"mimeType": "image/jpeg",
"height": 75
},
"medium_large": {
"file": "https://ww2.kqed.org/app/uploads/sites/35/2016/04/Dolores-Park-768x384.jpg",
"width": 768,
"mimeType": "image/jpeg",
"height": 384
},
"guest-author-128": {
"file": "https://ww2.kqed.org/app/uploads/sites/35/2016/04/Dolores-Park-128x128.jpg",
"width": 128,
"mimeType": "image/jpeg",
"height": 128
}
},
"publishDate": 1461174666,
"modified": 1461174729,
"caption": "During sunny days in the Mission, San Francisco residents flock to Dolores Park.",
"description": null,
"title": "Dolores Park",
"credit": "Meetup",
"status": "inherit",
"isLoading": false,
"fetchFailed": false
}
},
"audioPlayerReducer": {
"postId": "stream_live",
"isPaused": true,
"isPlaying": false,
"pfsActive": false,
"pledgeModalIsOpen": true,
"playerDrawerIsOpen": false,
"liveAudioPlayStartedAt": 0,
"liveAudioPlayContext": ""
},
"authorsReducer": {
"byline_science_725648": {
"type": "authors",
"id": "byline_science_725648",
"meta": {
"override": true
},
"slug": "byline_science_725648",
"name": "\u003ca href=\"https://www.climatecentral.org/what-we-do/people/brian-kahn\" target=\"_blank\">Brian Kahn\u003c/a>\u003c/br>\u003ca href=\"https://www.climatecentral.org/\" target=\"_blank\">Climate Central\u003c/a>",
"isLoading": false
},
"byline_science_679017": {
"type": "authors",
"id": "byline_science_679017",
"meta": {
"override": true
},
"slug": "byline_science_679017",
"name": "Matt Weiser\u003c/br>Water Deeply",
"isLoading": false
},
"byline_science_674809": {
"type": "authors",
"id": "byline_science_674809",
"meta": {
"override": true
},
"slug": "byline_science_674809",
"name": "\u003ca href=\"http://www.climatecentral.org/\" target=\"_blank\">John Upton\u003c/a>\u003cbr>\u003ca href=\"http://www.climatecentral.org/\" target=\"_blank\">Climate Central\u003c/a>",
"isLoading": false
},
"byline_science_662813": {
"type": "authors",
"id": "byline_science_662813",
"meta": {
"override": true
},
"slug": "byline_science_662813",
"name": "\u003ca href=\"http://www.climatecentral.org/what-we-do/people/bobby-magill\" target=\"_blank\">Bobby Magill\u003c/a>\u003c/br>\u003ca href=\"http://www.climatecentral.org/\" target=\"_blank\">Climate Central\u003c/a>",
"isLoading": false
},
"byline_science_654227": {
"type": "authors",
"id": "byline_science_654227",
"meta": {
"override": true
},
"slug": "byline_science_654227",
"name": "Climate Central",
"isLoading": false
},
"byline_science_650571": {
"type": "authors",
"id": "byline_science_650571",
"meta": {
"override": true
},
"slug": "byline_science_650571",
"name": "Climate Central",
"isLoading": false
},
"byline_science_650562": {
"type": "authors",
"id": "byline_science_650562",
"meta": {
"override": true
},
"slug": "byline_science_650562",
"name": "Christopher Joyce\u003c/br>NPR",
"isLoading": false
},
"cmiller": {
"type": "authors",
"id": "221",
"meta": {
"index": "authors_1716337520",
"id": "221",
"found": true
},
"name": "Craig Miller",
"firstName": "Craig",
"lastName": "Miller",
"slug": "cmiller",
"email": "craig@voxterra.net",
"display_author_email": false,
"staff_mastheads": [
"science"
],
"title": "Editor Emeritus, Science",
"bio": "Craig is a former KQED Science editor, specializing in weather, climate, water & energy issues, with a little seismology thrown in just to shake things up. Prior to that, he launched and led the station's award-winning multimedia project, Climate Watch. Craig is also an accomplished writer/producer of television documentaries, with a focus on natural resource issues.",
"avatar": "https://secure.gravatar.com/avatar/b91661df645e001a9cafe0861fa685f9?s=600&d=blank&r=g",
"twitter": "voxterra",
"facebook": null,
"instagram": null,
"linkedin": null,
"sites": [
{
"site": "news",
"roles": [
"author"
]
},
{
"site": "futureofyou",
"roles": [
"editor"
]
},
{
"site": "stateofhealth",
"roles": [
"author"
]
},
{
"site": "science",
"roles": [
"editor"
]
},
{
"site": "quest",
"roles": [
"editor"
]
}
],
"headData": {
"title": "Craig Miller | KQED",
"description": "Editor Emeritus, Science",
"ogImgSrc": "https://secure.gravatar.com/avatar/b91661df645e001a9cafe0861fa685f9?s=600&d=blank&r=g",
"twImgSrc": "https://secure.gravatar.com/avatar/b91661df645e001a9cafe0861fa685f9?s=600&d=blank&r=g"
},
"isLoading": false,
"link": "/author/cmiller"
},
"laurensommer": {
"type": "authors",
"id": "239",
"meta": {
"index": "authors_1716337520",
"id": "239",
"found": true
},
"name": "Lauren Sommer",
"firstName": "Lauren",
"lastName": "Sommer",
"slug": "laurensommer",
"email": "lsommer@kqed.org",
"display_author_email": false,
"staff_mastheads": [],
"title": "KQED Contributor",
"bio": "Lauren is a radio reporter formerly covering environment, water, and energy for KQED Science. As part of her day job, she has scaled Sierra Nevada peaks, run from charging elephant seals, and desperately tried to get her sea legs - all in pursuit of good radio. Her work has appeared on Marketplace, Living on Earth, Science Friday and NPR's Morning Edition and All Things Considered. You can find her on Twitter at \u003ca href=\"https://twitter.com/lesommer\">@lesommer\u003c/a>.",
"avatar": "https://secure.gravatar.com/avatar/33aa3772bb86c6ad45b8aca6a238bbdf?s=600&d=blank&r=g",
"twitter": null,
"facebook": null,
"instagram": null,
"linkedin": null,
"sites": [
{
"site": "news",
"roles": [
"author"
]
},
{
"site": "science",
"roles": [
"editor",
"manage_content_types",
"manage_taxonomies"
]
},
{
"site": "quest",
"roles": [
"editor"
]
}
],
"headData": {
"title": "Lauren Sommer | KQED",
"description": "KQED Contributor",
"ogImgSrc": "https://secure.gravatar.com/avatar/33aa3772bb86c6ad45b8aca6a238bbdf?s=600&d=blank&r=g",
"twImgSrc": "https://secure.gravatar.com/avatar/33aa3772bb86c6ad45b8aca6a238bbdf?s=600&d=blank&r=g"
},
"isLoading": false,
"link": "/author/laurensommer"
}
},
"pagesReducer": {
"science_category_climate": {
"type": "terms",
"id": "science_31",
"meta": {
"index": "terms_1716263798",
"site": "science",
"id": "31",
"score": 11.061988
},
"featImg": null,
"name": "Climate",
"description": null,
"taxonomy": "category",
"headData": {
"twImgId": null,
"twTitle": null,
"ogTitle": null,
"ogImgId": null,
"twDescription": null,
"description": null,
"title": "Climate Archives | KQED Science",
"ogDescription": null
},
"ttid": 33,
"slug": "climate",
"isLoading": false,
"title": "Climate",
"pageMeta": {
"site": "science",
"WpPageTemplate": "page-topic-editorial",
"currentPage": 100
},
"blocks": [
{
"blockName": "kqed/post-list",
"attrs": {
"layout": "cardArticle2",
"query": "posts/science?category=climate",
"seeMore": false,
"paginated": true,
"page": 100
}
},
{
"blockName": "kqed/ad"
}
]
}
},
"pfsSessionReducer": {},
"postsReducer": {
"stream_live": {
"type": "live",
"id": "stream_live",
"audioUrl": "https://streams.kqed.org/kqedradio",
"title": "Live Stream",
"excerpt": "Live Stream information currently unavailable.",
"link": "/radio",
"featImg": "",
"label": {
"name": "KQED Live",
"link": "/"
}
},
"stream_kqedNewscast": {
"type": "posts",
"id": "stream_kqedNewscast",
"audioUrl": "https://www.kqed.org/.stream/anon/radio/RDnews/newscast.mp3?_=1",
"title": "KQED Newscast",
"featImg": "",
"label": {
"name": "88.5 FM",
"link": "/"
}
},
"science_725648": {
"type": "posts",
"id": "science_725648",
"meta": {
"index": "posts_1716263798",
"site": "science",
"id": "725648",
"score": null,
"sort": [
1464202420000
]
},
"parent": 0,
"labelTerm": {},
"blocks": [],
"publishDate": 1464202420,
"format": "standard",
"title": "Climate Change Is the National Parks’ Biggest Challenge",
"headTitle": "Climate Change Is the National Parks’ Biggest Challenge | KQED",
"content": "\u003cp>To say Teddy Roosevelt was a wise man is an understatement. At the turn of the 20th century, in a time of rapidly increasing industrialization and the rapacious plundering of the natural world, Roosevelt got it.\u003c/p>\n\u003cp>The giant sequoias tucked away in the folds of California’s Sierra Nevada mountains could have been a source for millions of wood planks. Instead, they’re the source of millions of memories and a reflection on what it means to be human, thanks to efforts of conservationists, including Roosevelt, more than a century ago.\u003c/p>\n\u003cp>The coarse-grained wood encased within the sequoias’ burnt orange trunks tells a history that stretches well beyond our individual lifespans. These trees have lived through the birth of Christ, the Spanish settlement of the U.S., and the California gold rush.\u003c/p>\n\u003cp>Staring up from their gnarly base to their bushy crowns nearly 300 feet above the forest floor is to share a sense of wonder experienced by generations. It’s impossible not to be awed by their size — after all they’re among the largest living things on the planet.\u003c/p>\n\u003cp>Read \u003ca href=\"http://reports.climatecentral.org/nps/overview/\">the full story\u003c/a> at Climate Central.\u003c/p>\n\u003cp>[ad fullwidth]\u003c/p>\u003cp>\u003c/p>\n",
"stats": {
"hasVideo": false,
"hasChartOrMap": false,
"hasAudio": false,
"hasPolis": false,
"wordCount": 197,
"hasGoogleForm": false,
"hasGallery": false,
"hasHearkenModule": false,
"iframeSrcs": [],
"paragraphCount": 7
},
"modified": 1704930142,
"excerpt": "How the National Parks Service responds to climate change today will shape the next century for its parks.",
"headData": {
"twImgId": "",
"twTitle": "",
"ogTitle": "",
"ogImgId": "",
"twDescription": "",
"description": "How the National Parks Service responds to climate change today will shape the next century for its parks.",
"title": "Climate Change Is the National Parks’ Biggest Challenge | KQED",
"ogDescription": "",
"schema": {
"@context": "https://schema.org",
"@type": "Article",
"headline": "Climate Change Is the National Parks’ Biggest Challenge",
"datePublished": "2016-05-25T11:53:40-07:00",
"dateModified": "2024-01-10T15:42:22-08:00",
"image": "https://cdn.kqed.org/wp-content/uploads/2020/02/KQED-OG-Image@1x.png"
}
},
"guestAuthors": [],
"slug": "climate-change-is-the-national-parks-biggest-challenge",
"status": "publish",
"sourceUrl": "http://www.climatecentral.org/",
"nprByline": "\u003ca href=\"https://www.climatecentral.org/what-we-do/people/brian-kahn\" target=\"_blank\">Brian Kahn\u003c/a>\u003c/br>\u003ca href=\"https://www.climatecentral.org/\" target=\"_blank\">Climate Central\u003c/a>",
"sticky": false,
"source": "Climate Central",
"path": "/science/725648/climate-change-is-the-national-parks-biggest-challenge",
"audioTrackLength": null,
"parsedContent": [
{
"type": "contentString",
"content": "\u003cdiv class=\"post-body\">\u003cp>\u003cp>To say Teddy Roosevelt was a wise man is an understatement. At the turn of the 20th century, in a time of rapidly increasing industrialization and the rapacious plundering of the natural world, Roosevelt got it.\u003c/p>\n\u003cp>The giant sequoias tucked away in the folds of California’s Sierra Nevada mountains could have been a source for millions of wood planks. Instead, they’re the source of millions of memories and a reflection on what it means to be human, thanks to efforts of conservationists, including Roosevelt, more than a century ago.\u003c/p>\n\u003cp>The coarse-grained wood encased within the sequoias’ burnt orange trunks tells a history that stretches well beyond our individual lifespans. These trees have lived through the birth of Christ, the Spanish settlement of the U.S., and the California gold rush.\u003c/p>\n\u003cp>Staring up from their gnarly base to their bushy crowns nearly 300 feet above the forest floor is to share a sense of wonder experienced by generations. It’s impossible not to be awed by their size — after all they’re among the largest living things on the planet.\u003c/p>\n\u003cp>Read \u003ca href=\"http://reports.climatecentral.org/nps/overview/\">the full story\u003c/a> at Climate Central.\u003c/p>\n\u003cp>\u003c/p>\u003c/div>",
"attributes": {
"named": {},
"numeric": []
}
},
{
"type": "component",
"content": "",
"name": "ad",
"attributes": {
"named": {
"label": "fullwidth"
},
"numeric": [
"fullwidth"
]
}
},
{
"type": "contentString",
"content": "\u003cdiv class=\"post-body\">\u003cp>\u003c/p>\u003cp>\u003c/p>\n\u003c/div>\u003c/p>",
"attributes": {
"named": {},
"numeric": []
}
}
],
"link": "/science/725648/climate-change-is-the-national-parks-biggest-challenge",
"authors": [
"byline_science_725648"
],
"series": [
"science_3081"
],
"categories": [
"science_31",
"science_35",
"science_40"
],
"featImg": "science_725754",
"label": "source_science_725648"
},
"science_687703": {
"type": "posts",
"id": "science_687703",
"meta": {
"index": "posts_1716263798",
"site": "science",
"id": "687703",
"score": null,
"sort": [
1462825551000
]
},
"parent": 0,
"labelTerm": {
"site": "science",
"term": 1151
},
"blocks": [],
"publishDate": 1462825551,
"format": "standard",
"title": "California May Abandon State-Imposed Water Conservation Quotas",
"headTitle": "California May Abandon State-Imposed Water Conservation Quotas | KQED",
"content": "\u003cp>California water officials say they’re moving to scrap the system of state-imposed water conservation quotas put in place during the current drought.\u003c/p>\n\u003cp>The system resulted in a cumulative saving among urban consumers of about 24 percent compared to the benchmark year of 2013.\u003c/p>\n\u003cp>At the same time, Governor Jerry Brown issued an \u003ca href=\"https://www.gov.ca.gov/docs/5.9.16_Executive_Order.pdf\">executive order\u003c/a> that makes permanent some of the most basic prohibitions in place since 2014, such as the ban on hosing down sidewalks and watering lawns to the extent that it creates runoff or within 48 hours of any measurable rainfall.\u003c/p>\n\u003cp>“Now we know that drought is becoming a regular occurrence and water conservation must be a part of our everyday life,” Brown said in a statement.\u003c/p>\n\u003cp>The rule barring restaurants from serving water unsolicited is being lifted, however. Officials say that was always intended as more of an “awareness” measure than a way to achieve major water savings.\u003c/p>\n\u003cfigure id=\"attachment_687798\" class=\"wp-caption aligncenter\" style=\"max-width: 2000px\">\u003cimg loading=\"lazy\" decoding=\"async\" class=\"size-full wp-image-687798\" src=\"http://ww2.kqed.org/science/wp-content/uploads/sites/35/2016/05/IMG_2869.jpg\" alt=\"State officials are lifting the rule barring restaurants from serving water unless requested.\" width=\"2000\" height=\"1500\" srcset=\"https://cdn.kqed.org/wp-content/uploads/sites/35/2016/05/IMG_2869.jpg 2000w, https://cdn.kqed.org/wp-content/uploads/sites/35/2016/05/IMG_2869-400x300.jpg 400w, https://cdn.kqed.org/wp-content/uploads/sites/35/2016/05/IMG_2869-800x600.jpg 800w, https://cdn.kqed.org/wp-content/uploads/sites/35/2016/05/IMG_2869-768x576.jpg 768w, https://cdn.kqed.org/wp-content/uploads/sites/35/2016/05/IMG_2869-1440x1080.jpg 1440w, https://cdn.kqed.org/wp-content/uploads/sites/35/2016/05/IMG_2869-1920x1440.jpg 1920w, https://cdn.kqed.org/wp-content/uploads/sites/35/2016/05/IMG_2869-1180x885.jpg 1180w, https://cdn.kqed.org/wp-content/uploads/sites/35/2016/05/IMG_2869-960x720.jpg 960w\" sizes=\"(max-width: 2000px) 100vw, 2000px\">\u003cfigcaption class=\"wp-caption-text\">State officials are lifting the rule barring restaurants from serving water unless requested. \u003ccite>(Craig Miller/KQED)\u003c/cite>\u003c/figcaption>\u003c/figure>\n\u003cp>But rather than having state officials assign mandatory saving targets to local water agencies, the State Water Resources Control Board will vote next week on a plan to put conservation more firmly back in local hands. Some local water agencies had pushed back hard on the imposed-quota system, calling it unduly restrictive and tone-deaf to local conditions.\u003c/p>\n\u003cp>[ad fullwidth]\u003c/p>\n\u003cp>“What the staff is proposing here isn’t a walk in the park,” board chair Felicia Marcus told reporters in a Monday conference call. Instead, Marcus called the new plan “much more tailored to circumstances we’re in now.”\u003c/p>\n\u003cp>Those circumstances would be the much improved water conditions from a year ago, when reservoirs were scraping bottom and the \u003ca href=\"http://ww2.kqed.org/science/2016/05/06/sierra-meltdown-what-snow-we-got-is-going-fast/\">Sierra snowpack\u003c/a> was at an estimated 500-year low.\u003c/p>\n\u003cp>With conditions remaining stubbornly dry in Southern California, Mark Cowin, who heads the state’s Department of Water Resources says officials are “a long way from calling off the statewide drought.”\u003c/p>\n\u003cp>So why change the game plan now? Officials called the new proposal “a more nuanced approach” to keeping a lid on excess water use.\u003c/p>\n\u003cp>Under the staff proposal unveiled on Monday, water suppliers would set local conservation targets based on their own three-year supply projections. Those projections would be modeled on a recurrence of both the drought conditions and demand levels from 2013-14.\u003c/p>\n\u003cp>Under the governor’s executive order, local agencies will still be required to report monthly water use to the state. Marcus says the state will still be empowered to step in and “second-guess” local agencies, possibly imposing restrictions on those that don’t comply with the proposed system.\u003c/p>\n\u003cp>\u003c/p>\n\u003cp>Also on Monday, the California senate passed a bill from Jerry Hill (D-San Mateo) that would force water agencies to institute either surcharges or fines for excessive water use during a declared drought emergency. SB 814 now goes to the assembly.\u003c/p>\n\n",
"stats": {
"hasVideo": false,
"hasChartOrMap": false,
"hasAudio": false,
"hasPolis": false,
"wordCount": 505,
"hasGoogleForm": false,
"hasGallery": false,
"hasHearkenModule": false,
"iframeSrcs": [],
"paragraphCount": 15
},
"modified": 1704930203,
"excerpt": "At the same time, some basic rules for water use become permanent under a new executive order.",
"headData": {
"twImgId": "",
"twTitle": "",
"ogTitle": "",
"ogImgId": "",
"twDescription": "",
"description": "At the same time, some basic rules for water use become permanent under a new executive order.",
"title": "California May Abandon State-Imposed Water Conservation Quotas | KQED",
"ogDescription": "",
"schema": {
"@context": "https://schema.org",
"@type": "Article",
"headline": "California May Abandon State-Imposed Water Conservation Quotas",
"datePublished": "2016-05-09T13:25:51-07:00",
"dateModified": "2024-01-10T15:43:23-08:00",
"image": "https://cdn.kqed.org/wp-content/uploads/2020/02/KQED-OG-Image@1x.png"
}
},
"guestAuthors": [],
"slug": "california-may-abandon-state-imposed-water-conservation-quotas",
"status": "publish",
"sticky": false,
"path": "/science/687703/california-may-abandon-state-imposed-water-conservation-quotas",
"audioTrackLength": null,
"parsedContent": [
{
"type": "contentString",
"content": "\u003cdiv class=\"post-body\">\u003cp>\u003cp>California water officials say they’re moving to scrap the system of state-imposed water conservation quotas put in place during the current drought.\u003c/p>\n\u003cp>The system resulted in a cumulative saving among urban consumers of about 24 percent compared to the benchmark year of 2013.\u003c/p>\n\u003cp>At the same time, Governor Jerry Brown issued an \u003ca href=\"https://www.gov.ca.gov/docs/5.9.16_Executive_Order.pdf\">executive order\u003c/a> that makes permanent some of the most basic prohibitions in place since 2014, such as the ban on hosing down sidewalks and watering lawns to the extent that it creates runoff or within 48 hours of any measurable rainfall.\u003c/p>\n\u003cp>“Now we know that drought is becoming a regular occurrence and water conservation must be a part of our everyday life,” Brown said in a statement.\u003c/p>\n\u003cp>The rule barring restaurants from serving water unsolicited is being lifted, however. Officials say that was always intended as more of an “awareness” measure than a way to achieve major water savings.\u003c/p>\n\u003cfigure id=\"attachment_687798\" class=\"wp-caption aligncenter\" style=\"max-width: 2000px\">\u003cimg loading=\"lazy\" decoding=\"async\" class=\"size-full wp-image-687798\" src=\"http://ww2.kqed.org/science/wp-content/uploads/sites/35/2016/05/IMG_2869.jpg\" alt=\"State officials are lifting the rule barring restaurants from serving water unless requested.\" width=\"2000\" height=\"1500\" srcset=\"https://cdn.kqed.org/wp-content/uploads/sites/35/2016/05/IMG_2869.jpg 2000w, https://cdn.kqed.org/wp-content/uploads/sites/35/2016/05/IMG_2869-400x300.jpg 400w, https://cdn.kqed.org/wp-content/uploads/sites/35/2016/05/IMG_2869-800x600.jpg 800w, https://cdn.kqed.org/wp-content/uploads/sites/35/2016/05/IMG_2869-768x576.jpg 768w, https://cdn.kqed.org/wp-content/uploads/sites/35/2016/05/IMG_2869-1440x1080.jpg 1440w, https://cdn.kqed.org/wp-content/uploads/sites/35/2016/05/IMG_2869-1920x1440.jpg 1920w, https://cdn.kqed.org/wp-content/uploads/sites/35/2016/05/IMG_2869-1180x885.jpg 1180w, https://cdn.kqed.org/wp-content/uploads/sites/35/2016/05/IMG_2869-960x720.jpg 960w\" sizes=\"(max-width: 2000px) 100vw, 2000px\">\u003cfigcaption class=\"wp-caption-text\">State officials are lifting the rule barring restaurants from serving water unless requested. \u003ccite>(Craig Miller/KQED)\u003c/cite>\u003c/figcaption>\u003c/figure>\n\u003cp>But rather than having state officials assign mandatory saving targets to local water agencies, the State Water Resources Control Board will vote next week on a plan to put conservation more firmly back in local hands. Some local water agencies had pushed back hard on the imposed-quota system, calling it unduly restrictive and tone-deaf to local conditions.\u003c/p>\n\u003cp>\u003c/p>\u003c/div>",
"attributes": {
"named": {},
"numeric": []
}
},
{
"type": "component",
"content": "",
"name": "ad",
"attributes": {
"named": {
"label": "fullwidth"
},
"numeric": [
"fullwidth"
]
}
},
{
"type": "contentString",
"content": "\u003cdiv class=\"post-body\">\u003cp>\u003c/p>\n\u003cp>“What the staff is proposing here isn’t a walk in the park,” board chair Felicia Marcus told reporters in a Monday conference call. Instead, Marcus called the new plan “much more tailored to circumstances we’re in now.”\u003c/p>\n\u003cp>Those circumstances would be the much improved water conditions from a year ago, when reservoirs were scraping bottom and the \u003ca href=\"http://ww2.kqed.org/science/2016/05/06/sierra-meltdown-what-snow-we-got-is-going-fast/\">Sierra snowpack\u003c/a> was at an estimated 500-year low.\u003c/p>\n\u003cp>With conditions remaining stubbornly dry in Southern California, Mark Cowin, who heads the state’s Department of Water Resources says officials are “a long way from calling off the statewide drought.”\u003c/p>\n\u003cp>So why change the game plan now? Officials called the new proposal “a more nuanced approach” to keeping a lid on excess water use.\u003c/p>\n\u003cp>Under the staff proposal unveiled on Monday, water suppliers would set local conservation targets based on their own three-year supply projections. Those projections would be modeled on a recurrence of both the drought conditions and demand levels from 2013-14.\u003c/p>\n\u003cp>Under the governor’s executive order, local agencies will still be required to report monthly water use to the state. Marcus says the state will still be empowered to step in and “second-guess” local agencies, possibly imposing restrictions on those that don’t comply with the proposed system.\u003c/p>\n\u003cp>\u003c/p>\n\u003cp>Also on Monday, the California senate passed a bill from Jerry Hill (D-San Mateo) that would force water agencies to institute either surcharges or fines for excessive water use during a declared drought emergency. SB 814 now goes to the assembly.\u003c/p>\n\n\u003c/div>\u003c/p>",
"attributes": {
"named": {},
"numeric": []
}
}
],
"link": "/science/687703/california-may-abandon-state-imposed-water-conservation-quotas",
"authors": [
"221"
],
"series": [
"science_1151"
],
"categories": [
"science_31",
"science_40",
"science_98"
],
"tags": [
"science_1622",
"science_876"
],
"featImg": "science_687769",
"label": "science_1151"
},
"science_677501": {
"type": "posts",
"id": "science_677501",
"meta": {
"index": "posts_1716263798",
"site": "science",
"id": "677501",
"score": null,
"sort": [
1462807853000
]
},
"parent": 0,
"labelTerm": {
"site": "science"
},
"blocks": [],
"publishDate": 1462807853,
"format": "standard",
"title": "Measure AA Asks Bay Area Residents to Help Protect Against Sea Level Rise",
"headTitle": "Measure AA Asks Bay Area Residents to Help Protect Against Sea Level Rise | KQED",
"content": "\u003cp>\u003cstrong>Listen to the Story:\u003c/strong>\t \t \u003c/p>\n\u003cp>http://www.kqed.org/.stream/anon/radio/science/2016/05/WEBMeasureAASommer160509.mp3\u003c/p>\n\u003cp>Sea levels are expected to rise significantly by mid-century, threatening airports and major highways around San Francisco Bay.\u003c/p>\n\u003cp>A first-of-its-kind measure on the June ballot is designed to jump-start the Bay Area’s preparation for that.\u003c/p>\n\u003cp>Measure AA would create a new property tax in the nine Bay Area counties to restore tidal marshes and help secure flood protection.\u003c/p>\n\u003caside class=\"pullquote alignright\">‘It’s only a latte a month. That’s the phrase that the tax-and-spend crowd really likes to use. Bet you dollars to donuts that we’re going to hear that.’\u003ccite>Jon Coupal, Howard Jarvis Taxpayers Asociation\u003c/cite>\u003c/aside>\n\u003cp>According to one study, $62 billion of property around San Francisco Bay is at risk.\u003c/p>\n\u003cp>[ad fullwidth]\u003c/p>\n\u003cp>“There’s been parts of 101 and other roads that have been underwater in the recent past,” says Mike Mielke of the Silicon Valley Leadership Group, “and that’s only a small taste of what’s to come.”\u003c/p>\n\u003cp>The tax would be the same for low-income families who have a small home and for tech companies with a large campus located right on the shoreline, like Google and Facebook. And that’s causing some controversy.\u003c/p>\n\u003cp>\u003cstrong>What Measure AA Would Do\u003cbr>\n\u003c/strong>\u003cbr>\nMeasure AA would implement a $12-a-year parcel tax, raising about half a billion dollars over 20 years. The money would go toward building up the bay’s defense against sea level rise by restoring marshes.\u003c/p>\n\u003cp>“The marshes are a great buffer because the plants in the wetlands slow down the wave action and reduce the flooding,” says David Lewis, executive director of the non-profit Save the Bay.\u003c/p>\n\u003cp>Low-lying plants in tidal marshes, such as those on the Richmond shoreline, act like sponges, Lewis says, absorbing surges from big waves and floods.\u003c/p>\n\u003cp>Around 80 percent of the bay’s marshes have been lost since the Gold Rush, many paved over for development.\u003c/p>\n\u003cp>“They were filled in to create dumps for the cities here in the East Bay and where the population put its garbage for decades,” says Lewis.\u003c/p>\n\u003cp>Around 30,000 acres of restoration projects around the bay are in need of funding. Lewis says Measure AA could help implement about a third of them and draw down federal grants that are awarded only when local funds are being spent as well.\u003c/p>\n\u003ch2>Sites at Risk From Sea Level Rise\u003c/h2>\n\u003cp>\u003cstrong>Scientists say the sea level could rise up to 55 inches by 2100; new estimates coming out soon could put that number higher.\u003c/strong>\u003cbr>\n\u003c!-- iframe plugin v.4.3 wordpress.org/plugins/iframe/ -->\u003cbr>\n\u003ciframe loading=\"lazy\" width=\"100%\" height=\"520\" frameborder=\"0\" src=\"https://kqedscience.cartodb.com/viz/76c95b64-13b9-11e6-8913-0ecfd53eb7d3/embed_map\" scrolling=\"yes\" class=\"iframe-class\">\u003c/iframe>\u003c/p>\n\u003cp style=\"text-align: center\">\u003csup>SOURCE: National Oceanic and Atmospheric Administration (Teodros Hailye/KQED Science)\u003c/sup>\u003c/p>\n\u003cp>\u003cstrong>Why It’s Controversial\u003cbr>\n\u003c/strong>\u003cbr>\nSupporters must convince voters who live nowhere near the shoreline that restoration has benefits for them too.\u003c/p>\n\u003cp>“This is a very tiny tax shared by a lot of people that generates a huge amount of benefit for San Francisco Bay for people and wildlife,” says Lewis.\u003c/p>\n\u003cp>“It’s only a latte a month,” says Jon Coupal, president of the Howard Jarvis Taxpayers Association. “That’s the phrase that the tax-and-spend crowd really likes to use. Bet you dollars to donuts that we’re going to hear that.”\u003c/p>\n\u003cp>As Coupal sees it, the problem with Measure AA is that everyone would pay the same no matter the size of their property or how much they would benefit.\u003c/p>\n\u003cp>“Whether it is a struggling farmworker family in a very modest bungalow in Gilroy or the Apple campus there in Silicon Valley,” he says. “So obviously there are equity issues with respect to this particular proposal.”\u003c/p>\n\u003cp>Waterfront views have long been a draw for many companies around the Bay Area, like Facebook. Its Menlo Park campus is surrounded by water on two sides.\u003c/p>\n\u003cp>“You get the beautiful view of the bay,” says Facebook’s public policy manager Juan Salazar, standing on the nine-acre green roof on top of the company’s newest building. “On a good day, you can actually see Oakland from here.”\u003c/p>\n\u003cfigure id=\"attachment_677503\" class=\"wp-caption aligncenter\" style=\"max-width: 800px\">\u003cimg loading=\"lazy\" decoding=\"async\" class=\"size-medium wp-image-677503\" src=\"http://ww2.kqed.org/science/wp-content/uploads/sites/35/2016/05/Facebook-800x450.jpg\" alt=\"Facebook's headquarters in Menlo Park sits right on the bay waterfront.\" width=\"800\" height=\"450\" srcset=\"https://cdn.kqed.org/wp-content/uploads/sites/35/2016/05/Facebook-800x450.jpg 800w, https://cdn.kqed.org/wp-content/uploads/sites/35/2016/05/Facebook-400x225.jpg 400w, https://cdn.kqed.org/wp-content/uploads/sites/35/2016/05/Facebook-768x432.jpg 768w, https://cdn.kqed.org/wp-content/uploads/sites/35/2016/05/Facebook-1440x810.jpg 1440w, https://cdn.kqed.org/wp-content/uploads/sites/35/2016/05/Facebook.jpg 1920w, https://cdn.kqed.org/wp-content/uploads/sites/35/2016/05/Facebook-1180x664.jpg 1180w, https://cdn.kqed.org/wp-content/uploads/sites/35/2016/05/Facebook-960x540.jpg 960w\" sizes=\"(max-width: 800px) 100vw, 800px\">\u003cfigcaption class=\"wp-caption-text\">Facebook’s headquarters in Menlo Park sit right on the bay waterfront. \u003ccite>(Lauren Sommer/KQED)\u003c/cite>\u003c/figcaption>\u003c/figure>\n\u003cp>The scenic location is also becoming a liability for Facebook and half a dozen other tech giants on the shore. Scientists say sea level could rise more than a foot by mid-century and up to five feet by the end of the century, depending on how climate change plays out.\u003c/p>\n\u003cp>Salazar says Facebook is already planning for that. “The building that you’re sitting in right now, we were built above a floodplain,” he says.\u003c/p>\n\u003cp>But Salazar says there’s more to be done both to protect businesses and the roads and freeways in the area. Mike Mielke of the Silicon Valley Leadership Group agrees the measure is focused on airports, roads, and neighborhoods. He says tech companies will take care of protecting themselves.\u003c/p>\n\u003cp>“It’s the public infrastructure that we all share in and we all have a risk associated with if it’s flooded,” he says.\u003c/p>\n\u003cp>Coupal isn’t against bay restoration, but would rather see it paid for through the state’s general fund.\u003c/p>\n\u003cp>\u003cstrong>Why Measure AA Is a First\u003cbr>\n\u003c/strong>\u003cbr>\nIf the measure passes, it’ll be a first. Coastal cities like New Orleans have turned to federal grants to protect themselves. But raising money directly from the public for climate change could be a model for other coastal areas.\u003c/p>\n\u003cp>\u003c/p>\n\u003cp>Measure AA will need two-thirds of all the votes cast in the nine counties around the bay to pass. Voters will decide June 7th.\u003c/p>\n\n",
"stats": {
"hasVideo": false,
"hasChartOrMap": true,
"hasAudio": true,
"hasPolis": false,
"wordCount": 976,
"hasGoogleForm": false,
"hasGallery": false,
"hasHearkenModule": false,
"iframeSrcs": [
"https://kqedscience.cartodb.com/viz/76c95b64-13b9-11e6-8913-0ecfd53eb7d3/embed_map"
],
"paragraphCount": 30
},
"modified": 1704930207,
"excerpt": "The measure would establish a $12 annual parcel tax to restore tidal marshes and help defend against sea level rise.",
"headData": {
"twImgId": "",
"twTitle": "",
"ogTitle": "",
"ogImgId": "",
"twDescription": "",
"description": "The measure would establish a $12 annual parcel tax to restore tidal marshes and help defend against sea level rise.",
"title": "Measure AA Asks Bay Area Residents to Help Protect Against Sea Level Rise | KQED",
"ogDescription": "",
"schema": {
"@context": "https://schema.org",
"@type": "Article",
"headline": "Measure AA Asks Bay Area Residents to Help Protect Against Sea Level Rise",
"datePublished": "2016-05-09T08:30:53-07:00",
"dateModified": "2024-01-10T15:43:27-08:00",
"image": "https://cdn.kqed.org/wp-content/uploads/2020/02/KQED-OG-Image@1x.png"
}
},
"guestAuthors": [],
"slug": "measure-aa-asks-bay-area-residents-to-help-protect-against-sea-level-rise",
"status": "publish",
"sticky": false,
"path": "/science/677501/measure-aa-asks-bay-area-residents-to-help-protect-against-sea-level-rise",
"audioUrl": "http://www.kqed.org/.stream/anon/radio/science/2016/05/WEBMeasureAASommer160509.mp3",
"audioDuration": null,
"audioTrackLength": null,
"parsedContent": [
{
"type": "contentString",
"content": "\u003cdiv class=\"post-body\">\u003cp>\u003cp>\u003cstrong>Listen to the Story:\u003c/strong>\t \t \u003c/p>\u003c/p>\u003c/div>",
"attributes": {
"named": {},
"numeric": []
}
},
{
"type": "component",
"content": "",
"name": "audioLink",
"attributes": {
"named": {
"src": "http://www.kqed.org/.stream/anon/radio/science/2016/05/WEBMeasureAASommer160509.mp3"
},
"numeric": []
}
},
{
"type": "contentString",
"content": "\u003cdiv class=\"post-body\">\u003cp>\u003cp>Sea levels are expected to rise significantly by mid-century, threatening airports and major highways around San Francisco Bay.\u003c/p>\n\u003cp>A first-of-its-kind measure on the June ballot is designed to jump-start the Bay Area’s preparation for that.\u003c/p>\n\u003cp>Measure AA would create a new property tax in the nine Bay Area counties to restore tidal marshes and help secure flood protection.\u003c/p>\n\u003caside class=\"pullquote alignright\">‘It’s only a latte a month. That’s the phrase that the tax-and-spend crowd really likes to use. Bet you dollars to donuts that we’re going to hear that.’\u003ccite>Jon Coupal, Howard Jarvis Taxpayers Asociation\u003c/cite>\u003c/aside>\n\u003cp>According to one study, $62 billion of property around San Francisco Bay is at risk.\u003c/p>\n\u003cp>\u003c/p>\u003c/div>",
"attributes": {
"named": {},
"numeric": []
}
},
{
"type": "component",
"content": "",
"name": "ad",
"attributes": {
"named": {
"label": "fullwidth"
},
"numeric": [
"fullwidth"
]
}
},
{
"type": "contentString",
"content": "\u003cdiv class=\"post-body\">\u003cp>\u003c/p>\n\u003cp>“There’s been parts of 101 and other roads that have been underwater in the recent past,” says Mike Mielke of the Silicon Valley Leadership Group, “and that’s only a small taste of what’s to come.”\u003c/p>\n\u003cp>The tax would be the same for low-income families who have a small home and for tech companies with a large campus located right on the shoreline, like Google and Facebook. And that’s causing some controversy.\u003c/p>\n\u003cp>\u003cstrong>What Measure AA Would Do\u003cbr>\n\u003c/strong>\u003cbr>\nMeasure AA would implement a $12-a-year parcel tax, raising about half a billion dollars over 20 years. The money would go toward building up the bay’s defense against sea level rise by restoring marshes.\u003c/p>\n\u003cp>“The marshes are a great buffer because the plants in the wetlands slow down the wave action and reduce the flooding,” says David Lewis, executive director of the non-profit Save the Bay.\u003c/p>\n\u003cp>Low-lying plants in tidal marshes, such as those on the Richmond shoreline, act like sponges, Lewis says, absorbing surges from big waves and floods.\u003c/p>\n\u003cp>Around 80 percent of the bay’s marshes have been lost since the Gold Rush, many paved over for development.\u003c/p>\n\u003cp>“They were filled in to create dumps for the cities here in the East Bay and where the population put its garbage for decades,” says Lewis.\u003c/p>\n\u003cp>Around 30,000 acres of restoration projects around the bay are in need of funding. Lewis says Measure AA could help implement about a third of them and draw down federal grants that are awarded only when local funds are being spent as well.\u003c/p>\n\u003ch2>Sites at Risk From Sea Level Rise\u003c/h2>\n\u003cp>\u003cstrong>Scientists say the sea level could rise up to 55 inches by 2100; new estimates coming out soon could put that number higher.\u003c/strong>\u003cbr>\n\u003c!-- iframe plugin v.4.3 wordpress.org/plugins/iframe/ -->\u003cbr>\n\u003ciframe loading=\"lazy\" width=\"100%\" height=\"520\" frameborder=\"0\" src=\"https://kqedscience.cartodb.com/viz/76c95b64-13b9-11e6-8913-0ecfd53eb7d3/embed_map\" scrolling=\"yes\" class=\"iframe-class\">\u003c/iframe>\u003c/p>\n\u003cp style=\"text-align: center\">\u003csup>SOURCE: National Oceanic and Atmospheric Administration (Teodros Hailye/KQED Science)\u003c/sup>\u003c/p>\n\u003cp>\u003cstrong>Why It’s Controversial\u003cbr>\n\u003c/strong>\u003cbr>\nSupporters must convince voters who live nowhere near the shoreline that restoration has benefits for them too.\u003c/p>\n\u003cp>“This is a very tiny tax shared by a lot of people that generates a huge amount of benefit for San Francisco Bay for people and wildlife,” says Lewis.\u003c/p>\n\u003cp>“It’s only a latte a month,” says Jon Coupal, president of the Howard Jarvis Taxpayers Association. “That’s the phrase that the tax-and-spend crowd really likes to use. Bet you dollars to donuts that we’re going to hear that.”\u003c/p>\n\u003cp>As Coupal sees it, the problem with Measure AA is that everyone would pay the same no matter the size of their property or how much they would benefit.\u003c/p>\n\u003cp>“Whether it is a struggling farmworker family in a very modest bungalow in Gilroy or the Apple campus there in Silicon Valley,” he says. “So obviously there are equity issues with respect to this particular proposal.”\u003c/p>\n\u003cp>Waterfront views have long been a draw for many companies around the Bay Area, like Facebook. Its Menlo Park campus is surrounded by water on two sides.\u003c/p>\n\u003cp>“You get the beautiful view of the bay,” says Facebook’s public policy manager Juan Salazar, standing on the nine-acre green roof on top of the company’s newest building. “On a good day, you can actually see Oakland from here.”\u003c/p>\n\u003cfigure id=\"attachment_677503\" class=\"wp-caption aligncenter\" style=\"max-width: 800px\">\u003cimg loading=\"lazy\" decoding=\"async\" class=\"size-medium wp-image-677503\" src=\"http://ww2.kqed.org/science/wp-content/uploads/sites/35/2016/05/Facebook-800x450.jpg\" alt=\"Facebook's headquarters in Menlo Park sits right on the bay waterfront.\" width=\"800\" height=\"450\" srcset=\"https://cdn.kqed.org/wp-content/uploads/sites/35/2016/05/Facebook-800x450.jpg 800w, https://cdn.kqed.org/wp-content/uploads/sites/35/2016/05/Facebook-400x225.jpg 400w, https://cdn.kqed.org/wp-content/uploads/sites/35/2016/05/Facebook-768x432.jpg 768w, https://cdn.kqed.org/wp-content/uploads/sites/35/2016/05/Facebook-1440x810.jpg 1440w, https://cdn.kqed.org/wp-content/uploads/sites/35/2016/05/Facebook.jpg 1920w, https://cdn.kqed.org/wp-content/uploads/sites/35/2016/05/Facebook-1180x664.jpg 1180w, https://cdn.kqed.org/wp-content/uploads/sites/35/2016/05/Facebook-960x540.jpg 960w\" sizes=\"(max-width: 800px) 100vw, 800px\">\u003cfigcaption class=\"wp-caption-text\">Facebook’s headquarters in Menlo Park sit right on the bay waterfront. \u003ccite>(Lauren Sommer/KQED)\u003c/cite>\u003c/figcaption>\u003c/figure>\n\u003cp>The scenic location is also becoming a liability for Facebook and half a dozen other tech giants on the shore. Scientists say sea level could rise more than a foot by mid-century and up to five feet by the end of the century, depending on how climate change plays out.\u003c/p>\n\u003cp>Salazar says Facebook is already planning for that. “The building that you’re sitting in right now, we were built above a floodplain,” he says.\u003c/p>\n\u003cp>But Salazar says there’s more to be done both to protect businesses and the roads and freeways in the area. Mike Mielke of the Silicon Valley Leadership Group agrees the measure is focused on airports, roads, and neighborhoods. He says tech companies will take care of protecting themselves.\u003c/p>\n\u003cp>“It’s the public infrastructure that we all share in and we all have a risk associated with if it’s flooded,” he says.\u003c/p>\n\u003cp>Coupal isn’t against bay restoration, but would rather see it paid for through the state’s general fund.\u003c/p>\n\u003cp>\u003cstrong>Why Measure AA Is a First\u003cbr>\n\u003c/strong>\u003cbr>\nIf the measure passes, it’ll be a first. Coastal cities like New Orleans have turned to federal grants to protect themselves. But raising money directly from the public for climate change could be a model for other coastal areas.\u003c/p>\n\u003cp>\u003c/p>\n\u003cp>Measure AA will need two-thirds of all the votes cast in the nine counties around the bay to pass. Voters will decide June 7th.\u003c/p>\n\n\u003c/div>\u003c/p>",
"attributes": {
"named": {},
"numeric": []
}
}
],
"link": "/science/677501/measure-aa-asks-bay-area-residents-to-help-protect-against-sea-level-rise",
"authors": [
"239"
],
"categories": [
"science_46",
"science_31",
"science_89",
"science_35",
"science_40",
"science_43"
],
"tags": [
"science_208"
],
"featImg": "science_677502",
"label": "science"
},
"science_679581": {
"type": "posts",
"id": "science_679581",
"meta": {
"index": "posts_1716263798",
"site": "science",
"id": "679581",
"score": null,
"sort": [
1462560327000
]
},
"parent": 0,
"labelTerm": {
"site": "science",
"term": 1151
},
"blocks": [],
"publishDate": 1462560327,
"format": "image",
"title": "Interactive: Sierra Snowpack Highs and Lows Over 13 Years",
"headTitle": "Interactive: Sierra Snowpack Highs and Lows Over 13 Years | KQED",
"content": "\u003cp>The Sierra Nevada snowpack is a classic example of what scientists call “high inter-annual variability.” Translation: whatever’s happening this year, don’t count on it next year — or ever.\u003c/p>\n\u003cp>Given the whipsaw nature of things, it could reasonably be considered a dicey proposition that California depends on the snowpack for about a third of its water supply. With the climate changing, it’s becoming even dicier. Scientists expect the snowpack to dwindle in coming decades, but within that general decline, higher highs and lower lows are likely.\u003c/p>\n\u003cp>It can’t get much lower than the winter of 2014-15, the nadir of California’s current drought. On May 1, 2015, water content of the Sierra snowpack stood at 1 percent of the long-term average — virtually nil. Using tree ring evidence, scientists estimated that to be the \u003ca href=\"http://www.nature.com/news/california-snowpack-lowest-in-past-500-years-1.18345\">skimpiest snowpack in 500 years\u003c/a>. \u003ca href=\"http://ww2.kqed.org/science/2016/05/06/sierra-meltdown-what-snow-we-got-is-going-fast/\">This spring’s snowpack\u003c/a>, while considerably more robust, was still below average. The official stance is that California remains in drought.\u003c/p>\n\u003cp>\u003cem>Use the interactive tools below to trace the highs and lows of the snowpack over time.\u003c/em>\u003c/p>\n\u003cdiv align=\"center\">\n\u003c!-- iframe plugin v.4.3 wordpress.org/plugins/iframe/ -->\u003cbr>\n\u003ciframe loading=\"lazy\" src=\"http://vis.ecowest.org/interactive/snow.php#s=CA&h=1\" width=\"1500\" height=\"550\" frameborder=\"0\" style=\"min-width: 100%; width: 100px; height: 100vh; border: 0;\" scrolling=\"yes\" class=\"iframe-class\">\u003c/iframe>\n\u003c/div>\n\u003cp>\u003cem>Visualization by \u003ca href=\"https://twitter.com/mcgeoff\">Geoff McGhee\u003c/a>, \u003ca href=\"https://twitter.com/davidkroodsma\">David Kroodsma\u003c/a>, \u003ca href=\"https://twitter.com/enoex\">Erik Hazzard\u003c/a> and \u003ca href=\"https://twitter.com/mitchtobin\">Mitch Tobin\u003c/a> for \u003ca href=\"http://ecowest.org/\">EcoWest\u003c/a>, a collaboration of The \u003ca href=\"http://west.stanford.edu/\">Bill Lane Center\u003c/a> for the American West at Stanford University and \u003ca href=\"http://seatosnow.com/\">Sea to Snow\u003c/a>.\u003c/em>\u003c/p>\n\u003cp>[ad fullwidth]\u003c/p>\u003cp>\u003c/p>\n",
"stats": {
"hasVideo": false,
"hasChartOrMap": true,
"hasAudio": false,
"hasPolis": false,
"wordCount": 224,
"hasGoogleForm": false,
"hasGallery": false,
"hasHearkenModule": false,
"iframeSrcs": [
"http://vis.ecowest.org/interactive/snow.php#s=CA&h=1"
],
"paragraphCount": 7
},
"modified": 1704930213,
"excerpt": "Use the interactive map and scale to see startling changes in the snowpack over time.",
"headData": {
"twImgId": "",
"twTitle": "",
"ogTitle": "",
"ogImgId": "",
"twDescription": "",
"description": "Use the interactive map and scale to see startling changes in the snowpack over time.",
"title": "Interactive: Sierra Snowpack Highs and Lows Over 13 Years | KQED",
"ogDescription": "",
"schema": {
"@context": "https://schema.org",
"@type": "Article",
"headline": "Interactive: Sierra Snowpack Highs and Lows Over 13 Years",
"datePublished": "2016-05-06T11:45:27-07:00",
"dateModified": "2024-01-10T15:43:33-08:00",
"image": "https://cdn.kqed.org/wp-content/uploads/2020/02/KQED-OG-Image@1x.png"
}
},
"guestAuthors": [],
"slug": "interactive-sierra-snowpack-highs-and-lows-over-13-years",
"status": "publish",
"sticky": false,
"path": "/science/679581/interactive-sierra-snowpack-highs-and-lows-over-13-years",
"audioTrackLength": null,
"parsedContent": [
{
"type": "contentString",
"content": "\u003cdiv class=\"post-body\">\u003cp>\u003cp>The Sierra Nevada snowpack is a classic example of what scientists call “high inter-annual variability.” Translation: whatever’s happening this year, don’t count on it next year — or ever.\u003c/p>\n\u003cp>Given the whipsaw nature of things, it could reasonably be considered a dicey proposition that California depends on the snowpack for about a third of its water supply. With the climate changing, it’s becoming even dicier. Scientists expect the snowpack to dwindle in coming decades, but within that general decline, higher highs and lower lows are likely.\u003c/p>\n\u003cp>It can’t get much lower than the winter of 2014-15, the nadir of California’s current drought. On May 1, 2015, water content of the Sierra snowpack stood at 1 percent of the long-term average — virtually nil. Using tree ring evidence, scientists estimated that to be the \u003ca href=\"http://www.nature.com/news/california-snowpack-lowest-in-past-500-years-1.18345\">skimpiest snowpack in 500 years\u003c/a>. \u003ca href=\"http://ww2.kqed.org/science/2016/05/06/sierra-meltdown-what-snow-we-got-is-going-fast/\">This spring’s snowpack\u003c/a>, while considerably more robust, was still below average. The official stance is that California remains in drought.\u003c/p>\n\u003cp>\u003cem>Use the interactive tools below to trace the highs and lows of the snowpack over time.\u003c/em>\u003c/p>\n\u003cdiv align=\"center\">\n\u003c!-- iframe plugin v.4.3 wordpress.org/plugins/iframe/ -->\u003cbr>\n\u003ciframe loading=\"lazy\" src=\"http://vis.ecowest.org/interactive/snow.php#s=CA&h=1\" width=\"1500\" height=\"550\" frameborder=\"0\" style=\"min-width: 100%; width: 100px; height: 100vh; border: 0;\" scrolling=\"yes\" class=\"iframe-class\">\u003c/iframe>\n\u003c/div>\n\u003cp>\u003cem>Visualization by \u003ca href=\"https://twitter.com/mcgeoff\">Geoff McGhee\u003c/a>, \u003ca href=\"https://twitter.com/davidkroodsma\">David Kroodsma\u003c/a>, \u003ca href=\"https://twitter.com/enoex\">Erik Hazzard\u003c/a> and \u003ca href=\"https://twitter.com/mitchtobin\">Mitch Tobin\u003c/a> for \u003ca href=\"http://ecowest.org/\">EcoWest\u003c/a>, a collaboration of The \u003ca href=\"http://west.stanford.edu/\">Bill Lane Center\u003c/a> for the American West at Stanford University and \u003ca href=\"http://seatosnow.com/\">Sea to Snow\u003c/a>.\u003c/em>\u003c/p>\n\u003cp>\u003c/p>\u003c/div>",
"attributes": {
"named": {},
"numeric": []
}
},
{
"type": "component",
"content": "",
"name": "ad",
"attributes": {
"named": {
"label": "fullwidth"
},
"numeric": [
"fullwidth"
]
}
},
{
"type": "contentString",
"content": "\u003cdiv class=\"post-body\">\u003cp>\u003c/p>\u003cp>\u003c/p>\n\u003c/div>\u003c/p>",
"attributes": {
"named": {},
"numeric": []
}
}
],
"link": "/science/679581/interactive-sierra-snowpack-highs-and-lows-over-13-years",
"authors": [
"221"
],
"series": [
"science_1151"
],
"categories": [
"science_31",
"science_35",
"science_40",
"science_98"
],
"tags": [
"science_1462",
"science_110"
],
"featImg": "science_680994",
"label": "science_1151"
},
"science_679114": {
"type": "posts",
"id": "science_679114",
"meta": {
"index": "posts_1716263798",
"site": "science",
"id": "679114",
"score": null,
"sort": [
1462539622000
]
},
"parent": 0,
"labelTerm": {
"site": "science",
"term": 1151
},
"blocks": [],
"publishDate": 1462539622,
"format": "standard",
"title": "Sierra Meltdown: What Snow We Got is Going Fast",
"headTitle": "Sierra Meltdown: What Snow We Got is Going Fast | KQED",
"content": "\u003cp>California’s “frozen reservoir” is melting fast.\u003c/p>\n\u003cp>Unusually high temperatures this spring have acted like a blow-drier on accumulated winter snows, despite a healthy boost during the stormy month of March.\u003c/p>\n\u003cp>One thing is undeniable: the Sierra snowpack is a lot more robust than the previous winter’s, which was off-the-charts ugly. Around the first of May, water content (which is what really matters) of the snowpack stood at 60 percent of the long-term average. That’s not great news unless you compare it to May 1 of last year, when it was 1 percent. That’s not a typo.\u003c/p>\n\u003cp>On April 1, when hydrologists generally reckon the snowpack to be at its peak for the season, it stood at 85 percent of the average for that date.\u003c/p>\n\u003cp>This spring the most intense period of melting is running about two to three weeks earlier than normal, according to Nina Oakley, assistant research climatologist at the Western Regional Climate Center in Reno.\u003c/p>\n\u003cp>[ad fullwidth]\u003c/p>\n\u003cp>“Typically the steepest declines are in late April to early May,” she says. But this year, Oakley says monthly average temperatures in the early spring were running 2 to 5 degrees above normal at the higher Sierra elevations.\u003c/p>\n\u003cfigure id=\"attachment_679295\" class=\"wp-caption aligncenter\" style=\"max-width: 939px\">\u003cimg loading=\"lazy\" decoding=\"async\" class=\"wp-image-679295 size-full\" src=\"http://ww2.kqed.org/science/wp-content/uploads/sites/35/2016/05/SNOTEL_Squaw_1604.png\" alt=\"This graph shows this year's snow melt (blue line) starting sooner than the long-term average (red).\" width=\"939\" height=\"459\" srcset=\"https://cdn.kqed.org/wp-content/uploads/sites/35/2016/05/SNOTEL_Squaw_1604.png 939w, https://cdn.kqed.org/wp-content/uploads/sites/35/2016/05/SNOTEL_Squaw_1604-400x196.png 400w, https://cdn.kqed.org/wp-content/uploads/sites/35/2016/05/SNOTEL_Squaw_1604-800x391.png 800w, https://cdn.kqed.org/wp-content/uploads/sites/35/2016/05/SNOTEL_Squaw_1604-768x375.png 768w\" sizes=\"(max-width: 939px) 100vw, 939px\">\u003cfigcaption class=\"wp-caption-text\">This graph shows this year’s snow melt (blue line) starting sooner than the long-term average (red). \u003ccite>(Natural Resources Conservation Service/USDA)\u003c/cite>\u003c/figcaption>\u003c/figure>\n\u003cp>Plus there’s a “snowball” effect, or what Oakley calls a “positive feedback,” in which some snow melt leads to more.\u003c/p>\n\u003cp>“As soon as you start melting enough snow that you expose trees, rocks, soil underneath,” she explains, “these features are not reflective like the snow and so they’ll start to absorb solar energy and facilitate further snow melt.”\u003c/p>\n\u003caside class=\"pullquote alignright\">‘It’s a big juggling act, frankly, to manage the water resource here’\u003ccite>Doug Carlson, DWR\u003c/cite>\u003c/aside>\n\u003cp>The good news is that a lot of this early melt is ending up in reservoirs. The bad news with an early melt is that as consumers start drawing down those reservoirs, there’s less runoff to replace it during the peak growing season, when it’s most needed.\u003c/p>\n\u003cp>“We try to capture every drop we can,” says Doug Carlson of the state’s Department of Water Resources.\u003c/p>\n\u003cp>The big Northern California reservoirs are filling fast. The two biggest, Shasta Lake and Lake Oroville, are both at more than 90 percent of capacity.\u003c/p>\n\u003cp>But Carlson concedes that significant \u003ca href=\"http://ww2.kqed.org/science/2016/02/29/california-reservoirs-are-dumping-water-in-a-drought-but-science-could-change-that/\">volumes of water are let go\u003c/a> for flood control and to push back encroaching salt water and maintain river ecosystems.\u003c/p>\n\u003cp>“It’s a big juggling act, frankly, to manage the water resource here,” says Carlson. “We think we’re capturing a good deal of the snow melt right now.”\u003c/p>\n\u003cp>\u003c/p>\n\u003cp>An early melt can also have environmental impacts, especially on fish. If the cold water pulses come too early, lower flows and higher water temperatures later in the season can make it difficult or impossible for some species to survive.\u003c/p>\n\n",
"stats": {
"hasVideo": false,
"hasChartOrMap": false,
"hasAudio": false,
"hasPolis": false,
"wordCount": 525,
"hasGoogleForm": false,
"hasGallery": false,
"hasHearkenModule": false,
"iframeSrcs": [],
"paragraphCount": 16
},
"modified": 1704930218,
"excerpt": "Warmer-than-usual temperatures in the Sierra are driving the spring melt two to three weeks early.",
"headData": {
"twImgId": "",
"twTitle": "",
"ogTitle": "",
"ogImgId": "",
"twDescription": "",
"description": "Warmer-than-usual temperatures in the Sierra are driving the spring melt two to three weeks early.",
"title": "Sierra Meltdown: What Snow We Got is Going Fast | KQED",
"ogDescription": "",
"schema": {
"@context": "https://schema.org",
"@type": "Article",
"headline": "Sierra Meltdown: What Snow We Got is Going Fast",
"datePublished": "2016-05-06T06:00:22-07:00",
"dateModified": "2024-01-10T15:43:38-08:00",
"image": "https://cdn.kqed.org/wp-content/uploads/2020/02/KQED-OG-Image@1x.png"
}
},
"guestAuthors": [],
"slug": "sierra-meltdown-what-snow-we-got-is-going-fast",
"status": "publish",
"sticky": false,
"path": "/science/679114/sierra-meltdown-what-snow-we-got-is-going-fast",
"audioTrackLength": null,
"parsedContent": [
{
"type": "contentString",
"content": "\u003cdiv class=\"post-body\">\u003cp>\u003cp>California’s “frozen reservoir” is melting fast.\u003c/p>\n\u003cp>Unusually high temperatures this spring have acted like a blow-drier on accumulated winter snows, despite a healthy boost during the stormy month of March.\u003c/p>\n\u003cp>One thing is undeniable: the Sierra snowpack is a lot more robust than the previous winter’s, which was off-the-charts ugly. Around the first of May, water content (which is what really matters) of the snowpack stood at 60 percent of the long-term average. That’s not great news unless you compare it to May 1 of last year, when it was 1 percent. That’s not a typo.\u003c/p>\n\u003cp>On April 1, when hydrologists generally reckon the snowpack to be at its peak for the season, it stood at 85 percent of the average for that date.\u003c/p>\n\u003cp>This spring the most intense period of melting is running about two to three weeks earlier than normal, according to Nina Oakley, assistant research climatologist at the Western Regional Climate Center in Reno.\u003c/p>\n\u003cp>\u003c/p>\u003c/div>",
"attributes": {
"named": {},
"numeric": []
}
},
{
"type": "component",
"content": "",
"name": "ad",
"attributes": {
"named": {
"label": "fullwidth"
},
"numeric": [
"fullwidth"
]
}
},
{
"type": "contentString",
"content": "\u003cdiv class=\"post-body\">\u003cp>\u003c/p>\n\u003cp>“Typically the steepest declines are in late April to early May,” she says. But this year, Oakley says monthly average temperatures in the early spring were running 2 to 5 degrees above normal at the higher Sierra elevations.\u003c/p>\n\u003cfigure id=\"attachment_679295\" class=\"wp-caption aligncenter\" style=\"max-width: 939px\">\u003cimg loading=\"lazy\" decoding=\"async\" class=\"wp-image-679295 size-full\" src=\"http://ww2.kqed.org/science/wp-content/uploads/sites/35/2016/05/SNOTEL_Squaw_1604.png\" alt=\"This graph shows this year's snow melt (blue line) starting sooner than the long-term average (red).\" width=\"939\" height=\"459\" srcset=\"https://cdn.kqed.org/wp-content/uploads/sites/35/2016/05/SNOTEL_Squaw_1604.png 939w, https://cdn.kqed.org/wp-content/uploads/sites/35/2016/05/SNOTEL_Squaw_1604-400x196.png 400w, https://cdn.kqed.org/wp-content/uploads/sites/35/2016/05/SNOTEL_Squaw_1604-800x391.png 800w, https://cdn.kqed.org/wp-content/uploads/sites/35/2016/05/SNOTEL_Squaw_1604-768x375.png 768w\" sizes=\"(max-width: 939px) 100vw, 939px\">\u003cfigcaption class=\"wp-caption-text\">This graph shows this year’s snow melt (blue line) starting sooner than the long-term average (red). \u003ccite>(Natural Resources Conservation Service/USDA)\u003c/cite>\u003c/figcaption>\u003c/figure>\n\u003cp>Plus there’s a “snowball” effect, or what Oakley calls a “positive feedback,” in which some snow melt leads to more.\u003c/p>\n\u003cp>“As soon as you start melting enough snow that you expose trees, rocks, soil underneath,” she explains, “these features are not reflective like the snow and so they’ll start to absorb solar energy and facilitate further snow melt.”\u003c/p>\n\u003caside class=\"pullquote alignright\">‘It’s a big juggling act, frankly, to manage the water resource here’\u003ccite>Doug Carlson, DWR\u003c/cite>\u003c/aside>\n\u003cp>The good news is that a lot of this early melt is ending up in reservoirs. The bad news with an early melt is that as consumers start drawing down those reservoirs, there’s less runoff to replace it during the peak growing season, when it’s most needed.\u003c/p>\n\u003cp>“We try to capture every drop we can,” says Doug Carlson of the state’s Department of Water Resources.\u003c/p>\n\u003cp>The big Northern California reservoirs are filling fast. The two biggest, Shasta Lake and Lake Oroville, are both at more than 90 percent of capacity.\u003c/p>\n\u003cp>But Carlson concedes that significant \u003ca href=\"http://ww2.kqed.org/science/2016/02/29/california-reservoirs-are-dumping-water-in-a-drought-but-science-could-change-that/\">volumes of water are let go\u003c/a> for flood control and to push back encroaching salt water and maintain river ecosystems.\u003c/p>\n\u003cp>“It’s a big juggling act, frankly, to manage the water resource here,” says Carlson. “We think we’re capturing a good deal of the snow melt right now.”\u003c/p>\n\u003cp>\u003c/p>\n\u003cp>An early melt can also have environmental impacts, especially on fish. If the cold water pulses come too early, lower flows and higher water temperatures later in the season can make it difficult or impossible for some species to survive.\u003c/p>\n\n\u003c/div>\u003c/p>",
"attributes": {
"named": {},
"numeric": []
}
}
],
"link": "/science/679114/sierra-meltdown-what-snow-we-got-is-going-fast",
"authors": [
"221"
],
"series": [
"science_1151"
],
"categories": [
"science_31",
"science_40",
"science_98"
],
"tags": [
"science_1622",
"science_1462",
"science_110"
],
"featImg": "science_679297",
"label": "science_1151"
},
"science_679017": {
"type": "posts",
"id": "science_679017",
"meta": {
"index": "posts_1716263798",
"site": "science",
"id": "679017",
"score": null,
"sort": [
1462471814000
]
},
"parent": 0,
"labelTerm": {},
"blocks": [],
"publishDate": 1462471814,
"format": "standard",
"title": "Why La Niña Does Not Ensure More Drought",
"headTitle": "Why La Niña Does Not Ensure More Drought | KQED",
"content": "\u003cp>By now we’ve all heard the news that La Niña is the next weather phenomenon poised to toy with California. The National Oceanic and Atmospheric Administration on April 14 issued a “La Niña watch” indicating a 70 percent chance the weather phenomenon would likely take hold by the end of this calendar year.\u003c/p>\n\u003cp>\u003cspan class=\"s1\">Which was quickly followed by \u003ca href=\"http://www.usatoday.com/story/weather/2016/04/15/el-nino-la-nina/83078500/\" target=\"_blank\" rel=\"noopener\">\u003cspan class=\"s2\">headlines\u003c/span>\u003c/a> saying La Niña is likely to worsen the drought in California.\u003c/span>\u003c/p>\n\u003cp>\u003cspan class=\"s1\">Not so fast.\u003c/span>\u003c/p>\n\u003cp>\u003cspan class=\"s1\">Just as we learned this year there are no guarantees with El Niño, the same is true of its opposite. La Niña is defined by a marked cooling of the equatorial Pacific Ocean, which disrupts global weather patterns just like El Niño does. But instead of making the southwest wetter, it tends to make it drier while detouring storms toward the Pacific Northwest.\u003c/span>\u003c/p>\n\u003cfigure id=\"attachment_679021\" class=\"wp-caption alignleft\" style=\"max-width: 250px\">\u003cimg loading=\"lazy\" decoding=\"async\" class=\"size-full wp-image-679021\" src=\"http://ww2.kqed.org/science/wp-content/uploads/sites/35/2016/05/water-deeply_Jan-Null.jpg\" alt=\"Meterologist Jan Null is photographed at his home in Saratoga on Tuesday, March 31, 2015. Null runs Golden Gate Weather Services from home. \" width=\"250\" height=\"250\" srcset=\"https://cdn.kqed.org/wp-content/uploads/sites/35/2016/05/water-deeply_Jan-Null.jpg 250w, https://cdn.kqed.org/wp-content/uploads/sites/35/2016/05/water-deeply_Jan-Null-32x32.jpg 32w, https://cdn.kqed.org/wp-content/uploads/sites/35/2016/05/water-deeply_Jan-Null-64x64.jpg 64w, https://cdn.kqed.org/wp-content/uploads/sites/35/2016/05/water-deeply_Jan-Null-96x96.jpg 96w, https://cdn.kqed.org/wp-content/uploads/sites/35/2016/05/water-deeply_Jan-Null-128x128.jpg 128w, https://cdn.kqed.org/wp-content/uploads/sites/35/2016/05/water-deeply_Jan-Null-150x150.jpg 150w\" sizes=\"(max-width: 250px) 100vw, 250px\">\u003cfigcaption class=\"wp-caption-text\">Meterologist Jan Null is photographed at his home in Saratoga on Tuesday, March 31, 2015. Null runs Golden Gate Weather Services from home. \u003ccite>(Gary Reyes/Bay Area News Group)\u003c/cite>\u003c/figcaption>\u003c/figure>\n\u003cp>But it doesn’t always go down like that.\u003c/p>\n\u003cp>[ad fullwidth]\u003c/p>\n\u003cp>\u003cspan class=\"s1\">To help us make sense of La Niña, Water Deeply asked Jan Null to explain things. Null is a consulting meteorologist and owner of \u003ca href=\"http://ggweather.com/\" target=\"_blank\" rel=\"nofollow noopener\">Golden Gate Weather Services\u003c/a> in Saratoga. He has also been a consistent voice of reason about El Niño when the media was often crying wolf.\u003c/span>\u003c/p>\n\u003ch2>\u003cspan class=\"s1\">\u003cb>Is La Niña coming?\u003c/b>\u003c/span>\u003c/h2>\n\u003cp>\u003cspan class=\"s1\">Jan Null: Probably. More and more, the computer models each of the last two months have been tilting into the negative category (in terms of sea surface temperature anomaly). That’s the sort of thing you start seeing. The average is now \u003c/span>−0.8 for all the dynamic and statistical models for November-December-January. If it’s colder than −0.5, then it gets into weak La Niña category. Between −0.5 and 1 is weak; Between −1 and −1.5 is moderate; greater than −1.5 is strong.\u003c/p>\n\u003ch2>\u003cspan class=\"s1\">\u003cb>Is it typical to have La Niña follow El Niño?\u003c/b>\u003c/span>\u003c/h2>\n\u003cp>Jan Null: There have now been 24 El Niños going back to 1950. If we look at the total number of La Niñas out of all 24, 17 of those became La Niñas. That’s a pretty high percentage. With the models all pointing toward cooling and with the data, we’re already seeing significant cooling in the Pacific; we’re certainly heading toward a La Niña. So we’ve decided we’re going to have a La Niña. The next thing is, how strong is that La Niña going to be? That’s the big question mark right now.\u003c/p>\n\u003ch2>\u003cspan class=\"s1\">\u003cb>How important is that to know?\u003c/b>\u003c/span>\u003c/h2>\n\u003cp>Jan Null: If we look at what the results are in the different categories, it starts giving us an idea of what has happened in the past. The signal is much less definite than with an El Niño. There’s a broader range of solutions under La Niña than under El Niño.\u003c/p>\n\u003cp>\u003cspan class=\"s1\">Let’s say we’re going to get into the moderate range. Then it’s important to look at effects on individual \u003ca href=\"http://www.cpc.ncep.noaa.gov/products/analysis_monitoring/regional_monitoring/CLIM_DIVS/california.gif\" target=\"_blank\" rel=\"noopener\">\u003cspan class=\"s2\">climate divisions\u003c/span>\u003c/a> in the state. Climate Division 2 is arguably the most important, encompassing the Northern Sierra Nevada and Northern Sacramento Valley. If we look at the six moderate La Niña events, three were less than normal rainfall and three were greater than normal. That doesn’t tell me anything. That’s a broad range of solutions for moderate El Niños.\u003c/span>\u003c/p>\n\u003cp>\u003cspan class=\"s1\">One of these was 1955, an incredibly wet year, with major flooding on the Sacramento and Feather rivers and all Northern California drainages.\u003c/span>\u003c/p>\n\u003cp>\u003cspan class=\"s1\">The gist of it is, anything can happen. There are no guarantees.\u003c/span>\u003c/p>\n\u003cp>\u003cspan class=\"s1\">If we go down to Climate Division 6, in coastal Southern California, then you can see that three of those were well below normal, two were slightly below normal and only one of the six was above normal.\u003c/span>\u003c/p>\n\u003ch2>\u003cspan class=\"s1\">\u003cb>Is it reasonable at this stage to say La Niña means another drought year?\u003c/b>\u003c/span>\u003c/h2>\n\u003cp>Jan Null: No, it’s not. Because, maybe we’ll have a 1955-56. And just look at this past winter. Was this past winter a drought year, or a break in the drought? If you’re in the northern half of the state, you’re probably saying it’s a break in the drought. If you’re in the southern half, you’re probably going to say the drought continues.\u003c/p>\n\u003cp>\u003cspan class=\"s1\">The bottom line, is I don’t have any answers. If anybody says they have answers, they’re selling you snake oil. There are no reliable tools for long-range weather forecasting, period. Five, seven, ten days have gotten phenomenally good. Out past that, it’s nothing I would get my wallet out for.\u003c/span>\u003c/p>\n\u003ch2>\u003cspan class=\"s1\">\u003cb>What does the timing look like for this La Niña?\u003c/b>\u003c/span>\u003c/h2>\n\u003cp>Jan Null: We kinda get into the negative category in midsummer, so somebody at the (National Weather Service) Climate Prediction Center will probably come out and say we’re in a La Niña officially. But it really doesn’t matter until we get to November, for the most part. Because that’s our rainy season, it kinda doesn’t matter what La Niña does between now and then. Our rainfall season is November through March.\u003c/p>\n\u003ch2>\u003cspan class=\"s1\">\u003cb>How should we be reacting to this La Niña?\u003c/b>\u003c/span>\u003c/h2>\n\u003cp>Jan Null: First of all, the people on TV should not be jumping up and down crying Chicken Little like they did with El Niño. The impacts of El Niño were not particularly well forecast. Even in print media, in headlines, they all focused on the extreme end of a wet El Niño, and they didn’t put in the range of solutions that were possible. It all became clickbait. So be wary of clickbait. Read the entire article.\u003c/p>\n\u003cp>\u003cspan class=\"s1\">Most of the articles have reasonably good data in them. But headlines do not portray that, and so much is driven by the headlines. That becomes people’s takeaway. So it makes it really tough for a good science message to get out there. I would tell people, read the science, don’t just read the headlines.\u003c/span>\u003c/p>\n\u003ch2>\u003cspan class=\"s1\">\u003cb>Is there anything influencing this La Niña that’s unusual?\u003c/b>\u003c/span>\u003c/h2>\n\u003cp>Jan Null: El Niño and La Niña are not the biggest phenomena. You have this whole other alphabet soup of things going on in the planet. You have the Pacific Decadal Oscillation, the Arctic Oscillation, the North Atlantic Oscillation. When they line up the right way, they can make a La Niña stronger.\u003c/p>\n\u003cp>\u003cspan class=\"s1\">But again it’s way too many variables, especially when they’re all interacting with each other. In some ways, it’s like a snake eating its tail. There are all these different feedbacks going on. I haven’t seen anybody who’s deciphered all of them.\u003c/span>\u003c/p>\n\u003ch2>\u003cspan class=\"s1\">\u003cb>Water Deeply:\u003c/b> \u003cb>What kind of La Niña should we root for?\u003c/b>\u003c/span>\u003c/h2>\n\u003cp>Jan Null: The La Niña is not going to be the same for everybody. If we’re going to get water in the state, and we can’t have it everywhere, I want it to be like this past winter. I want it to be where the biggest reservoirs are – in the north.\u003c/p>\n\u003ch2>\u003cspan class=\"s1\">\u003cb>What sort of La Niña is likely to deliver there?\u003c/b>\u003c/span>\u003c/h2>\n\u003cp>Jan Null:\u003cb> \u003c/b>The ones that have best probability there are the moderate La Niña. With a moderate, it’s 50/50 odds. For Southern California, the odds are much less. But there aren’t that many reservoirs in Southern California.\u003c/p>\n\u003cp>\u003cspan class=\"s1\">Of the 10 worst flood years … only four of those were El Niño, four were neutral and two were la Niña. So again, that’s a pretty big spread. But it does say, if we’re looking at La Niña, you can get flooding in a La Niña. And two of the most memorable flood years in the state were December 1955 and December 1964, and those were both La Niña years.\u003c/span>\u003c/p>\n\u003cp>\u003cspan class=\"s1\">There are no guarantees. The range of solutions is too big.\u003c/span>\u003c/p>\n\u003cp>\u003cspan class=\"s1\">Also, the 800-lb gorilla in the room is our warmer atmosphere over our warmer oceans. So how is this shifting the impact? With a moderate La Niña in 1955, is it the same as a moderate La Niña in 2016? We see that with land temperatures, precipitation patterns. Things don’t stay the same. They are evolving. You don’t keep the same average over time.\u003c/span>\u003c/p>\n\u003cp>[ad floatright]\u003c/p>\n\u003cp>\u003cem>\u003cspan class=\"start\">\u003ca href=\"https://www.newsdeeply.com/water/about/\">Water Deeply\u003c/a> is\u003c/span> an independent digital media project dedicated to covering California’s water crisis. The project is part of \u003ca href=\"http://www.newsdeeply.com/\" target=\"_blank\" rel=\"noopener\">News Deeply\u003c/a>, a new media startup and social enterprise based in New York.\u003c/em>\u003c/p>\n\n",
"stats": {
"hasVideo": false,
"hasChartOrMap": false,
"hasAudio": false,
"hasPolis": false,
"wordCount": 1570,
"hasGoogleForm": false,
"hasGallery": false,
"hasHearkenModule": false,
"iframeSrcs": [],
"paragraphCount": 28
},
"modified": 1704930223,
"excerpt": "With early forecasts that La Niña will take hold next winter, headlines are already warning this means another year of drought. But Jan Null, a consulting meteorologist, tells us a wide range of results are possible.",
"headData": {
"twImgId": "",
"twTitle": "",
"ogTitle": "",
"ogImgId": "",
"twDescription": "",
"description": "With early forecasts that La Niña will take hold next winter, headlines are already warning this means another year of drought. But Jan Null, a consulting meteorologist, tells us a wide range of results are possible.",
"title": "Why La Niña Does Not Ensure More Drought | KQED",
"ogDescription": "",
"schema": {
"@context": "https://schema.org",
"@type": "Article",
"headline": "Why La Niña Does Not Ensure More Drought",
"datePublished": "2016-05-05T11:10:14-07:00",
"dateModified": "2024-01-10T15:43:43-08:00",
"image": "https://cdn.kqed.org/wp-content/uploads/2020/02/KQED-OG-Image@1x.png"
}
},
"guestAuthors": [],
"slug": "why-la-nina-does-not-ensure-more-drought",
"status": "publish",
"nprByline": "Matt Weiser\u003c/br>Water Deeply",
"sticky": false,
"source": "Water Deeply",
"path": "/science/679017/why-la-nina-does-not-ensure-more-drought",
"audioTrackLength": null,
"parsedContent": [
{
"type": "contentString",
"content": "\u003cdiv class=\"post-body\">\u003cp>\u003cp>By now we’ve all heard the news that La Niña is the next weather phenomenon poised to toy with California. The National Oceanic and Atmospheric Administration on April 14 issued a “La Niña watch” indicating a 70 percent chance the weather phenomenon would likely take hold by the end of this calendar year.\u003c/p>\n\u003cp>\u003cspan class=\"s1\">Which was quickly followed by \u003ca href=\"http://www.usatoday.com/story/weather/2016/04/15/el-nino-la-nina/83078500/\" target=\"_blank\" rel=\"noopener\">\u003cspan class=\"s2\">headlines\u003c/span>\u003c/a> saying La Niña is likely to worsen the drought in California.\u003c/span>\u003c/p>\n\u003cp>\u003cspan class=\"s1\">Not so fast.\u003c/span>\u003c/p>\n\u003cp>\u003cspan class=\"s1\">Just as we learned this year there are no guarantees with El Niño, the same is true of its opposite. La Niña is defined by a marked cooling of the equatorial Pacific Ocean, which disrupts global weather patterns just like El Niño does. But instead of making the southwest wetter, it tends to make it drier while detouring storms toward the Pacific Northwest.\u003c/span>\u003c/p>\n\u003cfigure id=\"attachment_679021\" class=\"wp-caption alignleft\" style=\"max-width: 250px\">\u003cimg loading=\"lazy\" decoding=\"async\" class=\"size-full wp-image-679021\" src=\"http://ww2.kqed.org/science/wp-content/uploads/sites/35/2016/05/water-deeply_Jan-Null.jpg\" alt=\"Meterologist Jan Null is photographed at his home in Saratoga on Tuesday, March 31, 2015. Null runs Golden Gate Weather Services from home. \" width=\"250\" height=\"250\" srcset=\"https://cdn.kqed.org/wp-content/uploads/sites/35/2016/05/water-deeply_Jan-Null.jpg 250w, https://cdn.kqed.org/wp-content/uploads/sites/35/2016/05/water-deeply_Jan-Null-32x32.jpg 32w, https://cdn.kqed.org/wp-content/uploads/sites/35/2016/05/water-deeply_Jan-Null-64x64.jpg 64w, https://cdn.kqed.org/wp-content/uploads/sites/35/2016/05/water-deeply_Jan-Null-96x96.jpg 96w, https://cdn.kqed.org/wp-content/uploads/sites/35/2016/05/water-deeply_Jan-Null-128x128.jpg 128w, https://cdn.kqed.org/wp-content/uploads/sites/35/2016/05/water-deeply_Jan-Null-150x150.jpg 150w\" sizes=\"(max-width: 250px) 100vw, 250px\">\u003cfigcaption class=\"wp-caption-text\">Meterologist Jan Null is photographed at his home in Saratoga on Tuesday, March 31, 2015. Null runs Golden Gate Weather Services from home. \u003ccite>(Gary Reyes/Bay Area News Group)\u003c/cite>\u003c/figcaption>\u003c/figure>\n\u003cp>But it doesn’t always go down like that.\u003c/p>\n\u003cp>\u003c/p>\u003c/div>",
"attributes": {
"named": {},
"numeric": []
}
},
{
"type": "component",
"content": "",
"name": "ad",
"attributes": {
"named": {
"label": "fullwidth"
},
"numeric": [
"fullwidth"
]
}
},
{
"type": "contentString",
"content": "\u003cdiv class=\"post-body\">\u003cp>\u003c/p>\n\u003cp>\u003cspan class=\"s1\">To help us make sense of La Niña, Water Deeply asked Jan Null to explain things. Null is a consulting meteorologist and owner of \u003ca href=\"http://ggweather.com/\" target=\"_blank\" rel=\"nofollow noopener\">Golden Gate Weather Services\u003c/a> in Saratoga. He has also been a consistent voice of reason about El Niño when the media was often crying wolf.\u003c/span>\u003c/p>\n\u003ch2>\u003cspan class=\"s1\">\u003cb>Is La Niña coming?\u003c/b>\u003c/span>\u003c/h2>\n\u003cp>\u003cspan class=\"s1\">Jan Null: Probably. More and more, the computer models each of the last two months have been tilting into the negative category (in terms of sea surface temperature anomaly). That’s the sort of thing you start seeing. The average is now \u003c/span>−0.8 for all the dynamic and statistical models for November-December-January. If it’s colder than −0.5, then it gets into weak La Niña category. Between −0.5 and 1 is weak; Between −1 and −1.5 is moderate; greater than −1.5 is strong.\u003c/p>\n\u003ch2>\u003cspan class=\"s1\">\u003cb>Is it typical to have La Niña follow El Niño?\u003c/b>\u003c/span>\u003c/h2>\n\u003cp>Jan Null: There have now been 24 El Niños going back to 1950. If we look at the total number of La Niñas out of all 24, 17 of those became La Niñas. That’s a pretty high percentage. With the models all pointing toward cooling and with the data, we’re already seeing significant cooling in the Pacific; we’re certainly heading toward a La Niña. So we’ve decided we’re going to have a La Niña. The next thing is, how strong is that La Niña going to be? That’s the big question mark right now.\u003c/p>\n\u003ch2>\u003cspan class=\"s1\">\u003cb>How important is that to know?\u003c/b>\u003c/span>\u003c/h2>\n\u003cp>Jan Null: If we look at what the results are in the different categories, it starts giving us an idea of what has happened in the past. The signal is much less definite than with an El Niño. There’s a broader range of solutions under La Niña than under El Niño.\u003c/p>\n\u003cp>\u003cspan class=\"s1\">Let’s say we’re going to get into the moderate range. Then it’s important to look at effects on individual \u003ca href=\"http://www.cpc.ncep.noaa.gov/products/analysis_monitoring/regional_monitoring/CLIM_DIVS/california.gif\" target=\"_blank\" rel=\"noopener\">\u003cspan class=\"s2\">climate divisions\u003c/span>\u003c/a> in the state. Climate Division 2 is arguably the most important, encompassing the Northern Sierra Nevada and Northern Sacramento Valley. If we look at the six moderate La Niña events, three were less than normal rainfall and three were greater than normal. That doesn’t tell me anything. That’s a broad range of solutions for moderate El Niños.\u003c/span>\u003c/p>\n\u003cp>\u003cspan class=\"s1\">One of these was 1955, an incredibly wet year, with major flooding on the Sacramento and Feather rivers and all Northern California drainages.\u003c/span>\u003c/p>\n\u003cp>\u003cspan class=\"s1\">The gist of it is, anything can happen. There are no guarantees.\u003c/span>\u003c/p>\n\u003cp>\u003cspan class=\"s1\">If we go down to Climate Division 6, in coastal Southern California, then you can see that three of those were well below normal, two were slightly below normal and only one of the six was above normal.\u003c/span>\u003c/p>\n\u003ch2>\u003cspan class=\"s1\">\u003cb>Is it reasonable at this stage to say La Niña means another drought year?\u003c/b>\u003c/span>\u003c/h2>\n\u003cp>Jan Null: No, it’s not. Because, maybe we’ll have a 1955-56. And just look at this past winter. Was this past winter a drought year, or a break in the drought? If you’re in the northern half of the state, you’re probably saying it’s a break in the drought. If you’re in the southern half, you’re probably going to say the drought continues.\u003c/p>\n\u003cp>\u003cspan class=\"s1\">The bottom line, is I don’t have any answers. If anybody says they have answers, they’re selling you snake oil. There are no reliable tools for long-range weather forecasting, period. Five, seven, ten days have gotten phenomenally good. Out past that, it’s nothing I would get my wallet out for.\u003c/span>\u003c/p>\n\u003ch2>\u003cspan class=\"s1\">\u003cb>What does the timing look like for this La Niña?\u003c/b>\u003c/span>\u003c/h2>\n\u003cp>Jan Null: We kinda get into the negative category in midsummer, so somebody at the (National Weather Service) Climate Prediction Center will probably come out and say we’re in a La Niña officially. But it really doesn’t matter until we get to November, for the most part. Because that’s our rainy season, it kinda doesn’t matter what La Niña does between now and then. Our rainfall season is November through March.\u003c/p>\n\u003ch2>\u003cspan class=\"s1\">\u003cb>How should we be reacting to this La Niña?\u003c/b>\u003c/span>\u003c/h2>\n\u003cp>Jan Null: First of all, the people on TV should not be jumping up and down crying Chicken Little like they did with El Niño. The impacts of El Niño were not particularly well forecast. Even in print media, in headlines, they all focused on the extreme end of a wet El Niño, and they didn’t put in the range of solutions that were possible. It all became clickbait. So be wary of clickbait. Read the entire article.\u003c/p>\n\u003cp>\u003cspan class=\"s1\">Most of the articles have reasonably good data in them. But headlines do not portray that, and so much is driven by the headlines. That becomes people’s takeaway. So it makes it really tough for a good science message to get out there. I would tell people, read the science, don’t just read the headlines.\u003c/span>\u003c/p>\n\u003ch2>\u003cspan class=\"s1\">\u003cb>Is there anything influencing this La Niña that’s unusual?\u003c/b>\u003c/span>\u003c/h2>\n\u003cp>Jan Null: El Niño and La Niña are not the biggest phenomena. You have this whole other alphabet soup of things going on in the planet. You have the Pacific Decadal Oscillation, the Arctic Oscillation, the North Atlantic Oscillation. When they line up the right way, they can make a La Niña stronger.\u003c/p>\n\u003cp>\u003cspan class=\"s1\">But again it’s way too many variables, especially when they’re all interacting with each other. In some ways, it’s like a snake eating its tail. There are all these different feedbacks going on. I haven’t seen anybody who’s deciphered all of them.\u003c/span>\u003c/p>\n\u003ch2>\u003cspan class=\"s1\">\u003cb>Water Deeply:\u003c/b> \u003cb>What kind of La Niña should we root for?\u003c/b>\u003c/span>\u003c/h2>\n\u003cp>Jan Null: The La Niña is not going to be the same for everybody. If we’re going to get water in the state, and we can’t have it everywhere, I want it to be like this past winter. I want it to be where the biggest reservoirs are – in the north.\u003c/p>\n\u003ch2>\u003cspan class=\"s1\">\u003cb>What sort of La Niña is likely to deliver there?\u003c/b>\u003c/span>\u003c/h2>\n\u003cp>Jan Null:\u003cb> \u003c/b>The ones that have best probability there are the moderate La Niña. With a moderate, it’s 50/50 odds. For Southern California, the odds are much less. But there aren’t that many reservoirs in Southern California.\u003c/p>\n\u003cp>\u003cspan class=\"s1\">Of the 10 worst flood years … only four of those were El Niño, four were neutral and two were la Niña. So again, that’s a pretty big spread. But it does say, if we’re looking at La Niña, you can get flooding in a La Niña. And two of the most memorable flood years in the state were December 1955 and December 1964, and those were both La Niña years.\u003c/span>\u003c/p>\n\u003cp>\u003cspan class=\"s1\">There are no guarantees. The range of solutions is too big.\u003c/span>\u003c/p>\n\u003cp>\u003cspan class=\"s1\">Also, the 800-lb gorilla in the room is our warmer atmosphere over our warmer oceans. So how is this shifting the impact? With a moderate La Niña in 1955, is it the same as a moderate La Niña in 2016? We see that with land temperatures, precipitation patterns. Things don’t stay the same. They are evolving. You don’t keep the same average over time.\u003c/span>\u003c/p>\n\u003cp>\u003c/p>\u003c/div>",
"attributes": {
"named": {},
"numeric": []
}
},
{
"type": "component",
"content": "",
"name": "ad",
"attributes": {
"named": {
"label": "floatright"
},
"numeric": [
"floatright"
]
}
},
{
"type": "contentString",
"content": "\u003cdiv class=\"post-body\">\u003cp>\u003c/p>\n\u003cp>\u003cem>\u003cspan class=\"start\">\u003ca href=\"https://www.newsdeeply.com/water/about/\">Water Deeply\u003c/a> is\u003c/span> an independent digital media project dedicated to covering California’s water crisis. The project is part of \u003ca href=\"http://www.newsdeeply.com/\" target=\"_blank\" rel=\"noopener\">News Deeply\u003c/a>, a new media startup and social enterprise based in New York.\u003c/em>\u003c/p>\n\n\u003c/div>\u003c/p>",
"attributes": {
"named": {},
"numeric": []
}
}
],
"link": "/science/679017/why-la-nina-does-not-ensure-more-drought",
"authors": [
"byline_science_679017"
],
"categories": [
"science_31",
"science_40"
],
"featImg": "science_679023",
"label": "source_science_679017"
},
"science_674987": {
"type": "posts",
"id": "science_674987",
"meta": {
"index": "posts_1716263798",
"site": "science",
"id": "674987",
"score": null,
"sort": [
1462310336000
]
},
"parent": 0,
"labelTerm": {
"site": "science",
"term": 1151
},
"blocks": [],
"publishDate": 1462310336,
"format": "standard",
"title": "Californians Beat New, Relaxed Target for Water Savings",
"headTitle": "Californians Beat New, Relaxed Target for Water Savings | KQED",
"content": "\u003cp>Urban residents of California beat their goal for saving water in March by turning off their sprinklers when the rain fell.\u003c/p>\n\u003cp>The State Water Board says cities and businesses cut water use by more than 24 percent compared to the same month in 2013. Board chair Felicia Marcus called it “a stunningly welcome number” after a six-month run of declining conservation. The 24.3 percent mark doubled efforts in February, when much of California was dry, with record-high temperatures.\u003c/p>\n\u003cfigure id=\"attachment_675079\" class=\"wp-caption aligncenter\" style=\"max-width: 829px\">\u003cimg loading=\"lazy\" decoding=\"async\" class=\"size-full wp-image-675079\" src=\"http://ww2.kqed.org/science/wp-content/uploads/sites/35/2016/05/watercons_1603.png\" alt=\"March water conservation marked a significant reversal from several months of declining savings in California.\" width=\"829\" height=\"621\" srcset=\"https://cdn.kqed.org/wp-content/uploads/sites/35/2016/05/watercons_1603.png 829w, https://cdn.kqed.org/wp-content/uploads/sites/35/2016/05/watercons_1603-400x300.png 400w, https://cdn.kqed.org/wp-content/uploads/sites/35/2016/05/watercons_1603-800x599.png 800w, https://cdn.kqed.org/wp-content/uploads/sites/35/2016/05/watercons_1603-768x575.png 768w\" sizes=\"(max-width: 829px) 100vw, 829px\">\u003cfigcaption class=\"wp-caption-text\">March water conservation marked a significant reversal from several months of declining savings in California. \u003ccite>(State Water Resources Control Board)\u003c/cite>\u003c/figcaption>\u003c/figure>\n\u003cp>March is the first month under newly relaxed conservation requirements. Cities are now expected to use at least 20 percent less water, a break from the previous order of 25 percent.\u003c/p>\n\u003cp>A bright spot continues to be water use per capita by urban Californians, who have throttled back from an average of more than 100 gallons per person, per day in August, to 66 in March, with people in some locations using significantly less.\u003c/p>\n\u003cp>Officials say it’s an indication that Californians have stuck to some of the water habits they formed during the state’s most punishing drought on record.\u003c/p>\n\u003cp>[ad fullwidth]\u003c/p>\n\u003cp>An especially soggy March helped depress water use — especially outdoor irrigation — but rainfall in California tapers off dramatically at just this time of year; there’s unlikely to be any “May miracle.”\u003c/p>\n\u003cp>\u003c/p>\n\u003cp>“We need to keep conserving,” warns Marcus. “We may not need the same levels of conservation as last year, but we still need to keep all we can in our reservoirs and groundwater basins in case this winter is just a punctuation mark in a longer drought.”\u003c/p>\n\n",
"stats": {
"hasVideo": false,
"hasChartOrMap": false,
"hasAudio": false,
"hasPolis": false,
"wordCount": 297,
"hasGoogleForm": false,
"hasGallery": false,
"hasHearkenModule": false,
"iframeSrcs": [],
"paragraphCount": 9
},
"modified": 1704930230,
"excerpt": "A soggy March in Northern California helped the cause after warm, dry conditions drove up water use in February.",
"headData": {
"twImgId": "",
"twTitle": "",
"ogTitle": "",
"ogImgId": "",
"twDescription": "",
"description": "A soggy March in Northern California helped the cause after warm, dry conditions drove up water use in February.",
"title": "Californians Beat New, Relaxed Target for Water Savings | KQED",
"ogDescription": "",
"schema": {
"@context": "https://schema.org",
"@type": "Article",
"headline": "Californians Beat New, Relaxed Target for Water Savings",
"datePublished": "2016-05-03T14:18:56-07:00",
"dateModified": "2024-01-10T15:43:50-08:00",
"image": "https://cdn.kqed.org/wp-content/uploads/2020/02/KQED-OG-Image@1x.png"
}
},
"guestAuthors": [],
"slug": "californians-beat-new-relaxed-target-for-water-savings",
"status": "publish",
"sticky": false,
"path": "/science/674987/californians-beat-new-relaxed-target-for-water-savings",
"audioTrackLength": null,
"parsedContent": [
{
"type": "contentString",
"content": "\u003cdiv class=\"post-body\">\u003cp>\u003cp>Urban residents of California beat their goal for saving water in March by turning off their sprinklers when the rain fell.\u003c/p>\n\u003cp>The State Water Board says cities and businesses cut water use by more than 24 percent compared to the same month in 2013. Board chair Felicia Marcus called it “a stunningly welcome number” after a six-month run of declining conservation. The 24.3 percent mark doubled efforts in February, when much of California was dry, with record-high temperatures.\u003c/p>\n\u003cfigure id=\"attachment_675079\" class=\"wp-caption aligncenter\" style=\"max-width: 829px\">\u003cimg loading=\"lazy\" decoding=\"async\" class=\"size-full wp-image-675079\" src=\"http://ww2.kqed.org/science/wp-content/uploads/sites/35/2016/05/watercons_1603.png\" alt=\"March water conservation marked a significant reversal from several months of declining savings in California.\" width=\"829\" height=\"621\" srcset=\"https://cdn.kqed.org/wp-content/uploads/sites/35/2016/05/watercons_1603.png 829w, https://cdn.kqed.org/wp-content/uploads/sites/35/2016/05/watercons_1603-400x300.png 400w, https://cdn.kqed.org/wp-content/uploads/sites/35/2016/05/watercons_1603-800x599.png 800w, https://cdn.kqed.org/wp-content/uploads/sites/35/2016/05/watercons_1603-768x575.png 768w\" sizes=\"(max-width: 829px) 100vw, 829px\">\u003cfigcaption class=\"wp-caption-text\">March water conservation marked a significant reversal from several months of declining savings in California. \u003ccite>(State Water Resources Control Board)\u003c/cite>\u003c/figcaption>\u003c/figure>\n\u003cp>March is the first month under newly relaxed conservation requirements. Cities are now expected to use at least 20 percent less water, a break from the previous order of 25 percent.\u003c/p>\n\u003cp>A bright spot continues to be water use per capita by urban Californians, who have throttled back from an average of more than 100 gallons per person, per day in August, to 66 in March, with people in some locations using significantly less.\u003c/p>\n\u003cp>Officials say it’s an indication that Californians have stuck to some of the water habits they formed during the state’s most punishing drought on record.\u003c/p>\n\u003cp>\u003c/p>\u003c/div>",
"attributes": {
"named": {},
"numeric": []
}
},
{
"type": "component",
"content": "",
"name": "ad",
"attributes": {
"named": {
"label": "fullwidth"
},
"numeric": [
"fullwidth"
]
}
},
{
"type": "contentString",
"content": "\u003cdiv class=\"post-body\">\u003cp>\u003c/p>\n\u003cp>An especially soggy March helped depress water use — especially outdoor irrigation — but rainfall in California tapers off dramatically at just this time of year; there’s unlikely to be any “May miracle.”\u003c/p>\n\u003cp>\u003c/p>\n\u003cp>“We need to keep conserving,” warns Marcus. “We may not need the same levels of conservation as last year, but we still need to keep all we can in our reservoirs and groundwater basins in case this winter is just a punctuation mark in a longer drought.”\u003c/p>\n\n\u003c/div>\u003c/p>",
"attributes": {
"named": {},
"numeric": []
}
}
],
"link": "/science/674987/californians-beat-new-relaxed-target-for-water-savings",
"authors": [
"221"
],
"series": [
"science_1151"
],
"categories": [
"science_31",
"science_40",
"science_98"
],
"tags": [
"science_1622",
"science_876"
],
"featImg": "science_675101",
"label": "science_1151"
},
"science_674809": {
"type": "posts",
"id": "science_674809",
"meta": {
"index": "posts_1716263798",
"site": "science",
"id": "674809",
"score": null,
"sort": [
1462298264000
]
},
"parent": 0,
"labelTerm": {},
"blocks": [],
"publishDate": 1462298264,
"format": "standard",
"title": "Global Warming Is Starving West Coast Waters of Oxygen",
"headTitle": "Global Warming Is Starving West Coast Waters of Oxygen | KQED",
"content": "\u003cp>Just west of Los Angeles, decimated populations of spiny rockfish rummage for prey among bush-like corals. Cold currents from deep valleys wash nutrients between the Channel Islands, fertilizing plants that are eaten by fish. The fish are eaten by dolphins and pelicans and served with fries to diners watching ocean sunsets from Venice Beach.\u003c/p>\n\u003cp>Rockfish populations that crashed off the southern Californian coast in the 1990s have been protected by fishing rules and marine parks. But climate change is making a natural threat to the fish even worse.\u003c/p>\n\u003cp>[contextly_sidebar id=”Gne3W9AHBDJJeaZ5tF6m5XUHhj56nZqJ”]As atmospheric pollution warms the planet and its seas, oxygen levels are declining in the oceans, making it harder for the bottom-dwelling fish to breathe.\u003c/p>\n\u003cp>Ocean warming is projected to continue reducing oxygen levels in some hotspots that are naturally low in oxygen, such as the eastern Pacific Ocean. The oxygen declines in coastal waters like California’s threaten to create invisible chemical barriers, boxing vulnerable wildlife into smaller territories.\u003c/p>\n\u003cp>“The importance of oxygen loss has been underestimated or overlooked by ocean scientists,” said Lisa Levin, a Scripps Institution of Oceanography professor who is helping to pioneer research into the problem.\u003c/p>\n\u003cp>[ad fullwidth]\u003c/p>\n\u003cp>Levin’s lab published a study last week revealing the heavy influence of oxygen levels on the biodiversity of worms, molluscs and other creatures that live in West Coast mud, which are eaten by rockfish and other marine predators.\u003c/p>\n\u003cp>As oceans warm, fish and other sea animals need more oxygen, yet the sea water they breathe holds less of it. Ocean circulation changes caused by global warming can also reduce oxygen levels below the ocean’s surface, where it’s absorbed from the atmosphere.\u003c/p>\n\u003cp>That’s jeopardizing fisheries already afflicted by overfishing, wetland losses, water pollution, ocean warming and ocean acidification.\u003c/p>\n\u003cp>“For some things that can’t move, it’s going to kill them,” Levin said. “For things that can swim away, it’s going to shrink their habitat.”\u003c/p>\n\u003cp>Oxygen levels can be highly variable, and scientists are still trying to untangle the role climate change may have played in declining West Coast oxygen levels since the 1980s, some of which coincided with local ocean cooling.\u003c/p>\n\u003cp>Scripps and federal government scientists calculated in 2010 that the oxygen declines could reduce cowcod habitat in protected Southern California Bight areas by 18 percent by the 2020s, if trends continued.\u003c/p>\n\u003cp>“Ocean warming and ocean acidification have had much more attention,” Levin said. “The people who have been studying changes in oxygen didn’t raise the issue about global declines until probably eight years ago, and haven’t focused on communicating to the media, to the public, everywhere it needs to go.”\u003c/p>\n\u003cp>Levin led a three-person Scripps research team that analyzed data from biological surveys of ocean mud using advanced statistical techniques. They reported last week in the journal Proceedings of the Royal Society B that oxygen levels appear to have more influence than temperature or a measure of acidity over the number of small mud-dwelling species found on West Coast coastlines.\u003c/p>\n\u003cp>The results were very different when the researchers examined samples from a different region. In the Arabian sea, the scientists discovered that the measure of ocean acidity was more closely tied to biodiversity levels than oxygen concentrations.\u003c/p>\n\u003cp>The finding helped to illuminate the local and regional nature of the low-oxygen threat, and the complex relationships between warming, acidification and oxygen depletion that are being caused by climate change.\u003c/p>\n\u003cp>“If more data were available from another area, such as the East African coast, I suspect that may be different as well,” said Nancy Rabalais, a Louisiana Universities Marine Consortium professor who was not involved with the research.\u003c/p>\n\u003cp>Rabalais said the new Scripps study could help scientists predict how the three major ocean changes caused by global warming — warming, acidification and deoxygenation — could affect biodiversity in key marine habitats.\u003c/p>\n\u003cp>Each of the trifecta of global warming impacts tends to harm wildlife. Each of those impacts could be slowed if a United Nations climate treaty, which was negotiated in Paris in December, succeeds in sharply curbing fossil fuel use and deforestation.\u003c/p>\n\u003cp>Scientists point out that battered marine ecosystems would have greater chances of surviving impacts from warming if overfishing, plastic pollution and habitat destruction are also curbed. Marine parks can also help.\u003c/p>\n\u003cp>Extreme oxygen shortfalls already occur in seasonal dead zones, such as in the Gulf of Mexico, which is caused by farming and sewage pollution. By warming seawater, climate change can make dead zones bigger.\u003c/p>\n\u003cp>In areas where oxygen levels are naturally low, including off the West Coast and in the eastern Atlantic and southern Indian oceans, recent modeling showed climate change is already worsening the problem — which can fuel severe oxygen shortfalls that scientists call hypoxia.\u003c/p>\n\u003cp>Those impacts were projected by computer models to spread to additional regions during future years and decades. Some high-oxygen parts of oceans, by contrast, might not experience any impacts from the declines this century, the research showed.\u003c/p>\n\u003cp>“It’s hard to attribute a single year of hypoxia to warming,” said Curtis Deutsch, a professor at the University of Washington who contributed to the modeling analysis, which was published this year in the journal Global Biogeochemical Cycles. “And yet, at the same time, we expect it to become more frequent.”\u003c/p>\n\u003cp>Scientists like Deutsch are turning to models to try to understand how climate change may be influencing oxygen levels in oceans. Those concentrations are influenced by a confounding array of natural and human factors, and they haven’t been well measured.\u003c/p>\n\u003cp>“There are parts of the ocean where models predict that we can be detecting real, long-term changes in the ocean that are distinct from natural fluctuations right now,” Deutsch said. “For fisheries, it hasn’t been detected in data, but all of the indicators point toward this being an important concern for the future.”\u003c/p>\n\u003cp>The modeling study honed in on oxygen impacts in the open ocean, but it didn’t reveal or project more complicated changes in coastal regions, such as in the colorful coral and sponge habitats of the Southern California Bight.\u003c/p>\n\u003cp>The findings from the modeling runs corroborated those from similar studies that have been published in recent years.\u003c/p>\n\u003cp>“These are very expected results,” said John Dunne, a National Oceanic and Atmospheric Administration biogeochemist and climate modeler who has researched the topic.\u003c/p>\n\u003cp>Dunne said impacts from projected oxygen declines will matter most in parts of the ocean where levels are naturally low to begin with, such as along the West Coast, including the waters off Los Angeles.\u003c/p>\n\u003cp>Changes in southern California may already be squeezing decimated populations of fish that are popular with fishermen and diners, such as cowcod and other rockfish, into dangerously small territories, further threatening their survival.\u003c/p>\n\u003cp>[ad floatright]\u003c/p>\n\u003cp>“At high levels of oxygen, it doesn’t matter,” Dunne said. “At low levels of oxygen, it matters a great deal.”\u003c/p>\n\n",
"stats": {
"hasVideo": false,
"hasChartOrMap": false,
"hasAudio": false,
"hasPolis": false,
"wordCount": 1195,
"hasGoogleForm": false,
"hasGallery": false,
"hasHearkenModule": false,
"iframeSrcs": [],
"paragraphCount": 33
},
"modified": 1704930232,
"excerpt": "Global warming is reducing oxygen supplies for marine wildlife along the West Coast and elsewhere.",
"headData": {
"twImgId": "",
"twTitle": "",
"ogTitle": "",
"ogImgId": "",
"twDescription": "",
"description": "Global warming is reducing oxygen supplies for marine wildlife along the West Coast and elsewhere.",
"title": "Global Warming Is Starving West Coast Waters of Oxygen | KQED",
"ogDescription": "",
"schema": {
"@context": "https://schema.org",
"@type": "Article",
"headline": "Global Warming Is Starving West Coast Waters of Oxygen",
"datePublished": "2016-05-03T10:57:44-07:00",
"dateModified": "2024-01-10T15:43:52-08:00",
"image": "https://cdn.kqed.org/wp-content/uploads/2020/02/KQED-OG-Image@1x.png"
}
},
"guestAuthors": [],
"slug": "global-warming-is-starving-west-coast-waters-of-oxygen",
"status": "publish",
"sourceUrl": "http://www.climatecentral.org/",
"nprByline": "\u003ca href=\"http://www.climatecentral.org/\" target=\"_blank\">John Upton\u003c/a>\u003cbr>\u003ca href=\"http://www.climatecentral.org/\" target=\"_blank\">Climate Central\u003c/a>",
"sticky": false,
"source": "Climate Central",
"path": "/science/674809/global-warming-is-starving-west-coast-waters-of-oxygen",
"audioTrackLength": null,
"parsedContent": [
{
"type": "contentString",
"content": "\u003cdiv class=\"post-body\">\u003cp>\u003cp>Just west of Los Angeles, decimated populations of spiny rockfish rummage for prey among bush-like corals. Cold currents from deep valleys wash nutrients between the Channel Islands, fertilizing plants that are eaten by fish. The fish are eaten by dolphins and pelicans and served with fries to diners watching ocean sunsets from Venice Beach.\u003c/p>\n\u003cp>Rockfish populations that crashed off the southern Californian coast in the 1990s have been protected by fishing rules and marine parks. But climate change is making a natural threat to the fish even worse.\u003c/p>\n\u003cp>\u003c/p>\u003cp>\u003c/p>\u003cp>As atmospheric pollution warms the planet and its seas, oxygen levels are declining in the oceans, making it harder for the bottom-dwelling fish to breathe.\u003c/p>\n\u003cp>Ocean warming is projected to continue reducing oxygen levels in some hotspots that are naturally low in oxygen, such as the eastern Pacific Ocean. The oxygen declines in coastal waters like California’s threaten to create invisible chemical barriers, boxing vulnerable wildlife into smaller territories.\u003c/p>\n\u003cp>“The importance of oxygen loss has been underestimated or overlooked by ocean scientists,” said Lisa Levin, a Scripps Institution of Oceanography professor who is helping to pioneer research into the problem.\u003c/p>\n\u003cp>\u003c/p>\u003c/div>",
"attributes": {
"named": {},
"numeric": []
}
},
{
"type": "component",
"content": "",
"name": "ad",
"attributes": {
"named": {
"label": "fullwidth"
},
"numeric": [
"fullwidth"
]
}
},
{
"type": "contentString",
"content": "\u003cdiv class=\"post-body\">\u003cp>\u003c/p>\n\u003cp>Levin’s lab published a study last week revealing the heavy influence of oxygen levels on the biodiversity of worms, molluscs and other creatures that live in West Coast mud, which are eaten by rockfish and other marine predators.\u003c/p>\n\u003cp>As oceans warm, fish and other sea animals need more oxygen, yet the sea water they breathe holds less of it. Ocean circulation changes caused by global warming can also reduce oxygen levels below the ocean’s surface, where it’s absorbed from the atmosphere.\u003c/p>\n\u003cp>That’s jeopardizing fisheries already afflicted by overfishing, wetland losses, water pollution, ocean warming and ocean acidification.\u003c/p>\n\u003cp>“For some things that can’t move, it’s going to kill them,” Levin said. “For things that can swim away, it’s going to shrink their habitat.”\u003c/p>\n\u003cp>Oxygen levels can be highly variable, and scientists are still trying to untangle the role climate change may have played in declining West Coast oxygen levels since the 1980s, some of which coincided with local ocean cooling.\u003c/p>\n\u003cp>Scripps and federal government scientists calculated in 2010 that the oxygen declines could reduce cowcod habitat in protected Southern California Bight areas by 18 percent by the 2020s, if trends continued.\u003c/p>\n\u003cp>“Ocean warming and ocean acidification have had much more attention,” Levin said. “The people who have been studying changes in oxygen didn’t raise the issue about global declines until probably eight years ago, and haven’t focused on communicating to the media, to the public, everywhere it needs to go.”\u003c/p>\n\u003cp>Levin led a three-person Scripps research team that analyzed data from biological surveys of ocean mud using advanced statistical techniques. They reported last week in the journal Proceedings of the Royal Society B that oxygen levels appear to have more influence than temperature or a measure of acidity over the number of small mud-dwelling species found on West Coast coastlines.\u003c/p>\n\u003cp>The results were very different when the researchers examined samples from a different region. In the Arabian sea, the scientists discovered that the measure of ocean acidity was more closely tied to biodiversity levels than oxygen concentrations.\u003c/p>\n\u003cp>The finding helped to illuminate the local and regional nature of the low-oxygen threat, and the complex relationships between warming, acidification and oxygen depletion that are being caused by climate change.\u003c/p>\n\u003cp>“If more data were available from another area, such as the East African coast, I suspect that may be different as well,” said Nancy Rabalais, a Louisiana Universities Marine Consortium professor who was not involved with the research.\u003c/p>\n\u003cp>Rabalais said the new Scripps study could help scientists predict how the three major ocean changes caused by global warming — warming, acidification and deoxygenation — could affect biodiversity in key marine habitats.\u003c/p>\n\u003cp>Each of the trifecta of global warming impacts tends to harm wildlife. Each of those impacts could be slowed if a United Nations climate treaty, which was negotiated in Paris in December, succeeds in sharply curbing fossil fuel use and deforestation.\u003c/p>\n\u003cp>Scientists point out that battered marine ecosystems would have greater chances of surviving impacts from warming if overfishing, plastic pollution and habitat destruction are also curbed. Marine parks can also help.\u003c/p>\n\u003cp>Extreme oxygen shortfalls already occur in seasonal dead zones, such as in the Gulf of Mexico, which is caused by farming and sewage pollution. By warming seawater, climate change can make dead zones bigger.\u003c/p>\n\u003cp>In areas where oxygen levels are naturally low, including off the West Coast and in the eastern Atlantic and southern Indian oceans, recent modeling showed climate change is already worsening the problem — which can fuel severe oxygen shortfalls that scientists call hypoxia.\u003c/p>\n\u003cp>Those impacts were projected by computer models to spread to additional regions during future years and decades. Some high-oxygen parts of oceans, by contrast, might not experience any impacts from the declines this century, the research showed.\u003c/p>\n\u003cp>“It’s hard to attribute a single year of hypoxia to warming,” said Curtis Deutsch, a professor at the University of Washington who contributed to the modeling analysis, which was published this year in the journal Global Biogeochemical Cycles. “And yet, at the same time, we expect it to become more frequent.”\u003c/p>\n\u003cp>Scientists like Deutsch are turning to models to try to understand how climate change may be influencing oxygen levels in oceans. Those concentrations are influenced by a confounding array of natural and human factors, and they haven’t been well measured.\u003c/p>\n\u003cp>“There are parts of the ocean where models predict that we can be detecting real, long-term changes in the ocean that are distinct from natural fluctuations right now,” Deutsch said. “For fisheries, it hasn’t been detected in data, but all of the indicators point toward this being an important concern for the future.”\u003c/p>\n\u003cp>The modeling study honed in on oxygen impacts in the open ocean, but it didn’t reveal or project more complicated changes in coastal regions, such as in the colorful coral and sponge habitats of the Southern California Bight.\u003c/p>\n\u003cp>The findings from the modeling runs corroborated those from similar studies that have been published in recent years.\u003c/p>\n\u003cp>“These are very expected results,” said John Dunne, a National Oceanic and Atmospheric Administration biogeochemist and climate modeler who has researched the topic.\u003c/p>\n\u003cp>Dunne said impacts from projected oxygen declines will matter most in parts of the ocean where levels are naturally low to begin with, such as along the West Coast, including the waters off Los Angeles.\u003c/p>\n\u003cp>Changes in southern California may already be squeezing decimated populations of fish that are popular with fishermen and diners, such as cowcod and other rockfish, into dangerously small territories, further threatening their survival.\u003c/p>\n\u003cp>\u003c/p>\u003c/div>",
"attributes": {
"named": {},
"numeric": []
}
},
{
"type": "component",
"content": "",
"name": "ad",
"attributes": {
"named": {
"label": "floatright"
},
"numeric": [
"floatright"
]
}
},
{
"type": "contentString",
"content": "\u003cdiv class=\"post-body\">\u003cp>\u003c/p>\n\u003cp>“At high levels of oxygen, it doesn’t matter,” Dunne said. “At low levels of oxygen, it matters a great deal.”\u003c/p>\n\n\u003c/div>\u003c/p>",
"attributes": {
"named": {},
"numeric": []
}
}
],
"link": "/science/674809/global-warming-is-starving-west-coast-waters-of-oxygen",
"authors": [
"byline_science_674809"
],
"categories": [
"science_31",
"science_40",
"science_2873"
],
"featImg": "science_674811",
"label": "source_science_674809"
},
"science_662813": {
"type": "posts",
"id": "science_662813",
"meta": {
"index": "posts_1716263798",
"site": "science",
"id": "662813",
"score": null,
"sort": [
1461779377000
]
},
"parent": 0,
"labelTerm": {},
"blocks": [],
"publishDate": 1461779377,
"format": "standard",
"title": "Strong El Niño Helped Lower U.S. Heating Costs",
"headTitle": "Strong El Niño Helped Lower U.S. Heating Costs | KQED",
"content": "\u003cp>Was your heating bill a bit friendlier to your wallet this winter? If so, there’s a good chance you can thank El Niño.\u003c/p>\n\u003cp>The exceptionally strong El Niño in the Pacific has been driving \u003ca href=\"http://www.climatecentral.org/news/monster-el-nino-transforms-worlds-weather-20138\">chaotic weather\u003c/a> across the globe for months, but it also contributed to a mild winter in the U.S., which was about 15 percent warmer than the winter of 2014-2015.\u003cbr>\n[contextly_sidebar id=”zVCqv5TKYC3HFMByoxD0YLpimFkWBXMg”]\u003cbr>\nThe milder temperatures led people to use less energy to heat their homes compared to the previous winter, a new U.S. Department of Energy \u003ca href=\"http://www.eia.gov/todayinenergy/detail.cfm?id=25952\">report\u003c/a> shows. Above-normal temperatures contributed to a 16 percent drop in demand for propane used for heating, a 45 percent drop in heating oil consumption and a 6 percent decrease in electricity consumption compared to the winter of 2014-2015.\u003c/p>\n\u003cp>Heating demand nationwide declined as much as 27 percent in December compared to the average of the previous 10 winters as measured in \u003ca href=\"https://www.eia.gov/energyexplained/index.cfm?page=about_degree_days\">heating degree days\u003c/a>, a measure of how much utility bills increase as a result of the weather, according to the report.\u003c/p>\n\u003cp>Though heating demand in January matched the 10-year average, February demand was 17 percent below normal and March was 26 percent below normal.\u003c/p>\n\u003cp>Slade Johnson, an analyst for the U.S. Energy Information Administration, said it’s too early to know if such a dramatic fall in energy demand for home heating has been seen before until at least late spring when the nation’s heating season has passed.\u003c/p>\n\u003cp>[ad fullwidth]\u003c/p>\n\u003cp>“The El Niño event is still occurring, although it is expected to dissipate by late spring or early summer,” Johnson said.\u003c/p>\n\u003cp>The energy used for home heating is a contributor to climate change because of its use of natural gas, oil and electricity. Home heating accounts for about 63 percent of residential natural gas consumption, for example.\u003c/p>\n\u003cp>Heating oil is often used in place of natural gas and electricity in the northeast. Heating oil is a highly-polluting crude oil product that emits about the\u003ca href=\"http://www.eia.gov/tools/faqs/faq.cfm?id=73&t=11\">same amount\u003c/a> of carbon dioxide as diesel fuel — less than coal but more than gasoline.\u003c/p>\n\u003cp>About half of all households in the U.S. heat their homes with natural gas, the cleanest fossil fuel used for home heating, which emits roughly half the carbon dioxide as coal.\u003c/p>\n\u003cp>It won’t be possible to know the exact effect that El Niño had on U.S. greenhouse gas emissions from energy use this winter until the final numbers are tallied later this year, but emissions from U.S. energy consumption were down by 2.5 percent in 2015 compared to the previous year, EIA analyst Perry Lindstrom said.\u003c/p>\n\u003cp>\u003c/p>\n\u003cp>“Some of that was because of the warmer heating season — especially at the end of the year,” he said. “The other emissions effect is that, as a result of the above, natural gas prices were low and natural gas pushed out coal in electricity generation.”\u003c/p>\n\n",
"stats": {
"hasVideo": false,
"hasChartOrMap": false,
"hasAudio": false,
"hasPolis": false,
"wordCount": 510,
"hasGoogleForm": false,
"hasGallery": false,
"hasHearkenModule": false,
"iframeSrcs": [],
"paragraphCount": 13
},
"modified": 1704930257,
"excerpt": "Heating demand declined nationwide in December, February and March.",
"headData": {
"twImgId": "",
"twTitle": "",
"ogTitle": "",
"ogImgId": "",
"twDescription": "",
"description": "Heating demand declined nationwide in December, February and March.",
"title": "Strong El Niño Helped Lower U.S. Heating Costs | KQED",
"ogDescription": "",
"schema": {
"@context": "https://schema.org",
"@type": "Article",
"headline": "Strong El Niño Helped Lower U.S. Heating Costs",
"datePublished": "2016-04-27T10:49:37-07:00",
"dateModified": "2024-01-10T15:44:17-08:00",
"image": "https://cdn.kqed.org/wp-content/uploads/2020/02/KQED-OG-Image@1x.png"
}
},
"guestAuthors": [],
"slug": "strong-el-nino-helped-lower-u-s-heating-costs",
"status": "publish",
"sourceUrl": "http://www.climatecentral.org/",
"nprByline": "\u003ca href=\"http://www.climatecentral.org/what-we-do/people/bobby-magill\" target=\"_blank\">Bobby Magill\u003c/a>\u003c/br>\u003ca href=\"http://www.climatecentral.org/\" target=\"_blank\">Climate Central\u003c/a>",
"sticky": false,
"source": "Climate Central",
"path": "/science/662813/strong-el-nino-helped-lower-u-s-heating-costs",
"audioTrackLength": null,
"parsedContent": [
{
"type": "contentString",
"content": "\u003cdiv class=\"post-body\">\u003cp>\u003cp>Was your heating bill a bit friendlier to your wallet this winter? If so, there’s a good chance you can thank El Niño.\u003c/p>\n\u003cp>The exceptionally strong El Niño in the Pacific has been driving \u003ca href=\"http://www.climatecentral.org/news/monster-el-nino-transforms-worlds-weather-20138\">chaotic weather\u003c/a> across the globe for months, but it also contributed to a mild winter in the U.S., which was about 15 percent warmer than the winter of 2014-2015.\u003cbr>\n\u003c/p>\u003cp>\u003c/p>\u003cp>\u003cbr>\nThe milder temperatures led people to use less energy to heat their homes compared to the previous winter, a new U.S. Department of Energy \u003ca href=\"http://www.eia.gov/todayinenergy/detail.cfm?id=25952\">report\u003c/a> shows. Above-normal temperatures contributed to a 16 percent drop in demand for propane used for heating, a 45 percent drop in heating oil consumption and a 6 percent decrease in electricity consumption compared to the winter of 2014-2015.\u003c/p>\n\u003cp>Heating demand nationwide declined as much as 27 percent in December compared to the average of the previous 10 winters as measured in \u003ca href=\"https://www.eia.gov/energyexplained/index.cfm?page=about_degree_days\">heating degree days\u003c/a>, a measure of how much utility bills increase as a result of the weather, according to the report.\u003c/p>\n\u003cp>Though heating demand in January matched the 10-year average, February demand was 17 percent below normal and March was 26 percent below normal.\u003c/p>\n\u003cp>Slade Johnson, an analyst for the U.S. Energy Information Administration, said it’s too early to know if such a dramatic fall in energy demand for home heating has been seen before until at least late spring when the nation’s heating season has passed.\u003c/p>\n\u003cp>\u003c/p>\u003c/div>",
"attributes": {
"named": {},
"numeric": []
}
},
{
"type": "component",
"content": "",
"name": "ad",
"attributes": {
"named": {
"label": "fullwidth"
},
"numeric": [
"fullwidth"
]
}
},
{
"type": "contentString",
"content": "\u003cdiv class=\"post-body\">\u003cp>\u003c/p>\n\u003cp>“The El Niño event is still occurring, although it is expected to dissipate by late spring or early summer,” Johnson said.\u003c/p>\n\u003cp>The energy used for home heating is a contributor to climate change because of its use of natural gas, oil and electricity. Home heating accounts for about 63 percent of residential natural gas consumption, for example.\u003c/p>\n\u003cp>Heating oil is often used in place of natural gas and electricity in the northeast. Heating oil is a highly-polluting crude oil product that emits about the\u003ca href=\"http://www.eia.gov/tools/faqs/faq.cfm?id=73&t=11\">same amount\u003c/a> of carbon dioxide as diesel fuel — less than coal but more than gasoline.\u003c/p>\n\u003cp>About half of all households in the U.S. heat their homes with natural gas, the cleanest fossil fuel used for home heating, which emits roughly half the carbon dioxide as coal.\u003c/p>\n\u003cp>It won’t be possible to know the exact effect that El Niño had on U.S. greenhouse gas emissions from energy use this winter until the final numbers are tallied later this year, but emissions from U.S. energy consumption were down by 2.5 percent in 2015 compared to the previous year, EIA analyst Perry Lindstrom said.\u003c/p>\n\u003cp>\u003c/p>\n\u003cp>“Some of that was because of the warmer heating season — especially at the end of the year,” he said. “The other emissions effect is that, as a result of the above, natural gas prices were low and natural gas pushed out coal in electricity generation.”\u003c/p>\n\n\u003c/div>\u003c/p>",
"attributes": {
"named": {},
"numeric": []
}
}
],
"link": "/science/662813/strong-el-nino-helped-lower-u-s-heating-costs",
"authors": [
"byline_science_662813"
],
"categories": [
"science_31",
"science_33",
"science_35",
"science_40"
],
"tags": [
"science_371"
],
"featImg": "science_662890",
"label": "source_science_662813"
},
"science_654227": {
"type": "posts",
"id": "science_654227",
"meta": {
"index": "posts_1716263798",
"site": "science",
"id": "654227",
"score": null,
"sort": [
1461349951000
]
},
"parent": 0,
"labelTerm": {},
"blocks": [],
"publishDate": 1461349951,
"format": "standard",
"title": "Interactive: See How Much States Have Warmed Since the First Earth Day",
"headTitle": "Interactive: See How Much States Have Warmed Since the First Earth Day | KQED",
"content": "\u003cp>Since the first Earth Day was celebrated 46 years ago, average temperatures across the U.S. have been steadily rising. This \u003ca href=\"http://www.climatecentral.org/\" target=\"_blank\" rel=\"noopener\">Climate Central \u003c/a>interactive graphic shows a state-by-state analysis of those temperature trends.\u003c/p>\n\u003cp>Across most of the country, average temperatures have increased at a rate of about 0.13°F (0.07°C) per decade since 1910. That trend is in line with the broader trend of rising global temperatures fueled by the accumulation of heat-trapping greenhouse gases in the Earth’s atmosphere.\u003cbr>\n\u003c!-- iframe plugin v.4.3 wordpress.org/plugins/iframe/ -->\u003cbr>\n\u003ciframe loading=\"lazy\" width=\"725\" height=\"620\" frameborder=\"0\" scrolling=\"no\" src=\"http://www.climatecentral.org/wgts/Earth-Day-2016/map.html?utm_source=ext&utm_medium=embed&utm_campaign=EarthDay2016\" class=\"iframe-class\">\u003c/iframe>\u003cbr>\nOf course warming isn’t uniform across the planet, and some regions are warming faster than others. And since the 1970s, warming across the U.S. has accelerated. On average, temperatures in the contiguous 48 states have been warming at a rate of 0.45°F (0.25°C) per decade since 1970.\u003c/p>\n\u003cp>The fastest-warming states over that period were New Mexico, Arizona and Delaware, which warmed at a rate of more than 0.6°F (0.3°C) per decade. The slowest-warming states were South Carolina, Georgia and Missouri, which warmed at a rate of 0.3°F (0.17°C) per decade.\u003c/p>\n\u003cp>[ad fullwidth]\u003c/p>\u003cp>\u003c/p>\n",
"stats": {
"hasVideo": false,
"hasChartOrMap": true,
"hasAudio": false,
"hasPolis": false,
"wordCount": 196,
"hasGoogleForm": false,
"hasGallery": false,
"hasHearkenModule": false,
"iframeSrcs": [
"http://www.climatecentral.org/wgts/Earth-Day-2016/map.html"
],
"paragraphCount": 5
},
"modified": 1704930276,
"excerpt": "Climate change has cranked up temperatures across the U.S. since the first Earth Day celebration. Check your state's trend.",
"headData": {
"twImgId": "",
"twTitle": "",
"ogTitle": "",
"ogImgId": "",
"twDescription": "",
"description": "Climate change has cranked up temperatures across the U.S. since the first Earth Day celebration. Check your state's trend.",
"title": "Interactive: See How Much States Have Warmed Since the First Earth Day | KQED",
"ogDescription": "",
"schema": {
"@context": "https://schema.org",
"@type": "Article",
"headline": "Interactive: See How Much States Have Warmed Since the First Earth Day",
"datePublished": "2016-04-22T11:32:31-07:00",
"dateModified": "2024-01-10T15:44:36-08:00",
"image": "https://cdn.kqed.org/wp-content/uploads/2020/02/KQED-OG-Image@1x.png"
}
},
"guestAuthors": [],
"slug": "interactive-see-how-much-states-have-warmed-since-the-first-earth-day",
"status": "publish",
"nprByline": "Climate Central",
"sticky": false,
"source": "Climate Central",
"path": "/science/654227/interactive-see-how-much-states-have-warmed-since-the-first-earth-day",
"audioTrackLength": null,
"parsedContent": [
{
"type": "contentString",
"content": "\u003cdiv class=\"post-body\">\u003cp>\u003cp>Since the first Earth Day was celebrated 46 years ago, average temperatures across the U.S. have been steadily rising. This \u003ca href=\"http://www.climatecentral.org/\" target=\"_blank\" rel=\"noopener\">Climate Central \u003c/a>interactive graphic shows a state-by-state analysis of those temperature trends.\u003c/p>\n\u003cp>Across most of the country, average temperatures have increased at a rate of about 0.13°F (0.07°C) per decade since 1910. That trend is in line with the broader trend of rising global temperatures fueled by the accumulation of heat-trapping greenhouse gases in the Earth’s atmosphere.\u003cbr>\n\u003c!-- iframe plugin v.4.3 wordpress.org/plugins/iframe/ -->\u003cbr>\n\u003ciframe loading=\"lazy\" width=\"725\" height=\"620\" frameborder=\"0\" scrolling=\"no\" src=\"http://www.climatecentral.org/wgts/Earth-Day-2016/map.html?utm_source=ext&utm_medium=embed&utm_campaign=EarthDay2016\" class=\"iframe-class\">\u003c/iframe>\u003cbr>\nOf course warming isn’t uniform across the planet, and some regions are warming faster than others. And since the 1970s, warming across the U.S. has accelerated. On average, temperatures in the contiguous 48 states have been warming at a rate of 0.45°F (0.25°C) per decade since 1970.\u003c/p>\n\u003cp>The fastest-warming states over that period were New Mexico, Arizona and Delaware, which warmed at a rate of more than 0.6°F (0.3°C) per decade. The slowest-warming states were South Carolina, Georgia and Missouri, which warmed at a rate of 0.3°F (0.17°C) per decade.\u003c/p>\n\u003cp>\u003c/p>\u003c/div>",
"attributes": {
"named": {},
"numeric": []
}
},
{
"type": "component",
"content": "",
"name": "ad",
"attributes": {
"named": {
"label": "fullwidth"
},
"numeric": [
"fullwidth"
]
}
},
{
"type": "contentString",
"content": "\u003cdiv class=\"post-body\">\u003cp>\u003c/p>\u003cp>\u003c/p>\n\u003c/div>\u003c/p>",
"attributes": {
"named": {},
"numeric": []
}
}
],
"link": "/science/654227/interactive-see-how-much-states-have-warmed-since-the-first-earth-day",
"authors": [
"byline_science_654227"
],
"categories": [
"science_31",
"science_35",
"science_40"
],
"featImg": "science_654306",
"label": "source_science_654227"
},
"science_650571": {
"type": "posts",
"id": "science_650571",
"meta": {
"index": "posts_1716263798",
"site": "science",
"id": "650571",
"score": null,
"sort": [
1461176794000
]
},
"parent": 0,
"labelTerm": {},
"blocks": [],
"publishDate": 1461176794,
"format": "standard",
"title": "Can We Limit Global Temperature Rise?",
"headTitle": "Can We Limit Global Temperature Rise? | KQED",
"content": "\u003cp>Global leaders are meeting in New York this week to sign the Paris climate agreement. One of the expressed purposes of the document is to limit warming to “well below 2°C above pre-industrial levels and pursuing efforts to limit the temperature increase to 1.5°C.”\u003c/p>\n\u003cp>A Climate Central analysis shows that the world will have to dramatically accelerate emissions reductions if it wants to meet that goal. The average global temperature change for the first three months of 2016 was 1.48°C, essentially equaling the 1.5°C warming threshold agreed to by COP 21 negotiators in Paris last December.\u003c/p>\n\u003cp>February exceeded the 1.5°C target at 1.55°C, marking the first time the global average temperature has surpassed the sobering milestone in any month. March followed suit checking in at 1.5°C. January’s mark of 1.4°C, put the global average temperature change from early industrial levels for the first three months of 2016 at 1.48°C.\u003cbr>\n\u003c!-- iframe plugin v.4.3 wordpress.org/plugins/iframe/ -->\u003cbr>\n\u003ciframe loading=\"lazy\" width=\"720\" height=\"571\" frameborder=\"0\" scrolling=\"no\" src=\"http://www.climatecentral.org/wgts/new-baseline/index.html?utm_source=KQED&utm_medium=embed&utm_campaign=new-baseline\" class=\"iframe-class\">\u003c/iframe>\u003c/p>\n\u003cp>Climate Central scientists and statisticians made these calculations based on an average of global temperature data reported by NASA and the National Oceanic and Atmospheric Administration (NOAA). But rather than using the baselines those agencies employ, Climate Central compared 2016’s temperature anomalies to an 1881-1910 average temperature baseline, the earliest date for which global temperature data are considered reliable. NASA reports global temperature change in reference to a 1951-1980 climate baseline, and NOAA reports the anomaly in reference to a 20th century average temperature.\u003c/p>\n\u003cp>NASA’s data alone showed a February temperature anomaly of 1.63°C above early industrial levels with March at 1.54°C.\u003c/p>\n\u003cp>[ad fullwidth]\u003c/p>\n\u003cp>Calculating a baseline closer to the pre-industrial era provides a useful measure of global temperature for policymakers and the public to better track how successful the world’s efforts are in keeping global warming below agreed-upon thresholds.\u003c/p>\n\u003cp>A similar adjustment can be applied to some of the temperature change projections in the most recent IPCC report.\u003c/p>\n\u003cp>The IPCC AR5 Working Group 1 Report contains projections of future global surface temperature change according to several scenarios of future socio-economic development, most of which are presented using a baseline of 1986 to 2005. The IPCC chose this baseline in order to provide its readers a more immediate base of comparison, the climate of the present world, which people are familiar with. But these representations may suggest that the Paris goals are easier to reach than is true.\u003c/p>\n\u003cp>The IPCC’s presentation of these scenarios was not designed to inform the discussion about warming limits (e.g., 1.5°C, 2°C goals of the Paris COP21 agreements). But the Panel does provide a way to make its projections of future warming consistent with discussions about targets.\u003c/p>\n\u003cp>IPCC estimates, using the best and longest record available, show that the difference between the 1986-2005 global average temperature value used in most of the Panel’s projections, and pre-industrial global average temperature, is 0.61°C (0.55-0.67). Neglecting 0.61°C warming is not trivial, and makes a significant difference for the assessment of the goals established in Paris. In fact, 0.61°C amounts to about half the warming already experienced thus far.\u003c/p>\n\u003cp>To capture this warming and display the IPCC warming time series relative to the pre-industrial period, Climate Central adjusted a well known IPCC projection (SPM7(a)) to reflect a 1880-1910 baseline. This adjustment has a significant effect on the dates at which the 1.5 and 2°C thresholds are crossed, moving them up by about 15-20 years.\u003c/p>\n\u003cp>If current emissions trends continue (RCP8.5) we could cross the 1.5°C threshold in 10 to 15 years, somewhere between the years 2025-2030, compared to 2045-2050 when a 1985-2005 baseline is used.\u003c/p>\n\u003cp>The dramatic global hot streak that kicked off 2016 doesn’t mean the world has already failed to meet the goals in the Paris agreement. Three months do not make a year, and it is unlikely that 2016 will exceed the 1881-1910 climate-normal by 1.5°C. This year is also in the wake of a strong El Niño, when higher-than-average temperatures would be expected.\u003c/p>\n\u003cp>And of course, exceeding the 1.5°C threshold for even an entire year would not mean that global temperatures had in fact risen to that point, never (at least within our lifetime) to drop back below it as it’s too short of a timeframe to make that determination.\u003c/p>\n\u003cp>But the hot start for 2016 is a notable symbolic milestone. The day the world first crossed the 400 parts per million (ppm) threshold for atmospheric carbon dioxide heralded a future of ever increasing carbon dioxide. So too, do the first three months of 2016 send a clear signal of where our world is headed and how fast we are headed there if drastic actions to reduce carbon emissions are not taken immediately.\u003c/p>\n\u003ch3>\u003cstrong>Background\u003c/strong>\u003c/h3>\n\u003cp>On Dec.12, 2015, the 21\u003csup>st\u003c/sup> Conference of the Parties to the U.N. Framework Convention on Climate Change approved the Paris Agreement committing 195 nations of the world to “holding the increase in the global average temperature to well below 2°C above preindustrial levels and pursuing efforts to limit the temperature increase to 1.5°C.” The pact commits the world to adopt nationally determined policies to limit greenhouse gas emissions in accord with those goals.\u003c/p>\n\u003cp>The 2°C goal represents a temperature increase from a pre-industrial baseline that scientists believe will maintain the relatively stable climate conditions that humans and other species have adapted to over the previous 12,000 years. It will also minimize some of the worst impacts of climate change: drought, heat waves, heavy rain and flooding, and sea level rise. Limiting the global surface temperature increase to 1.5°C would lessen these impacts even further.\u003c/p>\n\u003cp>\u003cspan class=\"imgleft\">\u003cimg loading=\"lazy\" decoding=\"async\" src=\"http://assets.climatecentral.org/images/uploads/news/4_20_16_CC_new-baseline-methodology-table.png\" alt=\"\" width=\"600\" height=\"376\">\u003c/span>\u003c/p>\n\u003cp>1.5 and 2°C are not hard and fast limits beyond which disaster is imminent, but they are now the milestones by which the world measures all progress toward slowing global warming. And yet it is surprisingly difficult to find objective measures that answer the question, where are we today on the path toward meeting the 1.5 or 2°C goals?\u003c/p>\n\u003cp>Every month NOAA and NASA update their global surface temperature change analysis, using data from the Global Historical Climate Network, and methods validated in the peer-reviewed literature (Hansen et al. 2010; NCDC). The monthly updates are posted on their websites, and made available to the public along with the underlying data and assumptions that go into their calculations.\u003c/p>\n\u003cp>These calculations are enormously useful for understanding the magnitude and pace of global warming. In fact, they are the bedrock measurements validating the fact that our planet is warming at all.\u003c/p>\n\u003cp>But none present their results in comparison to a pre-industrial climate normal.\u003c/p>\n\u003ch3 id=\"methods\">\u003cstrong>Methods and Results\u003c/strong>\u003c/h3>\n\u003cp>The NASA and NOAA monthly updates are presented as anomalies, or as the deviation from a baseline climate normal, calculated as an average of a 30-year reference period, or the 20\u003csup>th\u003c/sup> century average; they do not represent an absolute temperature increase from a specific date. NASA presents their results in reference to a 1951 to 1980 average temperature, NOAA in reference to a 20\u003csup>th\u003c/sup> century average temperature.\u003c/p>\n\u003cp>The NASA results, calculated by Goddard Institute for Space Studies are published monthly on the NASA/GISS website (\u003ca href=\"http://data.giss.nasa.gov/gistemp/\">GISTEMP\u003c/a>). NOAA methods and monthly updates are published via the National Centers for Environmental Information \u003ca href=\"http://www.ncdc.noaa.gov/monitoring-references/\">here\u003c/a>.\u003c/p>\n\u003cp>Climate Central used data from NASA and NOAA to create an 1881 to 1910 climate normal for the months of January, February, and March. We then compared the reported monthly 2016 anomaly for each of these months to this “early-industrial” baseline reference period. These anomalies were then averaged to produce a mean monthly NASA/NOAA anomaly for each month. The results are presented below.\u003c/p>\n\u003cp>[ad floatright]\u003c/p>\n\u003cp>The NASA anomaly is considerably higher than the anomaly reported by NOAA. This reflects the fact the NASA’s calculations are tuned to account for temperature changes at the poles, where there are far fewer monitoring stations. NOAA relies only on historical station data and makes no adjustment to account for sparse records at the poles, where warming has been more rapid relative to non-polar regions.\u003c/p>\n\n",
"stats": {
"hasVideo": false,
"hasChartOrMap": true,
"hasAudio": false,
"hasPolis": false,
"wordCount": 1438,
"hasGoogleForm": false,
"hasGallery": false,
"hasHearkenModule": false,
"iframeSrcs": [
"http://www.climatecentral.org/wgts/new-baseline/index.html"
],
"paragraphCount": 28
},
"modified": 1704930292,
"excerpt": "This week, global leaders are meeting to sign the Paris climate agreement aiming to limit Earth's temperature increase to 1.5°C.",
"headData": {
"twImgId": "",
"twTitle": "",
"ogTitle": "",
"ogImgId": "",
"twDescription": "",
"description": "This week, global leaders are meeting to sign the Paris climate agreement aiming to limit Earth's temperature increase to 1.5°C.",
"title": "Can We Limit Global Temperature Rise? | KQED",
"ogDescription": "",
"schema": {
"@context": "https://schema.org",
"@type": "Article",
"headline": "Can We Limit Global Temperature Rise?",
"datePublished": "2016-04-20T11:26:34-07:00",
"dateModified": "2024-01-10T15:44:52-08:00",
"image": "https://cdn.kqed.org/wp-content/uploads/2020/02/KQED-OG-Image@1x.png"
}
},
"guestAuthors": [],
"slug": "can-we-limit-global-temperature-rise",
"status": "publish",
"nprByline": "Climate Central",
"sticky": false,
"source": "Climate Central",
"path": "/science/650571/can-we-limit-global-temperature-rise",
"audioTrackLength": null,
"parsedContent": [
{
"type": "contentString",
"content": "\u003cdiv class=\"post-body\">\u003cp>\u003cp>Global leaders are meeting in New York this week to sign the Paris climate agreement. One of the expressed purposes of the document is to limit warming to “well below 2°C above pre-industrial levels and pursuing efforts to limit the temperature increase to 1.5°C.”\u003c/p>\n\u003cp>A Climate Central analysis shows that the world will have to dramatically accelerate emissions reductions if it wants to meet that goal. The average global temperature change for the first three months of 2016 was 1.48°C, essentially equaling the 1.5°C warming threshold agreed to by COP 21 negotiators in Paris last December.\u003c/p>\n\u003cp>February exceeded the 1.5°C target at 1.55°C, marking the first time the global average temperature has surpassed the sobering milestone in any month. March followed suit checking in at 1.5°C. January’s mark of 1.4°C, put the global average temperature change from early industrial levels for the first three months of 2016 at 1.48°C.\u003cbr>\n\u003c!-- iframe plugin v.4.3 wordpress.org/plugins/iframe/ -->\u003cbr>\n\u003ciframe loading=\"lazy\" width=\"720\" height=\"571\" frameborder=\"0\" scrolling=\"no\" src=\"http://www.climatecentral.org/wgts/new-baseline/index.html?utm_source=KQED&utm_medium=embed&utm_campaign=new-baseline\" class=\"iframe-class\">\u003c/iframe>\u003c/p>\n\u003cp>Climate Central scientists and statisticians made these calculations based on an average of global temperature data reported by NASA and the National Oceanic and Atmospheric Administration (NOAA). But rather than using the baselines those agencies employ, Climate Central compared 2016’s temperature anomalies to an 1881-1910 average temperature baseline, the earliest date for which global temperature data are considered reliable. NASA reports global temperature change in reference to a 1951-1980 climate baseline, and NOAA reports the anomaly in reference to a 20th century average temperature.\u003c/p>\n\u003cp>NASA’s data alone showed a February temperature anomaly of 1.63°C above early industrial levels with March at 1.54°C.\u003c/p>\n\u003cp>\u003c/p>\u003c/div>",
"attributes": {
"named": {},
"numeric": []
}
},
{
"type": "component",
"content": "",
"name": "ad",
"attributes": {
"named": {
"label": "fullwidth"
},
"numeric": [
"fullwidth"
]
}
},
{
"type": "contentString",
"content": "\u003cdiv class=\"post-body\">\u003cp>\u003c/p>\n\u003cp>Calculating a baseline closer to the pre-industrial era provides a useful measure of global temperature for policymakers and the public to better track how successful the world’s efforts are in keeping global warming below agreed-upon thresholds.\u003c/p>\n\u003cp>A similar adjustment can be applied to some of the temperature change projections in the most recent IPCC report.\u003c/p>\n\u003cp>The IPCC AR5 Working Group 1 Report contains projections of future global surface temperature change according to several scenarios of future socio-economic development, most of which are presented using a baseline of 1986 to 2005. The IPCC chose this baseline in order to provide its readers a more immediate base of comparison, the climate of the present world, which people are familiar with. But these representations may suggest that the Paris goals are easier to reach than is true.\u003c/p>\n\u003cp>The IPCC’s presentation of these scenarios was not designed to inform the discussion about warming limits (e.g., 1.5°C, 2°C goals of the Paris COP21 agreements). But the Panel does provide a way to make its projections of future warming consistent with discussions about targets.\u003c/p>\n\u003cp>IPCC estimates, using the best and longest record available, show that the difference between the 1986-2005 global average temperature value used in most of the Panel’s projections, and pre-industrial global average temperature, is 0.61°C (0.55-0.67). Neglecting 0.61°C warming is not trivial, and makes a significant difference for the assessment of the goals established in Paris. In fact, 0.61°C amounts to about half the warming already experienced thus far.\u003c/p>\n\u003cp>To capture this warming and display the IPCC warming time series relative to the pre-industrial period, Climate Central adjusted a well known IPCC projection (SPM7(a)) to reflect a 1880-1910 baseline. This adjustment has a significant effect on the dates at which the 1.5 and 2°C thresholds are crossed, moving them up by about 15-20 years.\u003c/p>\n\u003cp>If current emissions trends continue (RCP8.5) we could cross the 1.5°C threshold in 10 to 15 years, somewhere between the years 2025-2030, compared to 2045-2050 when a 1985-2005 baseline is used.\u003c/p>\n\u003cp>The dramatic global hot streak that kicked off 2016 doesn’t mean the world has already failed to meet the goals in the Paris agreement. Three months do not make a year, and it is unlikely that 2016 will exceed the 1881-1910 climate-normal by 1.5°C. This year is also in the wake of a strong El Niño, when higher-than-average temperatures would be expected.\u003c/p>\n\u003cp>And of course, exceeding the 1.5°C threshold for even an entire year would not mean that global temperatures had in fact risen to that point, never (at least within our lifetime) to drop back below it as it’s too short of a timeframe to make that determination.\u003c/p>\n\u003cp>But the hot start for 2016 is a notable symbolic milestone. The day the world first crossed the 400 parts per million (ppm) threshold for atmospheric carbon dioxide heralded a future of ever increasing carbon dioxide. So too, do the first three months of 2016 send a clear signal of where our world is headed and how fast we are headed there if drastic actions to reduce carbon emissions are not taken immediately.\u003c/p>\n\u003ch3>\u003cstrong>Background\u003c/strong>\u003c/h3>\n\u003cp>On Dec.12, 2015, the 21\u003csup>st\u003c/sup> Conference of the Parties to the U.N. Framework Convention on Climate Change approved the Paris Agreement committing 195 nations of the world to “holding the increase in the global average temperature to well below 2°C above preindustrial levels and pursuing efforts to limit the temperature increase to 1.5°C.” The pact commits the world to adopt nationally determined policies to limit greenhouse gas emissions in accord with those goals.\u003c/p>\n\u003cp>The 2°C goal represents a temperature increase from a pre-industrial baseline that scientists believe will maintain the relatively stable climate conditions that humans and other species have adapted to over the previous 12,000 years. It will also minimize some of the worst impacts of climate change: drought, heat waves, heavy rain and flooding, and sea level rise. Limiting the global surface temperature increase to 1.5°C would lessen these impacts even further.\u003c/p>\n\u003cp>\u003cspan class=\"imgleft\">\u003cimg loading=\"lazy\" decoding=\"async\" src=\"http://assets.climatecentral.org/images/uploads/news/4_20_16_CC_new-baseline-methodology-table.png\" alt=\"\" width=\"600\" height=\"376\">\u003c/span>\u003c/p>\n\u003cp>1.5 and 2°C are not hard and fast limits beyond which disaster is imminent, but they are now the milestones by which the world measures all progress toward slowing global warming. And yet it is surprisingly difficult to find objective measures that answer the question, where are we today on the path toward meeting the 1.5 or 2°C goals?\u003c/p>\n\u003cp>Every month NOAA and NASA update their global surface temperature change analysis, using data from the Global Historical Climate Network, and methods validated in the peer-reviewed literature (Hansen et al. 2010; NCDC). The monthly updates are posted on their websites, and made available to the public along with the underlying data and assumptions that go into their calculations.\u003c/p>\n\u003cp>These calculations are enormously useful for understanding the magnitude and pace of global warming. In fact, they are the bedrock measurements validating the fact that our planet is warming at all.\u003c/p>\n\u003cp>But none present their results in comparison to a pre-industrial climate normal.\u003c/p>\n\u003ch3 id=\"methods\">\u003cstrong>Methods and Results\u003c/strong>\u003c/h3>\n\u003cp>The NASA and NOAA monthly updates are presented as anomalies, or as the deviation from a baseline climate normal, calculated as an average of a 30-year reference period, or the 20\u003csup>th\u003c/sup> century average; they do not represent an absolute temperature increase from a specific date. NASA presents their results in reference to a 1951 to 1980 average temperature, NOAA in reference to a 20\u003csup>th\u003c/sup> century average temperature.\u003c/p>\n\u003cp>The NASA results, calculated by Goddard Institute for Space Studies are published monthly on the NASA/GISS website (\u003ca href=\"http://data.giss.nasa.gov/gistemp/\">GISTEMP\u003c/a>). NOAA methods and monthly updates are published via the National Centers for Environmental Information \u003ca href=\"http://www.ncdc.noaa.gov/monitoring-references/\">here\u003c/a>.\u003c/p>\n\u003cp>Climate Central used data from NASA and NOAA to create an 1881 to 1910 climate normal for the months of January, February, and March. We then compared the reported monthly 2016 anomaly for each of these months to this “early-industrial” baseline reference period. These anomalies were then averaged to produce a mean monthly NASA/NOAA anomaly for each month. The results are presented below.\u003c/p>\n\u003cp>\u003c/p>\u003c/div>",
"attributes": {
"named": {},
"numeric": []
}
},
{
"type": "component",
"content": "",
"name": "ad",
"attributes": {
"named": {
"label": "floatright"
},
"numeric": [
"floatright"
]
}
},
{
"type": "contentString",
"content": "\u003cdiv class=\"post-body\">\u003cp>\u003c/p>\n\u003cp>The NASA anomaly is considerably higher than the anomaly reported by NOAA. This reflects the fact the NASA’s calculations are tuned to account for temperature changes at the poles, where there are far fewer monitoring stations. NOAA relies only on historical station data and makes no adjustment to account for sparse records at the poles, where warming has been more rapid relative to non-polar regions.\u003c/p>\n\n\u003c/div>\u003c/p>",
"attributes": {
"named": {},
"numeric": []
}
}
],
"link": "/science/650571/can-we-limit-global-temperature-rise",
"authors": [
"byline_science_650571"
],
"categories": [
"science_31",
"science_35",
"science_40"
],
"featImg": "science_650654",
"label": "source_science_650571"
},
"science_650562": {
"type": "posts",
"id": "science_650562",
"meta": {
"index": "posts_1716263798",
"site": "science",
"id": "650562",
"score": null,
"sort": [
1461174826000
]
},
"parent": 0,
"labelTerm": {},
"blocks": [],
"publishDate": 1461174826,
"format": "image",
"title": "Climate Change? Some People May Not Be Sweating It Because the Weather Is Nicer",
"headTitle": "Climate Change? Some People May Not Be Sweating It Because the Weather Is Nicer | KQED",
"content": "\u003cp>For millions of Americans, climate change is making the weather nicer. That’s the conclusion of a new study that points out winters are getting quite a bit milder, while summers aren’t getting that much worse.\u003c/p>\n\u003cp>The study’s authors say the mild temperatures might be one reason some people aren’t so worried about climate change.\u003c/p>\n\u003cp>For most of the U.S., the hottest temperatures in July haven’t gone up much — scientific consensus is about half a degree over the past 40 years. Same for sticky humidity — not much change, if any.\u003c/p>\n\u003cp>But January’s highest temperatures have warmed up on average more than 4 degrees. Patrick Egan at New York University says for lots of people, that means weather many people view as “pleasant.”\u003c/p>\n\u003cp>I live here in New York City, and you’ve got shirtless beach volleyball games taking place on Christmas Eve in Central Park,” Egan says. “And on Christmas Day we had a cookout. We were all wearing shorts, and … it was bizarre and it was unusual. It was no Currier & Ives Christmas, but it was also pleasant.”\u003c/p>\n\u003cp>[ad fullwidth]\u003c/p>\n\u003cp>As they might say in New York, you got a problem with Santa in shorts?\u003c/p>\n\u003cp>Egan \u003ca href=\"http://politics.as.nyu.edu/object/PatrickEgan\">is a political scientist\u003c/a> who has studied why people live where they do, but the temperature numbers come from climate science. What Egan and colleague \u003ca href=\"https://nicholas.duke.edu/people/faculty/mullin\">Megan Mullin at Duke University\u003c/a> have done is calculate that about 80 percent of Americans live in places where winters are warming faster than summers. “You know, for many Americans,” Egan says, “they’re not experiencing really hot Julys as much as they are experiencing really warm winters. That’s really the crux of this study.”\u003c/p>\n\u003cp>Egan notes that research on where people choose to live shows that they often put a premium on warmer winters. So he says it’s fair to conclude that lots of people are enjoying the change in the weather — unless they’re skiers or snowboarders, perhaps. Egan and Mullin say that might be one reason many people aren’t so worried about climate change.\u003c/p>\n\u003cp>\u003ca href=\"http://www.nature.com/nature/journal/v532/n7599/full/nature17441.html\">Writing in the journal Nature\u003c/a>, Egan says public attitudes may change quickly when summer temperature increases start increasing faster, which scientists say will happen in several decades. How fast depends on whether and by how much the world cuts back on emissions of greenhouse gases.\u003c/p>\n\u003cp>\u003c/p>\n\u003cp>In the meantime, though, rapidly warming winters do pose all sorts of problems for plants and animals that can’t adapt as readily as people can. And while the U.S. hasn’t been hit too hard by heat waves, other parts of the world have, some of which are seeing summer maximum temperatures rise quickly.\u003c/p>\n\u003cdiv class=\"fullattribution\">Copyright 2016 NPR. To see more, visit http://www.npr.org/.\u003cimg decoding=\"async\" src=\"http://www.google-analytics.com/__utm.gif?utmac=UA-5828686-4&utmdt=Climate+Change%3F+Some+People+May+Not+Be+Sweating+It+Because+The+Weather+Is+Nicer&utme=8(APIKey)9(MDAxOTAwOTE4MDEyMTkxMDAzNjczZDljZA004)\" alt=\"\">\u003c/div>\n\n",
"stats": {
"hasVideo": false,
"hasChartOrMap": false,
"hasAudio": false,
"hasPolis": false,
"wordCount": 488,
"hasGoogleForm": false,
"hasGallery": false,
"hasHearkenModule": false,
"iframeSrcs": [],
"paragraphCount": 12
},
"modified": 1704930293,
"excerpt": "Researchers say climate change has made weather more pleasant in many parts of the U.S. Winters have been milder, and summers haven't become much hotter. But that's likely to change in coming years.",
"headData": {
"twImgId": "",
"twTitle": "",
"ogTitle": "",
"ogImgId": "",
"twDescription": "",
"description": "Researchers say climate change has made weather more pleasant in many parts of the U.S. Winters have been milder, and summers haven't become much hotter. But that's likely to change in coming years.",
"title": "Climate Change? Some People May Not Be Sweating It Because the Weather Is Nicer | KQED",
"ogDescription": "",
"schema": {
"@context": "https://schema.org",
"@type": "Article",
"headline": "Climate Change? Some People May Not Be Sweating It Because the Weather Is Nicer",
"datePublished": "2016-04-20T10:53:46-07:00",
"dateModified": "2024-01-10T15:44:53-08:00",
"image": "https://cdn.kqed.org/wp-content/uploads/2020/02/KQED-OG-Image@1x.png"
}
},
"guestAuthors": [],
"slug": "climate-change-some-people-may-not-be-sweating-it-because-the-weather-is-nicer",
"status": "publish",
"nprApiLink": "http://api.npr.org/query?id=474690481&apiKey=MDAxOTAwOTE4MDEyMTkxMDAzNjczZDljZA004",
"nprByline": "Christopher Joyce\u003c/br>NPR",
"nprStoryDate": "Wed, 20 Apr 2016 13:03:00 -0400",
"nprLastModifiedDate": "Wed, 20 Apr 2016 13:11:37 -0400",
"sticky": false,
"nprHtmlLink": "http://www.npr.org/sections/thetwo-way/2016/04/20/474690481/climate-change-some-people-may-not-be-sweating-it-because-the-weather-is-nicer?ft=nprml&f=474690481",
"nprImageAgency": "Boston Globe via Getty Images",
"nprImageCredit": "Suzanne Kreiter",
"source": "NPR",
"nprStoryId": "474690481",
"nprRetrievedStory": "1",
"nprPubDate": "Wed, 20 Apr 2016 13:11:00 -0400",
"path": "/science/650562/climate-change-some-people-may-not-be-sweating-it-because-the-weather-is-nicer",
"audioTrackLength": null,
"parsedContent": [
{
"type": "contentString",
"content": "\u003cdiv class=\"post-body\">\u003cp>\u003cp>For millions of Americans, climate change is making the weather nicer. That’s the conclusion of a new study that points out winters are getting quite a bit milder, while summers aren’t getting that much worse.\u003c/p>\n\u003cp>The study’s authors say the mild temperatures might be one reason some people aren’t so worried about climate change.\u003c/p>\n\u003cp>For most of the U.S., the hottest temperatures in July haven’t gone up much — scientific consensus is about half a degree over the past 40 years. Same for sticky humidity — not much change, if any.\u003c/p>\n\u003cp>But January’s highest temperatures have warmed up on average more than 4 degrees. Patrick Egan at New York University says for lots of people, that means weather many people view as “pleasant.”\u003c/p>\n\u003cp>I live here in New York City, and you’ve got shirtless beach volleyball games taking place on Christmas Eve in Central Park,” Egan says. “And on Christmas Day we had a cookout. We were all wearing shorts, and … it was bizarre and it was unusual. It was no Currier & Ives Christmas, but it was also pleasant.”\u003c/p>\n\u003cp>\u003c/p>\u003c/div>",
"attributes": {
"named": {},
"numeric": []
}
},
{
"type": "component",
"content": "",
"name": "ad",
"attributes": {
"named": {
"label": "fullwidth"
},
"numeric": [
"fullwidth"
]
}
},
{
"type": "contentString",
"content": "\u003cdiv class=\"post-body\">\u003cp>\u003c/p>\n\u003cp>As they might say in New York, you got a problem with Santa in shorts?\u003c/p>\n\u003cp>Egan \u003ca href=\"http://politics.as.nyu.edu/object/PatrickEgan\">is a political scientist\u003c/a> who has studied why people live where they do, but the temperature numbers come from climate science. What Egan and colleague \u003ca href=\"https://nicholas.duke.edu/people/faculty/mullin\">Megan Mullin at Duke University\u003c/a> have done is calculate that about 80 percent of Americans live in places where winters are warming faster than summers. “You know, for many Americans,” Egan says, “they’re not experiencing really hot Julys as much as they are experiencing really warm winters. That’s really the crux of this study.”\u003c/p>\n\u003cp>Egan notes that research on where people choose to live shows that they often put a premium on warmer winters. So he says it’s fair to conclude that lots of people are enjoying the change in the weather — unless they’re skiers or snowboarders, perhaps. Egan and Mullin say that might be one reason many people aren’t so worried about climate change.\u003c/p>\n\u003cp>\u003ca href=\"http://www.nature.com/nature/journal/v532/n7599/full/nature17441.html\">Writing in the journal Nature\u003c/a>, Egan says public attitudes may change quickly when summer temperature increases start increasing faster, which scientists say will happen in several decades. How fast depends on whether and by how much the world cuts back on emissions of greenhouse gases.\u003c/p>\n\u003cp>\u003c/p>\n\u003cp>In the meantime, though, rapidly warming winters do pose all sorts of problems for plants and animals that can’t adapt as readily as people can. And while the U.S. hasn’t been hit too hard by heat waves, other parts of the world have, some of which are seeing summer maximum temperatures rise quickly.\u003c/p>\n\u003cdiv class=\"fullattribution\">Copyright 2016 NPR. To see more, visit http://www.npr.org/.\u003cimg decoding=\"async\" src=\"http://www.google-analytics.com/__utm.gif?utmac=UA-5828686-4&utmdt=Climate+Change%3F+Some+People+May+Not+Be+Sweating+It+Because+The+Weather+Is+Nicer&utme=8(APIKey)9(MDAxOTAwOTE4MDEyMTkxMDAzNjczZDljZA004)\" alt=\"\">\u003c/div>\n\n\u003c/div>\u003c/p>",
"attributes": {
"named": {},
"numeric": []
}
}
],
"link": "/science/650562/climate-change-some-people-may-not-be-sweating-it-because-the-weather-is-nicer",
"authors": [
"byline_science_650562"
],
"categories": [
"science_31",
"science_35",
"science_40"
],
"featImg": "science_650569",
"label": "source_science_650562"
}
},
"podcastsReducer": {
"isFetching": false,
"fetchFailed": false,
"hasFetched": false,
"podcasts": {}
},
"radioProgramsReducer": {
"isFetching": false,
"fetchFailed": false,
"hasFetched": false,
"radioPrograms": {}
},
"radioSearchSegmentsReducer": {},
"programsReducer": {
"all-things-considered": {
"id": "all-things-considered",
"title": "All Things Considered",
"info": "Every weekday, \u003cem>All Things Considered\u003c/em> hosts Robert Siegel, Audie Cornish, Ari Shapiro, and Kelly McEvers present the program's trademark mix of news, interviews, commentaries, reviews, and offbeat features. Michel Martin hosts on the weekends.",
"airtime": "MON-FRI 1pm-2pm, 4:30pm-6:30pm\u003cbr />SAT-SUN 5pm-6pm",
"imageSrc": "https://cdn.kqed.org/wp-content/uploads/2024/04/All-Things-Considered-Podcast-Tile-360x360-1.jpg",
"officialWebsiteLink": "https://www.npr.org/programs/all-things-considered/",
"meta": {
"site": "news",
"source": "npr"
},
"link": "/radio/program/all-things-considered"
},
"american-suburb-podcast": {
"id": "american-suburb-podcast",
"title": "American Suburb: The Podcast",
"tagline": "The flip side of gentrification, told through one town",
"info": "Gentrification is changing cities across America, forcing people from neighborhoods they have long called home. Call them the displaced. Now those priced out of the Bay Area are looking for a better life in an unlikely place. American Suburb follows this migration to one California town along the Delta, 45 miles from San Francisco. But is this once sleepy suburb ready for them?",
"imageSrc": "https://cdn.kqed.org/wp-content/uploads/2024/04/American-Suburb-Podcast-Tile-703x703-1.jpg",
"officialWebsiteLink": "/news/series/american-suburb-podcast",
"meta": {
"site": "news",
"source": "kqed",
"order": 19
},
"link": "/news/series/american-suburb-podcast/",
"subscribe": {
"npr": "https://rpb3r.app.goo.gl/RBrW",
"apple": "https://itunes.apple.com/WebObjects/MZStore.woa/wa/viewPodcast?mt=2&id=1287748328",
"tuneIn": "https://tunein.com/radio/American-Suburb-p1086805/",
"rss": "https://ww2.kqed.org/news/series/american-suburb-podcast/feed/podcast",
"google": "https://podcasts.google.com/feed/aHR0cHM6Ly9mZWVkcy5tZWdhcGhvbmUuZm0vS1FJTkMzMDExODgxNjA5"
}
},
"baycurious": {
"id": "baycurious",
"title": "Bay Curious",
"tagline": "Exploring the Bay Area, one question at a time",
"info": "KQED’s new podcast, Bay Curious, gets to the bottom of the mysteries — both profound and peculiar — that give the Bay Area its unique identity. And we’ll do it with your help! You ask the questions. You decide what Bay Curious investigates. And you join us on the journey to find the answers.",
"imageSrc": "https://cdn.kqed.org/wp-content/uploads/2024/04/Bay-Curious-Podcast-Tile-703x703-1.jpg",
"imageAlt": "KQED Bay Curious",
"officialWebsiteLink": "/news/series/baycurious",
"meta": {
"site": "news",
"source": "kqed",
"order": 3
},
"link": "/podcasts/baycurious",
"subscribe": {
"apple": "https://podcasts.apple.com/us/podcast/bay-curious/id1172473406",
"npr": "https://www.npr.org/podcasts/500557090/bay-curious",
"rss": "https://ww2.kqed.org/news/category/bay-curious-podcast/feed/podcast",
"amazon": "https://music.amazon.com/podcasts/9a90d476-aa04-455d-9a4c-0871ed6216d4/bay-curious",
"stitcher": "https://www.stitcher.com/podcast/kqed/bay-curious",
"spotify": "https://open.spotify.com/show/6O76IdmhixfijmhTZLIJ8k"
}
},
"bbc-world-service": {
"id": "bbc-world-service",
"title": "BBC World Service",
"info": "The day's top stories from BBC News compiled twice daily in the week, once at weekends.",
"airtime": "MON-FRI 9pm-10pm, TUE-FRI 1am-2am",
"imageSrc": "https://cdn.kqed.org/wp-content/uploads/2024/04/BBC-World-Service-Podcast-Tile-360x360-1.jpg",
"officialWebsiteLink": "https://www.bbc.co.uk/sounds/play/live:bbc_world_service",
"meta": {
"site": "news",
"source": "BBC World Service"
},
"link": "/radio/program/bbc-world-service",
"subscribe": {
"apple": "https://itunes.apple.com/us/podcast/global-news-podcast/id135067274?mt=2",
"tuneIn": "https://tunein.com/radio/BBC-World-Service-p455581/",
"rss": "https://podcasts.files.bbci.co.uk/p02nq0gn.rss"
}
},
"californiareport": {
"id": "californiareport",
"title": "The California Report",
"tagline": "California, day by day",
"info": "KQED’s statewide radio news program providing daily coverage of issues, trends and public policy decisions.",
"imageSrc": "https://cdn.kqed.org/wp-content/uploads/2024/04/The-California-Report-Podcast-Tile-703x703-1.jpg",
"imageAlt": "KQED The California Report",
"officialWebsiteLink": "/californiareport",
"meta": {
"site": "news",
"source": "kqed",
"order": 8
},
"link": "/californiareport",
"subscribe": {
"apple": "https://podcasts.apple.com/us/podcast/kqeds-the-california-report/id79681292",
"amazon": "https://music.amazon.com/podcasts/26099305-72af-4542-9dde-ac1807fe36d5/kqed-s-the-california-report",
"npr": "https://www.npr.org/podcasts/432285393/the-california-report",
"stitcher": "https://www.stitcher.com/podcast/kqedfm-kqeds-the-california-report-podcast-8838",
"rss": "https://ww2.kqed.org/news/tag/tcram/feed/podcast"
}
},
"californiareportmagazine": {
"id": "californiareportmagazine",
"title": "The California Report Magazine",
"tagline": "Your state, your stories",
"info": "Every week, The California Report Magazine takes you on a road trip for the ears: to visit the places and meet the people who make California unique. The in-depth storytelling podcast from the California Report.",
"airtime": "FRI 4:30pm-5pm, 6:30pm-7pm, 11pm-11:30pm",
"imageSrc": "https://cdn.kqed.org/wp-content/uploads/2024/04/The-California-Report-Magazine-Podcast-Tile-703x703-1.jpg",
"imageAlt": "KQED The California Report Magazine",
"officialWebsiteLink": "/californiareportmagazine",
"meta": {
"site": "news",
"source": "kqed",
"order": 10
},
"link": "/californiareportmagazine",
"subscribe": {
"apple": "https://podcasts.apple.com/us/podcast/the-california-report-magazine/id1314750545",
"google": "https://podcasts.google.com/feed/aHR0cHM6Ly9mZWVkcy5tZWdhcGhvbmUuZm0vS1FJTkM3NjkwNjk1OTAz",
"npr": "https://www.npr.org/podcasts/564733126/the-california-report-magazine",
"stitcher": "https://www.stitcher.com/podcast/kqed/the-california-report-magazine",
"rss": "https://ww2.kqed.org/news/tag/tcrmag/feed/podcast"
}
},
"city-arts": {
"id": "city-arts",
"title": "City Arts & Lectures",
"info": "A one-hour radio program to hear celebrated writers, artists and thinkers address contemporary ideas and values, often discussing the creative process. Please note: tapes or transcripts are not available",
"imageSrc": "https://ww2.kqed.org/radio/wp-content/uploads/sites/50/2018/05/cityartsandlecture-300x300.jpg",
"officialWebsiteLink": "https://www.cityarts.net/",
"airtime": "SUN 1pm-2pm, TUE 10pm, WED 1am",
"meta": {
"site": "news",
"source": "City Arts & Lectures"
},
"link": "https://www.cityarts.net",
"subscribe": {
"tuneIn": "https://tunein.com/radio/City-Arts-and-Lectures-p692/",
"rss": "https://www.cityarts.net/feed/"
}
},
"closealltabs": {
"id": "closealltabs",
"title": "Close All Tabs",
"tagline": "Your irreverent guide to the trends redefining our world",
"info": "Close All Tabs breaks down how digital culture shapes our world through thoughtful insights and irreverent humor.",
"imageSrc": "https://cdn.kqed.org/wp-content/uploads/2025/02/CAT_2_Tile-scaled.jpg",
"imageAlt": "KQED Close All Tabs",
"officialWebsiteLink": "/podcasts/closealltabs",
"meta": {
"site": "news",
"source": "kqed",
"order": 1
},
"link": "/podcasts/closealltabs",
"subscribe": {
"apple": "https://podcasts.apple.com/us/podcast/close-all-tabs/id214663465",
"rss": "https://feeds.megaphone.fm/KQINC6993880386",
"amazon": "https://music.amazon.com/podcasts/92d9d4ac-67a3-4eed-b10a-fb45d45b1ef2/close-all-tabs",
"spotify": "https://open.spotify.com/show/6LAJFHnGK1pYXYzv6SIol6?si=deb0cae19813417c"
}
},
"code-switch-life-kit": {
"id": "code-switch-life-kit",
"title": "Code Switch / Life Kit",
"info": "\u003cem>Code Switch\u003c/em>, which listeners will hear in the first part of the hour, has fearless and much-needed conversations about race. Hosted by journalists of color, the show tackles the subject of race head-on, exploring how it impacts every part of society — from politics and pop culture to history, sports and more.\u003cbr />\u003cbr />\u003cem>Life Kit\u003c/em>, which will be in the second part of the hour, guides you through spaces and feelings no one prepares you for — from finances to mental health, from workplace microaggressions to imposter syndrome, from relationships to parenting. The show features experts with real world experience and shares their knowledge. Because everyone needs a little help being human.\u003cbr />\u003cbr />\u003ca href=\"https://www.npr.org/podcasts/510312/codeswitch\">\u003cem>Code Switch\u003c/em> offical site and podcast\u003c/a>\u003cbr />\u003ca href=\"https://www.npr.org/lifekit\">\u003cem>Life Kit\u003c/em> offical site and podcast\u003c/a>\u003cbr />",
"airtime": "SUN 9pm-10pm",
"imageSrc": "https://cdn.kqed.org/wp-content/uploads/2024/04/Code-Switch-Life-Kit-Podcast-Tile-360x360-1.jpg",
"meta": {
"site": "radio",
"source": "npr"
},
"link": "/radio/program/code-switch-life-kit",
"subscribe": {
"apple": "https://podcasts.apple.com/podcast/1112190608?mt=2&at=11l79Y&ct=nprdirectory",
"google": "https://podcasts.google.com/feed/aHR0cHM6Ly93d3cubnByLm9yZy9yc3MvcG9kY2FzdC5waHA_aWQ9NTEwMzEy",
"spotify": "https://open.spotify.com/show/3bExJ9JQpkwNhoHvaIIuyV",
"rss": "https://feeds.npr.org/510312/podcast.xml"
}
},
"commonwealth-club": {
"id": "commonwealth-club",
"title": "Commonwealth Club of California Podcast",
"info": "The Commonwealth Club of California is the nation's oldest and largest public affairs forum. As a non-partisan forum, The Club brings to the public airwaves diverse viewpoints on important topics. The Club's weekly radio broadcast - the oldest in the U.S., dating back to 1924 - is carried across the nation on public radio stations and is now podcasting. Our website archive features audio of our recent programs, as well as selected speeches from our long and distinguished history. This podcast feed is usually updated twice a week and is always un-edited.",
"airtime": "THU 10pm, FRI 1am",
"imageSrc": "https://cdn.kqed.org/wp-content/uploads/2024/04/Commonwealth-Club-Podcast-Tile-360x360-1.jpg",
"officialWebsiteLink": "https://www.commonwealthclub.org/podcasts",
"meta": {
"site": "news",
"source": "Commonwealth Club of California"
},
"link": "/radio/program/commonwealth-club",
"subscribe": {
"apple": "https://itunes.apple.com/us/podcast/commonwealth-club-of-california-podcast/id976334034?mt=2",
"google": "https://podcasts.google.com/feed/aHR0cDovL3d3dy5jb21tb253ZWFsdGhjbHViLm9yZy9hdWRpby9wb2RjYXN0L3dlZWtseS54bWw",
"tuneIn": "https://tunein.com/radio/Commonwealth-Club-of-California-p1060/"
}
},
"forum": {
"id": "forum",
"title": "Forum",
"tagline": "The conversation starts here",
"info": "KQED’s live call-in program discussing local, state, national and international issues, as well as in-depth interviews.",
"airtime": "MON-FRI 9am-11am, 10pm-11pm",
"imageSrc": "https://cdn.kqed.org/wp-content/uploads/2024/04/Forum-Podcast-Tile-703x703-1.jpg",
"imageAlt": "KQED Forum with Mina Kim and Alexis Madrigal",
"officialWebsiteLink": "/forum",
"meta": {
"site": "news",
"source": "kqed",
"order": 9
},
"link": "/forum",
"subscribe": {
"apple": "https://podcasts.apple.com/us/podcast/kqeds-forum/id73329719",
"google": "https://podcasts.google.com/feed/aHR0cHM6Ly9mZWVkcy5tZWdhcGhvbmUuZm0vS1FJTkM5NTU3MzgxNjMz",
"npr": "https://www.npr.org/podcasts/432307980/forum",
"stitcher": "https://www.stitcher.com/podcast/kqedfm-kqeds-forum-podcast",
"rss": "https://feeds.megaphone.fm/KQINC9557381633"
}
},
"freakonomics-radio": {
"id": "freakonomics-radio",
"title": "Freakonomics Radio",
"info": "Freakonomics Radio is a one-hour award-winning podcast and public-radio project hosted by Stephen Dubner, with co-author Steve Levitt as a regular guest. It is produced in partnership with WNYC.",
"imageSrc": "https://ww2.kqed.org/news/wp-content/uploads/sites/10/2018/05/freakonomicsRadio.png",
"officialWebsiteLink": "http://freakonomics.com/",
"airtime": "SUN 1am-2am, SAT 3pm-4pm",
"meta": {
"site": "radio",
"source": "WNYC"
},
"link": "/radio/program/freakonomics-radio",
"subscribe": {
"npr": "https://rpb3r.app.goo.gl/4s8b",
"apple": "https://itunes.apple.com/us/podcast/freakonomics-radio/id354668519",
"tuneIn": "https://tunein.com/podcasts/WNYC-Podcasts/Freakonomics-Radio-p272293/",
"rss": "https://feeds.feedburner.com/freakonomicsradio"
}
},
"fresh-air": {
"id": "fresh-air",
"title": "Fresh Air",
"info": "Hosted by Terry Gross, \u003cem>Fresh Air from WHYY\u003c/em> is the Peabody Award-winning weekday magazine of contemporary arts and issues. One of public radio's most popular programs, Fresh Air features intimate conversations with today's biggest luminaries.",
"airtime": "MON-FRI 7pm-8pm",
"imageSrc": "https://cdn.kqed.org/wp-content/uploads/2024/04/Fresh-Air-Podcast-Tile-360x360-1.jpg",
"officialWebsiteLink": "https://www.npr.org/programs/fresh-air/",
"meta": {
"site": "radio",
"source": "npr"
},
"link": "/radio/program/fresh-air",
"subscribe": {
"npr": "https://rpb3r.app.goo.gl/4s8b",
"apple": "https://itunes.apple.com/WebObjects/MZStore.woa/wa/viewPodcast?s=143441&mt=2&id=214089682&at=11l79Y&ct=nprdirectory",
"tuneIn": "https://tunein.com/radio/Fresh-Air-p17/",
"rss": "https://feeds.npr.org/381444908/podcast.xml"
}
},
"here-and-now": {
"id": "here-and-now",
"title": "Here & Now",
"info": "A live production of NPR and WBUR Boston, in collaboration with stations across the country, Here & Now reflects the fluid world of news as it's happening in the middle of the day, with timely, in-depth news, interviews and conversation. Hosted by Robin Young, Jeremy Hobson and Tonya Mosley.",
"airtime": "MON-THU 11am-12pm",
"imageSrc": "https://cdn.kqed.org/wp-content/uploads/2024/04/Here-And-Now-Podcast-Tile-360x360-1.jpg",
"officialWebsiteLink": "http://www.wbur.org/hereandnow",
"meta": {
"site": "news",
"source": "npr"
},
"link": "/radio/program/here-and-now",
"subsdcribe": {
"apple": "https://itunes.apple.com/WebObjects/MZStore.woa/wa/viewPodcast?mt=2&id=426698661",
"tuneIn": "https://tunein.com/radio/Here--Now-p211/",
"rss": "https://feeds.npr.org/510051/podcast.xml"
}
},
"hidden-brain": {
"id": "hidden-brain",
"title": "Hidden Brain",
"info": "Shankar Vedantam uses science and storytelling to reveal the unconscious patterns that drive human behavior, shape our choices and direct our relationships.",
"imageSrc": "https://ww2.kqed.org/radio/wp-content/uploads/sites/50/2018/05/hiddenbrain.jpg",
"officialWebsiteLink": "https://www.npr.org/series/423302056/hidden-brain",
"airtime": "SUN 7pm-8pm",
"meta": {
"site": "news",
"source": "NPR"
},
"link": "/radio/program/hidden-brain",
"subscribe": {
"apple": "https://itunes.apple.com/us/podcast/hidden-brain/id1028908750?mt=2",
"tuneIn": "https://tunein.com/podcasts/Science-Podcasts/Hidden-Brain-p787503/",
"rss": "https://feeds.npr.org/510308/podcast.xml"
}
},
"how-i-built-this": {
"id": "how-i-built-this",
"title": "How I Built This with Guy Raz",
"info": "Guy Raz dives into the stories behind some of the world's best known companies. How I Built This weaves a narrative journey about innovators, entrepreneurs and idealists—and the movements they built.",
"imageSrc": "https://ww2.kqed.org/news/wp-content/uploads/sites/10/2018/05/howIBuiltThis.png",
"officialWebsiteLink": "https://www.npr.org/podcasts/510313/how-i-built-this",
"airtime": "SUN 7:30pm-8pm",
"meta": {
"site": "news",
"source": "npr"
},
"link": "/radio/program/how-i-built-this",
"subscribe": {
"npr": "https://rpb3r.app.goo.gl/3zxy",
"apple": "https://itunes.apple.com/us/podcast/how-i-built-this-with-guy-raz/id1150510297?mt=2",
"tuneIn": "https://tunein.com/podcasts/Arts--Culture-Podcasts/How-I-Built-This-p910896/",
"rss": "https://feeds.npr.org/510313/podcast.xml"
}
},
"hyphenacion": {
"id": "hyphenacion",
"title": "Hyphenación",
"tagline": "Where conversation and cultura meet",
"info": "What kind of no sabo word is Hyphenación? For us, it’s about living within a hyphenation. Like being a third-gen Mexican-American from the Texas border now living that Bay Area Chicano life. Like Xorje! Each week we bring together a couple of hyphenated Latinos to talk all about personal life choices: family, careers, relationships, belonging … everything is on the table. ",
"imageSrc": "https://cdn.kqed.org/wp-content/uploads/2025/03/Hyphenacion_FinalAssets_PodcastTile.png",
"imageAlt": "KQED Hyphenación",
"officialWebsiteLink": "/podcasts/hyphenacion",
"meta": {
"site": "news",
"source": "kqed",
"order": 15
},
"link": "/podcasts/hyphenacion",
"subscribe": {
"apple": "https://podcasts.apple.com/us/podcast/hyphenaci%C3%B3n/id1191591838",
"spotify": "https://open.spotify.com/show/2p3Fifq96nw9BPcmFdIq0o?si=39209f7b25774f38",
"youtube": "https://www.youtube.com/c/kqedarts",
"amazon": "https://music.amazon.com/podcasts/6c3dd23c-93fb-4aab-97ba-1725fa6315f1/hyphenaci%C3%B3n",
"rss": "https://feeds.megaphone.fm/KQINC2275451163"
}
},
"jerrybrown": {
"id": "jerrybrown",
"title": "The Political Mind of Jerry Brown",
"tagline": "Lessons from a lifetime in politics",
"info": "The Political Mind of Jerry Brown brings listeners the wisdom of the former Governor, Mayor, and presidential candidate. Scott Shafer interviewed Brown for more than 40 hours, covering the former governor's life and half-century in the political game – and Brown has some lessons he'd like to share. ",
"imageSrc": "https://cdn.kqed.org/wp-content/uploads/2024/04/The-Political-Mind-of-Jerry-Brown-Podcast-Tile-703x703-1.jpg",
"imageAlt": "KQED The Political Mind of Jerry Brown",
"officialWebsiteLink": "/podcasts/jerrybrown",
"meta": {
"site": "news",
"source": "kqed",
"order": 18
},
"link": "/podcasts/jerrybrown",
"subscribe": {
"npr": "https://www.npr.org/podcasts/790253322/the-political-mind-of-jerry-brown",
"apple": "https://itunes.apple.com/us/podcast/id1492194549",
"rss": "https://ww2.kqed.org/news/series/jerrybrown/feed/podcast/",
"tuneIn": "http://tun.in/pjGcK",
"stitcher": "https://www.stitcher.com/podcast/kqed/the-political-mind-of-jerry-brown",
"spotify": "https://open.spotify.com/show/54C1dmuyFyKMFttY6X2j6r?si=K8SgRCoISNK6ZbjpXrX5-w",
"amazon": "https://music.amazon.com/podcasts/44420f75-3b0e-4301-ab3b-16da6b09e543/the-political-mind-of-jerry-brown"
}
},
"latino-usa": {
"id": "latino-usa",
"title": "Latino USA",
"airtime": "MON 1am-2am, SUN 6pm-7pm",
"info": "Latino USA, the radio journal of news and culture, is the only national, English-language radio program produced from a Latino perspective.",
"imageSrc": "https://ww2.kqed.org/radio/wp-content/uploads/sites/50/2018/04/latinoUsa.jpg",
"officialWebsiteLink": "http://latinousa.org/",
"meta": {
"site": "news",
"source": "npr"
},
"link": "/radio/program/latino-usa",
"subscribe": {
"npr": "https://rpb3r.app.goo.gl/xtTd",
"apple": "https://itunes.apple.com/WebObjects/MZStore.woa/wa/viewPodcast?s=143441&mt=2&id=79681317&at=11l79Y&ct=nprdirectory",
"tuneIn": "https://tunein.com/radio/Latino-USA-p621/",
"rss": "https://feeds.npr.org/510016/podcast.xml"
}
},
"marketplace": {
"id": "marketplace",
"title": "Marketplace",
"info": "Our flagship program, helmed by Kai Ryssdal, examines what the day in money delivered, through stories, conversations, newsworthy numbers and more. Updated Monday through Friday at about 3:30 p.m. PT.",
"airtime": "MON-FRI 4pm-4:30pm, MON-WED 6:30pm-7pm",
"imageSrc": "https://cdn.kqed.org/wp-content/uploads/2024/04/Marketplace-Podcast-Tile-360x360-1.jpg",
"officialWebsiteLink": "https://www.marketplace.org/",
"meta": {
"site": "news",
"source": "American Public Media"
},
"link": "/radio/program/marketplace",
"subscribe": {
"apple": "https://itunes.apple.com/WebObjects/MZStore.woa/wa/viewPodcast?s=143441&mt=2&id=201853034&at=11l79Y&ct=nprdirectory",
"tuneIn": "https://tunein.com/radio/APM-Marketplace-p88/",
"rss": "https://feeds.publicradio.org/public_feeds/marketplace-pm/rss/rss"
}
},
"masters-of-scale": {
"id": "masters-of-scale",
"title": "Masters of Scale",
"info": "Masters of Scale is an original podcast in which LinkedIn co-founder and Greylock Partner Reid Hoffman sets out to describe and prove theories that explain how great entrepreneurs take their companies from zero to a gazillion in ingenious fashion.",
"airtime": "Every other Wednesday June 12 through October 16 at 8pm (repeats Thursdays at 2am)",
"imageSrc": "https://cdn.kqed.org/wp-content/uploads/2024/04/Masters-of-Scale-Podcast-Tile-360x360-1.jpg",
"officialWebsiteLink": "https://mastersofscale.com/",
"meta": {
"site": "radio",
"source": "WaitWhat"
},
"link": "/radio/program/masters-of-scale",
"subscribe": {
"apple": "http://mastersofscale.app.link/",
"rss": "https://rss.art19.com/masters-of-scale"
}
},
"mindshift": {
"id": "mindshift",
"title": "MindShift",
"tagline": "A podcast about the future of learning and how we raise our kids",
"info": "The MindShift podcast explores the innovations in education that are shaping how kids learn. Hosts Ki Sung and Katrina Schwartz introduce listeners to educators, researchers, parents and students who are developing effective ways to improve how kids learn. We cover topics like how fed-up administrators are developing surprising tactics to deal with classroom disruptions; how listening to podcasts are helping kids develop reading skills; the consequences of overparenting; and why interdisciplinary learning can engage students on all ends of the traditional achievement spectrum. This podcast is part of the MindShift education site, a division of KQED News. KQED is an NPR/PBS member station based in San Francisco. You can also visit the MindShift website for episodes and supplemental blog posts or tweet us \u003ca href=\"https://twitter.com/MindShiftKQED\">@MindShiftKQED\u003c/a> or visit us at \u003ca href=\"/mindshift\">MindShift.KQED.org\u003c/a>",
"imageSrc": "https://cdn.kqed.org/wp-content/uploads/2024/04/Mindshift-Podcast-Tile-703x703-1.jpg",
"imageAlt": "KQED MindShift: How We Will Learn",
"officialWebsiteLink": "/mindshift/",
"meta": {
"site": "news",
"source": "kqed",
"order": 12
},
"link": "/podcasts/mindshift",
"subscribe": {
"apple": "https://podcasts.apple.com/us/podcast/mindshift-podcast/id1078765985",
"google": "https://podcasts.google.com/feed/aHR0cHM6Ly9mZWVkcy5tZWdhcGhvbmUuZm0vS1FJTkM1NzY0NjAwNDI5",
"npr": "https://www.npr.org/podcasts/464615685/mind-shift-podcast",
"stitcher": "https://www.stitcher.com/podcast/kqed/stories-teachers-share",
"spotify": "https://open.spotify.com/show/0MxSpNYZKNprFLCl7eEtyx"
}
},
"morning-edition": {
"id": "morning-edition",
"title": "Morning Edition",
"info": "\u003cem>Morning Edition\u003c/em> takes listeners around the country and the world with multi-faceted stories and commentaries every weekday. Hosts Steve Inskeep, David Greene and Rachel Martin bring you the latest breaking news and features to prepare you for the day.",
"airtime": "MON-FRI 3am-9am",
"imageSrc": "https://cdn.kqed.org/wp-content/uploads/2024/04/Morning-Edition-Podcast-Tile-360x360-1.jpg",
"officialWebsiteLink": "https://www.npr.org/programs/morning-edition/",
"meta": {
"site": "news",
"source": "npr"
},
"link": "/radio/program/morning-edition"
},
"onourwatch": {
"id": "onourwatch",
"title": "On Our Watch",
"tagline": "Deeply-reported investigative journalism",
"info": "For decades, the process for how police police themselves has been inconsistent – if not opaque. In some states, like California, these proceedings were completely hidden. After a new police transparency law unsealed scores of internal affairs files, our reporters set out to examine these cases and the shadow world of police discipline. On Our Watch brings listeners into the rooms where officers are questioned and witnesses are interrogated to find out who this system is really protecting. Is it the officers, or the public they've sworn to serve?",
"imageSrc": "https://cdn.kqed.org/wp-content/uploads/2024/04/On-Our-Watch-Podcast-Tile-703x703-1.jpg",
"imageAlt": "On Our Watch from NPR and KQED",
"officialWebsiteLink": "/podcasts/onourwatch",
"meta": {
"site": "news",
"source": "kqed",
"order": 11
},
"link": "/podcasts/onourwatch",
"subscribe": {
"apple": "https://podcasts.apple.com/podcast/id1567098962",
"google": "https://podcasts.google.com/feed/aHR0cHM6Ly9mZWVkcy5ucHIub3JnLzUxMDM2MC9wb2RjYXN0LnhtbD9zYz1nb29nbGVwb2RjYXN0cw",
"npr": "https://rpb3r.app.goo.gl/onourwatch",
"spotify": "https://open.spotify.com/show/0OLWoyizopu6tY1XiuX70x",
"tuneIn": "https://tunein.com/radio/On-Our-Watch-p1436229/",
"stitcher": "https://www.stitcher.com/show/on-our-watch",
"rss": "https://feeds.npr.org/510360/podcast.xml"
}
},
"on-the-media": {
"id": "on-the-media",
"title": "On The Media",
"info": "Our weekly podcast explores how the media 'sausage' is made, casts an incisive eye on fluctuations in the marketplace of ideas, and examines threats to the freedom of information and expression in America and abroad. For one hour a week, the show tries to lift the veil from the process of \"making media,\" especially news media, because it's through that lens that we see the world and the world sees us",
"airtime": "SUN 2pm-3pm, MON 12am-1am",
"imageSrc": "https://ww2.kqed.org/radio/wp-content/uploads/sites/50/2018/04/onTheMedia.png",
"officialWebsiteLink": "https://www.wnycstudios.org/shows/otm",
"meta": {
"site": "news",
"source": "wnyc"
},
"link": "/radio/program/on-the-media",
"subscribe": {
"apple": "https://itunes.apple.com/us/podcast/on-the-media/id73330715?mt=2",
"tuneIn": "https://tunein.com/radio/On-the-Media-p69/",
"rss": "http://feeds.wnyc.org/onthemedia"
}
},
"pbs-newshour": {
"id": "pbs-newshour",
"title": "PBS NewsHour",
"info": "Analysis, background reports and updates from the PBS NewsHour putting today's news in context.",
"airtime": "MON-FRI 3pm-4pm",
"imageSrc": "https://cdn.kqed.org/wp-content/uploads/2024/04/PBS-News-Hour-Podcast-Tile-360x360-1.jpg",
"officialWebsiteLink": "https://www.pbs.org/newshour/",
"meta": {
"site": "news",
"source": "pbs"
},
"link": "/radio/program/pbs-newshour",
"subscribe": {
"apple": "https://itunes.apple.com/us/podcast/pbs-newshour-full-show/id394432287?mt=2",
"tuneIn": "https://tunein.com/radio/PBS-NewsHour---Full-Show-p425698/",
"rss": "https://www.pbs.org/newshour/feeds/rss/podcasts/show"
}
},
"perspectives": {
"id": "perspectives",
"title": "Perspectives",
"tagline": "KQED's series of daily listener commentaries since 1991",
"info": "KQED's series of daily listener commentaries since 1991.",
"imageSrc": "https://cdn.kqed.org/wp-content/uploads/2025/01/Perspectives_Tile_Final.jpg",
"imageAlt": "KQED Perspectives",
"officialWebsiteLink": "/perspectives/",
"meta": {
"site": "radio",
"source": "kqed",
"order": 14
},
"link": "/perspectives",
"subscribe": {
"apple": "https://podcasts.apple.com/us/podcast/id73801135",
"npr": "https://www.npr.org/podcasts/432309616/perspectives",
"rss": "https://ww2.kqed.org/perspectives/category/perspectives/feed/",
"google": "https://podcasts.google.com/feed/aHR0cHM6Ly93dzIua3FlZC5vcmcvcGVyc3BlY3RpdmVzL2NhdGVnb3J5L3BlcnNwZWN0aXZlcy9mZWVkLw"
}
},
"planet-money": {
"id": "planet-money",
"title": "Planet Money",
"info": "The economy explained. Imagine you could call up a friend and say, Meet me at the bar and tell me what's going on with the economy. Now imagine that's actually a fun evening.",
"airtime": "SUN 3pm-4pm",
"imageSrc": "https://ww2.kqed.org/radio/wp-content/uploads/sites/50/2018/04/planetmoney.jpg",
"officialWebsiteLink": "https://www.npr.org/sections/money/",
"meta": {
"site": "news",
"source": "npr"
},
"link": "/radio/program/planet-money",
"subscribe": {
"npr": "https://rpb3r.app.goo.gl/M4f5",
"apple": "https://itunes.apple.com/us/podcast/planet-money/id290783428?mt=2",
"tuneIn": "https://tunein.com/podcasts/Business--Economics-Podcasts/Planet-Money-p164680/",
"rss": "https://feeds.npr.org/510289/podcast.xml"
}
},
"politicalbreakdown": {
"id": "politicalbreakdown",
"title": "Political Breakdown",
"tagline": "Politics from a personal perspective",
"info": "Political Breakdown is a new series that explores the political intersection of California and the nation. Each week hosts Scott Shafer and Marisa Lagos are joined with a new special guest to unpack politics -- with personality — and offer an insider’s glimpse at how politics happens.",
"airtime": "THU 6:30pm-7pm",
"imageSrc": "https://cdn.kqed.org/wp-content/uploads/2024/04/Political-Breakdown-2024-Podcast-Tile-703x703-1.jpg",
"imageAlt": "KQED Political Breakdown",
"officialWebsiteLink": "/podcasts/politicalbreakdown",
"meta": {
"site": "radio",
"source": "kqed",
"order": 5
},
"link": "/podcasts/politicalbreakdown",
"subscribe": {
"apple": "https://podcasts.apple.com/us/podcast/political-breakdown/id1327641087",
"amazon": "https://music.amazon.com/podcasts/e0c2d153-ad36-4c8d-901d-f1da6a724824/political-breakdown",
"npr": "https://www.npr.org/podcasts/572155894/political-breakdown",
"stitcher": "https://www.stitcher.com/podcast/kqed/political-breakdown",
"spotify": "https://open.spotify.com/show/07RVyIjIdk2WDuVehvBMoN",
"rss": "https://ww2.kqed.org/news/tag/political-breakdown/feed/podcast"
}
},
"possible": {
"id": "possible",
"title": "Possible",
"info": "Possible is hosted by entrepreneur Reid Hoffman and writer Aria Finger. Together in Possible, Hoffman and Finger lead enlightening discussions about building a brighter collective future. The show features interviews with visionary guests like Trevor Noah, Sam Altman and Janette Sadik-Khan. Possible paints an optimistic portrait of the world we can create through science, policy, business, art and our shared humanity. It asks: What if everything goes right for once? How can we get there? Each episode also includes a short fiction story generated by advanced AI GPT-4, serving as a thought-provoking springboard to speculate how humanity could leverage technology for good.",
"airtime": "SUN 2pm",
"imageSrc": "https://cdn.kqed.org/wp-content/uploads/2024/04/Possible-Podcast-Tile-360x360-1.jpg",
"officialWebsiteLink": "https://www.possible.fm/",
"meta": {
"site": "news",
"source": "Possible"
},
"link": "/radio/program/possible",
"subscribe": {
"apple": "https://podcasts.apple.com/us/podcast/possible/id1677184070",
"spotify": "https://open.spotify.com/show/730YpdUSNlMyPQwNnyjp4k"
}
},
"pri-the-world": {
"id": "pri-the-world",
"title": "PRI's The World: Latest Edition",
"info": "Each weekday, host Marco Werman and his team of producers bring you the world's most interesting stories in an hour of radio that reminds us just how small our planet really is.",
"airtime": "MON-FRI 2pm-3pm",
"imageSrc": "https://cdn.kqed.org/wp-content/uploads/2024/04/The-World-Podcast-Tile-360x360-1.jpg",
"officialWebsiteLink": "https://www.pri.org/programs/the-world",
"meta": {
"site": "news",
"source": "PRI"
},
"link": "/radio/program/pri-the-world",
"subscribe": {
"apple": "https://itunes.apple.com/us/podcast/pris-the-world-latest-edition/id278196007?mt=2",
"tuneIn": "https://tunein.com/podcasts/News--Politics-Podcasts/PRIs-The-World-p24/",
"rss": "http://feeds.feedburner.com/pri/theworld"
}
},
"radiolab": {
"id": "radiolab",
"title": "Radiolab",
"info": "A two-time Peabody Award-winner, Radiolab is an investigation told through sounds and stories, and centered around one big idea. In the Radiolab world, information sounds like music and science and culture collide. Hosted by Jad Abumrad and Robert Krulwich, the show is designed for listeners who demand skepticism, but appreciate wonder. WNYC Studios is the producer of other leading podcasts including Freakonomics Radio, Death, Sex & Money, On the Media and many more.",
"airtime": "SUN 12am-1am, SAT 2pm-3pm",
"imageSrc": "https://ww2.kqed.org/radio/wp-content/uploads/sites/50/2018/04/radiolab1400.png",
"officialWebsiteLink": "https://www.wnycstudios.org/shows/radiolab/",
"meta": {
"site": "science",
"source": "WNYC"
},
"link": "/radio/program/radiolab",
"subscribe": {
"apple": "https://itunes.apple.com/us/podcast/radiolab/id152249110?mt=2",
"tuneIn": "https://tunein.com/radio/RadioLab-p68032/",
"rss": "https://feeds.wnyc.org/radiolab"
}
},
"reveal": {
"id": "reveal",
"title": "Reveal",
"info": "Created by The Center for Investigative Reporting and PRX, Reveal is public radios first one-hour weekly radio show and podcast dedicated to investigative reporting. Credible, fact based and without a partisan agenda, Reveal combines the power and artistry of driveway moment storytelling with data-rich reporting on critically important issues. The result is stories that inform and inspire, arming our listeners with information to right injustices, hold the powerful accountable and improve lives.Reveal is hosted by Al Letson and showcases the award-winning work of CIR and newsrooms large and small across the nation. In a radio and podcast market crowded with choices, Reveal focuses on important and often surprising stories that illuminate the world for our listeners.",
"airtime": "SAT 4pm-5pm",
"imageSrc": "https://ww2.kqed.org/radio/wp-content/uploads/sites/50/2018/04/reveal300px.png",
"officialWebsiteLink": "https://www.revealnews.org/episodes/",
"meta": {
"site": "news",
"source": "npr"
},
"link": "/radio/program/reveal",
"subscribe": {
"apple": "https://itunes.apple.com/us/podcast/reveal/id886009669",
"tuneIn": "https://tunein.com/radio/Reveal-p679597/",
"rss": "http://feeds.revealradio.org/revealpodcast"
}
},
"rightnowish": {
"id": "rightnowish",
"title": "Rightnowish",
"tagline": "Art is where you find it",
"info": "Rightnowish digs into life in the Bay Area right now… ish. Journalist Pendarvis Harshaw takes us to galleries painted on the sides of liquor stores in West Oakland. We'll dance in warehouses in the Bayview, make smoothies with kids in South Berkeley, and listen to classical music in a 1984 Cutlass Supreme in Richmond. Every week, Pen talks to movers and shakers about how the Bay Area shapes what they create, and how they shape the place we call home.",
"imageSrc": "https://cdn.kqed.org/wp-content/uploads/2024/04/Rightnowish-Podcast-Tile-500x500-1.jpg",
"imageAlt": "KQED Rightnowish with Pendarvis Harshaw",
"officialWebsiteLink": "/podcasts/rightnowish",
"meta": {
"site": "arts",
"source": "kqed",
"order": 16
},
"link": "/podcasts/rightnowish",
"subscribe": {
"npr": "https://www.npr.org/podcasts/721590300/rightnowish",
"rss": "https://ww2.kqed.org/arts/programs/rightnowish/feed/podcast",
"apple": "https://podcasts.apple.com/us/podcast/rightnowish/id1482187648",
"stitcher": "https://www.stitcher.com/podcast/kqed/rightnowish",
"google": "https://podcasts.google.com/feed/aHR0cHM6Ly9mZWVkcy5tZWdhcGhvbmUuZm0vS1FJTkMxMjU5MTY3NDc4",
"spotify": "https://open.spotify.com/show/7kEJuafTzTVan7B78ttz1I"
}
},
"science-friday": {
"id": "science-friday",
"title": "Science Friday",
"info": "Science Friday is a weekly science talk show, broadcast live over public radio stations nationwide. Each week, the show focuses on science topics that are in the news and tries to bring an educated, balanced discussion to bear on the scientific issues at hand. Panels of expert guests join host Ira Flatow, a veteran science journalist, to discuss science and to take questions from listeners during the call-in portion of the program.",
"airtime": "FRI 11am-1pm",
"imageSrc": "https://cdn.kqed.org/wp-content/uploads/2024/04/Science-Friday-Podcast-Tile-360x360-1.jpg",
"officialWebsiteLink": "https://www.wnycstudios.org/shows/science-friday",
"meta": {
"site": "news",
"source": "npr"
},
"link": "/radio/program/science-friday",
"subscribe": {
"apple": "https://itunes.apple.com/WebObjects/MZStore.woa/wa/viewPodcast?s=143441&mt=2&id=73329284&at=11l79Y&ct=nprdirectory",
"tuneIn": "https://tunein.com/radio/Science-Friday-p394/",
"rss": "http://feeds.wnyc.org/science-friday"
}
},
"snap-judgment": {
"id": "snap-judgment",
"title": "Snap Judgment",
"tagline": "Real stories with killer beats",
"info": "The Snap Judgment radio show and podcast mixes real stories with killer beats to produce cinematic, dramatic radio. Snap's musical brand of storytelling dares listeners to see the world through the eyes of another. This is storytelling... with a BEAT!! Snap first aired on public radio stations nationwide in July 2010. Today, Snap Judgment airs on over 450 public radio stations and is brought to the airwaves by KQED & PRX.",
"airtime": "SAT 1pm-2pm, 9pm-10pm",
"imageSrc": "https://cdn.kqed.org/wp-content/uploads/2024/05/Snap-Judgment-Podcast-Tile-703x703-1.jpg",
"imageAlt": "KQED Snap Judgment",
"officialWebsiteLink": "https://snapjudgment.org",
"meta": {
"site": "arts",
"source": "kqed",
"order": 4
},
"link": "https://snapjudgment.org",
"subscribe": {
"apple": "https://podcasts.apple.com/us/podcast/snap-judgment/id283657561",
"npr": "https://www.npr.org/podcasts/449018144/snap-judgment",
"stitcher": "https://www.pandora.com/podcast/snap-judgment/PC:241?source=stitcher-sunset",
"spotify": "https://open.spotify.com/show/3Cct7ZWmxHNAtLgBTqjC5v",
"rss": "https://snap.feed.snapjudgment.org/"
}
},
"soldout": {
"id": "soldout",
"title": "SOLD OUT: Rethinking Housing in America",
"tagline": "A new future for housing",
"info": "Sold Out: Rethinking Housing in America",
"imageSrc": "https://cdn.kqed.org/wp-content/uploads/2024/04/Sold-Out-Podcast-Tile-703x703-1.jpg",
"imageAlt": "KQED Sold Out: Rethinking Housing in America",
"officialWebsiteLink": "/podcasts/soldout",
"meta": {
"site": "news",
"source": "kqed",
"order": 13
},
"link": "/podcasts/soldout",
"subscribe": {
"npr": "https://www.npr.org/podcasts/911586047/s-o-l-d-o-u-t-a-new-future-for-housing",
"apple": "https://podcasts.apple.com/us/podcast/introducing-sold-out-rethinking-housing-in-america/id1531354937",
"rss": "https://feeds.megaphone.fm/soldout",
"spotify": "https://open.spotify.com/show/38dTBSk2ISFoPiyYNoKn1X",
"stitcher": "https://www.stitcher.com/podcast/kqed/sold-out-rethinking-housing-in-america",
"tunein": "https://tunein.com/radio/SOLD-OUT-Rethinking-Housing-in-America-p1365871/"
}
},
"spooked": {
"id": "spooked",
"title": "Spooked",
"tagline": "True-life supernatural stories",
"info": "",
"imageSrc": "https://cdn.kqed.org/wp-content/uploads/2024/10/Spooked-Podcast-Tile-703x703-1.jpg",
"imageAlt": "KQED Spooked",
"officialWebsiteLink": "https://spookedpodcast.org/",
"meta": {
"site": "news",
"source": "kqed",
"order": 7
},
"link": "https://spookedpodcast.org/",
"subscribe": {
"apple": "https://podcasts.apple.com/us/podcast/spooked/id1279361017",
"npr": "https://www.npr.org/podcasts/549547848/snap-judgment-presents-spooked",
"spotify": "https://open.spotify.com/show/76571Rfl3m7PLJQZKQIGCT",
"rss": "https://feeds.simplecast.com/TBotaapn"
}
},
"tech-nation": {
"id": "tech-nation",
"title": "Tech Nation Radio Podcast",
"info": "Tech Nation is a weekly public radio program, hosted by Dr. Moira Gunn. Founded in 1993, it has grown from a simple interview show to a multi-faceted production, featuring conversations with noted technology and science leaders, and a weekly science and technology-related commentary.",
"airtime": "FRI 10pm",
"imageSrc": "https://cdn.kqed.org/wp-content/uploads/2024/04/Tech-Nation-Radio-Podcast-Tile-360x360-1.jpg",
"officialWebsiteLink": "http://technation.podomatic.com/",
"meta": {
"site": "science",
"source": "Tech Nation Media"
},
"link": "/radio/program/tech-nation",
"subscribe": {
"rss": "https://technation.podomatic.com/rss2.xml"
}
},
"ted-radio-hour": {
"id": "ted-radio-hour",
"title": "TED Radio Hour",
"info": "The TED Radio Hour is a journey through fascinating ideas, astonishing inventions, fresh approaches to old problems, and new ways to think and create.",
"airtime": "SUN 3pm-4pm, SAT 10pm-11pm",
"imageSrc": "https://ww2.kqed.org/radio/wp-content/uploads/sites/50/2018/04/tedRadioHour.jpg",
"officialWebsiteLink": "https://www.npr.org/programs/ted-radio-hour/?showDate=2018-06-22",
"meta": {
"site": "news",
"source": "npr"
},
"link": "/radio/program/ted-radio-hour",
"subscribe": {
"npr": "https://rpb3r.app.goo.gl/8vsS",
"apple": "https://itunes.apple.com/WebObjects/MZStore.woa/wa/viewPodcast?s=143441&mt=2&id=523121474&at=11l79Y&ct=nprdirectory",
"tuneIn": "https://tunein.com/radio/TED-Radio-Hour-p418021/",
"rss": "https://feeds.npr.org/510298/podcast.xml"
}
},
"thebay": {
"id": "thebay",
"title": "The Bay",
"tagline": "Local news to keep you rooted",
"info": "Host Devin Katayama walks you through the biggest story of the day with reporters and newsmakers.",
"imageSrc": "https://cdn.kqed.org/wp-content/uploads/2024/04/The-Bay-Podcast-Tile-703x703-1.jpg",
"imageAlt": "KQED The Bay",
"officialWebsiteLink": "/podcasts/thebay",
"meta": {
"site": "radio",
"source": "kqed",
"order": 2
},
"link": "/podcasts/thebay",
"subscribe": {
"apple": "https://podcasts.apple.com/us/podcast/the-bay/id1350043452",
"amazon": "https://music.amazon.com/podcasts/d800ea4c-7a2c-42f2-b861-edaf78a5db0b/the-bay",
"npr": "https://www.npr.org/podcasts/586725995/the-bay",
"stitcher": "https://www.stitcher.com/podcast/kqed/the-bay",
"spotify": "https://open.spotify.com/show/4BIKBKIujizLHlIlBNaAqQ",
"rss": "https://feeds.megaphone.fm/KQINC8259786327"
}
},
"thelatest": {
"id": "thelatest",
"title": "The Latest",
"tagline": "Trusted local news in real time",
"info": "",
"imageSrc": "https://cdn.kqed.org/wp-content/uploads/2025/05/The-Latest-2025-Podcast-Tile-703x703-1.jpg",
"imageAlt": "KQED The Latest",
"officialWebsiteLink": "/thelatest",
"meta": {
"site": "news",
"source": "kqed",
"order": 6
},
"link": "/thelatest",
"subscribe": {
"apple": "https://podcasts.apple.com/us/podcast/the-latest-from-kqed/id1197721799",
"npr": "https://www.npr.org/podcasts/1257949365/the-latest-from-k-q-e-d",
"spotify": "https://open.spotify.com/show/5KIIXMgM9GTi5AepwOYvIZ?si=bd3053fec7244dba",
"rss": "https://feeds.megaphone.fm/KQINC9137121918"
}
},
"theleap": {
"id": "theleap",
"title": "The Leap",
"tagline": "What if you closed your eyes, and jumped?",
"info": "Stories about people making dramatic, risky changes, told by award-winning public radio reporter Judy Campbell.",
"imageSrc": "https://cdn.kqed.org/wp-content/uploads/2024/04/The-Leap-Podcast-Tile-703x703-1.jpg",
"imageAlt": "KQED The Leap",
"officialWebsiteLink": "/podcasts/theleap",
"meta": {
"site": "news",
"source": "kqed",
"order": 17
},
"link": "/podcasts/theleap",
"subscribe": {
"apple": "https://podcasts.apple.com/us/podcast/the-leap/id1046668171",
"npr": "https://www.npr.org/podcasts/447248267/the-leap",
"stitcher": "https://www.stitcher.com/podcast/kqed/the-leap",
"spotify": "https://open.spotify.com/show/3sSlVHHzU0ytLwuGs1SD1U",
"rss": "https://ww2.kqed.org/news/programs/the-leap/feed/podcast"
}
},
"the-moth-radio-hour": {
"id": "the-moth-radio-hour",
"title": "The Moth Radio Hour",
"info": "Since its launch in 1997, The Moth has presented thousands of true stories, told live and without notes, to standing-room-only crowds worldwide. Moth storytellers stand alone, under a spotlight, with only a microphone and a roomful of strangers. The storyteller and the audience embark on a high-wire act of shared experience which is both terrifying and exhilarating. Since 2008, The Moth podcast has featured many of our favorite stories told live on Moth stages around the country. For information on all of our programs and live events, visit themoth.org.",
"airtime": "SAT 8pm-9pm and SUN 11am-12pm",
"imageSrc": "https://ww2.kqed.org/radio/wp-content/uploads/sites/50/2018/04/theMoth.jpg",
"officialWebsiteLink": "https://themoth.org/",
"meta": {
"site": "arts",
"source": "prx"
},
"link": "/radio/program/the-moth-radio-hour",
"subscribe": {
"apple": "https://itunes.apple.com/us/podcast/the-moth-podcast/id275699983?mt=2",
"tuneIn": "https://tunein.com/radio/The-Moth-p273888/",
"rss": "http://feeds.themoth.org/themothpodcast"
}
},
"the-new-yorker-radio-hour": {
"id": "the-new-yorker-radio-hour",
"title": "The New Yorker Radio Hour",
"info": "The New Yorker Radio Hour is a weekly program presented by the magazine's editor, David Remnick, and produced by WNYC Studios and The New Yorker. Each episode features a diverse mix of interviews, profiles, storytelling, and an occasional burst of humor inspired by the magazine, and shaped by its writers, artists, and editors. This isn't a radio version of a magazine, but something all its own, reflecting the rich possibilities of audio storytelling and conversation. Theme music for the show was composed and performed by Merrill Garbus of tUnE-YArDs.",
"airtime": "SAT 10am-11am",
"imageSrc": "https://cdn.kqed.org/wp-content/uploads/2024/04/The-New-Yorker-Podcast-Tile-360x360-1.jpg",
"officialWebsiteLink": "https://www.wnycstudios.org/shows/tnyradiohour",
"meta": {
"site": "arts",
"source": "WNYC"
},
"link": "/radio/program/the-new-yorker-radio-hour",
"subscribe": {
"apple": "https://itunes.apple.com/us/podcast/id1050430296",
"tuneIn": "https://tunein.com/podcasts/WNYC-Podcasts/New-Yorker-Radio-Hour-p803804/",
"rss": "https://feeds.feedburner.com/newyorkerradiohour"
}
},
"the-sam-sanders-show": {
"id": "the-sam-sanders-show",
"title": "The Sam Sanders Show",
"info": "One of public radio's most dynamic voices, Sam Sanders helped launch The NPR Politics Podcast and hosted NPR's hit show It's Been A Minute. Now, the award-winning host returns with something brand new, The Sam Sanders Show. Every week, Sam Sanders and friends dig into the culture that shapes our lives: what's driving the biggest trends, how artists really think, and even the memes you can't stop scrolling past. Sam is beloved for his way of unpacking the world and bringing you up close to fresh currents and engaging conversations. The Sam Sanders Show is smart, funny and always a good time.",
"airtime": "FRI 12-1pm AND SAT 11am-12pm",
"imageSrc": "https://cdn.kqed.org/wp-content/uploads/2025/11/The-Sam-Sanders-Show-Podcast-Tile-400x400-1.jpg",
"officialWebsiteLink": "https://www.kcrw.com/shows/the-sam-sanders-show/latest",
"meta": {
"site": "arts",
"source": "KCRW"
},
"link": "https://www.kcrw.com/shows/the-sam-sanders-show/latest",
"subscribe": {
"rss": "https://feed.cdnstream1.com/zjb/feed/download/ac/28/59/ac28594c-e1d0-4231-8728-61865cdc80e8.xml"
}
},
"the-splendid-table": {
"id": "the-splendid-table",
"title": "The Splendid Table",
"info": "\u003cem>The Splendid Table\u003c/em> hosts our nation's conversations about cooking, sustainability and food culture.",
"imageSrc": "https://cdn.kqed.org/wp-content/uploads/2024/04/The-Splendid-Table-Podcast-Tile-360x360-1.jpg",
"officialWebsiteLink": "https://www.splendidtable.org/",
"airtime": "SUN 10-11 pm",
"meta": {
"site": "radio",
"source": "npr"
},
"link": "/radio/program/the-splendid-table"
},
"this-american-life": {
"id": "this-american-life",
"title": "This American Life",
"info": "This American Life is a weekly public radio show, heard by 2.2 million people on more than 500 stations. Another 2.5 million people download the weekly podcast. It is hosted by Ira Glass, produced in collaboration with Chicago Public Media, delivered to stations by PRX The Public Radio Exchange, and has won all of the major broadcasting awards.",
"airtime": "SAT 12pm-1pm, 7pm-8pm",
"imageSrc": "https://ww2.kqed.org/radio/wp-content/uploads/sites/50/2018/04/thisAmericanLife.png",
"officialWebsiteLink": "https://www.thisamericanlife.org/",
"meta": {
"site": "news",
"source": "wbez"
},
"link": "/radio/program/this-american-life",
"subscribe": {
"apple": "https://itunes.apple.com/WebObjects/MZStore.woa/wa/viewPodcast?s=143441&mt=2&id=201671138&at=11l79Y&ct=nprdirectory",
"rss": "https://www.thisamericanlife.org/podcast/rss.xml"
}
},
"tinydeskradio": {
"id": "tinydeskradio",
"title": "Tiny Desk Radio",
"info": "We're bringing the best of Tiny Desk to the airwaves, only on public radio.",
"airtime": "SUN 8pm and SAT 9pm",
"imageSrc": "https://cdn.kqed.org/wp-content/uploads/2025/04/300x300-For-Member-Station-Logo-Tiny-Desk-Radio-@2x.png",
"officialWebsiteLink": "https://www.npr.org/series/g-s1-52030/tiny-desk-radio",
"meta": {
"site": "news",
"source": "npr"
},
"link": "/radio/program/tinydeskradio",
"subscribe": {
"rss": "https://feeds.npr.org/g-s1-52030/rss.xml"
}
},
"wait-wait-dont-tell-me": {
"id": "wait-wait-dont-tell-me",
"title": "Wait Wait... Don't Tell Me!",
"info": "Peter Sagal and Bill Kurtis host the weekly NPR News quiz show alongside some of the best and brightest news and entertainment personalities.",
"airtime": "SUN 10am-11am, SAT 11am-12pm, SAT 6pm-7pm",
"imageSrc": "https://cdn.kqed.org/wp-content/uploads/2024/04/Wait-Wait-Podcast-Tile-300x300-1.jpg",
"officialWebsiteLink": "https://www.npr.org/programs/wait-wait-dont-tell-me/",
"meta": {
"site": "news",
"source": "npr"
},
"link": "/radio/program/wait-wait-dont-tell-me",
"subscribe": {
"npr": "https://rpb3r.app.goo.gl/Xogv",
"apple": "https://itunes.apple.com/WebObjects/MZStore.woa/wa/viewPodcast?s=143441&mt=2&id=121493804&at=11l79Y&ct=nprdirectory",
"tuneIn": "https://tunein.com/radio/Wait-Wait-Dont-Tell-Me-p46/",
"rss": "https://feeds.npr.org/344098539/podcast.xml"
}
},
"weekend-edition-saturday": {
"id": "weekend-edition-saturday",
"title": "Weekend Edition Saturday",
"info": "Weekend Edition Saturday wraps up the week's news and offers a mix of analysis and features on a wide range of topics, including arts, sports, entertainment, and human interest stories. The two-hour program is hosted by NPR's Peabody Award-winning Scott Simon.",
"airtime": "SAT 5am-10am",
"imageSrc": "https://cdn.kqed.org/wp-content/uploads/2024/04/Weekend-Edition-Podcast-Tile-360x360-1.jpg",
"officialWebsiteLink": "https://www.npr.org/programs/weekend-edition-saturday/",
"meta": {
"site": "news",
"source": "npr"
},
"link": "/radio/program/weekend-edition-saturday"
},
"weekend-edition-sunday": {
"id": "weekend-edition-sunday",
"title": "Weekend Edition Sunday",
"info": "Weekend Edition Sunday features interviews with newsmakers, artists, scientists, politicians, musicians, writers, theologians and historians. The program has covered news events from Nelson Mandela's 1990 release from a South African prison to the capture of Saddam Hussein.",
"airtime": "SUN 5am-10am",
"imageSrc": "https://cdn.kqed.org/wp-content/uploads/2024/04/Weekend-Edition-Podcast-Tile-360x360-1.jpg",
"officialWebsiteLink": "https://www.npr.org/programs/weekend-edition-sunday/",
"meta": {
"site": "news",
"source": "npr"
},
"link": "/radio/program/weekend-edition-sunday"
}
},
"racesReducer": {},
"racesGenElectionReducer": {},
"racesGenElection2026Reducer": {},
"radioSchedulesReducer": {},
"listsReducer": {
"posts/science?category=climate": {
"isFetching": false,
"latestQuery": {
"from": 1188,
"size": 12
},
"vitalsOnly": false,
"totalRequested": 12,
"isLoading": false,
"isLoadingMore": true,
"total": {
"value": 1586,
"relation": "eq"
},
"items": [
"science_725648",
"science_687703",
"science_677501",
"science_679581",
"science_679114",
"science_679017",
"science_674987",
"science_674809",
"science_662813",
"science_654227",
"science_650571",
"science_650562"
],
"complete": true
}
},
"recallGuideReducer": {
"intros": {},
"policy": {},
"candidates": {}
},
"savedArticleReducer": {
"articles": [],
"status": {}
},
"newslettersReducer": {
"isFetching": false,
"fetchFailed": false,
"hasFetched": false,
"newsletters": {},
"isSubscribing": false,
"isUnsubscribing": false,
"subscribedNewsletters": {}
},
"termsReducer": {
"about": {
"name": "About",
"type": "terms",
"id": "about",
"slug": "about",
"link": "/about",
"taxonomy": "site"
},
"arts": {
"name": "Arts & Culture",
"grouping": [
"arts",
"pop",
"trulyca"
],
"description": "KQED Arts provides daily in-depth coverage of the Bay Area's music, art, film, performing arts, literature and arts news, as well as cultural commentary and criticism.",
"type": "terms",
"id": "arts",
"slug": "arts",
"link": "/arts",
"taxonomy": "site"
},
"artschool": {
"name": "Art School",
"parent": "arts",
"type": "terms",
"id": "artschool",
"slug": "artschool",
"link": "/artschool",
"taxonomy": "site"
},
"bayareabites": {
"name": "KQED food",
"grouping": [
"food",
"bayareabites",
"checkplease"
],
"parent": "food",
"type": "terms",
"id": "bayareabites",
"slug": "bayareabites",
"link": "/food",
"taxonomy": "site"
},
"bayareahiphop": {
"name": "Bay Area Hiphop",
"type": "terms",
"id": "bayareahiphop",
"slug": "bayareahiphop",
"link": "/bayareahiphop",
"taxonomy": "site"
},
"campaign21": {
"name": "Campaign 21",
"type": "terms",
"id": "campaign21",
"slug": "campaign21",
"link": "/campaign21",
"taxonomy": "site"
},
"careers": {
"name": "Careers",
"type": "terms",
"id": "careers",
"slug": "careers",
"link": "/careers",
"taxonomy": "site"
},
"checkplease": {
"name": "KQED food",
"grouping": [
"food",
"bayareabites",
"checkplease"
],
"parent": "food",
"type": "terms",
"id": "checkplease",
"slug": "checkplease",
"link": "/food",
"taxonomy": "site"
},
"education": {
"name": "Education",
"grouping": [
"education"
],
"type": "terms",
"id": "education",
"slug": "education",
"link": "/education",
"taxonomy": "site"
},
"elections": {
"name": "Elections",
"type": "terms",
"id": "elections",
"slug": "elections",
"link": "/elections",
"taxonomy": "site"
},
"events": {
"name": "Events",
"type": "terms",
"id": "events",
"slug": "events",
"link": "/events",
"taxonomy": "site"
},
"event": {
"name": "Event",
"alias": "events",
"type": "terms",
"id": "event",
"slug": "event",
"link": "/event",
"taxonomy": "site"
},
"filmschoolshorts": {
"name": "Film School Shorts",
"type": "terms",
"id": "filmschoolshorts",
"slug": "filmschoolshorts",
"link": "/filmschoolshorts",
"taxonomy": "site"
},
"food": {
"name": "KQED food",
"grouping": [
"food",
"bayareabites",
"checkplease"
],
"type": "terms",
"id": "food",
"slug": "food",
"link": "/food",
"taxonomy": "site"
},
"forum": {
"name": "Forum",
"relatedContentQuery": "posts/forum?",
"parent": "news",
"type": "terms",
"id": "forum",
"slug": "forum",
"link": "/forum",
"taxonomy": "site"
},
"futureofyou": {
"name": "Future of You",
"grouping": [
"science",
"futureofyou"
],
"parent": "science",
"type": "terms",
"id": "futureofyou",
"slug": "futureofyou",
"link": "/futureofyou",
"taxonomy": "site"
},
"jpepinheart": {
"name": "KQED food",
"relatedContentQuery": "posts/food,bayareabites,checkplease",
"parent": "food",
"type": "terms",
"id": "jpepinheart",
"slug": "jpepinheart",
"link": "/food",
"taxonomy": "site"
},
"liveblog": {
"name": "Live Blog",
"type": "terms",
"id": "liveblog",
"slug": "liveblog",
"link": "/liveblog",
"taxonomy": "site"
},
"livetv": {
"name": "Live TV",
"parent": "tv",
"type": "terms",
"id": "livetv",
"slug": "livetv",
"link": "/livetv",
"taxonomy": "site"
},
"lowdown": {
"name": "The Lowdown",
"relatedContentQuery": "posts/lowdown?",
"parent": "news",
"type": "terms",
"id": "lowdown",
"slug": "lowdown",
"link": "/lowdown",
"taxonomy": "site"
},
"mindshift": {
"name": "Mindshift",
"parent": "news",
"description": "MindShift explores the future of education by highlighting the innovative – and sometimes counterintuitive – ways educators and parents are helping all children succeed.",
"type": "terms",
"id": "mindshift",
"slug": "mindshift",
"link": "/mindshift",
"taxonomy": "site"
},
"news": {
"name": "News",
"grouping": [
"news",
"forum"
],
"type": "terms",
"id": "news",
"slug": "news",
"link": "/news",
"taxonomy": "site"
},
"newsletters": {
"name": "newsletters",
"type": "terms",
"id": "newsletters",
"slug": "newsletters",
"link": "/newsletters",
"taxonomy": "site"
},
"perspectives": {
"name": "Perspectives",
"parent": "radio",
"type": "terms",
"id": "perspectives",
"slug": "perspectives",
"link": "/perspectives",
"taxonomy": "site"
},
"podcasts": {
"name": "Podcasts",
"type": "terms",
"id": "podcasts",
"slug": "podcasts",
"link": "/podcasts",
"taxonomy": "site"
},
"pop": {
"name": "Pop",
"parent": "arts",
"type": "terms",
"id": "pop",
"slug": "pop",
"link": "/pop",
"taxonomy": "site"
},
"pressroom": {
"name": "Pressroom",
"type": "terms",
"id": "pressroom",
"slug": "pressroom",
"link": "/pressroom",
"taxonomy": "site"
},
"quest": {
"name": "Quest",
"parent": "science",
"type": "terms",
"id": "quest",
"slug": "quest",
"link": "/quest",
"taxonomy": "site"
},
"radio": {
"name": "Radio",
"grouping": [
"forum",
"perspectives"
],
"description": "Listen to KQED Public Radio – home of Forum and The California Report – on 88.5 FM in San Francisco, 89.3 FM in Sacramento, 88.3 FM in Santa Rosa and 88.1 FM in Martinez.",
"type": "terms",
"id": "radio",
"slug": "radio",
"link": "/radio",
"taxonomy": "site"
},
"root": {
"name": "KQED",
"image": "https://ww2.kqed.org/app/uploads/2020/02/KQED-OG-Image@1x.png",
"imageWidth": 1200,
"imageHeight": 630,
"headData": {
"title": "KQED | News, Radio, Podcasts, TV | Public Media for Northern California",
"description": "KQED provides public radio, television, and independent reporting on issues that matter to the Bay Area. We’re the NPR and PBS member station for Northern California."
},
"type": "terms",
"id": "root",
"slug": "root",
"link": "/root",
"taxonomy": "site"
},
"science": {
"name": "Science",
"grouping": [
"science",
"futureofyou"
],
"description": "KQED Science brings you award-winning science and environment coverage from the Bay Area and beyond.",
"type": "terms",
"id": "science",
"slug": "science",
"link": "/science",
"taxonomy": "site"
},
"stateofhealth": {
"name": "State of Health",
"parent": "science",
"type": "terms",
"id": "stateofhealth",
"slug": "stateofhealth",
"link": "/stateofhealth",
"taxonomy": "site"
},
"support": {
"name": "Support",
"type": "terms",
"id": "support",
"slug": "support",
"link": "/support",
"taxonomy": "site"
},
"thedolist": {
"name": "The Do List",
"parent": "arts",
"type": "terms",
"id": "thedolist",
"slug": "thedolist",
"link": "/thedolist",
"taxonomy": "site"
},
"trulyca": {
"name": "Truly CA",
"grouping": [
"arts",
"pop",
"trulyca"
],
"parent": "arts",
"type": "terms",
"id": "trulyca",
"slug": "trulyca",
"link": "/trulyca",
"taxonomy": "site"
},
"tv": {
"name": "TV",
"type": "terms",
"id": "tv",
"slug": "tv",
"link": "/tv",
"taxonomy": "site"
},
"voterguide": {
"name": "Voter Guide",
"parent": "elections",
"alias": "elections",
"type": "terms",
"id": "voterguide",
"slug": "voterguide",
"link": "/voterguide",
"taxonomy": "site"
},
"guiaelectoral": {
"name": "Guia Electoral",
"parent": "elections",
"alias": "elections",
"type": "terms",
"id": "guiaelectoral",
"slug": "guiaelectoral",
"link": "/guiaelectoral",
"taxonomy": "site"
},
"science_category_climate": {
"isLoading": true
},
"science_31": {
"type": "terms",
"id": "science_31",
"meta": {
"index": "terms_1716263798",
"site": "science",
"id": "31",
"found": true
},
"relationships": {},
"featImg": null,
"name": "Climate",
"description": null,
"taxonomy": "category",
"headData": {
"twImgId": null,
"twTitle": null,
"ogTitle": null,
"ogImgId": null,
"twDescription": null,
"description": null,
"title": "Climate Archives | KQED Science",
"ogDescription": null
},
"ttid": 33,
"slug": "climate",
"isLoading": false,
"link": "/science/category/climate"
},
"source_science_725648": {
"type": "terms",
"id": "source_science_725648",
"meta": {
"override": true
},
"name": "Climate Central",
"link": "http://www.climatecentral.org/",
"isLoading": false
},
"source_science_679017": {
"type": "terms",
"id": "source_science_679017",
"meta": {
"override": true
},
"name": "Water Deeply",
"isLoading": false
},
"source_science_674809": {
"type": "terms",
"id": "source_science_674809",
"meta": {
"override": true
},
"name": "Climate Central",
"link": "http://www.climatecentral.org/",
"isLoading": false
},
"source_science_662813": {
"type": "terms",
"id": "source_science_662813",
"meta": {
"override": true
},
"name": "Climate Central",
"link": "http://www.climatecentral.org/",
"isLoading": false
},
"source_science_654227": {
"type": "terms",
"id": "source_science_654227",
"meta": {
"override": true
},
"name": "Climate Central",
"isLoading": false
},
"source_science_650571": {
"type": "terms",
"id": "source_science_650571",
"meta": {
"override": true
},
"name": "Climate Central",
"isLoading": false
},
"source_science_650562": {
"type": "terms",
"id": "source_science_650562",
"meta": {
"override": true
},
"name": "NPR",
"isLoading": false
},
"science_3081": {
"type": "terms",
"id": "science_3081",
"meta": {
"index": "terms_1716263798",
"site": "science",
"id": "3081",
"found": true
},
"relationships": {},
"featImg": null,
"name": "National Parks",
"description": null,
"taxonomy": "series",
"headData": {
"twImgId": null,
"twTitle": null,
"ogTitle": null,
"ogImgId": null,
"twDescription": null,
"description": null,
"title": "National Parks Archives | KQED Science",
"ogDescription": null
},
"ttid": 3081,
"slug": "national-parks",
"isLoading": false,
"link": "/science/series/national-parks"
},
"science_35": {
"type": "terms",
"id": "science_35",
"meta": {
"index": "terms_1716263798",
"site": "science",
"id": "35",
"found": true
},
"relationships": {},
"featImg": null,
"name": "Environment",
"description": null,
"taxonomy": "category",
"headData": {
"twImgId": null,
"twTitle": null,
"ogTitle": null,
"ogImgId": null,
"twDescription": null,
"description": null,
"title": "Environment Archives | KQED Science",
"ogDescription": null
},
"ttid": 37,
"slug": "environment",
"isLoading": false,
"link": "/science/category/environment"
},
"science_40": {
"type": "terms",
"id": "science_40",
"meta": {
"index": "terms_1716263798",
"site": "science",
"id": "40",
"found": true
},
"relationships": {},
"featImg": null,
"name": "News",
"description": null,
"taxonomy": "category",
"headData": {
"twImgId": null,
"twTitle": null,
"ogTitle": null,
"ogImgId": null,
"twDescription": null,
"description": null,
"title": "News Archives | KQED Science",
"ogDescription": null
},
"ttid": 42,
"slug": "news",
"isLoading": false,
"link": "/science/category/news"
},
"science_1151": {
"type": "terms",
"id": "science_1151",
"meta": {
"index": "terms_1716263798",
"site": "science",
"id": "1151",
"found": true
},
"relationships": {},
"featImg": null,
"name": "Drought Watch",
"description": "\u003cem>What California's reservoirs look like right now (From KQED's \u003ca href=\"http://ww2.kqed.org/lowdown/\">The Lowdown\u003c/a>)\u003c/em>\r\n\r\n[iframe src=\"http://kroodsma.com/KQED/water-supply-master/public/map.html\" width=\"640\" height=\"720\" frameborder=\"0\" scrolling=\"no\"]\r\n\r\n\u003cem>We’re collecting all of our California drought coverage here, starting with the current state of the drought, then providing the \u003ca href=\"#background\">background\u003c/a> and rounding up \u003ca href=\"#river\">all the stories\u003c/a> we’ve produced.\u003c/em>\r\n\r\n\u003cstrong>Relief at Last\r\n\u003c/strong>\r\n\r\nIn early April, after more than five years of the most withering drought on record, California Governor Jerry Brown finally lifted the emergency drought order he issued in January of 2014. By that time, the record-setting winter of 2016-17 had removed all doubt that the drought was over, though concerns over depleted groundwater levels still remain. According to the \u003ca href=\"http://droughtmonitor.unl.edu/\" target=\"_blank\">U.S. Drought Monitor\u003c/a>, less than 10 percent of California remains in “moderate drought” — compared to nearly 100 percent of the state a year ago.\r\n\r\n[http_redir]",
"taxonomy": "series",
"headData": {
"twImgId": null,
"twTitle": null,
"ogTitle": null,
"ogImgId": null,
"twDescription": null,
"description": "What California's reservoirs look like right now (From KQED's The Lowdown) [iframe src=\"http://kroodsma.com/KQED/water-supply-master/public/map.html\" width=\"640\" height=\"720\" frameborder=\"0\" scrolling=\"no\"] We’re collecting all of our California drought coverage here, starting with the current state of the drought, then providing the background and rounding up all the stories we’ve produced. Relief at Last In early April, after more than five years of the most withering drought on record, California Governor Jerry Brown finally lifted the emergency drought order he issued in January of 2014. By that time, the record-setting winter of 2016-17 had removed all doubt that the drought was over, though concerns over depleted groundwater levels still remain. According to the U.S. Drought Monitor, less than 10 percent of California remains in “moderate drought” — compared to nearly 100 percent of the state a year ago. [http_redir]",
"title": "Drought Watch Archives | KQED Science",
"ogDescription": null
},
"ttid": 1160,
"slug": "california-drought-watch",
"isLoading": false,
"link": "/science/series/california-drought-watch"
},
"science_98": {
"type": "terms",
"id": "science_98",
"meta": {
"index": "terms_1716263798",
"site": "science",
"id": "98",
"found": true
},
"relationships": {},
"featImg": null,
"name": "Water",
"description": null,
"taxonomy": "category",
"headData": {
"twImgId": null,
"twTitle": null,
"ogTitle": null,
"ogImgId": null,
"twDescription": null,
"description": null,
"title": "Water Archives | KQED Science",
"ogDescription": null
},
"ttid": 102,
"slug": "water",
"isLoading": false,
"link": "/science/category/water"
},
"science_1622": {
"type": "terms",
"id": "science_1622",
"meta": {
"index": "terms_1716263798",
"site": "science",
"id": "1622",
"found": true
},
"relationships": {},
"featImg": null,
"name": "California drought",
"description": null,
"taxonomy": "tag",
"headData": {
"twImgId": null,
"twTitle": null,
"ogTitle": null,
"ogImgId": null,
"twDescription": null,
"description": null,
"title": "California drought Archives | KQED Science",
"ogDescription": null
},
"ttid": 1631,
"slug": "california-drought",
"isLoading": false,
"link": "/science/tag/california-drought"
},
"science_876": {
"type": "terms",
"id": "science_876",
"meta": {
"index": "terms_1716263798",
"site": "science",
"id": "876",
"found": true
},
"relationships": {},
"featImg": null,
"name": "water conservation",
"description": null,
"taxonomy": "tag",
"headData": {
"twImgId": null,
"twTitle": null,
"ogTitle": null,
"ogImgId": null,
"twDescription": null,
"description": null,
"title": "water conservation Archives | KQED Science",
"ogDescription": null
},
"ttid": 882,
"slug": "water-conservation",
"isLoading": false,
"link": "/science/tag/water-conservation"
},
"science_46": {
"type": "terms",
"id": "science_46",
"meta": {
"index": "terms_1716263798",
"site": "science",
"id": "46",
"found": true
},
"relationships": {},
"featImg": null,
"name": "Audio",
"description": null,
"taxonomy": "category",
"headData": {
"twImgId": null,
"twTitle": null,
"ogTitle": null,
"ogImgId": null,
"twDescription": null,
"description": null,
"title": "Audio Archives | KQED Science",
"ogDescription": null
},
"ttid": 48,
"slug": "audio",
"isLoading": false,
"link": "/science/category/audio"
},
"science_89": {
"type": "terms",
"id": "science_89",
"meta": {
"index": "terms_1716263798",
"site": "science",
"id": "89",
"found": true
},
"relationships": {},
"featImg": null,
"name": "Engineering",
"description": null,
"taxonomy": "category",
"headData": {
"twImgId": null,
"twTitle": null,
"ogTitle": null,
"ogImgId": null,
"twDescription": null,
"description": null,
"title": "Engineering Archives | KQED Science",
"ogDescription": null
},
"ttid": 92,
"slug": "engineering",
"isLoading": false,
"link": "/science/category/engineering"
},
"science_43": {
"type": "terms",
"id": "science_43",
"meta": {
"index": "terms_1716263798",
"site": "science",
"id": "43",
"found": true
},
"relationships": {},
"featImg": null,
"name": "Radio",
"description": null,
"taxonomy": "category",
"headData": {
"twImgId": null,
"twTitle": null,
"ogTitle": null,
"ogImgId": null,
"twDescription": null,
"description": null,
"title": "Radio Archives | KQED Science",
"ogDescription": null
},
"ttid": 45,
"slug": "radio",
"isLoading": false,
"link": "/science/category/radio"
},
"science_208": {
"type": "terms",
"id": "science_208",
"meta": {
"index": "terms_1716263798",
"site": "science",
"id": "208",
"found": true
},
"relationships": {},
"featImg": null,
"name": "San Francisco Bay",
"description": null,
"taxonomy": "tag",
"headData": {
"twImgId": null,
"twTitle": null,
"ogTitle": null,
"ogImgId": null,
"twDescription": null,
"description": null,
"title": "San Francisco Bay Archives | KQED Science",
"ogDescription": null
},
"ttid": 212,
"slug": "san-francisco-bay",
"isLoading": false,
"link": "/science/tag/san-francisco-bay"
},
"science_1462": {
"type": "terms",
"id": "science_1462",
"meta": {
"index": "terms_1716263798",
"site": "science",
"id": "1462",
"found": true
},
"relationships": {},
"featImg": null,
"name": "Sierra snowpack",
"description": null,
"taxonomy": "tag",
"headData": {
"twImgId": null,
"twTitle": null,
"ogTitle": null,
"ogImgId": null,
"twDescription": null,
"description": null,
"title": "Sierra snowpack Archives | KQED Science",
"ogDescription": null
},
"ttid": 1471,
"slug": "sierra-snowpack",
"isLoading": false,
"link": "/science/tag/sierra-snowpack"
},
"science_110": {
"type": "terms",
"id": "science_110",
"meta": {
"index": "terms_1716263798",
"site": "science",
"id": "110",
"found": true
},
"relationships": {},
"featImg": null,
"name": "water supply",
"description": null,
"taxonomy": "tag",
"headData": {
"twImgId": null,
"twTitle": null,
"ogTitle": null,
"ogImgId": null,
"twDescription": null,
"description": null,
"title": "water supply Archives | KQED Science",
"ogDescription": null
},
"ttid": 114,
"slug": "water-supply",
"isLoading": false,
"link": "/science/tag/water-supply"
},
"science_2873": {
"type": "terms",
"id": "science_2873",
"meta": {
"index": "terms_1716263798",
"site": "science",
"id": "2873",
"found": true
},
"relationships": {},
"featImg": null,
"name": "Oceans",
"description": null,
"taxonomy": "category",
"headData": {
"twImgId": null,
"twTitle": null,
"ogTitle": null,
"ogImgId": null,
"twDescription": null,
"description": null,
"title": "Oceans Archives | KQED Science",
"ogDescription": null
},
"ttid": 2873,
"slug": "oceans",
"isLoading": false,
"link": "/science/category/oceans"
},
"science_33": {
"type": "terms",
"id": "science_33",
"meta": {
"index": "terms_1716263798",
"site": "science",
"id": "33",
"found": true
},
"relationships": {},
"featImg": null,
"name": "Energy",
"description": null,
"taxonomy": "category",
"headData": {
"twImgId": null,
"twTitle": null,
"ogTitle": null,
"ogImgId": null,
"twDescription": null,
"description": null,
"title": "Energy Archives | KQED Science",
"ogDescription": null
},
"ttid": 35,
"slug": "energy",
"isLoading": false,
"link": "/science/category/energy"
},
"science_371": {
"type": "terms",
"id": "science_371",
"meta": {
"index": "terms_1716263798",
"site": "science",
"id": "371",
"found": true
},
"relationships": {},
"featImg": null,
"name": "el nino",
"description": null,
"taxonomy": "tag",
"headData": {
"twImgId": null,
"twTitle": null,
"ogTitle": null,
"ogImgId": null,
"twDescription": null,
"description": null,
"title": "el nino Archives | KQED Science",
"ogDescription": null
},
"ttid": 377,
"slug": "el-nino",
"isLoading": false,
"link": "/science/tag/el-nino"
}
},
"userPermissionsReducer": {
"wpLoggedIn": false
},
"eventsReducer": {},
"fssReducer": {},
"tvDailyScheduleReducer": {},
"tvWeeklyScheduleReducer": {},
"tvPrimetimeScheduleReducer": {},
"tvMonthlyScheduleReducer": {},
"userAccountReducer": {
"user": {
"email": null,
"emailStatus": "EMAIL_UNVALIDATED",
"loggedStatus": "LOGGED_OUT",
"loggingChecked": false,
"articles": [],
"firstName": null,
"lastName": null,
"phoneNumber": null,
"fetchingMembership": false,
"membershipError": false,
"memberships": [
{
"id": null,
"startDate": null,
"firstName": null,
"lastName": null,
"familyNumber": null,
"memberNumber": null,
"memberSince": null,
"expirationDate": null,
"pfsEligible": false,
"isSustaining": false,
"membershipLevel": "Prospect",
"membershipStatus": "Non Member",
"lastGiftDate": null,
"renewalDate": null,
"lastDonationAmount": null
}
]
},
"authModal": {
"isOpen": false,
"view": "LANDING_VIEW"
},
"error": null
},
"youthMediaReducer": {},
"checkPleaseReducer": {
"filterData": {
"region": {
"key": "Restaurant Region",
"filters": [
"Any Region"
]
},
"cuisine": {
"key": "Restaurant Cuisine",
"filters": [
"Any Cuisine"
]
}
},
"restaurantDataById": {},
"restaurantIdsSorted": [],
"error": null
},
"userAgentReducer": {
"userAgent": "Mozilla/5.0 AppleWebKit/537.36 (KHTML, like Gecko; compatible; ClaudeBot/1.0; +claudebot@anthropic.com)",
"isBot": true
},
"requestOutcomesReducer": {
"notFound": []
}
}