window.__IS_SSR__=true
window.__INITIAL_STATE__={
"attachmentsReducer": {
"audio_0": {
"type": "attachments",
"id": "audio_0",
"imgSizes": {
"kqedFullSize": {
"file": "https://ww2.kqed.org/news/wp-content/themes/KQED-unified/img/audio_bgs/background0.jpg"
}
}
},
"audio_1": {
"type": "attachments",
"id": "audio_1",
"imgSizes": {
"kqedFullSize": {
"file": "https://ww2.kqed.org/news/wp-content/themes/KQED-unified/img/audio_bgs/background1.jpg"
}
}
},
"audio_2": {
"type": "attachments",
"id": "audio_2",
"imgSizes": {
"kqedFullSize": {
"file": "https://ww2.kqed.org/news/wp-content/themes/KQED-unified/img/audio_bgs/background2.jpg"
}
}
},
"audio_3": {
"type": "attachments",
"id": "audio_3",
"imgSizes": {
"kqedFullSize": {
"file": "https://ww2.kqed.org/news/wp-content/themes/KQED-unified/img/audio_bgs/background3.jpg"
}
}
},
"audio_4": {
"type": "attachments",
"id": "audio_4",
"imgSizes": {
"kqedFullSize": {
"file": "https://ww2.kqed.org/news/wp-content/themes/KQED-unified/img/audio_bgs/background4.jpg"
}
}
},
"placeholder": {
"type": "attachments",
"id": "placeholder",
"imgSizes": {
"thumbnail": {
"file": "https://cdn.kqed.org/wp-content/uploads/2024/12/KQED-Default-Image-816638274-2000x1333-1-160x107.jpg",
"width": 160,
"height": 107,
"mimeType": "image/jpeg"
},
"medium": {
"file": "https://cdn.kqed.org/wp-content/uploads/2024/12/KQED-Default-Image-816638274-2000x1333-1-800x533.jpg",
"width": 800,
"height": 533,
"mimeType": "image/jpeg"
},
"medium_large": {
"file": "https://cdn.kqed.org/wp-content/uploads/2024/12/KQED-Default-Image-816638274-2000x1333-1-768x512.jpg",
"width": 768,
"height": 512,
"mimeType": "image/jpeg"
},
"large": {
"file": "https://cdn.kqed.org/wp-content/uploads/2024/12/KQED-Default-Image-816638274-2000x1333-1-1020x680.jpg",
"width": 1020,
"height": 680,
"mimeType": "image/jpeg"
},
"1536x1536": {
"file": "https://cdn.kqed.org/wp-content/uploads/2024/12/KQED-Default-Image-816638274-2000x1333-1-1536x1024.jpg",
"width": 1536,
"height": 1024,
"mimeType": "image/jpeg"
},
"fd-lrg": {
"file": "https://cdn.kqed.org/wp-content/uploads/2024/12/KQED-Default-Image-816638274-2000x1333-1-1536x1024.jpg",
"width": 1536,
"height": 1024,
"mimeType": "image/jpeg"
},
"fd-med": {
"file": "https://cdn.kqed.org/wp-content/uploads/2024/12/KQED-Default-Image-816638274-2000x1333-1-1020x680.jpg",
"width": 1020,
"height": 680,
"mimeType": "image/jpeg"
},
"fd-sm": {
"file": "https://cdn.kqed.org/wp-content/uploads/2024/12/KQED-Default-Image-816638274-2000x1333-1-800x533.jpg",
"width": 800,
"height": 533,
"mimeType": "image/jpeg"
},
"post-thumbnail": {
"file": "https://cdn.kqed.org/wp-content/uploads/2024/12/KQED-Default-Image-816638274-2000x1333-1-672x372.jpg",
"width": 672,
"height": 372,
"mimeType": "image/jpeg"
},
"twentyfourteen-full-width": {
"file": "https://cdn.kqed.org/wp-content/uploads/2024/12/KQED-Default-Image-816638274-2000x1333-1-1038x576.jpg",
"width": 1038,
"height": 576,
"mimeType": "image/jpeg"
},
"xxsmall": {
"file": "https://cdn.kqed.org/wp-content/uploads/2024/12/KQED-Default-Image-816638274-2000x1333-1-160x107.jpg",
"width": 160,
"height": 107,
"mimeType": "image/jpeg"
},
"xsmall": {
"file": "https://cdn.kqed.org/wp-content/uploads/2024/12/KQED-Default-Image-816638274-2000x1333-1-672x372.jpg",
"width": 672,
"height": 372,
"mimeType": "image/jpeg"
},
"small": {
"file": "https://cdn.kqed.org/wp-content/uploads/2024/12/KQED-Default-Image-816638274-2000x1333-1-672x372.jpg",
"width": 672,
"height": 372,
"mimeType": "image/jpeg"
},
"xlarge": {
"file": "https://cdn.kqed.org/wp-content/uploads/2024/12/KQED-Default-Image-816638274-2000x1333-1-1020x680.jpg",
"width": 1020,
"height": 680,
"mimeType": "image/jpeg"
},
"full-width": {
"file": "https://cdn.kqed.org/wp-content/uploads/2024/12/KQED-Default-Image-816638274-2000x1333-1-1920x1280.jpg",
"width": 1920,
"height": 1280,
"mimeType": "image/jpeg"
},
"guest-author-32": {
"file": "https://cdn.kqed.org/wp-content/uploads/2025/01/KQED-Default-Image-816638274-1333x1333-1-160x160.jpg",
"width": 32,
"height": 32,
"mimeType": "image/jpeg"
},
"guest-author-50": {
"file": "https://cdn.kqed.org/wp-content/uploads/2025/01/KQED-Default-Image-816638274-1333x1333-1-160x160.jpg",
"width": 50,
"height": 50,
"mimeType": "image/jpeg"
},
"guest-author-64": {
"file": "https://cdn.kqed.org/wp-content/uploads/2025/01/KQED-Default-Image-816638274-1333x1333-1-160x160.jpg",
"width": 64,
"height": 64,
"mimeType": "image/jpeg"
},
"guest-author-96": {
"file": "https://cdn.kqed.org/wp-content/uploads/2025/01/KQED-Default-Image-816638274-1333x1333-1-160x160.jpg",
"width": 96,
"height": 96,
"mimeType": "image/jpeg"
},
"guest-author-128": {
"file": "https://cdn.kqed.org/wp-content/uploads/2025/01/KQED-Default-Image-816638274-1333x1333-1-160x160.jpg",
"width": 128,
"height": 128,
"mimeType": "image/jpeg"
},
"detail": {
"file": "https://cdn.kqed.org/wp-content/uploads/2025/01/KQED-Default-Image-816638274-1333x1333-1-160x160.jpg",
"width": 160,
"height": 160,
"mimeType": "image/jpeg"
},
"kqedFullSize": {
"file": "https://cdn.kqed.org/wp-content/uploads/2024/12/KQED-Default-Image-816638274-2000x1333-1.jpg",
"width": 2000,
"height": 1333
}
}
},
"science_581803": {
"type": "attachments",
"id": "science_581803",
"meta": {
"index": "attachments_1716263798",
"site": "science",
"id": "581803",
"found": true
},
"parent": 581726,
"imgSizes": {
"twentyfourteen-full-width": {
"file": "https://ww2.kqed.org/app/uploads/sites/35/2016/03/Tree_el-nino-800x576.jpg",
"width": 800,
"mimeType": "image/jpeg",
"height": 576
},
"thumbnail": {
"file": "https://ww2.kqed.org/app/uploads/sites/35/2016/03/Tree_el-nino-400x301.jpg",
"width": 400,
"mimeType": "image/jpeg",
"height": 301
},
"post-thumbnail": {
"file": "https://ww2.kqed.org/app/uploads/sites/35/2016/03/Tree_el-nino-672x372.jpg",
"width": 672,
"mimeType": "image/jpeg",
"height": 372
},
"kqedFullSize": {
"file": "https://ww2.kqed.org/app/uploads/sites/35/2016/03/Tree_el-nino.jpg",
"width": 800,
"height": 601
},
"guest-author-96": {
"file": "https://ww2.kqed.org/app/uploads/sites/35/2016/03/Tree_el-nino-96x96.jpg",
"width": 96,
"mimeType": "image/jpeg",
"height": 96
},
"medium": {
"file": "https://ww2.kqed.org/app/uploads/sites/35/2016/03/Tree_el-nino-800x601.jpg",
"width": 800,
"mimeType": "image/jpeg",
"height": 601
},
"guest-author-64": {
"file": "https://ww2.kqed.org/app/uploads/sites/35/2016/03/Tree_el-nino-64x64.jpg",
"width": 64,
"mimeType": "image/jpeg",
"height": 64
},
"detail": {
"file": "https://ww2.kqed.org/app/uploads/sites/35/2016/03/Tree_el-nino-75x75.jpg",
"width": 75,
"mimeType": "image/jpeg",
"height": 75
},
"guest-author-32": {
"file": "https://ww2.kqed.org/app/uploads/sites/35/2016/03/Tree_el-nino-32x32.jpg",
"width": 32,
"mimeType": "image/jpeg",
"height": 32
},
"medium_large": {
"file": "https://ww2.kqed.org/app/uploads/sites/35/2016/03/Tree_el-nino-768x577.jpg",
"width": 768,
"mimeType": "image/jpeg",
"height": 577
},
"guest-author-128": {
"file": "https://ww2.kqed.org/app/uploads/sites/35/2016/03/Tree_el-nino-128x128.jpg",
"width": 128,
"mimeType": "image/jpeg",
"height": 128
}
},
"publishDate": 1458148763,
"modified": 1458148866,
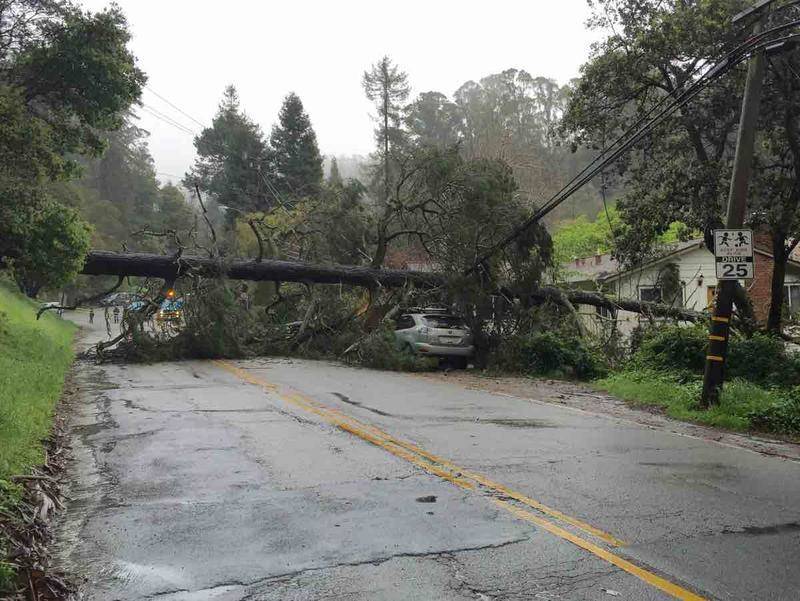
"caption": "A downed tree in Oakland after last weekend's El Niño-fueled storms.",
"description": null,
"title": "Tree_el nino",
"credit": "Andrea Kissack/KQED",
"status": "inherit",
"isLoading": false,
"fetchFailed": false
},
"science_561629": {
"type": "attachments",
"id": "science_561629",
"meta": {
"index": "attachments_1716263798",
"site": "science",
"id": "561629",
"found": true
},
"parent": 560497,
"imgSizes": {
"twentyfourteen-full-width": {
"file": "https://ww2.kqed.org/app/uploads/sites/35/2016/03/GettyImages-460313280-1038x576.jpg",
"width": 1038,
"mimeType": "image/jpeg",
"height": 576
},
"thumbnail": {
"file": "https://ww2.kqed.org/app/uploads/sites/35/2016/03/GettyImages-460313280-400x293.jpg",
"width": 400,
"mimeType": "image/jpeg",
"height": 293
},
"fd-sm": {
"file": "https://ww2.kqed.org/app/uploads/sites/35/2016/03/GettyImages-460313280-960x704.jpg",
"width": 960,
"mimeType": "image/jpeg",
"height": 704
},
"post-thumbnail": {
"file": "https://ww2.kqed.org/app/uploads/sites/35/2016/03/GettyImages-460313280-672x372.jpg",
"width": 672,
"mimeType": "image/jpeg",
"height": 372
},
"kqedFullSize": {
"file": "https://ww2.kqed.org/app/uploads/sites/35/2016/03/GettyImages-460313280.jpg",
"width": 3000,
"height": 2199
},
"large": {
"file": "https://ww2.kqed.org/app/uploads/sites/35/2016/03/GettyImages-460313280-1440x1056.jpg",
"width": 1440,
"mimeType": "image/jpeg",
"height": 1056
},
"guest-author-96": {
"file": "https://ww2.kqed.org/app/uploads/sites/35/2016/03/GettyImages-460313280-96x96.jpg",
"width": 96,
"mimeType": "image/jpeg",
"height": 96
},
"medium": {
"file": "https://ww2.kqed.org/app/uploads/sites/35/2016/03/GettyImages-460313280-800x586.jpg",
"width": 800,
"mimeType": "image/jpeg",
"height": 586
},
"guest-author-64": {
"file": "https://ww2.kqed.org/app/uploads/sites/35/2016/03/GettyImages-460313280-64x64.jpg",
"width": 64,
"mimeType": "image/jpeg",
"height": 64
},
"guest-author-32": {
"file": "https://ww2.kqed.org/app/uploads/sites/35/2016/03/GettyImages-460313280-32x32.jpg",
"width": 32,
"mimeType": "image/jpeg",
"height": 32
},
"fd-lrg": {
"file": "https://ww2.kqed.org/app/uploads/sites/35/2016/03/GettyImages-460313280-1920x1407.jpg",
"width": 1920,
"mimeType": "image/jpeg",
"height": 1407
},
"fd-med": {
"file": "https://ww2.kqed.org/app/uploads/sites/35/2016/03/GettyImages-460313280-1180x865.jpg",
"width": 1180,
"mimeType": "image/jpeg",
"height": 865
},
"detail": {
"file": "https://ww2.kqed.org/app/uploads/sites/35/2016/03/GettyImages-460313280-75x75.jpg",
"width": 75,
"mimeType": "image/jpeg",
"height": 75
},
"medium_large": {
"file": "https://ww2.kqed.org/app/uploads/sites/35/2016/03/GettyImages-460313280-768x563.jpg",
"width": 768,
"mimeType": "image/jpeg",
"height": 563
},
"guest-author-128": {
"file": "https://ww2.kqed.org/app/uploads/sites/35/2016/03/GettyImages-460313280-128x128.jpg",
"width": 128,
"mimeType": "image/jpeg",
"height": 128
}
},
"publishDate": 1457118688,
"modified": 1457118709,
"caption": "SAN FRANCISCO, CA - DECEMBER 11: The Golden Gate Bridge is seen through a rain covered windshield on December 11, 2014 in Larkspur, California. The San Francisco Bay Area is being hit with a severe storm that is bringing high winds and heavy rain that have toppled trees and caused local flooding. (Photo by Justin Sullivan/Getty Images)",
"description": "The Golden Gate Bridge is seen through a rain covered windshield.",
"title": "Large Winter Storm Brings Heavy Rains And High Ways To Northern California",
"credit": "Justin Sullivan/Getty Images",
"status": "inherit",
"isLoading": false,
"fetchFailed": false
},
"science_537106": {
"type": "attachments",
"id": "science_537106",
"meta": {
"index": "attachments_1716263798",
"site": "science",
"id": "537106",
"found": true
},
"parent": 536769,
"imgSizes": {
"twentyfourteen-full-width": {
"file": "https://ww2.kqed.org/app/uploads/sites/35/2016/02/Stormclouds_4522-1038x576.jpeg",
"width": 1038,
"mimeType": "image/jpeg",
"height": 576
},
"thumbnail": {
"file": "https://ww2.kqed.org/app/uploads/sites/35/2016/02/Stormclouds_4522-400x282.jpeg",
"width": 400,
"mimeType": "image/jpeg",
"height": 282
},
"fd-sm": {
"file": "https://ww2.kqed.org/app/uploads/sites/35/2016/02/Stormclouds_4522-960x678.jpeg",
"width": 960,
"mimeType": "image/jpeg",
"height": 678
},
"post-thumbnail": {
"file": "https://ww2.kqed.org/app/uploads/sites/35/2016/02/Stormclouds_4522-672x372.jpeg",
"width": 672,
"mimeType": "image/jpeg",
"height": 372
},
"kqedFullSize": {
"file": "https://ww2.kqed.org/app/uploads/sites/35/2016/02/Stormclouds_4522.jpeg",
"width": 1622,
"height": 1145
},
"large": {
"file": "https://ww2.kqed.org/app/uploads/sites/35/2016/02/Stormclouds_4522-1440x1017.jpeg",
"width": 1440,
"mimeType": "image/jpeg",
"height": 1017
},
"guest-author-96": {
"file": "https://ww2.kqed.org/app/uploads/sites/35/2016/02/Stormclouds_4522-96x96.jpeg",
"width": 96,
"mimeType": "image/jpeg",
"height": 96
},
"medium": {
"file": "https://ww2.kqed.org/app/uploads/sites/35/2016/02/Stormclouds_4522-800x565.jpeg",
"width": 800,
"mimeType": "image/jpeg",
"height": 565
},
"guest-author-64": {
"file": "https://ww2.kqed.org/app/uploads/sites/35/2016/02/Stormclouds_4522-64x64.jpeg",
"width": 64,
"mimeType": "image/jpeg",
"height": 64
},
"guest-author-32": {
"file": "https://ww2.kqed.org/app/uploads/sites/35/2016/02/Stormclouds_4522-32x32.jpeg",
"width": 32,
"mimeType": "image/jpeg",
"height": 32
},
"fd-med": {
"file": "https://ww2.kqed.org/app/uploads/sites/35/2016/02/Stormclouds_4522-1180x833.jpeg",
"width": 1180,
"mimeType": "image/jpeg",
"height": 833
},
"detail": {
"file": "https://ww2.kqed.org/app/uploads/sites/35/2016/02/Stormclouds_4522-75x75.jpeg",
"width": 75,
"mimeType": "image/jpeg",
"height": 75
},
"medium_large": {
"file": "https://ww2.kqed.org/app/uploads/sites/35/2016/02/Stormclouds_4522-768x542.jpeg",
"width": 768,
"mimeType": "image/jpeg",
"height": 542
},
"guest-author-128": {
"file": "https://ww2.kqed.org/app/uploads/sites/35/2016/02/Stormclouds_4522-128x128.jpeg",
"width": 128,
"mimeType": "image/jpeg",
"height": 128
}
},
"publishDate": 1455846122,
"modified": 1455846246,
"caption": "Storm clouds gather over San Francisco in mid-February, a month that otherwise offered little rain this year.",
"description": "Storm clouds gather over San Francisco in mid-February, a month that otherwise offered little rain this year.",
"title": "Stormclouds_4522",
"credit": "Craig Miller/KQED",
"status": "inherit",
"isLoading": false,
"fetchFailed": false
},
"science_502284": {
"type": "attachments",
"id": "science_502284",
"meta": {
"index": "attachments_1716263798",
"site": "science",
"id": "502284",
"found": true
},
"parent": 502283,
"imgSizes": {
"thumbnail": {
"file": "https://ww2.kqed.org/app/uploads/sites/35/2016/01/fig4-400x225.jpg",
"width": 400,
"mimeType": "image/jpeg",
"height": 225
},
"kqedFullSize": {
"file": "https://ww2.kqed.org/app/uploads/sites/35/2016/01/fig4.jpg",
"width": 543,
"height": 305
},
"guest-author-96": {
"file": "https://ww2.kqed.org/app/uploads/sites/35/2016/01/fig4-96x96.jpg",
"width": 96,
"mimeType": "image/jpeg",
"height": 96
},
"guest-author-64": {
"file": "https://ww2.kqed.org/app/uploads/sites/35/2016/01/fig4-64x64.jpg",
"width": 64,
"mimeType": "image/jpeg",
"height": 64
},
"detail": {
"file": "https://ww2.kqed.org/app/uploads/sites/35/2016/01/fig4-75x75.jpg",
"width": 75,
"mimeType": "image/jpeg",
"height": 75
},
"guest-author-32": {
"file": "https://ww2.kqed.org/app/uploads/sites/35/2016/01/fig4-32x32.jpg",
"width": 32,
"mimeType": "image/jpeg",
"height": 32
},
"guest-author-128": {
"file": "https://ww2.kqed.org/app/uploads/sites/35/2016/01/fig4-128x128.jpg",
"width": 128,
"mimeType": "image/jpeg",
"height": 128
}
},
"publishDate": 1454260433,
"modified": 1454299707,
"caption": "2016 was the warmest year on record globally, but warmth has not been evenly distributed throughout the Northern Hemisphere.",
"description": "2016 was the warmest year on record globally, but warmth has not been evenly distributed throughout the Northern Hemisphere.",
"title": "fig4",
"credit": "NASA Scientific Visualization Studio",
"status": "inherit",
"isLoading": false,
"fetchFailed": false
},
"science_503977": {
"type": "attachments",
"id": "science_503977",
"meta": {
"index": "attachments_1716263798",
"site": "science",
"id": "503977",
"found": true
},
"parent": 499218,
"imgSizes": {
"twentyfourteen-full-width": {
"file": "https://ww2.kqed.org/app/uploads/sites/35/2016/02/830878235_3f060c0717_o-1038x576.jpg",
"width": 1038,
"mimeType": "image/jpeg",
"height": 576
},
"thumbnail": {
"file": "https://ww2.kqed.org/app/uploads/sites/35/2016/02/830878235_3f060c0717_o-400x266.jpg",
"width": 400,
"mimeType": "image/jpeg",
"height": 266
},
"fd-sm": {
"file": "https://ww2.kqed.org/app/uploads/sites/35/2016/02/830878235_3f060c0717_o-960x638.jpg",
"width": 960,
"mimeType": "image/jpeg",
"height": 638
},
"post-thumbnail": {
"file": "https://ww2.kqed.org/app/uploads/sites/35/2016/02/830878235_3f060c0717_o-672x372.jpg",
"width": 672,
"mimeType": "image/jpeg",
"height": 372
},
"kqedFullSize": {
"file": "https://ww2.kqed.org/app/uploads/sites/35/2016/02/830878235_3f060c0717_o.jpg",
"width": 1280,
"height": 851
},
"guest-author-96": {
"file": "https://ww2.kqed.org/app/uploads/sites/35/2016/02/830878235_3f060c0717_o-96x96.jpg",
"width": 96,
"mimeType": "image/jpeg",
"height": 96
},
"medium": {
"file": "https://ww2.kqed.org/app/uploads/sites/35/2016/02/830878235_3f060c0717_o-800x532.jpg",
"width": 800,
"mimeType": "image/jpeg",
"height": 532
},
"guest-author-64": {
"file": "https://ww2.kqed.org/app/uploads/sites/35/2016/02/830878235_3f060c0717_o-64x64.jpg",
"width": 64,
"mimeType": "image/jpeg",
"height": 64
},
"guest-author-32": {
"file": "https://ww2.kqed.org/app/uploads/sites/35/2016/02/830878235_3f060c0717_o-32x32.jpg",
"width": 32,
"mimeType": "image/jpeg",
"height": 32
},
"fd-med": {
"file": "https://ww2.kqed.org/app/uploads/sites/35/2016/02/830878235_3f060c0717_o-1180x785.jpg",
"width": 1180,
"mimeType": "image/jpeg",
"height": 785
},
"detail": {
"file": "https://ww2.kqed.org/app/uploads/sites/35/2016/02/830878235_3f060c0717_o-75x75.jpg",
"width": 75,
"mimeType": "image/jpeg",
"height": 75
},
"medium_large": {
"file": "https://ww2.kqed.org/app/uploads/sites/35/2016/02/830878235_3f060c0717_o-768x511.jpg",
"width": 768,
"mimeType": "image/jpeg",
"height": 511
},
"guest-author-128": {
"file": "https://ww2.kqed.org/app/uploads/sites/35/2016/02/830878235_3f060c0717_o-128x128.jpg",
"width": 128,
"mimeType": "image/jpeg",
"height": 128
}
},
"publishDate": 1454337571,
"modified": 1454337715,
"caption": "A 2006 landslide in Mill Valley left this large scar The area turned into a fast-moving debris flow, sending tons of mud and earth downhill. ",
"description": null,
"title": "landslide",
"credit": "KQED/Quest",
"status": "inherit",
"isLoading": false,
"fetchFailed": false
},
"science_458966": {
"type": "attachments",
"id": "science_458966",
"meta": {
"index": "attachments_1716263798",
"site": "science",
"id": "458966",
"found": true
},
"title": "Skier_Tahoe_OAP_1923",
"publishDate": 1452211175,
"status": "inherit",
"parent": 458878,
"modified": 1773250535,
"caption": "A skier surveys the view of South Lake Tahoe from Heavenly ski resort.",
"credit": "Olivia Allen-Price/KQED",
"altTag": "A skier surveys the view of South Lake Tahoe from Heavenly ski resort.",
"description": "A skier surveys the view of South Lake Tahoe from Heavenly ski resort.",
"imgSizes": {
"thumbnail": {
"file": "https://cdn.kqed.org/wp-content/uploads/sites/35/2016/01/Skier_Tahoe_OAP_1923-400x300.jpeg",
"width": 400,
"height": 300,
"mimeType": "image/jpeg"
},
"medium": {
"file": "https://cdn.kqed.org/wp-content/uploads/sites/35/2016/01/Skier_Tahoe_OAP_1923-800x600.jpeg",
"width": 800,
"height": 600,
"mimeType": "image/jpeg"
},
"medium_large": {
"file": "https://cdn.kqed.org/wp-content/uploads/sites/35/2016/01/Skier_Tahoe_OAP_1923-768x576.jpeg",
"width": 768,
"height": 576,
"mimeType": "image/jpeg"
},
"large": {
"file": "https://cdn.kqed.org/wp-content/uploads/sites/35/2016/01/Skier_Tahoe_OAP_1923-1440x1080.jpeg",
"width": 1440,
"height": 1080,
"mimeType": "image/jpeg"
},
"fd-lrg": {
"file": "https://cdn.kqed.org/wp-content/uploads/sites/35/2016/01/Skier_Tahoe_OAP_1923-1920x1440.jpeg",
"width": 1920,
"height": 1440,
"mimeType": "image/jpeg"
},
"fd-med": {
"file": "https://cdn.kqed.org/wp-content/uploads/sites/35/2016/01/Skier_Tahoe_OAP_1923-1180x885.jpeg",
"width": 1180,
"height": 885,
"mimeType": "image/jpeg"
},
"fd-sm": {
"file": "https://cdn.kqed.org/wp-content/uploads/sites/35/2016/01/Skier_Tahoe_OAP_1923-960x720.jpeg",
"width": 960,
"height": 720,
"mimeType": "image/jpeg"
},
"post-thumbnail": {
"file": "https://cdn.kqed.org/wp-content/uploads/sites/35/2016/01/Skier_Tahoe_OAP_1923-672x372.jpeg",
"width": 672,
"height": 372,
"mimeType": "image/jpeg"
},
"twentyfourteen-full-width": {
"file": "https://cdn.kqed.org/wp-content/uploads/sites/35/2016/01/Skier_Tahoe_OAP_1923-1038x576.jpeg",
"width": 1038,
"height": 576,
"mimeType": "image/jpeg"
},
"guest-author-32": {
"file": "https://cdn.kqed.org/wp-content/uploads/sites/35/2016/01/Skier_Tahoe_OAP_1923-32x32.jpeg",
"width": 32,
"height": 32,
"mimeType": "image/jpeg"
},
"guest-author-64": {
"file": "https://cdn.kqed.org/wp-content/uploads/sites/35/2016/01/Skier_Tahoe_OAP_1923-64x64.jpeg",
"width": 64,
"height": 64,
"mimeType": "image/jpeg"
},
"guest-author-96": {
"file": "https://cdn.kqed.org/wp-content/uploads/sites/35/2016/01/Skier_Tahoe_OAP_1923-96x96.jpeg",
"width": 96,
"height": 96,
"mimeType": "image/jpeg"
},
"guest-author-128": {
"file": "https://cdn.kqed.org/wp-content/uploads/sites/35/2016/01/Skier_Tahoe_OAP_1923-128x128.jpeg",
"width": 128,
"height": 128,
"mimeType": "image/jpeg"
},
"detail": {
"file": "https://cdn.kqed.org/wp-content/uploads/sites/35/2016/01/Skier_Tahoe_OAP_1923-75x75.jpeg",
"width": 75,
"height": 75,
"mimeType": "image/jpeg"
},
"kqedFullSize": {
"file": "https://cdn.kqed.org/wp-content/uploads/sites/35/2016/01/Skier_Tahoe_OAP_1923.jpeg",
"width": 2000,
"height": 1500
}
},
"isLoading": false,
"fetchFailed": false
},
"science_404261": {
"type": "attachments",
"id": "science_404261",
"meta": {
"index": "attachments_1716263798",
"site": "science",
"id": "404261",
"found": true
},
"parent": 403806,
"imgSizes": {
"twentyfourteen-full-width": {
"file": "https://ww2.kqed.org/app/uploads/sites/35/2015/12/A-flood-area-1038x576.jpg",
"width": 1038,
"mimeType": "image/jpeg",
"height": 576
},
"thumbnail": {
"file": "https://ww2.kqed.org/app/uploads/sites/35/2015/12/A-flood-area-400x267.jpg",
"width": 400,
"mimeType": "image/jpeg",
"height": 267
},
"fd-sm": {
"file": "https://ww2.kqed.org/app/uploads/sites/35/2015/12/A-flood-area-960x641.jpg",
"width": 960,
"mimeType": "image/jpeg",
"height": 641
},
"post-thumbnail": {
"file": "https://ww2.kqed.org/app/uploads/sites/35/2015/12/A-flood-area-672x372.jpg",
"width": 672,
"mimeType": "image/jpeg",
"height": 372
},
"kqedFullSize": {
"file": "https://ww2.kqed.org/app/uploads/sites/35/2015/12/A-flood-area.jpg",
"width": 1440,
"height": 961
},
"large": {
"file": "https://ww2.kqed.org/app/uploads/sites/35/2015/12/A-flood-area-1440x961.jpg",
"width": 1440,
"mimeType": "image/jpeg",
"height": 961
},
"guest-author-96": {
"file": "https://ww2.kqed.org/app/uploads/sites/35/2015/12/A-flood-area-96x96.jpg",
"width": 96,
"mimeType": "image/jpeg",
"height": 96
},
"medium": {
"file": "https://ww2.kqed.org/app/uploads/sites/35/2015/12/A-flood-area-800x534.jpg",
"width": 800,
"mimeType": "image/jpeg",
"height": 534
},
"guest-author-64": {
"file": "https://ww2.kqed.org/app/uploads/sites/35/2015/12/A-flood-area-64x64.jpg",
"width": 64,
"mimeType": "image/jpeg",
"height": 64
},
"guest-author-32": {
"file": "https://ww2.kqed.org/app/uploads/sites/35/2015/12/A-flood-area-32x32.jpg",
"width": 32,
"mimeType": "image/jpeg",
"height": 32
},
"fd-med": {
"file": "https://ww2.kqed.org/app/uploads/sites/35/2015/12/A-flood-area-1180x787.jpg",
"width": 1180,
"mimeType": "image/jpeg",
"height": 787
},
"detail": {
"file": "https://ww2.kqed.org/app/uploads/sites/35/2015/12/A-flood-area-75x75.jpg",
"width": 75,
"mimeType": "image/jpeg",
"height": 75
},
"guest-author-128": {
"file": "https://ww2.kqed.org/app/uploads/sites/35/2015/12/A-flood-area-128x128.jpg",
"width": 128,
"mimeType": "image/jpeg",
"height": 128
}
},
"publishDate": 1449705248,
"modified": 1449705385,
"caption": "Flooded intersection in Pacifica during December 2014. Storms this winter are expected to be even more severe.",
"description": null,
"title": "A flood area",
"credit": "Steve Byrne/KQED",
"status": "inherit",
"isLoading": false,
"fetchFailed": false
},
"science_368802": {
"type": "attachments",
"id": "science_368802",
"meta": {
"index": "attachments_1716263798",
"site": "science",
"id": "368802",
"found": true
},
"parent": 368478,
"imgSizes": {
"twentyfourteen-full-width": {
"file": "https://ww2.kqed.org/app/uploads/sites/35/2015/11/RS17506_2015-02-05-Storm-qut-1038x576.jpg",
"width": 1038,
"mimeType": "image/jpeg",
"height": 576
},
"thumbnail": {
"file": "https://ww2.kqed.org/app/uploads/sites/35/2015/11/RS17506_2015-02-05-Storm-qut-400x300.jpg",
"width": 400,
"mimeType": "image/jpeg",
"height": 300
},
"fd-sm": {
"file": "https://ww2.kqed.org/app/uploads/sites/35/2015/11/RS17506_2015-02-05-Storm-qut-960x720.jpg",
"width": 960,
"mimeType": "image/jpeg",
"height": 720
},
"post-thumbnail": {
"file": "https://ww2.kqed.org/app/uploads/sites/35/2015/11/RS17506_2015-02-05-Storm-qut-672x372.jpg",
"width": 672,
"mimeType": "image/jpeg",
"height": 372
},
"kqedFullSize": {
"file": "https://ww2.kqed.org/app/uploads/sites/35/2015/11/RS17506_2015-02-05-Storm-qut.jpg",
"width": 1280,
"height": 960
},
"fd-med": {
"file": "https://ww2.kqed.org/app/uploads/sites/35/2015/11/RS17506_2015-02-05-Storm-qut-1180x885.jpg",
"width": 1180,
"mimeType": "image/jpeg",
"height": 885
},
"guest-author-96": {
"file": "https://ww2.kqed.org/app/uploads/sites/35/2015/11/RS17506_2015-02-05-Storm-qut-96x96.jpg",
"width": 96,
"mimeType": "image/jpeg",
"height": 96
},
"medium": {
"file": "https://ww2.kqed.org/app/uploads/sites/35/2015/11/RS17506_2015-02-05-Storm-qut-800x600.jpg",
"width": 800,
"mimeType": "image/jpeg",
"height": 600
},
"guest-author-64": {
"file": "https://ww2.kqed.org/app/uploads/sites/35/2015/11/RS17506_2015-02-05-Storm-qut-64x64.jpg",
"width": 64,
"mimeType": "image/jpeg",
"height": 64
},
"detail": {
"file": "https://ww2.kqed.org/app/uploads/sites/35/2015/11/RS17506_2015-02-05-Storm-qut-75x75.jpg",
"width": 75,
"mimeType": "image/jpeg",
"height": 75
},
"guest-author-32": {
"file": "https://ww2.kqed.org/app/uploads/sites/35/2015/11/RS17506_2015-02-05-Storm-qut-32x32.jpg",
"width": 32,
"mimeType": "image/jpeg",
"height": 32
},
"guest-author-128": {
"file": "https://ww2.kqed.org/app/uploads/sites/35/2015/11/RS17506_2015-02-05-Storm-qut-128x128.jpg",
"width": 128,
"mimeType": "image/jpeg",
"height": 128
}
},
"publishDate": 1448061640,
"modified": 1448061674,
"caption": "A view out the window of the NOAA research plane, with the Richmond-San Rafael Bridge in the distance. The plane is gaining altitude to fly into the storm cloud.",
"description": "A view out the window of the NOAA research plane, with the Richmond-San Rafael Bridge in the distance. The plane is gaining altitude to fly into the storm cloud.",
"title": "CalWater NOAA",
"credit": "Danielle Venton/KQED",
"status": "inherit",
"isLoading": false,
"fetchFailed": false
},
"science_373699": {
"type": "attachments",
"id": "science_373699",
"meta": {
"index": "attachments_1716263798",
"site": "science",
"id": "373699",
"found": true
},
"parent": 367043,
"imgSizes": {
"thumbnail": {
"file": "https://ww2.kqed.org/app/uploads/sites/35/2015/11/map-400x267.jpg",
"width": 400,
"mimeType": "image/jpeg",
"height": 267
},
"post-thumbnail": {
"file": "https://ww2.kqed.org/app/uploads/sites/35/2015/11/map-672x372.jpg",
"width": 672,
"mimeType": "image/jpeg",
"height": 372
},
"kqedFullSize": {
"file": "https://ww2.kqed.org/app/uploads/sites/35/2015/11/map.jpg",
"width": 720,
"height": 480
},
"guest-author-96": {
"file": "https://ww2.kqed.org/app/uploads/sites/35/2015/11/map-96x96.jpg",
"width": 96,
"mimeType": "image/jpeg",
"height": 96
},
"guest-author-64": {
"file": "https://ww2.kqed.org/app/uploads/sites/35/2015/11/map-64x64.jpg",
"width": 64,
"mimeType": "image/jpeg",
"height": 64
},
"detail": {
"file": "https://ww2.kqed.org/app/uploads/sites/35/2015/11/map-75x75.jpg",
"width": 75,
"mimeType": "image/jpeg",
"height": 75
},
"guest-author-32": {
"file": "https://ww2.kqed.org/app/uploads/sites/35/2015/11/map-32x32.jpg",
"width": 32,
"mimeType": "image/jpeg",
"height": 32
},
"guest-author-128": {
"file": "https://ww2.kqed.org/app/uploads/sites/35/2015/11/map-128x128.jpg",
"width": 128,
"mimeType": "image/jpeg",
"height": 128
}
},
"publishDate": 1448304578,
"modified": 1448305034,
"caption": null,
"description": null,
"title": "map",
"credit": "Image from National Oceanic and Atmospheric Administration",
"status": "inherit",
"isLoading": false,
"fetchFailed": false
},
"science_317773": {
"type": "attachments",
"id": "science_317773",
"meta": {
"index": "attachments_1716263798",
"site": "science",
"id": "317773",
"found": true
},
"parent": 317772,
"imgSizes": {
"twentyfourteen-full-width": {
"file": "https://ww2.kqed.org/app/uploads/sites/35/2015/10/Stanislaus-channel-1038x576.jpg",
"width": 1038,
"mimeType": "image/jpeg",
"height": 576
},
"thumbnail": {
"file": "https://ww2.kqed.org/app/uploads/sites/35/2015/10/Stanislaus-channel-400x225.jpg",
"width": 400,
"mimeType": "image/jpeg",
"height": 225
},
"fd-sm": {
"file": "https://ww2.kqed.org/app/uploads/sites/35/2015/10/Stanislaus-channel-960x541.jpg",
"width": 960,
"mimeType": "image/jpeg",
"height": 541
},
"post-thumbnail": {
"file": "https://ww2.kqed.org/app/uploads/sites/35/2015/10/Stanislaus-channel-672x372.jpg",
"width": 672,
"mimeType": "image/jpeg",
"height": 372
},
"kqedFullSize": {
"file": "https://ww2.kqed.org/app/uploads/sites/35/2015/10/Stanislaus-channel.jpg",
"width": 1300,
"height": 732
},
"fd-med": {
"file": "https://ww2.kqed.org/app/uploads/sites/35/2015/10/Stanislaus-channel-1180x664.jpg",
"width": 1180,
"mimeType": "image/jpeg",
"height": 664
},
"guest-author-96": {
"file": "https://ww2.kqed.org/app/uploads/sites/35/2015/10/Stanislaus-channel-96x96.jpg",
"width": 96,
"mimeType": "image/jpeg",
"height": 96
},
"medium": {
"file": "https://ww2.kqed.org/app/uploads/sites/35/2015/10/Stanislaus-channel-800x450.jpg",
"width": 800,
"mimeType": "image/jpeg",
"height": 450
},
"guest-author-64": {
"file": "https://ww2.kqed.org/app/uploads/sites/35/2015/10/Stanislaus-channel-64x64.jpg",
"width": 64,
"mimeType": "image/jpeg",
"height": 64
},
"detail": {
"file": "https://ww2.kqed.org/app/uploads/sites/35/2015/10/Stanislaus-channel-75x75.jpg",
"width": 75,
"mimeType": "image/jpeg",
"height": 75
},
"guest-author-32": {
"file": "https://ww2.kqed.org/app/uploads/sites/35/2015/10/Stanislaus-channel-32x32.jpg",
"width": 32,
"mimeType": "image/jpeg",
"height": 32
},
"guest-author-128": {
"file": "https://ww2.kqed.org/app/uploads/sites/35/2015/10/Stanislaus-channel-128x128.jpg",
"width": 128,
"mimeType": "image/jpeg",
"height": 128
}
},
"publishDate": 1445449347,
"modified": 1445458832,
"caption": "The basic configuration of mountain rivers, like the Stanislaus River near Avery in the Sierra Nevada, is shaped by rare storm events that move the largest minivan-sized boulders in this view.",
"description": null,
"title": "Stanislaus-channel",
"credit": "Andrew Alden/KQED",
"status": "inherit",
"isLoading": false,
"fetchFailed": false
},
"science_267718": {
"type": "attachments",
"id": "science_267718",
"meta": {
"index": "attachments_1716263798",
"site": "science",
"id": "267718",
"found": true
},
"parent": 255377,
"imgSizes": {
"twentyfourteen-full-width": {
"file": "https://ww2.kqed.org/app/uploads/sites/35/2015/09/PGE-tree-limb-removal-e1442855479419-1038x576.jpg",
"width": 1038,
"mimeType": "image/jpeg",
"height": 576
},
"thumbnail": {
"file": "https://ww2.kqed.org/app/uploads/sites/35/2015/09/PGE-tree-limb-removal-e1442855479419-400x263.jpg",
"width": 400,
"mimeType": "image/jpeg",
"height": 263
},
"fd-sm": {
"file": "https://ww2.kqed.org/app/uploads/sites/35/2015/09/PGE-tree-limb-removal-e1442855479419-960x631.jpg",
"width": 960,
"mimeType": "image/jpeg",
"height": 631
},
"post-thumbnail": {
"file": "https://ww2.kqed.org/app/uploads/sites/35/2015/09/PGE-tree-limb-removal-e1442855479419-672x372.jpg",
"width": 672,
"mimeType": "image/jpeg",
"height": 372
},
"kqedFullSize": {
"file": "https://ww2.kqed.org/app/uploads/sites/35/2015/09/PGE-tree-limb-removal-e1442855479419.jpg",
"width": 1632,
"height": 1073
},
"large": {
"file": "https://ww2.kqed.org/app/uploads/sites/35/2015/09/PGE-tree-limb-removal-e1442855479419-1440x947.jpg",
"width": 1440,
"mimeType": "image/jpeg",
"height": 947
},
"guest-author-96": {
"file": "https://ww2.kqed.org/app/uploads/sites/35/2015/09/PGE-tree-limb-removal-e1442855479419-96x96.jpg",
"width": 96,
"mimeType": "image/jpeg",
"height": 96
},
"medium": {
"file": "https://ww2.kqed.org/app/uploads/sites/35/2015/09/PGE-tree-limb-removal-e1442855479419-800x526.jpg",
"width": 800,
"mimeType": "image/jpeg",
"height": 526
},
"guest-author-64": {
"file": "https://ww2.kqed.org/app/uploads/sites/35/2015/09/PGE-tree-limb-removal-e1442855479419-64x64.jpg",
"width": 64,
"mimeType": "image/jpeg",
"height": 64
},
"guest-author-32": {
"file": "https://ww2.kqed.org/app/uploads/sites/35/2015/09/PGE-tree-limb-removal-e1442855479419-32x32.jpg",
"width": 32,
"mimeType": "image/jpeg",
"height": 32
},
"fd-med": {
"file": "https://ww2.kqed.org/app/uploads/sites/35/2015/09/PGE-tree-limb-removal-e1442855479419-1180x776.jpg",
"width": 1180,
"mimeType": "image/jpeg",
"height": 776
},
"detail": {
"file": "https://ww2.kqed.org/app/uploads/sites/35/2015/09/PGE-tree-limb-removal-e1442855479419-75x75.jpg",
"width": 75,
"mimeType": "image/jpeg",
"height": 75
},
"guest-author-128": {
"file": "https://ww2.kqed.org/app/uploads/sites/35/2015/09/PGE-tree-limb-removal-e1442855479419-128x128.jpg",
"width": 128,
"mimeType": "image/jpeg",
"height": 128
}
},
"publishDate": 1442855090,
"modified": 1443041119,
"caption": "General Foreman Rene Landa holds a segment of a tree limb that was removed from a Douglas fir. The conifer is dying and close to a power line. ",
"description": null,
"title": "drought trees PGE",
"credit": "Lindsey Hoshaw/KQED",
"status": "inherit",
"isLoading": false,
"fetchFailed": false
},
"science_270240": {
"type": "attachments",
"id": "science_270240",
"meta": {
"index": "attachments_1716263798",
"site": "science",
"id": "270240",
"found": true
},
"parent": 270178,
"imgSizes": {
"thumbnail": {
"file": "https://ww2.kqed.org/app/uploads/sites/35/2015/09/LindaBaja_md_NASA-400x309.jpg",
"width": 400,
"mimeType": "image/jpeg",
"height": 309
},
"post-thumbnail": {
"file": "https://ww2.kqed.org/app/uploads/sites/35/2015/09/LindaBaja_md_NASA-672x372.jpg",
"width": 672,
"mimeType": "image/jpeg",
"height": 372
},
"kqedFullSize": {
"file": "https://ww2.kqed.org/app/uploads/sites/35/2015/09/LindaBaja_md_NASA.jpg",
"width": 732,
"height": 566
},
"guest-author-96": {
"file": "https://ww2.kqed.org/app/uploads/sites/35/2015/09/LindaBaja_md_NASA-96x96.jpg",
"width": 96,
"mimeType": "image/jpeg",
"height": 96
},
"guest-author-64": {
"file": "https://ww2.kqed.org/app/uploads/sites/35/2015/09/LindaBaja_md_NASA-64x64.jpg",
"width": 64,
"mimeType": "image/jpeg",
"height": 64
},
"detail": {
"file": "https://ww2.kqed.org/app/uploads/sites/35/2015/09/LindaBaja_md_NASA-75x75.jpg",
"width": 75,
"mimeType": "image/jpeg",
"height": 75
},
"guest-author-32": {
"file": "https://ww2.kqed.org/app/uploads/sites/35/2015/09/LindaBaja_md_NASA-32x32.jpg",
"width": 32,
"mimeType": "image/jpeg",
"height": 32
},
"guest-author-128": {
"file": "https://ww2.kqed.org/app/uploads/sites/35/2015/09/LindaBaja_md_NASA-128x128.jpg",
"width": 128,
"mimeType": "image/jpeg",
"height": 128
}
},
"publishDate": 1442966394,
"modified": 1442966464,
"caption": "Hurricane Linda roars past Baja California, spreading upper-level moisture far to the north.",
"description": "Hurricane Linda roars past Baja California, spreading upper-level moisture far to the north.",
"title": "LindaBaja_md_NASA",
"credit": "NASA",
"status": "inherit",
"isLoading": false,
"fetchFailed": false
}
},
"audioPlayerReducer": {
"postId": "stream_live",
"isPaused": true,
"isPlaying": false,
"pfsActive": false,
"pledgeModalIsOpen": true,
"playerDrawerIsOpen": false,
"liveAudioPlayStartedAt": 0,
"liveAudioPlayContext": ""
},
"authorsReducer": {
"byline_science_581726": {
"type": "authors",
"id": "byline_science_581726",
"meta": {
"override": true
},
"slug": "byline_science_581726",
"name": "\u003cstrong>Andrea Thompson, Climate Central\u003c/strong>",
"isLoading": false
},
"byline_science_560497": {
"type": "authors",
"id": "byline_science_560497",
"meta": {
"override": true
},
"slug": "byline_science_560497",
"name": "\u003cstrong>\u003ca href=\"https://earth.stanford.edu/daniel-swain\">Daniel Swain\u003c/a>, Stanford University\u003c/strong>",
"isLoading": false
},
"byline_science_502283": {
"type": "authors",
"id": "byline_science_502283",
"meta": {
"override": true
},
"slug": "byline_science_502283",
"name": "\u003cstrong>\u003ca href=\"https://earth.stanford.edu/daniel-swain\">Daniel Swain\u003c/a>, Stanford University\u003c/strong>",
"isLoading": false
},
"byline_science_499218": {
"type": "authors",
"id": "byline_science_499218",
"meta": {
"override": true
},
"slug": "byline_science_499218",
"name": "Danielle Venton",
"isLoading": false
},
"byline_science_367043": {
"type": "authors",
"id": "byline_science_367043",
"meta": {
"override": true
},
"slug": "byline_science_367043",
"name": "\u003cstrong>\u003ca href=\"https://earth.stanford.edu/daniel-swain\">Daniel Swain\u003c/a>, Stanford University\u003c/strong>",
"isLoading": false
},
"cmiller": {
"type": "authors",
"id": "221",
"meta": {
"index": "authors_1716337520",
"id": "221",
"found": true
},
"name": "Craig Miller",
"firstName": "Craig",
"lastName": "Miller",
"slug": "cmiller",
"email": "craig@voxterra.net",
"display_author_email": false,
"staff_mastheads": [
"science"
],
"title": "Editor Emeritus, Science",
"bio": "Craig is a former KQED Science editor, specializing in weather, climate, water & energy issues, with a little seismology thrown in just to shake things up. Prior to that, he launched and led the station's award-winning multimedia project, Climate Watch. Craig is also an accomplished writer/producer of television documentaries, with a focus on natural resource issues.",
"avatar": "https://secure.gravatar.com/avatar/b91661df645e001a9cafe0861fa685f9?s=600&d=blank&r=g",
"twitter": "voxterra",
"facebook": null,
"instagram": null,
"linkedin": null,
"sites": [
{
"site": "news",
"roles": [
"author"
]
},
{
"site": "futureofyou",
"roles": [
"editor"
]
},
{
"site": "stateofhealth",
"roles": [
"author"
]
},
{
"site": "science",
"roles": [
"editor"
]
},
{
"site": "quest",
"roles": [
"editor"
]
}
],
"headData": {
"title": "Craig Miller | KQED",
"description": "Editor Emeritus, Science",
"ogImgSrc": "https://secure.gravatar.com/avatar/b91661df645e001a9cafe0861fa685f9?s=600&d=blank&r=g",
"twImgSrc": "https://secure.gravatar.com/avatar/b91661df645e001a9cafe0861fa685f9?s=600&d=blank&r=g"
},
"isLoading": false,
"link": "/author/cmiller"
},
"lindseyhoshaw": {
"type": "authors",
"id": "5432",
"meta": {
"index": "authors_1716337520",
"id": "5432",
"found": true
},
"name": "Lindsey Hoshaw",
"firstName": "Lindsey",
"lastName": "Hoshaw",
"slug": "lindseyhoshaw",
"email": "lhoshaw@kqed.org",
"display_author_email": false,
"staff_mastheads": [],
"title": "KQED Contributor",
"bio": "Lindsey Hoshaw is a former interactive producer for KQED Science. Before joining KQED, Lindsey was a science correspondent for The New York Times, The Boston Globe, Forbes and Scientific American. On Twitter @lindseyhoshaw",
"avatar": "https://secure.gravatar.com/avatar/274b07694c998eaa8f26cfabaa941186?s=600&d=mm&r=g",
"twitter": "lindseyhoshaw",
"facebook": "lindsey.hoshaw.9",
"instagram": null,
"linkedin": null,
"sites": [
{
"site": "arts",
"roles": [
"author"
]
},
{
"site": "news",
"roles": [
"subscriber"
]
},
{
"site": "futureofyou",
"roles": [
"editor"
]
},
{
"site": "bayareabites",
"roles": [
"contributor"
]
},
{
"site": "stateofhealth",
"roles": [
"author"
]
},
{
"site": "science",
"roles": [
"edit_theme_options",
"subscriber"
]
},
{
"site": "quest",
"roles": [
"edit_post_subscriptions",
"edit_usergroups",
"unfiltered_html",
"unfiltered_upload",
"leadcoordinator",
"editor"
]
},
{
"site": "food",
"roles": []
}
],
"headData": {
"title": "Lindsey Hoshaw | KQED",
"description": "KQED Contributor",
"ogImgSrc": "https://secure.gravatar.com/avatar/274b07694c998eaa8f26cfabaa941186?s=600&d=mm&r=g",
"twImgSrc": "https://secure.gravatar.com/avatar/274b07694c998eaa8f26cfabaa941186?s=600&d=mm&r=g"
},
"isLoading": false,
"link": "/author/lindseyhoshaw"
},
"andrew-alden": {
"type": "authors",
"id": "6228",
"meta": {
"index": "authors_1716337520",
"id": "6228",
"found": true
},
"name": "Andrew Alden",
"firstName": "Andrew",
"lastName": "Alden",
"slug": "andrew-alden",
"email": "alden@andrew-alden.com",
"display_author_email": false,
"staff_mastheads": [],
"title": null,
"bio": "Andrew Alden earned his geology degree at the University of New Hampshire and moved back to the Bay Area to work at the U.S. Geological Survey for six years. He has \u003ca href=\"http://geology.about.com/\">written on geology for About.com\u003c/a> since its founding in 1997. In 2007, he started the Oakland Geology blog, which won recognition as \"Best of the East Bay\" from the \u003ci>East Bay Express\u003c/i> in 2010. In writing about geology in the Bay Area and surroundings, he hopes to share some of the useful and pleasurable insights that geologists give us—not just facts about the deep past, but an attitude that might be called the \u003ci>deep present\u003c/i>.\r\n\r\nRead his \u003ca href=\"http://science.kqed.org/quest/author/andrew-alden/\">previous contributions\u003c/a> to \u003ca href=\"http://http://science.kqed.org/quest/\">QUEST\u003c/a>, a project dedicated to exploring the Science of Sustainability.",
"avatar": "https://secure.gravatar.com/avatar/9eaa0afc32f98c5fc7ce634437334a64?s=600&d=blank&r=g",
"twitter": null,
"facebook": null,
"instagram": null,
"linkedin": null,
"sites": [
{
"site": "science",
"roles": [
"author"
]
},
{
"site": "quest",
"roles": [
"subscriber"
]
}
],
"headData": {
"title": "Andrew Alden | KQED",
"description": null,
"ogImgSrc": "https://secure.gravatar.com/avatar/9eaa0afc32f98c5fc7ce634437334a64?s=600&d=blank&r=g",
"twImgSrc": "https://secure.gravatar.com/avatar/9eaa0afc32f98c5fc7ce634437334a64?s=600&d=blank&r=g"
},
"isLoading": false,
"link": "/author/andrew-alden"
},
"progers539": {
"type": "authors",
"id": "8673",
"meta": {
"index": "authors_1716337520",
"id": "8673",
"found": true
},
"name": "Paul Rogers",
"firstName": "Paul",
"lastName": "Rogers",
"slug": "progers539",
"email": "progers@kqed.org",
"display_author_email": false,
"staff_mastheads": [
"science"
],
"title": "Managing Editor, Science",
"bio": "Paul worked as managing editor for the KQED Science team from 2005 to 2020. Paul also works as the Natural Resources & Environment Writer at the San Jose Mercury News, where he has covered climate change, oceans, air pollution, energy, water policy, endangered species, toxics, parks and other issues. Paul was part of the Mercury News team that won a Pulitzer Prize in 1990 for coverage of the Loma Prieta earthquake. Paul also has taught environmental journalism at the UC Berkeley Graduate School of Journalism, and at the UC Santa Cruz Science Communication Program. From 2001 to 2010, he served as chairman of the Institutes of Journalism and Natural Resources, a nonprofit group that provides training to reporters of all backgrounds to improve environmental and science journalism.",
"avatar": "https://secure.gravatar.com/avatar/ccf06b30ef44e13eb17a5640a6f82479?s=600&d=blank&r=g",
"twitter": "paulrogerssjmn",
"facebook": null,
"instagram": null,
"linkedin": null,
"sites": [
{
"site": "futureofyou",
"roles": [
"editor"
]
},
{
"site": "science",
"roles": [
"editor"
]
}
],
"headData": {
"title": "Paul Rogers | KQED",
"description": "Managing Editor, Science",
"ogImgSrc": "https://secure.gravatar.com/avatar/ccf06b30ef44e13eb17a5640a6f82479?s=600&d=blank&r=g",
"twImgSrc": "https://secure.gravatar.com/avatar/ccf06b30ef44e13eb17a5640a6f82479?s=600&d=blank&r=g"
},
"isLoading": false,
"link": "/author/progers539"
},
"dventon": {
"type": "authors",
"id": "11088",
"meta": {
"index": "authors_1716337520",
"id": "11088",
"found": true
},
"name": "Danielle Venton",
"firstName": "Danielle",
"lastName": "Venton",
"slug": "dventon",
"email": "dventon@kqed.org",
"display_author_email": true,
"staff_mastheads": [
"science"
],
"title": "Science reporter",
"bio": "Danielle Venton is a reporter for KQED Science. She covers wildfires, space and oceans (though she is prone to sea sickness).\r\n\r\nBefore joining KQED in 2015, Danielle was a staff reporter at KRCB in Sonoma County and a freelancer. She studied science communication at UC Santa Cruz and formerly worked at CERN in Geneva, Switzerland where she wrote about computing. She lives in Sonoma County and enjoys backpacking.",
"avatar": "https://secure.gravatar.com/avatar/37b292b5c40c8d93959c4f48d73b5286f41b7abd8588277e941905a3ed4c801c?s=600&d=blank&r=g",
"twitter": "DanielleVenton",
"bluesky": null,
"facebook": null,
"instagram": null,
"linkedin": null,
"sites": [
{
"site": "arts",
"roles": [
"contributor"
]
},
{
"site": "news",
"roles": [
"editor"
]
},
{
"site": "futureofyou",
"roles": [
"editor"
]
},
{
"site": "science",
"roles": [
"editor"
]
},
{
"site": "liveblog",
"roles": [
"contributor"
]
}
],
"headData": {
"title": "Danielle Venton | KQED",
"description": "Science reporter",
"ogImgSrc": "https://secure.gravatar.com/avatar/37b292b5c40c8d93959c4f48d73b5286f41b7abd8588277e941905a3ed4c801c?s=600&d=blank&r=g",
"twImgSrc": "https://secure.gravatar.com/avatar/37b292b5c40c8d93959c4f48d73b5286f41b7abd8588277e941905a3ed4c801c?s=600&d=blank&r=g"
},
"isLoading": false,
"link": "/author/dventon"
}
},
"pagesReducer": {
"science_tag_el-nino": {
"type": "terms",
"id": "science_371",
"meta": {
"index": "terms_1716263798",
"site": "science",
"id": "371",
"score": 9.308864
},
"featImg": null,
"name": "el nino",
"description": null,
"taxonomy": "tag",
"headData": {
"twImgId": null,
"twTitle": null,
"ogTitle": null,
"ogImgId": null,
"twDescription": null,
"description": null,
"title": "el nino Archives | KQED Science",
"ogDescription": null
},
"ttid": 377,
"slug": "el-nino",
"isLoading": false,
"title": "el nino",
"pageMeta": {
"site": "science",
"WpPageTemplate": "page-topic-editorial",
"currentPage": 2
},
"blocks": [
{
"blockName": "kqed/post-list",
"attrs": {
"layout": "cardArticle2",
"query": "posts/science?tag=el-nino",
"seeMore": false,
"paginated": true,
"page": 2
}
},
{
"blockName": "kqed/ad"
}
]
}
},
"pfsSessionReducer": {},
"postsReducer": {
"stream_live": {
"type": "live",
"id": "stream_live",
"audioUrl": "https://hls.kqed.org/hls/kqed_app/playlist.m3u8",
"title": "Live Stream",
"excerpt": "Live Stream information currently unavailable.",
"link": "/radio",
"featImg": "",
"label": {
"name": "KQED Live",
"link": "/"
}
},
"stream_kqedNewscast": {
"type": "posts",
"id": "stream_kqedNewscast",
"audioUrl": "https://www.kqed.org/.stream/anon/radio/RDnews/newscast.mp3?_=1",
"title": "KQED Newscast",
"featImg": "",
"label": {
"name": "88.5 FM",
"link": "/"
}
},
"science_581726": {
"type": "posts",
"id": "science_581726",
"meta": {
"index": "posts_1716263798",
"site": "science",
"id": "581726",
"score": null,
"sort": [
1458153097000
]
},
"parent": 0,
"labelTerm": {
"site": "science"
},
"blocks": [],
"publishDate": 1458153097,
"format": "standard",
"title": "How a Monster El Niño Transforms the World’s Weather",
"headTitle": "How a Monster El Niño Transforms the World’s Weather | KQED",
"content": "\u003cp>From crippling drought in southern Africa to a record number of February tornadoes in the U.S. Southeast, an exceptionally strong El Niño has been making headlines around the globe as it tampers with the world’s weather.\u003c/p>\n\u003cp>While the event has begun its slow decline, those wide-ranging impacts will continue to be felt for weeks and months to come — good news for those in California, who need El Niño-fueled rains, but bad news for the many areas, like Indonesia, which is suffering from deep drought, food and water shortages, and wildfires.\u003c/p>\n\u003cp>Already this year, El Niño-related weather has cost billions of dollars in damage and left some 100 million people \u003ca href=\"http://www.theguardian.com/global-development/2016/feb/17/el-nino-leaves-100-million-people-hungry-short-of-water-droughts-floods-worldwide\">facing food and water shortages\u003c/a>.\u003c/p>\n\u003cp>Through the interactive graphic below, Climate Central takes a look at how this major climate pattern typically influences the world’s weather, what it can mean for societies in the areas it affects, and what has actually been happening with this particular event, which ranks amongst the strongest on record. After all, \u003ca href=\"http://www.climatecentral.org/news/comparing-el-nino-to-1997-19278\">no two El Niños are the same\u003c/a>. For instance, while Southern California was drenched during the 1997-1998 El Niño, it has remained disconcertingly dry this time around.\u003c/p>\n\u003cp>\u003c!-- iframe plugin v.4.3 wordpress.org/plugins/iframe/ -->\u003cbr>\n\u003ciframe loading=\"lazy\" width=\"720\" height=\"571\" frameborder=\"0\" scrolling=\"no\" src=\"http://www.climatecentral.org/wgts/el-nino-impacts/index.html?utm_source=ext&utm_medium=embed&utm_campaign=2016ElNinoImpacts\" class=\"iframe-class\">\u003c/iframe>\u003c/p>\n\u003cp>[ad fullwidth]\u003c/p>\n\u003cp>First, the big picture: El Niño is most known for \u003ca href=\"http://www.climatecentral.org/news/why-do-we-care-so-much-about-el-nino-17806\">shifting a large pool of warm ocean waters\u003c/a> from the western to the central and eastern tropical Pacific. That shift changes where heat is pumped into the tropical atmosphere, disrupting its typical circulation patterns. Those local disruptions cause a domino effect through the global atmosphere that can alter weather thousands of miles away.\u003c/p>\n\u003cp>There are two main circulation patterns that are affected. All around the tropics is a pattern of rising and sinking air — like a vertical loop — called the \u003ca href=\"https://www.climate.gov/news-features/blogs/enso/walker-circulation-ensos-atmospheric-buddy\">Walker Circulation\u003c/a>. The rising air corresponds to areas of unsettled, rainy weather, while the sinking air creates a stable, dry clime. Normally in the tropical Pacific, a major area of rising air is found over the western portions, where the warmest waters are found. With the eastward shift from El Niño, that rising air (and its sinking counterpart) move eastward as well.\u003c/p>\n\u003cp>This displacement shifts the other branches of the Walker Circulation around the tropics, pushing wetter weather over areas that might normally be dry and vice versa. These areas typically see some of the strongest impacts from El Niño because they are in a region more directly linked to it.\u003c/p>\n\u003cp>The changes in the Walker Circulation in turn cause shifts in another looping pattern called the \u003ca href=\"https://www.climate.gov/news-features/blogs/enso/how-enso-leads-cascade-global-impacts\">Hadley Circulation\u003c/a> that runs north-to-south to the Walker’s east-to-west. And those changes in the Hadley Circulation can affect the subtropical jet stream — an area of fast-moving air that guides storms — in both the Northern and Southern hemispheres. This is how El Niño can affect regions far from the tropics.\u003c/p>\n\u003cp>The changes in these main circulation patterns interact with other factors, like seasonal monsoons and other major climate patterns, which is why none of the typical impacts associated with El Niño are guaranteed. It merely shifts the odds in their favor.\u003c/p>\n\u003cp>Let’s dive in for a closer look at some of the local and regional impacts and what has actually played out this year.\u003c/p>\n\u003cfigure id=\"attachment_581808\" class=\"wp-caption aligncenter\" style=\"max-width: 450px\">\u003cimg loading=\"lazy\" decoding=\"async\" class=\"size-full wp-image-581808\" src=\"http://ww2.kqed.org/science/wp-content/uploads/sites/35/2016/03/NOAA_el-Nino-graphic.jpg\" alt=\"How the Walker Circulation changes from neutral to El Niño conditions.\" width=\"450\" height=\"451\" srcset=\"https://cdn.kqed.org/wp-content/uploads/sites/35/2016/03/NOAA_el-Nino-graphic.jpg 450w, https://cdn.kqed.org/wp-content/uploads/sites/35/2016/03/NOAA_el-Nino-graphic-400x401.jpg 400w, https://cdn.kqed.org/wp-content/uploads/sites/35/2016/03/NOAA_el-Nino-graphic-32x32.jpg 32w, https://cdn.kqed.org/wp-content/uploads/sites/35/2016/03/NOAA_el-Nino-graphic-64x64.jpg 64w, https://cdn.kqed.org/wp-content/uploads/sites/35/2016/03/NOAA_el-Nino-graphic-96x96.jpg 96w, https://cdn.kqed.org/wp-content/uploads/sites/35/2016/03/NOAA_el-Nino-graphic-128x128.jpg 128w, https://cdn.kqed.org/wp-content/uploads/sites/35/2016/03/NOAA_el-Nino-graphic-75x75.jpg 75w\" sizes=\"(max-width: 450px) 100vw, 450px\">\u003cfigcaption class=\"wp-caption-text\">How the Walker Circulation changes from neutral to El Niño conditions. \u003ccite>(Fiona Martin)\u003c/cite>\u003c/figcaption>\u003c/figure>\n\u003ch3>\u003cstrong>Southeast Asia\u003c/strong>\u003c/h3>\n\u003cp>Indonesia, and Southeast Asia more broadly, is one of the areas most directly impacted by El Niño. The eastward shift in the Walker Circulation means the normal area of rising air and rainy weather is shifted eastward as well, leaving the Indonesian area high and dry during much of the year. This can lead to drought that can cause water shortages and crop and livestock losses from dried up fields. Those losses then lead to food shortages and rising prices, and can also increase the odds of large wildfires.\u003c/p>\n\u003cp>This year has seen major drought grip Indonesia, Vietnam, Thailand, the Philippines and much of the \u003ca href=\"http://www.ncdc.noaa.gov/sotc/drought/201601#det-reg-pacis-usapi\">U.S. Pacific Island territories\u003c/a>. In Indonesia there were \u003ca href=\"https://www.irinnews.org/report/102140/el-nino-brings-drought-hunger-indonesia-and-south-pacific\">major delays\u003c/a> in the planting of the rice crop, leading to concerns over food shortages. And when farmers set their usual fires to clear brush for planting, the dry conditions caused many to burn out of control, causing one of the biggest burn years on record and leading to \u003ca href=\"http://www.climatecentral.org/news/indonesias-fires-climate-public-health-19601\">a pall of smoke\u003c/a> over the region. In Vietnam, drought has led to \u003ca href=\"http://www.channelnewsasia.com/news/asiapacific/vietnam-hit-by-worst/2562802.html\">salinization issues in the Mekong Delta\u003c/a> region, home to some 20 million people and a major rice growing area.\u003c/p>\n\u003cp>Drought has caused the Republic of the Marshall Islands and the Federated States of Micronesia to \u003ca href=\"http://www1.ncdc.noaa.gov/pub/data/cmb/sotc/drought/2016/01/RMI-Proclamation-Declaring-State-of-Emergency-160203.pdf\">declare states of emergency\u003c/a>, with some islands enacting water rationing and having to have water shipped in.\u003c/p>\n\u003ch3>\u003cstrong>Australia\u003c/strong>\u003c/h3>\n\u003cp>That same eastward shift of storm activity tends to bring drier conditions to northern Australia during the Southern Hemisphere summer and more broadly to the east in the winter. It also tends to bring warmer summer weather to southeast Australia because of the larger mass of stable, subsiding air in place. During El Niño years, drought and wildfires also become a concern here.\u003c/p>\n\u003cfigure id=\"attachment_581810\" class=\"wp-caption aligncenter\" style=\"max-width: 550px\">\u003cimg loading=\"lazy\" decoding=\"async\" class=\"size-full wp-image-581810\" src=\"http://ww2.kqed.org/science/wp-content/uploads/sites/35/2016/03/Australia_CC_image.jpg\" alt=\"A wildfire burns along the Great Ocean Road in Victoria, Australia in December 2015.\" width=\"550\" height=\"396\" srcset=\"https://cdn.kqed.org/wp-content/uploads/sites/35/2016/03/Australia_CC_image.jpg 550w, https://cdn.kqed.org/wp-content/uploads/sites/35/2016/03/Australia_CC_image-400x288.jpg 400w\" sizes=\"(max-width: 550px) 100vw, 550px\">\u003cfigcaption class=\"wp-caption-text\">A wildfire burns along the Great Ocean Road in Victoria, Australia in December 2015. \u003ccite>(Victoria County Fire Authority)\u003c/cite>\u003c/figcaption>\u003c/figure>\n\u003cp>So far this year, Australia has seen a mixed bag of El Niño impacts. While dry conditions have been in place in much of the usual areas, some of the inland regions of the eastern part of the country actually had fairly normal rains. That may be due to exceptionally warm Indian Ocean waters providing more moisture to storm systems. The southeast has seen some\u003ca href=\"http://www.theguardian.com/australia-news/2016/feb/10/perth-heatwave-temperatures-climb-above-40c-for-fourth-day-in-a-row\">major heat waves\u003c/a>, though, with temperatures sometimes climbing above 100°F (40°C). The hot and dry conditions have helped create more favorable wildfire conditions, with several burning in Victoria this year. One of the worst \u003ca href=\"http://www.abc.net.au/news/2015-12-25/great-ocean-road-fire-destroys-dozens-of-homes/7054028\">destroyed 116 houses\u003c/a> around Christmas.\u003c/p>\n\u003ch3>\u003cstrong>India\u003c/strong>\u003c/h3>\n\u003cp>India also tends to see drier weather during the Northern Hemisphere summer because the changes to atmospheric circulation patterns delay the onset of the seasonal monsoons. Monsoon rains are critical to supplying water for drinking and agriculture, and El Niño years tend to see drought develop in parts of India.\u003c/p>\n\u003cp>This summer, rainfall in India was 14 percent below normal and reservoirs were down by 30 percent, according to \u003ca href=\"http://www.unescap.org/sites/default/files/El%20Nino%20Advisory%20Note%20Dec%202015%20Final.pdf\">a United Nations report\u003c/a>. That led to shortages of drinking water in some areas and caused rice, corn and soybean fields to dry up, setting off worries for food shortages and \u003ca href=\"http://profit.ndtv.com/news/economy/article-rising-food-prices-to-hit-rural-india-in-2016-1242073\">inflated food prices\u003c/a>.\u003c/p>\n\u003cp>El Niño can lead to wetter weather in southern India, which also happened this year, with torrential rains that caused \u003ca href=\"http://www.accuweather.com/en/weather-news/india-tamil-nadu-chennai-flooding-continues-wet-november/53943597\">major flooding\u003c/a> in the area around Chennai.\u003c/p>\n\u003ch3>\u003cstrong>Pacific Ocean\u003c/strong>\u003c/h3>\n\u003cp>Moving back out into the Pacific Ocean, the warmer ocean waters can cause bleaching of coral reefs, killing them. This event has seen one of the \u003ca href=\"http://www.climatecentral.org/news/longest-global-coral-bleaching-20062\">longest global bleaching events\u003c/a> ever recorded, according to experts.\u003c/p>\n\u003cp>Warmer ocean waters in that area also provide more fuel for hurricanes in the central and eastern Pacific Ocean basins. The atmospheric changes El Niño brings also mean more favorable winds for storm formation. This year saw\u003ca href=\"http://wxshift.com/news/a-tale-of-two-hurricane-seasons\">above-normal hurricane activity\u003c/a> in the region, including the strongest storm ever directly measured in the Western Hemisphere. \u003ca href=\"http://www.climatecentral.org/news/patricia-record-setting-monster-beeline-for-mexico-19595\">Hurricane Patricia\u003c/a>, which had winds that clocked in at 200 mph, hit the west coast of Mexico, though its effects were mostly confined to less populated areas.\u003c/p>\n\u003ch3>\u003cstrong>South America\u003c/strong>\u003c/h3>\n\u003cp>Parts of South America are also more directly affected by El Niño. The warmer ocean waters off its west coast tend to bring warmer weather to coastal areas during the Southern Hemisphere winter. Those waters also make more moisture available to storms. Combined with changes to storm tracks linked to atmospheric circulation changes, this can mean wetter winter weather for central Chile. Several rounds of storms during this event had some benefits, bringing moisture to a region in drought and \u003ca href=\"http://www.reuters.com/article/us-chile-weather-idUSKCN0S127O20151007\">snows to ski resorts\u003c/a>. But the rains also brought flooding and mudslides. A rare storm event in March saw parts of the bone dry Atacama Desert receive a \u003ca href=\"https://www.climate.gov/news-features/event-tracker/flooding-chile%E2%80%99s-atacama-desert-after-years%E2%80%99-worth-rain-one-day\">year’s worth of rain\u003c/a> in just one day. The Copiapó River — dry for nearly 17 years — filled to overflowing and flash floods swept through several towns. Come spring, that influx of water led to a \u003ca href=\"https://www.washingtonpost.com/news/capital-weather-gang/wp/2015/10/29/the-driest-place-on-earth-is-covered-in-pink-flowers-after-a-crazy-year-of-rain/\">surreal bloom of flowers\u003c/a> across the desert that tends to coincide with rainy El Niño years.\u003c/p>\n\u003cp>The chain of changes to the Walker and Hadley circulations also tends to bring rainier weather to an area that includes Paraguay, northern Argentina, part of southern Brazil and Uruguay during the Southern Hemisphere summer. In December and January, heavy rains caused the \u003ca href=\"http://earthobservatory.nasa.gov/IOTD/view.php?id=87334\">worst flooding in the region\u003c/a> in 50 years, displacing more than 200,000 people. The Paraguay River in Asunción reached more than 16 feet above its normal level in December. Thousands of acres of cropland were inundated and concerns were heightened for the spread of mosquito-borne disease like dengue fever and the Zika virus.\u003c/p>\n\u003cp>In northern Brazil and other countries in the north of South America, the eastward shift of the Walker Circulation brings sinking air and drier conditions. Those come with the usual tendency toward drought, water shortages and crop and livestock losses. Drought and those follow-on impacts \u003ca href=\"http://news.trust.org//item/20151125082700-93r0x/?source=leadCarousel\">have been recorded\u003c/a> in northeastern Brazil, an area already vulnerable due to poverty and remoteness.\u003c/p>\n\u003cp>Some \u003ca href=\"http://health.usnews.com/health-news/articles/2016-02-05/record-heat-drought-may-explain-zika-outbreak-in-brazil-research\">recent research\u003c/a> has suggested that the exceptional heat and drought in the area may actually have helped fuel the rise of the \u003ca href=\"http://www.climatecentral.org/news/zika-virus-climate-change-19970\">Zika virus epidemic\u003c/a> in the region. Heat promotes the growth of the mosquito that carries the disease, and during drought, residents tend to store water in containers in which the mosquitoes can breed.\u003c/p>\n\u003ch3>\u003cstrong>Central America and the Caribbean\u003c/strong>\u003c/h3>\n\u003cp>Further north, drier weather also tends to grip Central America and the Caribbean for the same reasons as northern South America. The area that spans Guatemala, Nicaragua, Honduras and El Salvador is experiencing one of its worst droughts in decades, according to the \u003ca href=\"http://reliefweb.int/sites/reliefweb.int/files/resources/ECHO%20Crisis%20Report%20no%201-%20World%20El%20Nino.pdf\">European Commission\u003c/a>. Major crop losses have caused huge financial hits to farmers and left some 3.5 million people facing food shortages, the agency reported.\u003c/p>\n\u003cp>In the eastern Caribbean, 2015 was the driest year on record and led to water restrictions on many islands, including St. Lucia, St. Kitts, Barbados and \u003ca href=\"http://www.pbs.org/newshour/bb/how-puerto-rico-is-coping-with-the-worst-drought-in-decades/\">Puerto Rico\u003c/a>. Diminished water supplies also led to crop losses in the Dominican Republic, Haiti and other areas. As of August,\u003ca href=\"https://anumetservice.wordpress.com/2015/08/17/antigua-is-out-of-surface-water-again/\">Antigua had no surface water\u003c/a> supplies, and by October it was using 100 percent desalinated water.\u003c/p>\n\u003cp>The subsiding air that leads to drought also tends to help tamp down on hurricane formation in the region. This year saw a \u003ca href=\"http://wxshift.com/news/a-tale-of-two-hurricane-seasons\">below-average Atlantic hurricane season\u003c/a>.\u003c/p>\n\u003ch3>\u003cstrong>United States\u003c/strong>\u003c/h3>\n\u003cp>Not far away, though, El Niño brings the opposite conditions to Florida. The shifts in the Hadley Circulation affect the subtropical jet stream that crosses the U.S., pushing it southward and making it extend further eastward. This puts Florida in a prime location for storms during the winter months, which is normally its dry season. It also ups the odds for tornadoes thanks to the added energy from the jet stream.\u003c/p>\n\u003cp>Florida did have a \u003ca href=\"http://wxshift.com/news/el-nino-boosting-south-floridas-wild-winter-rains\">wetter than normal winter\u003c/a> this year, and its southern tip had its wettest year on record. It also \u003ca href=\"http://wxshift.com/news/record-high-number-of-tornadoes-hit-southeast-in-february\">saw 18 tornadoes\u003c/a> in January and February, compared to the seven it usually sees during those months.\u003c/p>\n\u003cp>While tornado activity may typically rise in Florida in El Niño years, it is usually tamped down in the area of the central U.S. known as Tornado Alley. The more southward jet blocks the moisture from the Gulf of Mexico that is key to fueling spring storms there. An experimental seasonal tornado forecast \u003ca href=\"http://www.climatecentral.org/news/el-nino-tornado-season-19910\">favors a below-average tornado season\u003c/a> there this year.\u003c/p>\n\u003cp>The tweak to the jet stream also tends to favor wetter weather over Southern California — much needed this year after four years of deep drought. While \u003ca href=\"http://wxshift.com/news/el-nino-helps-fuel-string-of-california-storms\">storms have been hitting California\u003c/a>, they have mostly affected the northern portions of the state because the jet stream has been slightly further north than is typical during an El Niño. The rains shut off almost completely in February, \u003ca href=\"http://wxshift.com/news/warm-west-cold-east-pattern-re-emerges-cuts-off-california-snows\">bringing hot and dry weather\u003c/a> to the state, though storms \u003ca href=\"http://wxshift.com/news/march-miracle-el-nino-fueled-storms-return-to-california\">have since returned\u003c/a>and look to bring at least some rain to Southern California.\u003c/p>\n\u003cp>Across the northern tier of the U.S., from the Northeast all the way up into eastern Alaska, El Niño tends to favor warmer than normal conditions. That has indeed been the case this year, with nearly all northern states recording one of their top 10 warmest winters. Alaska saw its \u003ca href=\"https://www.climatecentral.org/news/winter-warmest-on-record-for-us-20110\">second-warmest winter\u003c/a> in the books, which has contributed to a \u003ca href=\"http://wxshift.com/news/winter-snow-a-no-show-in-parts-of-alaska\">lack of snow\u003c/a> in varied locations there. That dearth of snow can have ecological impacts and promote the spread of invasive species. El Niño wasn’t the only reason Alaska was warm, though, as the Arctic more broadly was exceptionally warm this winter.\u003c/p>\n\u003ch3>\u003cstrong>Africa\u003c/strong>\u003c/h3>\n\u003cp>And, finally, across the Atlantic in Africa, some of the populations most vulnerable to El Niño’s impacts are found.\u003c/p>\n\u003cp>In the Southern Hemisphere summer, the eastward shift of the Walker Circulation leads to rising air over Kenya, southern Somalia and southern Ethiopia, which can enhance seasonal rains. Increased rains can lead to flooding, mudslides and outbreaks of diseases.\u003c/p>\n\u003cp>\u003ca href=\"http://www.kenyaredcross.org/PDF/El%20NinoSituationReport28.pdf\">Heavy rains\u003c/a> in the area began in late October, inundating villages and agricultural lands. By January, more than 100,000 people had been displaced and 112 killed, according to the \u003ca href=\"http://floodlist.com/africa/kenya-3-months-of-flooding-leaves-112-dead-and-over-100000-displaced\">International Federation of Red Cross and Red Crescent Societies\u003c/a>. Authorities are concerned about the spread of both waterborne diseases, such as cholera, and mosquito-borne ones, particularly \u003ca href=\"https://www.climate.gov/news-features/understanding-climate/el-ni%C3%B1o-east-africa-and-rift-valley-fever\">Rift Valley Fever\u003c/a>, which tends to occur in years with unusually heavy rainfall.\u003c/p>\n\u003cp>Just to the north, in Ethiopia and Somalia, El Niño has brought dry conditions that have exacerbated a drought and led to crop failures and widespread livestock deaths, according to the \u003ca href=\"http://www.un.org/apps/news/story.asp?NewsID=53381#.VucLz4wrKRs\">United Nations Food and Agriculture Organization\u003c/a>.\u003c/p>\n\u003cp>Drought has also gripped \u003ca href=\"https://www.climate.gov/news-features/event-tracker/not-so-rainy-season-drought-southern-africa-january-2016\">large parts of southern Africa\u003c/a>, particularly the northeast of South Africa, Mozambique and Zimbabwe. The changes to the Walker and Hadley circulations interact with the normal monsoon there and tend to suppress monsoon rains, leading to drought, crop losses and food and water shortages.\u003c/p>\n\u003cp>Severe rainfall deficits this year have lead to widespread drought that has decimated the maize crop, costing hundreds of millions of dollars in losses. Zimbabwe \u003ca href=\"http://www.independent.co.uk/news/world/africa/zimbabwean-president-robert-mugabe-declares-state-of-disaster-as-drought-means-24m-need-food-aid-a6857046.html\">declared a state of disaster\u003c/a> as some 2.5 million people are in need of food aid. South Africa, normally an exporter of corn, is expected to have to import it this year to feed its citizens.\u003c/p>\n\u003cp>The drought has also severely reduced the flow of rivers that feed hydropower dams, leading to power rationing and even blackouts in the region. The flow down the majestic Victoria Falls has \u003ca href=\"http://www.reuters.com/article/us-africa-drought-victoriafalls-idUSKCN0W340I?feedType=RSS&feedName=environmentNews\">reached a 30-year low\u003c/a>.\u003c/p>\n\u003cp>While El Niño has shown signs in recent weeks that it is beginning to weaken, it will likely be late summer or early fall before it fully dissipates. Its weather affects around the world are expected to continue for several more months, and the impacts of that weather could reverberate for years to come, making it one for the record books.\u003c/p>\n\u003cp>[ad floatright]\u003c/p>\n\u003cp>\u003ca href=\"http://www.climatecentral.org/\">Climate Central\u003c/a> \u003cem>is an independent organization that researches and reports on climate change.\u003c/em>\u003c/p>\n\n",
"stats": {
"hasVideo": false,
"hasChartOrMap": true,
"hasAudio": false,
"hasPolis": false,
"wordCount": 2593,
"hasGoogleForm": false,
"hasGallery": false,
"hasHearkenModule": false,
"iframeSrcs": [
"http://www.climatecentral.org/wgts/el-nino-impacts/index.html"
],
"paragraphCount": 44
},
"modified": 1704930481,
"excerpt": "An exceptionally strong El Niño has tampered with the world’s weather, bringing drought, floods and heat waves",
"headData": {
"twImgId": "",
"twTitle": "",
"ogTitle": "",
"ogImgId": "",
"twDescription": "",
"description": "An exceptionally strong El Niño has tampered with the world’s weather, bringing drought, floods and heat waves",
"title": "How a Monster El Niño Transforms the World’s Weather | KQED",
"ogDescription": "",
"schema": {
"@context": "https://schema.org",
"@type": "Article",
"headline": "How a Monster El Niño Transforms the World’s Weather",
"datePublished": "2016-03-16T11:31:37-07:00",
"dateModified": "2024-01-10T15:48:01-08:00",
"image": "https://cdn.kqed.org/wp-content/uploads/2020/02/KQED-OG-Image@1x.png"
}
},
"guestAuthors": [],
"slug": "how-a-monster-el-nino-transforms-the-worlds-weather",
"status": "publish",
"nprByline": "\u003cstrong>Andrea Thompson, Climate Central\u003c/strong>",
"sticky": false,
"path": "/science/581726/how-a-monster-el-nino-transforms-the-worlds-weather",
"audioTrackLength": null,
"parsedContent": [
{
"type": "contentString",
"content": "\u003cdiv class=\"post-body\">\u003cp>\u003cp>From crippling drought in southern Africa to a record number of February tornadoes in the U.S. Southeast, an exceptionally strong El Niño has been making headlines around the globe as it tampers with the world’s weather.\u003c/p>\n\u003cp>While the event has begun its slow decline, those wide-ranging impacts will continue to be felt for weeks and months to come — good news for those in California, who need El Niño-fueled rains, but bad news for the many areas, like Indonesia, which is suffering from deep drought, food and water shortages, and wildfires.\u003c/p>\n\u003cp>Already this year, El Niño-related weather has cost billions of dollars in damage and left some 100 million people \u003ca href=\"http://www.theguardian.com/global-development/2016/feb/17/el-nino-leaves-100-million-people-hungry-short-of-water-droughts-floods-worldwide\">facing food and water shortages\u003c/a>.\u003c/p>\n\u003cp>Through the interactive graphic below, Climate Central takes a look at how this major climate pattern typically influences the world’s weather, what it can mean for societies in the areas it affects, and what has actually been happening with this particular event, which ranks amongst the strongest on record. After all, \u003ca href=\"http://www.climatecentral.org/news/comparing-el-nino-to-1997-19278\">no two El Niños are the same\u003c/a>. For instance, while Southern California was drenched during the 1997-1998 El Niño, it has remained disconcertingly dry this time around.\u003c/p>\n\u003cp>\u003c!-- iframe plugin v.4.3 wordpress.org/plugins/iframe/ -->\u003cbr>\n\u003ciframe loading=\"lazy\" width=\"720\" height=\"571\" frameborder=\"0\" scrolling=\"no\" src=\"http://www.climatecentral.org/wgts/el-nino-impacts/index.html?utm_source=ext&utm_medium=embed&utm_campaign=2016ElNinoImpacts\" class=\"iframe-class\">\u003c/iframe>\u003c/p>\n\u003cp>\u003c/p>\u003c/div>",
"attributes": {
"named": {},
"numeric": []
}
},
{
"type": "component",
"content": "",
"name": "ad",
"attributes": {
"named": {
"label": "fullwidth"
},
"numeric": [
"fullwidth"
]
}
},
{
"type": "contentString",
"content": "\u003cdiv class=\"post-body\">\u003cp>\u003c/p>\n\u003cp>First, the big picture: El Niño is most known for \u003ca href=\"http://www.climatecentral.org/news/why-do-we-care-so-much-about-el-nino-17806\">shifting a large pool of warm ocean waters\u003c/a> from the western to the central and eastern tropical Pacific. That shift changes where heat is pumped into the tropical atmosphere, disrupting its typical circulation patterns. Those local disruptions cause a domino effect through the global atmosphere that can alter weather thousands of miles away.\u003c/p>\n\u003cp>There are two main circulation patterns that are affected. All around the tropics is a pattern of rising and sinking air — like a vertical loop — called the \u003ca href=\"https://www.climate.gov/news-features/blogs/enso/walker-circulation-ensos-atmospheric-buddy\">Walker Circulation\u003c/a>. The rising air corresponds to areas of unsettled, rainy weather, while the sinking air creates a stable, dry clime. Normally in the tropical Pacific, a major area of rising air is found over the western portions, where the warmest waters are found. With the eastward shift from El Niño, that rising air (and its sinking counterpart) move eastward as well.\u003c/p>\n\u003cp>This displacement shifts the other branches of the Walker Circulation around the tropics, pushing wetter weather over areas that might normally be dry and vice versa. These areas typically see some of the strongest impacts from El Niño because they are in a region more directly linked to it.\u003c/p>\n\u003cp>The changes in the Walker Circulation in turn cause shifts in another looping pattern called the \u003ca href=\"https://www.climate.gov/news-features/blogs/enso/how-enso-leads-cascade-global-impacts\">Hadley Circulation\u003c/a> that runs north-to-south to the Walker’s east-to-west. And those changes in the Hadley Circulation can affect the subtropical jet stream — an area of fast-moving air that guides storms — in both the Northern and Southern hemispheres. This is how El Niño can affect regions far from the tropics.\u003c/p>\n\u003cp>The changes in these main circulation patterns interact with other factors, like seasonal monsoons and other major climate patterns, which is why none of the typical impacts associated with El Niño are guaranteed. It merely shifts the odds in their favor.\u003c/p>\n\u003cp>Let’s dive in for a closer look at some of the local and regional impacts and what has actually played out this year.\u003c/p>\n\u003cfigure id=\"attachment_581808\" class=\"wp-caption aligncenter\" style=\"max-width: 450px\">\u003cimg loading=\"lazy\" decoding=\"async\" class=\"size-full wp-image-581808\" src=\"http://ww2.kqed.org/science/wp-content/uploads/sites/35/2016/03/NOAA_el-Nino-graphic.jpg\" alt=\"How the Walker Circulation changes from neutral to El Niño conditions.\" width=\"450\" height=\"451\" srcset=\"https://cdn.kqed.org/wp-content/uploads/sites/35/2016/03/NOAA_el-Nino-graphic.jpg 450w, https://cdn.kqed.org/wp-content/uploads/sites/35/2016/03/NOAA_el-Nino-graphic-400x401.jpg 400w, https://cdn.kqed.org/wp-content/uploads/sites/35/2016/03/NOAA_el-Nino-graphic-32x32.jpg 32w, https://cdn.kqed.org/wp-content/uploads/sites/35/2016/03/NOAA_el-Nino-graphic-64x64.jpg 64w, https://cdn.kqed.org/wp-content/uploads/sites/35/2016/03/NOAA_el-Nino-graphic-96x96.jpg 96w, https://cdn.kqed.org/wp-content/uploads/sites/35/2016/03/NOAA_el-Nino-graphic-128x128.jpg 128w, https://cdn.kqed.org/wp-content/uploads/sites/35/2016/03/NOAA_el-Nino-graphic-75x75.jpg 75w\" sizes=\"(max-width: 450px) 100vw, 450px\">\u003cfigcaption class=\"wp-caption-text\">How the Walker Circulation changes from neutral to El Niño conditions. \u003ccite>(Fiona Martin)\u003c/cite>\u003c/figcaption>\u003c/figure>\n\u003ch3>\u003cstrong>Southeast Asia\u003c/strong>\u003c/h3>\n\u003cp>Indonesia, and Southeast Asia more broadly, is one of the areas most directly impacted by El Niño. The eastward shift in the Walker Circulation means the normal area of rising air and rainy weather is shifted eastward as well, leaving the Indonesian area high and dry during much of the year. This can lead to drought that can cause water shortages and crop and livestock losses from dried up fields. Those losses then lead to food shortages and rising prices, and can also increase the odds of large wildfires.\u003c/p>\n\u003cp>This year has seen major drought grip Indonesia, Vietnam, Thailand, the Philippines and much of the \u003ca href=\"http://www.ncdc.noaa.gov/sotc/drought/201601#det-reg-pacis-usapi\">U.S. Pacific Island territories\u003c/a>. In Indonesia there were \u003ca href=\"https://www.irinnews.org/report/102140/el-nino-brings-drought-hunger-indonesia-and-south-pacific\">major delays\u003c/a> in the planting of the rice crop, leading to concerns over food shortages. And when farmers set their usual fires to clear brush for planting, the dry conditions caused many to burn out of control, causing one of the biggest burn years on record and leading to \u003ca href=\"http://www.climatecentral.org/news/indonesias-fires-climate-public-health-19601\">a pall of smoke\u003c/a> over the region. In Vietnam, drought has led to \u003ca href=\"http://www.channelnewsasia.com/news/asiapacific/vietnam-hit-by-worst/2562802.html\">salinization issues in the Mekong Delta\u003c/a> region, home to some 20 million people and a major rice growing area.\u003c/p>\n\u003cp>Drought has caused the Republic of the Marshall Islands and the Federated States of Micronesia to \u003ca href=\"http://www1.ncdc.noaa.gov/pub/data/cmb/sotc/drought/2016/01/RMI-Proclamation-Declaring-State-of-Emergency-160203.pdf\">declare states of emergency\u003c/a>, with some islands enacting water rationing and having to have water shipped in.\u003c/p>\n\u003ch3>\u003cstrong>Australia\u003c/strong>\u003c/h3>\n\u003cp>That same eastward shift of storm activity tends to bring drier conditions to northern Australia during the Southern Hemisphere summer and more broadly to the east in the winter. It also tends to bring warmer summer weather to southeast Australia because of the larger mass of stable, subsiding air in place. During El Niño years, drought and wildfires also become a concern here.\u003c/p>\n\u003cfigure id=\"attachment_581810\" class=\"wp-caption aligncenter\" style=\"max-width: 550px\">\u003cimg loading=\"lazy\" decoding=\"async\" class=\"size-full wp-image-581810\" src=\"http://ww2.kqed.org/science/wp-content/uploads/sites/35/2016/03/Australia_CC_image.jpg\" alt=\"A wildfire burns along the Great Ocean Road in Victoria, Australia in December 2015.\" width=\"550\" height=\"396\" srcset=\"https://cdn.kqed.org/wp-content/uploads/sites/35/2016/03/Australia_CC_image.jpg 550w, https://cdn.kqed.org/wp-content/uploads/sites/35/2016/03/Australia_CC_image-400x288.jpg 400w\" sizes=\"(max-width: 550px) 100vw, 550px\">\u003cfigcaption class=\"wp-caption-text\">A wildfire burns along the Great Ocean Road in Victoria, Australia in December 2015. \u003ccite>(Victoria County Fire Authority)\u003c/cite>\u003c/figcaption>\u003c/figure>\n\u003cp>So far this year, Australia has seen a mixed bag of El Niño impacts. While dry conditions have been in place in much of the usual areas, some of the inland regions of the eastern part of the country actually had fairly normal rains. That may be due to exceptionally warm Indian Ocean waters providing more moisture to storm systems. The southeast has seen some\u003ca href=\"http://www.theguardian.com/australia-news/2016/feb/10/perth-heatwave-temperatures-climb-above-40c-for-fourth-day-in-a-row\">major heat waves\u003c/a>, though, with temperatures sometimes climbing above 100°F (40°C). The hot and dry conditions have helped create more favorable wildfire conditions, with several burning in Victoria this year. One of the worst \u003ca href=\"http://www.abc.net.au/news/2015-12-25/great-ocean-road-fire-destroys-dozens-of-homes/7054028\">destroyed 116 houses\u003c/a> around Christmas.\u003c/p>\n\u003ch3>\u003cstrong>India\u003c/strong>\u003c/h3>\n\u003cp>India also tends to see drier weather during the Northern Hemisphere summer because the changes to atmospheric circulation patterns delay the onset of the seasonal monsoons. Monsoon rains are critical to supplying water for drinking and agriculture, and El Niño years tend to see drought develop in parts of India.\u003c/p>\n\u003cp>This summer, rainfall in India was 14 percent below normal and reservoirs were down by 30 percent, according to \u003ca href=\"http://www.unescap.org/sites/default/files/El%20Nino%20Advisory%20Note%20Dec%202015%20Final.pdf\">a United Nations report\u003c/a>. That led to shortages of drinking water in some areas and caused rice, corn and soybean fields to dry up, setting off worries for food shortages and \u003ca href=\"http://profit.ndtv.com/news/economy/article-rising-food-prices-to-hit-rural-india-in-2016-1242073\">inflated food prices\u003c/a>.\u003c/p>\n\u003cp>El Niño can lead to wetter weather in southern India, which also happened this year, with torrential rains that caused \u003ca href=\"http://www.accuweather.com/en/weather-news/india-tamil-nadu-chennai-flooding-continues-wet-november/53943597\">major flooding\u003c/a> in the area around Chennai.\u003c/p>\n\u003ch3>\u003cstrong>Pacific Ocean\u003c/strong>\u003c/h3>\n\u003cp>Moving back out into the Pacific Ocean, the warmer ocean waters can cause bleaching of coral reefs, killing them. This event has seen one of the \u003ca href=\"http://www.climatecentral.org/news/longest-global-coral-bleaching-20062\">longest global bleaching events\u003c/a> ever recorded, according to experts.\u003c/p>\n\u003cp>Warmer ocean waters in that area also provide more fuel for hurricanes in the central and eastern Pacific Ocean basins. The atmospheric changes El Niño brings also mean more favorable winds for storm formation. This year saw\u003ca href=\"http://wxshift.com/news/a-tale-of-two-hurricane-seasons\">above-normal hurricane activity\u003c/a> in the region, including the strongest storm ever directly measured in the Western Hemisphere. \u003ca href=\"http://www.climatecentral.org/news/patricia-record-setting-monster-beeline-for-mexico-19595\">Hurricane Patricia\u003c/a>, which had winds that clocked in at 200 mph, hit the west coast of Mexico, though its effects were mostly confined to less populated areas.\u003c/p>\n\u003ch3>\u003cstrong>South America\u003c/strong>\u003c/h3>\n\u003cp>Parts of South America are also more directly affected by El Niño. The warmer ocean waters off its west coast tend to bring warmer weather to coastal areas during the Southern Hemisphere winter. Those waters also make more moisture available to storms. Combined with changes to storm tracks linked to atmospheric circulation changes, this can mean wetter winter weather for central Chile. Several rounds of storms during this event had some benefits, bringing moisture to a region in drought and \u003ca href=\"http://www.reuters.com/article/us-chile-weather-idUSKCN0S127O20151007\">snows to ski resorts\u003c/a>. But the rains also brought flooding and mudslides. A rare storm event in March saw parts of the bone dry Atacama Desert receive a \u003ca href=\"https://www.climate.gov/news-features/event-tracker/flooding-chile%E2%80%99s-atacama-desert-after-years%E2%80%99-worth-rain-one-day\">year’s worth of rain\u003c/a> in just one day. The Copiapó River — dry for nearly 17 years — filled to overflowing and flash floods swept through several towns. Come spring, that influx of water led to a \u003ca href=\"https://www.washingtonpost.com/news/capital-weather-gang/wp/2015/10/29/the-driest-place-on-earth-is-covered-in-pink-flowers-after-a-crazy-year-of-rain/\">surreal bloom of flowers\u003c/a> across the desert that tends to coincide with rainy El Niño years.\u003c/p>\n\u003cp>The chain of changes to the Walker and Hadley circulations also tends to bring rainier weather to an area that includes Paraguay, northern Argentina, part of southern Brazil and Uruguay during the Southern Hemisphere summer. In December and January, heavy rains caused the \u003ca href=\"http://earthobservatory.nasa.gov/IOTD/view.php?id=87334\">worst flooding in the region\u003c/a> in 50 years, displacing more than 200,000 people. The Paraguay River in Asunción reached more than 16 feet above its normal level in December. Thousands of acres of cropland were inundated and concerns were heightened for the spread of mosquito-borne disease like dengue fever and the Zika virus.\u003c/p>\n\u003cp>In northern Brazil and other countries in the north of South America, the eastward shift of the Walker Circulation brings sinking air and drier conditions. Those come with the usual tendency toward drought, water shortages and crop and livestock losses. Drought and those follow-on impacts \u003ca href=\"http://news.trust.org//item/20151125082700-93r0x/?source=leadCarousel\">have been recorded\u003c/a> in northeastern Brazil, an area already vulnerable due to poverty and remoteness.\u003c/p>\n\u003cp>Some \u003ca href=\"http://health.usnews.com/health-news/articles/2016-02-05/record-heat-drought-may-explain-zika-outbreak-in-brazil-research\">recent research\u003c/a> has suggested that the exceptional heat and drought in the area may actually have helped fuel the rise of the \u003ca href=\"http://www.climatecentral.org/news/zika-virus-climate-change-19970\">Zika virus epidemic\u003c/a> in the region. Heat promotes the growth of the mosquito that carries the disease, and during drought, residents tend to store water in containers in which the mosquitoes can breed.\u003c/p>\n\u003ch3>\u003cstrong>Central America and the Caribbean\u003c/strong>\u003c/h3>\n\u003cp>Further north, drier weather also tends to grip Central America and the Caribbean for the same reasons as northern South America. The area that spans Guatemala, Nicaragua, Honduras and El Salvador is experiencing one of its worst droughts in decades, according to the \u003ca href=\"http://reliefweb.int/sites/reliefweb.int/files/resources/ECHO%20Crisis%20Report%20no%201-%20World%20El%20Nino.pdf\">European Commission\u003c/a>. Major crop losses have caused huge financial hits to farmers and left some 3.5 million people facing food shortages, the agency reported.\u003c/p>\n\u003cp>In the eastern Caribbean, 2015 was the driest year on record and led to water restrictions on many islands, including St. Lucia, St. Kitts, Barbados and \u003ca href=\"http://www.pbs.org/newshour/bb/how-puerto-rico-is-coping-with-the-worst-drought-in-decades/\">Puerto Rico\u003c/a>. Diminished water supplies also led to crop losses in the Dominican Republic, Haiti and other areas. As of August,\u003ca href=\"https://anumetservice.wordpress.com/2015/08/17/antigua-is-out-of-surface-water-again/\">Antigua had no surface water\u003c/a> supplies, and by October it was using 100 percent desalinated water.\u003c/p>\n\u003cp>The subsiding air that leads to drought also tends to help tamp down on hurricane formation in the region. This year saw a \u003ca href=\"http://wxshift.com/news/a-tale-of-two-hurricane-seasons\">below-average Atlantic hurricane season\u003c/a>.\u003c/p>\n\u003ch3>\u003cstrong>United States\u003c/strong>\u003c/h3>\n\u003cp>Not far away, though, El Niño brings the opposite conditions to Florida. The shifts in the Hadley Circulation affect the subtropical jet stream that crosses the U.S., pushing it southward and making it extend further eastward. This puts Florida in a prime location for storms during the winter months, which is normally its dry season. It also ups the odds for tornadoes thanks to the added energy from the jet stream.\u003c/p>\n\u003cp>Florida did have a \u003ca href=\"http://wxshift.com/news/el-nino-boosting-south-floridas-wild-winter-rains\">wetter than normal winter\u003c/a> this year, and its southern tip had its wettest year on record. It also \u003ca href=\"http://wxshift.com/news/record-high-number-of-tornadoes-hit-southeast-in-february\">saw 18 tornadoes\u003c/a> in January and February, compared to the seven it usually sees during those months.\u003c/p>\n\u003cp>While tornado activity may typically rise in Florida in El Niño years, it is usually tamped down in the area of the central U.S. known as Tornado Alley. The more southward jet blocks the moisture from the Gulf of Mexico that is key to fueling spring storms there. An experimental seasonal tornado forecast \u003ca href=\"http://www.climatecentral.org/news/el-nino-tornado-season-19910\">favors a below-average tornado season\u003c/a> there this year.\u003c/p>\n\u003cp>The tweak to the jet stream also tends to favor wetter weather over Southern California — much needed this year after four years of deep drought. While \u003ca href=\"http://wxshift.com/news/el-nino-helps-fuel-string-of-california-storms\">storms have been hitting California\u003c/a>, they have mostly affected the northern portions of the state because the jet stream has been slightly further north than is typical during an El Niño. The rains shut off almost completely in February, \u003ca href=\"http://wxshift.com/news/warm-west-cold-east-pattern-re-emerges-cuts-off-california-snows\">bringing hot and dry weather\u003c/a> to the state, though storms \u003ca href=\"http://wxshift.com/news/march-miracle-el-nino-fueled-storms-return-to-california\">have since returned\u003c/a>and look to bring at least some rain to Southern California.\u003c/p>\n\u003cp>Across the northern tier of the U.S., from the Northeast all the way up into eastern Alaska, El Niño tends to favor warmer than normal conditions. That has indeed been the case this year, with nearly all northern states recording one of their top 10 warmest winters. Alaska saw its \u003ca href=\"https://www.climatecentral.org/news/winter-warmest-on-record-for-us-20110\">second-warmest winter\u003c/a> in the books, which has contributed to a \u003ca href=\"http://wxshift.com/news/winter-snow-a-no-show-in-parts-of-alaska\">lack of snow\u003c/a> in varied locations there. That dearth of snow can have ecological impacts and promote the spread of invasive species. El Niño wasn’t the only reason Alaska was warm, though, as the Arctic more broadly was exceptionally warm this winter.\u003c/p>\n\u003ch3>\u003cstrong>Africa\u003c/strong>\u003c/h3>\n\u003cp>And, finally, across the Atlantic in Africa, some of the populations most vulnerable to El Niño’s impacts are found.\u003c/p>\n\u003cp>In the Southern Hemisphere summer, the eastward shift of the Walker Circulation leads to rising air over Kenya, southern Somalia and southern Ethiopia, which can enhance seasonal rains. Increased rains can lead to flooding, mudslides and outbreaks of diseases.\u003c/p>\n\u003cp>\u003ca href=\"http://www.kenyaredcross.org/PDF/El%20NinoSituationReport28.pdf\">Heavy rains\u003c/a> in the area began in late October, inundating villages and agricultural lands. By January, more than 100,000 people had been displaced and 112 killed, according to the \u003ca href=\"http://floodlist.com/africa/kenya-3-months-of-flooding-leaves-112-dead-and-over-100000-displaced\">International Federation of Red Cross and Red Crescent Societies\u003c/a>. Authorities are concerned about the spread of both waterborne diseases, such as cholera, and mosquito-borne ones, particularly \u003ca href=\"https://www.climate.gov/news-features/understanding-climate/el-ni%C3%B1o-east-africa-and-rift-valley-fever\">Rift Valley Fever\u003c/a>, which tends to occur in years with unusually heavy rainfall.\u003c/p>\n\u003cp>Just to the north, in Ethiopia and Somalia, El Niño has brought dry conditions that have exacerbated a drought and led to crop failures and widespread livestock deaths, according to the \u003ca href=\"http://www.un.org/apps/news/story.asp?NewsID=53381#.VucLz4wrKRs\">United Nations Food and Agriculture Organization\u003c/a>.\u003c/p>\n\u003cp>Drought has also gripped \u003ca href=\"https://www.climate.gov/news-features/event-tracker/not-so-rainy-season-drought-southern-africa-january-2016\">large parts of southern Africa\u003c/a>, particularly the northeast of South Africa, Mozambique and Zimbabwe. The changes to the Walker and Hadley circulations interact with the normal monsoon there and tend to suppress monsoon rains, leading to drought, crop losses and food and water shortages.\u003c/p>\n\u003cp>Severe rainfall deficits this year have lead to widespread drought that has decimated the maize crop, costing hundreds of millions of dollars in losses. Zimbabwe \u003ca href=\"http://www.independent.co.uk/news/world/africa/zimbabwean-president-robert-mugabe-declares-state-of-disaster-as-drought-means-24m-need-food-aid-a6857046.html\">declared a state of disaster\u003c/a> as some 2.5 million people are in need of food aid. South Africa, normally an exporter of corn, is expected to have to import it this year to feed its citizens.\u003c/p>\n\u003cp>The drought has also severely reduced the flow of rivers that feed hydropower dams, leading to power rationing and even blackouts in the region. The flow down the majestic Victoria Falls has \u003ca href=\"http://www.reuters.com/article/us-africa-drought-victoriafalls-idUSKCN0W340I?feedType=RSS&feedName=environmentNews\">reached a 30-year low\u003c/a>.\u003c/p>\n\u003cp>While El Niño has shown signs in recent weeks that it is beginning to weaken, it will likely be late summer or early fall before it fully dissipates. Its weather affects around the world are expected to continue for several more months, and the impacts of that weather could reverberate for years to come, making it one for the record books.\u003c/p>\n\u003cp>\u003c/p>\u003c/div>",
"attributes": {
"named": {},
"numeric": []
}
},
{
"type": "component",
"content": "",
"name": "ad",
"attributes": {
"named": {
"label": "floatright"
},
"numeric": [
"floatright"
]
}
},
{
"type": "contentString",
"content": "\u003cdiv class=\"post-body\">\u003cp>\u003c/p>\n\u003cp>\u003ca href=\"http://www.climatecentral.org/\">Climate Central\u003c/a> \u003cem>is an independent organization that researches and reports on climate change.\u003c/em>\u003c/p>\n\n\u003c/div>\u003c/p>",
"attributes": {
"named": {},
"numeric": []
}
}
],
"link": "/science/581726/how-a-monster-el-nino-transforms-the-worlds-weather",
"authors": [
"byline_science_581726"
],
"categories": [
"science_31",
"science_40"
],
"tags": [
"science_1678",
"science_194",
"science_371"
],
"featImg": "science_581803",
"label": "science"
},
"science_560497": {
"type": "posts",
"id": "science_560497",
"meta": {
"index": "posts_1716263798",
"site": "science",
"id": "560497",
"score": null,
"sort": [
1457063402000
]
},
"parent": 0,
"labelTerm": {
"site": "science",
"term": 1151
},
"blocks": [],
"publishDate": 1457063402,
"format": "standard",
"title": "March Miracle? El Niño Kicks Back in With Soaking Storms on the Way",
"headTitle": "March Miracle? El Niño Kicks Back in With Soaking Storms on the Way | KQED",
"content": "\u003cp>February was an extremely warm month (once again) across California, with temperature records falling on a daily basis. February was also quite dry across the state, with the only precipitation event of any note occurring around the middle of the month.\u003c/p>\n\u003cp>The Sierra Nevada snowpack — which had been hovering slightly above average through the end of January — started to fall behind by mid-month, and the \u003ca href=\"http://ww2.kqed.org/science/2016/03/01/sierra-snow-survey-offers-no-boost-for-drought-busting/\">March 1 snow survey\u003c/a> showed statewide snowpack slightly above 80 percent of average for the date. This number is decidedly better than \u003ca href=\"http://www.livescience.com/52265-california-snowpack-shrinking.html\">during recent winters\u003c/a>, but that’s really only a testament to the abysmal snowpack accumulations during the reign of the \u003ca href=\"http://ww2.kqed.org/science/2015/01/23/ridiculous-ridge-may-be-back-to-prolong-california-drought/\">Ridiculously Resilient Ridge\u003c/a> (of high pressure along the coast).\u003c/p>\n\u003cp>\u003cstrong>Change in the Wind\u003c/strong>\u003c/p>\n\u003cp>An abrupt change in the prevailing weather pattern is now at California’s doorstep, however. The persistent ridging of the past month or so is rapidly being displaced by a series of powerful storm systems, driven by a remarkable enhancement and consolidation of the Pacific jet stream.\u003c/p>\n\u003cfigure id=\"attachment_560640\" class=\"wp-caption aligncenter\" style=\"max-width: 1024px\">\u003cimg loading=\"lazy\" decoding=\"async\" class=\"size-full wp-image-560640\" src=\"http://ww2.kqed.org/science/wp-content/uploads/sites/35/2016/03/f3.png\" alt=\"The jet stream will be in a favorable position for active weather across California this weekend.\" width=\"1024\" height=\"715\" srcset=\"https://cdn.kqed.org/wp-content/uploads/sites/35/2016/03/f3.png 1024w, https://cdn.kqed.org/wp-content/uploads/sites/35/2016/03/f3-400x279.png 400w, https://cdn.kqed.org/wp-content/uploads/sites/35/2016/03/f3-800x559.png 800w, https://cdn.kqed.org/wp-content/uploads/sites/35/2016/03/f3-768x536.png 768w, https://cdn.kqed.org/wp-content/uploads/sites/35/2016/03/f3-960x670.png 960w\" sizes=\"(max-width: 1024px) 100vw, 1024px\">\u003cfigcaption class=\"wp-caption-text\">The jet stream will be in a favorable position for active weather across California this weekend. \u003ccite>(NCEP via tropicaltidbits.com)\u003c/cite>\u003c/figcaption>\u003c/figure>\n\u003cp>Rain has already begun across the northernmost portion of California, and will continue more or less continuously through Monday. Precipitation will gradually spread farther south on Friday and intensify on Saturday as a very strong cold front approaches the California coast. A robust \u003ca href=\"http://ww2.kqed.org/science/2015/11/23/flying-into-the-heart-of-the-wests-biggest-storms/\">atmospheric river\u003c/a> (arguably of the \u003ca href=\"https://en.wikipedia.org/wiki/Pineapple_Express\">Pineapple Express\u003c/a> variety, given its subtropical origins near Hawaii) will be in place in advance of the front itself, providing plenty of moisture for the impressive larger-scale dynamics to act upon. The nose of a strong jet streak will move inland over Central California before sagging southward over time, adding lift as this storm system sweeps across the state from northwest to southeast.\u003c/p>\n\u003cp>[ad fullwidth]\u003c/p>\n\u003cp>\u003cstrong>Thar She Blows\u003c/strong>\u003c/p>\n\u003cp>The very moist atmosphere combined with a fairly impressive frontal structure will likely lead to a period of very heavy rainfall across much of California. This setup would likely be cause for significant concern if conditions had been very wet, or if the front was expected to hang up over a given location. Right now, the whole system appears to be fast-moving enough to prevent severe flood concerns — especially given our dry February. But given the high intensity of the expected precipitation, it will be worth watching closely to see if a frontal wave develops on Saturday and stalls the front more than expected. Should that occur, flood concerns would increase considerably.\u003c/p>\n\u003cfigure id=\"attachment_560645\" class=\"wp-caption aligncenter\" style=\"max-width: 909px\">\u003cimg loading=\"lazy\" decoding=\"async\" class=\"size-full wp-image-560645\" src=\"http://ww2.kqed.org/science/wp-content/uploads/sites/35/2016/03/f4.png\" alt=\"Water vapor fluxes associated with this weekend’s atmospheric river will be impressive.\" width=\"909\" height=\"984\" srcset=\"https://cdn.kqed.org/wp-content/uploads/sites/35/2016/03/f4.png 909w, https://cdn.kqed.org/wp-content/uploads/sites/35/2016/03/f4-400x433.png 400w, https://cdn.kqed.org/wp-content/uploads/sites/35/2016/03/f4-800x866.png 800w, https://cdn.kqed.org/wp-content/uploads/sites/35/2016/03/f4-768x831.png 768w\" sizes=\"(max-width: 909px) 100vw, 909px\">\u003cfigcaption class=\"wp-caption-text\">Water vapor fluxes associated with this weekend’s atmospheric river will be impressive. \u003ccite>(NCEP via Scripps)\u003c/cite>\u003c/figcaption>\u003c/figure>\n\u003cp>In addition to impressive upper-level dynamics for this part of the world, a substantial reservoir of cold air behind the cold front will provide quite a bit of instability during and after frontal passage — leading to a decent chance of at least isolated thunderstorms across much of the state beginning later on Saturday. Strong and gusty winds — potentially 40 to 50 mph in some places — will also occur as surface pressure gradients strengthen.\u003c/p>\n\u003cp>A secondary system will develop rapidly late Saturday and early Sunday over the Pacific just west of California as the jet stream remains situated in an unusually favorable low-latitude position. While this surface low won’t have much time to develop before hitting the coast, it could still pack a substantial punch, particularly in Southern California. In fact, this second system could bring at least a brief burst of widespread heavy precipitation and perhaps thunderstorms to much of Southern California (focused from the Bay Area southward). There are some early indications that stronger surface-based instability could develop later Sunday or Monday across portions of Southern California, which could lead to the development of some severe thunderstorm activity near the coast.\u003c/p>\n\u003cfigure id=\"attachment_560646\" class=\"wp-caption aligncenter\" style=\"max-width: 1024px\">\u003cimg loading=\"lazy\" decoding=\"async\" class=\"size-full wp-image-560646\" src=\"http://ww2.kqed.org/science/wp-content/uploads/sites/35/2016/03/f5.png\" alt=\"The GFS is suggesting widespread heavy precipitation though Monday evening.\" width=\"1024\" height=\"715\" srcset=\"https://cdn.kqed.org/wp-content/uploads/sites/35/2016/03/f5.png 1024w, https://cdn.kqed.org/wp-content/uploads/sites/35/2016/03/f5-400x279.png 400w, https://cdn.kqed.org/wp-content/uploads/sites/35/2016/03/f5-800x559.png 800w, https://cdn.kqed.org/wp-content/uploads/sites/35/2016/03/f5-768x536.png 768w, https://cdn.kqed.org/wp-content/uploads/sites/35/2016/03/f5-960x670.png 960w\" sizes=\"(max-width: 1024px) 100vw, 1024px\">\u003cfigcaption class=\"wp-caption-text\">This forecast model suggests widespread heavy precipitation though Monday evening. \u003ccite>(NCEP via tropicaltidbits.com)\u003c/cite>\u003c/figcaption>\u003c/figure>\n\u003cp>Rainfall totals through Monday across Northern California will be in the 2-4 inch range in most places (including San Francisco and Sacramento), possibly more than double that (5-8+ inches) in the coastal hills and the northern Sierra Nevada foothills. Most of Southern California will probably see rainfall more on the order of 1-2 inches, with double that in the coastal mountains. Notably, however, this precipitation will fall rather quickly, and may cause more problems that would typically be the case with precipitation of this magnitude. In the Sierra Nevada, snow levels will start out quite high as the warm atmospheric river moves ashore but will plummet later in the weekend as much colder air arrives. Several (2-4) feet of new snowfall is likely above 7000 feet, and lesser accumulations down to 4000 feet or so are likely by Monday as the secondary system moves inland.\u003c/p>\n\u003cp>\u003cstrong>Models Waffle\u003cbr>\n\u003c/strong>\u003c/p>\n\u003cp>California weather (model) watchers got quite the show a couple of days ago when simulations started pointing toward an extreme precipitation event to develop next week, following this weekend’s still very heavy rainfall. The setup was one strongly reminiscent of that which makes California water wonks nervous: the occurrence of a very persistent and strong atmospheric river event focused upon a narrow stretch of the West Coast. Several model cycles were hinting at the potential for \u003ca href=\"https://twitter.com/Weather_West/status/704897495432884224\">truly incredible amounts of rain\u003c/a> and high-elevation snow between March 4 and March 12.\u003c/p>\n\u003cp>Fortunately, however, it now seems that those really extreme numbers are unlikely to come to pass. While a very impressive atmospheric river is still expected to develop across the eastern Pacific next week and eventually make it to California, it is not presently expected to be nearly as persistent as had been simulated a few days ago. Present models still suggest a storm that would be quite impressive by the low standards set during recent drought winters.\u003c/p>\n\u003cp>\u003cstrong>‘March Miracle:’ a Relative Term\u003cbr>\n\u003c/strong>\u003c/p>\n\u003cp>In the longer run, it seems likely that a fairly active weather pattern will continue across California for much of March. It’s hard to say at this point whether precipitation this month might approach the remarkable late-season levels of the “Miracle March” in 1991, but it does at least appear likely that California’s snowpack will recover, possibly back to above-average levels in the coming weeks. It’s less clear whether Southern California will be able to make up the seasonal precipitation deficit that has accumulated this year despite the near record-strength El Niño event in the tropical Pacific. Still, it appears increasingly likely that March will at least be able to make a dent — even though it’s quite clear that California’s multi-year drought will persist through the summer.\u003c/p>\n\u003cp>[ad floatright]\u003c/p>\n\u003cp>\u003cem>Daniel Swain is an atmospheric scientist at Stanford’s School of Earth, Energy & Environmental Sciences. A version of this post also appears on his \u003ca href=\"http://www.weatherwest.com/\">California Weather blog\u003c/a>.\u003c/em>\u003c/p>\n\n",
"stats": {
"hasVideo": false,
"hasChartOrMap": false,
"hasAudio": false,
"hasPolis": false,
"wordCount": 1160,
"hasGoogleForm": false,
"hasGallery": false,
"hasHearkenModule": false,
"iframeSrcs": [],
"paragraphCount": 18
},
"modified": 1704930531,
"excerpt": "A major shift in weather patterns should bring some serious rain and a boost to the Sierra snowpack.",
"headData": {
"twImgId": "",
"twTitle": "",
"ogTitle": "",
"ogImgId": "",
"twDescription": "",
"description": "A major shift in weather patterns should bring some serious rain and a boost to the Sierra snowpack.",
"title": "March Miracle? El Niño Kicks Back in With Soaking Storms on the Way | KQED",
"ogDescription": "",
"schema": {
"@context": "https://schema.org",
"@type": "Article",
"headline": "March Miracle? El Niño Kicks Back in With Soaking Storms on the Way",
"datePublished": "2016-03-03T19:50:02-08:00",
"dateModified": "2024-01-10T15:48:51-08:00",
"image": "https://cdn.kqed.org/wp-content/uploads/2020/02/KQED-OG-Image@1x.png"
}
},
"guestAuthors": [],
"slug": "march-miracle-el-nino-kicks-back-in-with-soaking-storms-on-the-way",
"status": "publish",
"nprByline": "\u003cstrong>\u003ca href=\"https://earth.stanford.edu/daniel-swain\">Daniel Swain\u003c/a>, Stanford University\u003c/strong>",
"sticky": false,
"path": "/science/560497/march-miracle-el-nino-kicks-back-in-with-soaking-storms-on-the-way",
"audioTrackLength": null,
"parsedContent": [
{
"type": "contentString",
"content": "\u003cdiv class=\"post-body\">\u003cp>\u003cp>February was an extremely warm month (once again) across California, with temperature records falling on a daily basis. February was also quite dry across the state, with the only precipitation event of any note occurring around the middle of the month.\u003c/p>\n\u003cp>The Sierra Nevada snowpack — which had been hovering slightly above average through the end of January — started to fall behind by mid-month, and the \u003ca href=\"http://ww2.kqed.org/science/2016/03/01/sierra-snow-survey-offers-no-boost-for-drought-busting/\">March 1 snow survey\u003c/a> showed statewide snowpack slightly above 80 percent of average for the date. This number is decidedly better than \u003ca href=\"http://www.livescience.com/52265-california-snowpack-shrinking.html\">during recent winters\u003c/a>, but that’s really only a testament to the abysmal snowpack accumulations during the reign of the \u003ca href=\"http://ww2.kqed.org/science/2015/01/23/ridiculous-ridge-may-be-back-to-prolong-california-drought/\">Ridiculously Resilient Ridge\u003c/a> (of high pressure along the coast).\u003c/p>\n\u003cp>\u003cstrong>Change in the Wind\u003c/strong>\u003c/p>\n\u003cp>An abrupt change in the prevailing weather pattern is now at California’s doorstep, however. The persistent ridging of the past month or so is rapidly being displaced by a series of powerful storm systems, driven by a remarkable enhancement and consolidation of the Pacific jet stream.\u003c/p>\n\u003cfigure id=\"attachment_560640\" class=\"wp-caption aligncenter\" style=\"max-width: 1024px\">\u003cimg loading=\"lazy\" decoding=\"async\" class=\"size-full wp-image-560640\" src=\"http://ww2.kqed.org/science/wp-content/uploads/sites/35/2016/03/f3.png\" alt=\"The jet stream will be in a favorable position for active weather across California this weekend.\" width=\"1024\" height=\"715\" srcset=\"https://cdn.kqed.org/wp-content/uploads/sites/35/2016/03/f3.png 1024w, https://cdn.kqed.org/wp-content/uploads/sites/35/2016/03/f3-400x279.png 400w, https://cdn.kqed.org/wp-content/uploads/sites/35/2016/03/f3-800x559.png 800w, https://cdn.kqed.org/wp-content/uploads/sites/35/2016/03/f3-768x536.png 768w, https://cdn.kqed.org/wp-content/uploads/sites/35/2016/03/f3-960x670.png 960w\" sizes=\"(max-width: 1024px) 100vw, 1024px\">\u003cfigcaption class=\"wp-caption-text\">The jet stream will be in a favorable position for active weather across California this weekend. \u003ccite>(NCEP via tropicaltidbits.com)\u003c/cite>\u003c/figcaption>\u003c/figure>\n\u003cp>Rain has already begun across the northernmost portion of California, and will continue more or less continuously through Monday. Precipitation will gradually spread farther south on Friday and intensify on Saturday as a very strong cold front approaches the California coast. A robust \u003ca href=\"http://ww2.kqed.org/science/2015/11/23/flying-into-the-heart-of-the-wests-biggest-storms/\">atmospheric river\u003c/a> (arguably of the \u003ca href=\"https://en.wikipedia.org/wiki/Pineapple_Express\">Pineapple Express\u003c/a> variety, given its subtropical origins near Hawaii) will be in place in advance of the front itself, providing plenty of moisture for the impressive larger-scale dynamics to act upon. The nose of a strong jet streak will move inland over Central California before sagging southward over time, adding lift as this storm system sweeps across the state from northwest to southeast.\u003c/p>\n\u003cp>\u003c/p>\u003c/div>",
"attributes": {
"named": {},
"numeric": []
}
},
{
"type": "component",
"content": "",
"name": "ad",
"attributes": {
"named": {
"label": "fullwidth"
},
"numeric": [
"fullwidth"
]
}
},
{
"type": "contentString",
"content": "\u003cdiv class=\"post-body\">\u003cp>\u003c/p>\n\u003cp>\u003cstrong>Thar She Blows\u003c/strong>\u003c/p>\n\u003cp>The very moist atmosphere combined with a fairly impressive frontal structure will likely lead to a period of very heavy rainfall across much of California. This setup would likely be cause for significant concern if conditions had been very wet, or if the front was expected to hang up over a given location. Right now, the whole system appears to be fast-moving enough to prevent severe flood concerns — especially given our dry February. But given the high intensity of the expected precipitation, it will be worth watching closely to see if a frontal wave develops on Saturday and stalls the front more than expected. Should that occur, flood concerns would increase considerably.\u003c/p>\n\u003cfigure id=\"attachment_560645\" class=\"wp-caption aligncenter\" style=\"max-width: 909px\">\u003cimg loading=\"lazy\" decoding=\"async\" class=\"size-full wp-image-560645\" src=\"http://ww2.kqed.org/science/wp-content/uploads/sites/35/2016/03/f4.png\" alt=\"Water vapor fluxes associated with this weekend’s atmospheric river will be impressive.\" width=\"909\" height=\"984\" srcset=\"https://cdn.kqed.org/wp-content/uploads/sites/35/2016/03/f4.png 909w, https://cdn.kqed.org/wp-content/uploads/sites/35/2016/03/f4-400x433.png 400w, https://cdn.kqed.org/wp-content/uploads/sites/35/2016/03/f4-800x866.png 800w, https://cdn.kqed.org/wp-content/uploads/sites/35/2016/03/f4-768x831.png 768w\" sizes=\"(max-width: 909px) 100vw, 909px\">\u003cfigcaption class=\"wp-caption-text\">Water vapor fluxes associated with this weekend’s atmospheric river will be impressive. \u003ccite>(NCEP via Scripps)\u003c/cite>\u003c/figcaption>\u003c/figure>\n\u003cp>In addition to impressive upper-level dynamics for this part of the world, a substantial reservoir of cold air behind the cold front will provide quite a bit of instability during and after frontal passage — leading to a decent chance of at least isolated thunderstorms across much of the state beginning later on Saturday. Strong and gusty winds — potentially 40 to 50 mph in some places — will also occur as surface pressure gradients strengthen.\u003c/p>\n\u003cp>A secondary system will develop rapidly late Saturday and early Sunday over the Pacific just west of California as the jet stream remains situated in an unusually favorable low-latitude position. While this surface low won’t have much time to develop before hitting the coast, it could still pack a substantial punch, particularly in Southern California. In fact, this second system could bring at least a brief burst of widespread heavy precipitation and perhaps thunderstorms to much of Southern California (focused from the Bay Area southward). There are some early indications that stronger surface-based instability could develop later Sunday or Monday across portions of Southern California, which could lead to the development of some severe thunderstorm activity near the coast.\u003c/p>\n\u003cfigure id=\"attachment_560646\" class=\"wp-caption aligncenter\" style=\"max-width: 1024px\">\u003cimg loading=\"lazy\" decoding=\"async\" class=\"size-full wp-image-560646\" src=\"http://ww2.kqed.org/science/wp-content/uploads/sites/35/2016/03/f5.png\" alt=\"The GFS is suggesting widespread heavy precipitation though Monday evening.\" width=\"1024\" height=\"715\" srcset=\"https://cdn.kqed.org/wp-content/uploads/sites/35/2016/03/f5.png 1024w, https://cdn.kqed.org/wp-content/uploads/sites/35/2016/03/f5-400x279.png 400w, https://cdn.kqed.org/wp-content/uploads/sites/35/2016/03/f5-800x559.png 800w, https://cdn.kqed.org/wp-content/uploads/sites/35/2016/03/f5-768x536.png 768w, https://cdn.kqed.org/wp-content/uploads/sites/35/2016/03/f5-960x670.png 960w\" sizes=\"(max-width: 1024px) 100vw, 1024px\">\u003cfigcaption class=\"wp-caption-text\">This forecast model suggests widespread heavy precipitation though Monday evening. \u003ccite>(NCEP via tropicaltidbits.com)\u003c/cite>\u003c/figcaption>\u003c/figure>\n\u003cp>Rainfall totals through Monday across Northern California will be in the 2-4 inch range in most places (including San Francisco and Sacramento), possibly more than double that (5-8+ inches) in the coastal hills and the northern Sierra Nevada foothills. Most of Southern California will probably see rainfall more on the order of 1-2 inches, with double that in the coastal mountains. Notably, however, this precipitation will fall rather quickly, and may cause more problems that would typically be the case with precipitation of this magnitude. In the Sierra Nevada, snow levels will start out quite high as the warm atmospheric river moves ashore but will plummet later in the weekend as much colder air arrives. Several (2-4) feet of new snowfall is likely above 7000 feet, and lesser accumulations down to 4000 feet or so are likely by Monday as the secondary system moves inland.\u003c/p>\n\u003cp>\u003cstrong>Models Waffle\u003cbr>\n\u003c/strong>\u003c/p>\n\u003cp>California weather (model) watchers got quite the show a couple of days ago when simulations started pointing toward an extreme precipitation event to develop next week, following this weekend’s still very heavy rainfall. The setup was one strongly reminiscent of that which makes California water wonks nervous: the occurrence of a very persistent and strong atmospheric river event focused upon a narrow stretch of the West Coast. Several model cycles were hinting at the potential for \u003ca href=\"https://twitter.com/Weather_West/status/704897495432884224\">truly incredible amounts of rain\u003c/a> and high-elevation snow between March 4 and March 12.\u003c/p>\n\u003cp>Fortunately, however, it now seems that those really extreme numbers are unlikely to come to pass. While a very impressive atmospheric river is still expected to develop across the eastern Pacific next week and eventually make it to California, it is not presently expected to be nearly as persistent as had been simulated a few days ago. Present models still suggest a storm that would be quite impressive by the low standards set during recent drought winters.\u003c/p>\n\u003cp>\u003cstrong>‘March Miracle:’ a Relative Term\u003cbr>\n\u003c/strong>\u003c/p>\n\u003cp>In the longer run, it seems likely that a fairly active weather pattern will continue across California for much of March. It’s hard to say at this point whether precipitation this month might approach the remarkable late-season levels of the “Miracle March” in 1991, but it does at least appear likely that California’s snowpack will recover, possibly back to above-average levels in the coming weeks. It’s less clear whether Southern California will be able to make up the seasonal precipitation deficit that has accumulated this year despite the near record-strength El Niño event in the tropical Pacific. Still, it appears increasingly likely that March will at least be able to make a dent — even though it’s quite clear that California’s multi-year drought will persist through the summer.\u003c/p>\n\u003cp>\u003c/p>\u003c/div>",
"attributes": {
"named": {},
"numeric": []
}
},
{
"type": "component",
"content": "",
"name": "ad",
"attributes": {
"named": {
"label": "floatright"
},
"numeric": [
"floatright"
]
}
},
{
"type": "contentString",
"content": "\u003cdiv class=\"post-body\">\u003cp>\u003c/p>\n\u003cp>\u003cem>Daniel Swain is an atmospheric scientist at Stanford’s School of Earth, Energy & Environmental Sciences. A version of this post also appears on his \u003ca href=\"http://www.weatherwest.com/\">California Weather blog\u003c/a>.\u003c/em>\u003c/p>\n\n\u003c/div>\u003c/p>",
"attributes": {
"named": {},
"numeric": []
}
}
],
"link": "/science/560497/march-miracle-el-nino-kicks-back-in-with-soaking-storms-on-the-way",
"authors": [
"byline_science_560497"
],
"series": [
"science_1151"
],
"categories": [
"science_31",
"science_40",
"science_98"
],
"tags": [
"science_1622",
"science_371"
],
"featImg": "science_561629",
"label": "science_1151"
},
"science_536769": {
"type": "posts",
"id": "science_536769",
"meta": {
"index": "posts_1716263798",
"site": "science",
"id": "536769",
"score": null,
"sort": [
1455848030000
]
},
"parent": 0,
"labelTerm": {
"site": "science",
"term": 1151
},
"blocks": [],
"publishDate": 1455848030,
"format": "standard",
"title": "El Niño Weakening, Stage Set for La Niña and Possible Dry Winter Next Year",
"headTitle": "El Niño Weakening, Stage Set for La Niña and Possible Dry Winter Next Year | KQED",
"content": "\u003cp>Federal climate scientists say the near-record El Niño conditions in the Pacific Ocean have peaked and are slowly waning.\u003c/p>\n\u003cp>Forecasters now say conditions are likely to flip to their opposite phase, known as \u003ca href=\"http://oceanservice.noaa.gov/facts/ninonina.html\">La Niña\u003c/a> by late summer or early fall, which could set the stage for another drier-than-normal winter and prolonged drought in California.\u003c/p>\n\u003cp>“We are reasonably confident that there will be a La Niña,” says Huug van den Dool, seasonal forecaster at NOAA’s Climate Prediction Center, “but we plead ignorance as to whether this is going to be a small, moderate, or strong La Niña.”\u003c/p>\n\u003cp>Just as the stronger El Niños tend to favor wetter winters in California, the mirror-image La Niña is sometimes a harbinger of drought. Strength is measured by how much ocean waters deviate from their normal temperatures. Warmer waters provide more moisture to brewing Pacific storms, while colder waters tend to dry things out.\u003c/p>\n\u003cp>The shift is \u003ca href=\"http://www.weatherwest.com/archives/3877#disqus_thread\">not likely to have major implications\u003c/a> for what remains of this winter. California’s weather tends to lag the ocean conditions that influence it by as much as a couple of months, so the possibility still lingers for a soggy spring.\u003c/p>\n\u003cfigure id=\"attachment_537110\" class=\"wp-caption aligncenter\" style=\"max-width: 712px\">\u003cimg loading=\"lazy\" decoding=\"async\" class=\"size-full wp-image-537110\" src=\"http://ww2.kqed.org/science/wp-content/uploads/sites/35/2016/02/NOAA3-mo_Feb.gif\" alt=\"NOAA's three-month outlook (which is notoriously iffy) pegs the odds for above-average precipitation at 73% for Southern California and 66% for the state's midsection (map numbers converted to actual percentages).\" width=\"712\" height=\"388\">\u003cfigcaption class=\"wp-caption-text\">NOAA’s three-month outlook (which is notoriously iffy) pegs the odds for above-average precipitation at 73% for Southern California and 66% for the state’s midsection (map numbers converted to actual percentages). \u003ccite>(NOAA)\u003c/cite>\u003c/figcaption>\u003c/figure>\n\u003cp>The abnormally warm water along the equator that defines El Niño probably peaked in December, van den Dool told reporters in a Thursday conference call, but still has some \u003ca href=\"http://www.weatherwest.com/archives/3877#disqus_thread\">steam left in the boiler,\u003c/a> seen in the rapid upward movement of warm, moist air over the ocean.\u003c/p>\n\u003cp>[ad fullwidth]\u003c/p>\n\u003cp>Van den Dool points to sea surface temperatures that remain above normal, promoting “very strong convection” over the eastern and central Pacific. Convection is a key driver of storm activity.\u003c/p>\n\u003cp>Van den Dool says it’s too early to say with certainty whether the current El Niño (now about six months old) is the strongest on record.\u003c/p>\n\u003cp>“This is something that’s going to be debated, of course, for some time,” he predicts.\u003c/p>\n\u003cp>Using only the sea surface temperatures in one closely-watched zone of the Pacific, he says this one is “at least on par with 1997-98.”\u003c/p>\n\u003cp>Curiously, though this event \u003ca href=\"http://ww2.kqed.org/science/2016/02/01/why-this-el-nino-is-one-for-the-books/\">has not packed nearly the precipitation\u003c/a> punch as the “Godzilla” El Niño of 97-’98, when San Francisco doubled it’s normal rainfall. The \u003ca href=\"http://mashable.com/2016/02/17/el-nino-was-supposed-to-bail-out-parched-california-so-where-are-the-storms/#XDlDYmz7daqO\">complex reasons for that\u003c/a> will be part of the ongoing scientific debate, but so far this winter, many California locations are still at or below their long-term averages for rainfall. San Francisco, Sacramento and San Jose remain below normal, as does Santa Rosa, a perennial Bay Area wet spot. Fresno, by contrast, has seen 40 percent more than its usual rainfall at this point in the season.\u003c/p>\n\u003cp>The \u003ca href=\"http://ww2.kqed.org/science/2016/02/08/californias-water-supply-at-risk-from-warmer-winters/\">Sierra snowpack\u003c/a>, which typically provides about a third of the state’s water supply, was piling up pleasingly in January, but has now \u003ca href=\"http://cdec.water.ca.gov/cdecapp/snowapp/sweq.action\">slipped slightly\u003c/a> below seasonal norms.\u003c/p>\n\u003cp>\u003c/p>\n\u003cp> \u003c/p>\n\n",
"stats": {
"hasVideo": false,
"hasChartOrMap": false,
"hasAudio": false,
"hasPolis": false,
"wordCount": 549,
"hasGoogleForm": false,
"hasGallery": false,
"hasHearkenModule": false,
"iframeSrcs": [],
"paragraphCount": 14
},
"modified": 1704930611,
"excerpt": "Federal climate forecasters say there's an 80 percent chance that El Niño will flip to its opposite La Niña state by summer's end.",
"headData": {
"twImgId": "",
"twTitle": "",
"ogTitle": "",
"ogImgId": "",
"twDescription": "",
"description": "Federal climate forecasters say there's an 80 percent chance that El Niño will flip to its opposite La Niña state by summer's end.",
"title": "El Niño Weakening, Stage Set for La Niña and Possible Dry Winter Next Year | KQED",
"ogDescription": "",
"schema": {
"@context": "https://schema.org",
"@type": "Article",
"headline": "El Niño Weakening, Stage Set for La Niña and Possible Dry Winter Next Year",
"datePublished": "2016-02-18T18:13:50-08:00",
"dateModified": "2024-01-10T15:50:11-08:00",
"image": "https://cdn.kqed.org/wp-content/uploads/2020/02/KQED-OG-Image@1x.png"
}
},
"guestAuthors": [],
"slug": "el-nino-weakening-stage-set-for-la-nina-and-possible-dry-winter-next-year",
"status": "publish",
"sticky": false,
"path": "/science/536769/el-nino-weakening-stage-set-for-la-nina-and-possible-dry-winter-next-year",
"audioTrackLength": null,
"parsedContent": [
{
"type": "contentString",
"content": "\u003cdiv class=\"post-body\">\u003cp>\u003cp>Federal climate scientists say the near-record El Niño conditions in the Pacific Ocean have peaked and are slowly waning.\u003c/p>\n\u003cp>Forecasters now say conditions are likely to flip to their opposite phase, known as \u003ca href=\"http://oceanservice.noaa.gov/facts/ninonina.html\">La Niña\u003c/a> by late summer or early fall, which could set the stage for another drier-than-normal winter and prolonged drought in California.\u003c/p>\n\u003cp>“We are reasonably confident that there will be a La Niña,” says Huug van den Dool, seasonal forecaster at NOAA’s Climate Prediction Center, “but we plead ignorance as to whether this is going to be a small, moderate, or strong La Niña.”\u003c/p>\n\u003cp>Just as the stronger El Niños tend to favor wetter winters in California, the mirror-image La Niña is sometimes a harbinger of drought. Strength is measured by how much ocean waters deviate from their normal temperatures. Warmer waters provide more moisture to brewing Pacific storms, while colder waters tend to dry things out.\u003c/p>\n\u003cp>The shift is \u003ca href=\"http://www.weatherwest.com/archives/3877#disqus_thread\">not likely to have major implications\u003c/a> for what remains of this winter. California’s weather tends to lag the ocean conditions that influence it by as much as a couple of months, so the possibility still lingers for a soggy spring.\u003c/p>\n\u003cfigure id=\"attachment_537110\" class=\"wp-caption aligncenter\" style=\"max-width: 712px\">\u003cimg loading=\"lazy\" decoding=\"async\" class=\"size-full wp-image-537110\" src=\"http://ww2.kqed.org/science/wp-content/uploads/sites/35/2016/02/NOAA3-mo_Feb.gif\" alt=\"NOAA's three-month outlook (which is notoriously iffy) pegs the odds for above-average precipitation at 73% for Southern California and 66% for the state's midsection (map numbers converted to actual percentages).\" width=\"712\" height=\"388\">\u003cfigcaption class=\"wp-caption-text\">NOAA’s three-month outlook (which is notoriously iffy) pegs the odds for above-average precipitation at 73% for Southern California and 66% for the state’s midsection (map numbers converted to actual percentages). \u003ccite>(NOAA)\u003c/cite>\u003c/figcaption>\u003c/figure>\n\u003cp>The abnormally warm water along the equator that defines El Niño probably peaked in December, van den Dool told reporters in a Thursday conference call, but still has some \u003ca href=\"http://www.weatherwest.com/archives/3877#disqus_thread\">steam left in the boiler,\u003c/a> seen in the rapid upward movement of warm, moist air over the ocean.\u003c/p>\n\u003cp>\u003c/p>\u003c/div>",
"attributes": {
"named": {},
"numeric": []
}
},
{
"type": "component",
"content": "",
"name": "ad",
"attributes": {
"named": {
"label": "fullwidth"
},
"numeric": [
"fullwidth"
]
}
},
{
"type": "contentString",
"content": "\u003cdiv class=\"post-body\">\u003cp>\u003c/p>\n\u003cp>Van den Dool points to sea surface temperatures that remain above normal, promoting “very strong convection” over the eastern and central Pacific. Convection is a key driver of storm activity.\u003c/p>\n\u003cp>Van den Dool says it’s too early to say with certainty whether the current El Niño (now about six months old) is the strongest on record.\u003c/p>\n\u003cp>“This is something that’s going to be debated, of course, for some time,” he predicts.\u003c/p>\n\u003cp>Using only the sea surface temperatures in one closely-watched zone of the Pacific, he says this one is “at least on par with 1997-98.”\u003c/p>\n\u003cp>Curiously, though this event \u003ca href=\"http://ww2.kqed.org/science/2016/02/01/why-this-el-nino-is-one-for-the-books/\">has not packed nearly the precipitation\u003c/a> punch as the “Godzilla” El Niño of 97-’98, when San Francisco doubled it’s normal rainfall. The \u003ca href=\"http://mashable.com/2016/02/17/el-nino-was-supposed-to-bail-out-parched-california-so-where-are-the-storms/#XDlDYmz7daqO\">complex reasons for that\u003c/a> will be part of the ongoing scientific debate, but so far this winter, many California locations are still at or below their long-term averages for rainfall. San Francisco, Sacramento and San Jose remain below normal, as does Santa Rosa, a perennial Bay Area wet spot. Fresno, by contrast, has seen 40 percent more than its usual rainfall at this point in the season.\u003c/p>\n\u003cp>The \u003ca href=\"http://ww2.kqed.org/science/2016/02/08/californias-water-supply-at-risk-from-warmer-winters/\">Sierra snowpack\u003c/a>, which typically provides about a third of the state’s water supply, was piling up pleasingly in January, but has now \u003ca href=\"http://cdec.water.ca.gov/cdecapp/snowapp/sweq.action\">slipped slightly\u003c/a> below seasonal norms.\u003c/p>\n\u003cp>\u003c/p>\n\u003cp> \u003c/p>\n\n\u003c/div>\u003c/p>",
"attributes": {
"named": {},
"numeric": []
}
}
],
"link": "/science/536769/el-nino-weakening-stage-set-for-la-nina-and-possible-dry-winter-next-year",
"authors": [
"221"
],
"series": [
"science_1151"
],
"categories": [
"science_31",
"science_40",
"science_2873",
"science_98"
],
"tags": [
"science_371",
"science_1462"
],
"featImg": "science_537106",
"label": "science_1151"
},
"science_502283": {
"type": "posts",
"id": "science_502283",
"meta": {
"index": "posts_1716263798",
"site": "science",
"id": "502283",
"score": null,
"sort": [
1454347836000
]
},
"parent": 0,
"labelTerm": {
"site": "science",
"term": 1151
},
"blocks": [],
"publishDate": 1454347836,
"format": "standard",
"title": "El Niño: It's One For the Books -- But Not Behaving As Expected",
"headTitle": "El Niño: It’s One For the Books — But Not Behaving As Expected | KQED",
"content": "\u003cp>The prospect of an El Niño event in the Pacific Ocean always generates a stew of excitement, dread, and speculation in California. This largely stems from the fact that two of California’s wettest winters on record — 1982-1983 and 1997-1998 — occurred during the strongest El Niño years in living memory. The popular perception that El Niño always brings a lot of water to the Golden State, though, is not particularly accurate.\u003c/p>\n\u003cp>The key message here: \u003ca href=\"http://ww2.kqed.org/science/2014/09/01/drought-myth-busting-why-el-nino-wont-save-california/\">strong El Niño events are the ones to watch\u003c/a> out for from a California weather perspective, and it’s reasonable to expect that such events greatly increase the odds of wet conditions throughout the state.\u003c/p>\n\u003cfigure id=\"attachment_502362\" class=\"wp-caption alignright\" style=\"max-width: 565px\">\u003cimg loading=\"lazy\" decoding=\"async\" class=\"size-full wp-image-502362\" src=\"http://ww2.kqed.org/science/wp-content/uploads/sites/35/2016/01/fig1.gif\" alt=\"Subtropical ridging between Hawaii and California has been more prominent so far during 2015-2016 than during the 82/83 or 97/98 events.\" width=\"565\" height=\"437\">\u003cfigcaption class=\"wp-caption-text\">Subtropical “ridging” between Hawaii and California has been more prominent so far during 2015-2016 than during the 82/83 or 97/98 events. \u003ccite>(NCEP via ESRL)\u003c/cite>\u003c/figcaption>\u003c/figure>\n\u003cp>\u003cstrong>How is this El Niño different from other ‘Big Ones?’\u003cbr>\n\u003c/strong>\u003c/p>\n\u003cp>Depending on how you measure it, the present El Niño is either the strongest or among the strongest events in the observed record going back to at least 1950. Ocean temperatures in the eastern equatorial Pacific Ocean — the most traditional measure of El Niño’s amplitude — have been at or above record-high values for at least several months now. So despite assertions to the contrary, the 2015-2016 El Niño is not “a bust” by any means.\u003c/p>\n\u003cp>But absolute sea surface temperatures don’t always tell the whole story. While the present El Niño is indeed among the strongest ever recorded, the atmospheric response to the warm ocean temperatures this year has been a bit different than we have observed during other big historical events. Over the northeastern Pacific, El Niño acts to deepen the \u003ca href=\"http://earthobservatory.nasa.gov/NaturalHazards/view.php?id=13718\">semi-permanent Gulf of Alaska low-pressure\u003c/a> zone while simultaneously strengthening (and, literally, straightening) the \u003ca href=\"http://www.livescience.com/27825-jet-stream.html\">jet stream\u003c/a> over the eastern Pacific Ocean. This enhanced and “more zonal” (i.e. more west-to-east) jet stream is what tends to bring increased winter precipitation to California (and, sometimes, as we’re seeing now, even the Pacific Northwest) during strong El Niño years.\u003c/p>\n\u003cfigure id=\"attachment_502363\" class=\"wp-caption alignright\" style=\"max-width: 565px\">\u003cimg loading=\"lazy\" decoding=\"async\" class=\"size-full wp-image-502363\" src=\"http://ww2.kqed.org/science/wp-content/uploads/sites/35/2016/01/fig2.gif\" alt=\"Tropical convection associated with the 2015-2016 El Niño has been centered further north than in previous big events, with subsidence (downward motion) occurring closer to California on its northern flank.\" width=\"565\" height=\"437\">\u003cfigcaption class=\"wp-caption-text\">Tropical convection associated with the 2015-2016 El Niño has been centered farther north than in previous big events, with subsidence (downward motion) occurring closer to California on its northern flank. \u003ccite>(NCEP via ESRL)\u003c/cite>\u003c/figcaption>\u003c/figure>\n\u003cp>Tropical convection associated with the 2015-2016 El Niño has been centered further north than in previous big events, with subsidence (downward motion; yellow/red colors) occurring closer to California on its northern flank\u003c/p>\n\u003cp>[ad fullwidth]\u003c/p>\n\u003cp>These atmospheric effects are the product of a fairly complex chain of events that link the tropical to the mid-latitude atmosphere. Warmer-than-usual ocean temperatures in the eastern tropical Pacific increase thunderstorm activity there, which pumps vast quantities of heat into the upper atmosphere. This tropically warm air at upper levels eventually flows northward and drops back toward the surface of the Earth in the subtropics (at a latitude roughly equivalent to that of Hawaii). This enhanced “\u003ca href=\"https://www.seas.harvard.edu/climate/eli/research/equable/hadley.html\">Hadley circulation\u003c/a>” during El Niño years increases the temperature differential between the warm tropics and cool Gulf of Alaska, which is what causes the jet stream to strengthen.\u003c/p>\n\u003cp>\u003cstrong>Skipping the Southland\u003c/strong>\u003c/p>\n\u003cp>In late 2015 and early 2016, the atmosphere has responded to the ongoing powerful El Niño much in the way that meteorologists have come to expect. The Pacific warmed; tropical thunderstorms increased; the Hadley cell strengthened; the Pacific jet began to roar. But this year, the Hadley cell has actually strengthened a bit more than expected. The descending air on its northern side has occurred closer to California, which means that enhanced temperature differential is occurring farther to the north than during previous big El Niño events. Subtropical ridging between Hawaii and California has been more pronounced, and the El Niño-strengthened jet stream has set up shop primarily across Northern California and \u003ca href=\"http://www.nbcnews.com/news/us-news/flooding-landslides-after-record-rainfall-pounds-pacific-northwest-n475966\">even the Pacific Northwest\u003c/a>, rather than Southern California. From a global climate perspective, this is a relatively minor detail; if you happen to live in Los Angeles, though, it makes all the difference in the world.\u003c/p>\n\u003cp>The net effect so far in 2015-2016: Northern California and the Pacific Northwest have gotten soaked, while Southern California has been left pretty dry (with a few notable exceptions). While a veritable “parade of storms” has indeed inundated the northern reaches of the state with very heavy precipitation, bringing the best \u003ca href=\"http://ww2.kqed.org/news/2015/12/30/sierra-snowpack-survey-drought\">Sierra Nevada snowpack\u003c/a> in years, leading to huge \u003ca href=\"http://ww2.kqed.org/lowdown/2015/09/21/now-that-summers-over-what-do-californias-reservoirs-look-like-a-real-time-visualization/\">inflows to large reservoirs\u003c/a> in critical watersheds, and even leading to some minor flooding at times, many of California’s most populous cities haven’t witnessed an especially remarkable winter to date. The San Francisco Bay Area and Sacramento region have seen “Water Year” precipitation to date that is pretty close to the long-term average (which seems like a lot relative to the extremely dry years witnessed as of late). The densely populated greater Los Angeles region, on the other hand, is well below average for the season to date (though with significant precipitation this past weekend, its January total may well end up near or above average). From a long-term drought relief perspective, the \u003ca href=\"http://www.cnrfc.noaa.gov/awipsProducts/RNOWRKCLI.php\">season to date\u003c/a> looks pretty good—precipitation is near or above average in most of California’s largest watersheds, and the water stored in the \u003ca href=\"http://cdec.water.ca.gov/cdecapp/snowapp/sweq.action\">critical Sierra Nevada snowpack\u003c/a> is uniformly above average. So far, though, this isn’t quite the blockbuster year that many had hoped for (especially in the south).\u003c/p>\n\u003cfigure id=\"attachment_502364\" class=\"wp-caption alignleft\" style=\"max-width: 531px\">\u003cimg loading=\"lazy\" decoding=\"async\" class=\"size-full wp-image-502364\" src=\"http://ww2.kqed.org/science/wp-content/uploads/sites/35/2016/01/fig3.gif\" alt=\"While nearly all of California is expected to be above average in terms of season-to-date precipitation after this weekend’s Southern California storm, only the northern 2/3 of the state is above average for the full season to date.\" width=\"531\" height=\"688\">\u003cfigcaption class=\"wp-caption-text\">While nearly all of California is expected to be above average in terms of season-to-date precipitation after this weekend’s Southern California storm, only the northern 2/3 of the state is above average for the full season to date.? \u003ccite>(NOAA via WRCC)\u003c/cite>\u003c/figcaption>\u003c/figure>\n\u003cp>\u003cstrong>So, What Now?\u003c/strong>\u003c/p>\n\u003cp>El Niño is certainly still with us, and it’s still a top-tier event. For that reason, the smart money’s still on a wetter-than-average season for California on balance. This is especially true since the precipitation during strong El Niño years is often heavily “back-weighted,” with an unusually large fraction of seasonal totals occurring during the second half of the rainy season from February to April. What is less clear, at this point, is whether the northerly-shifted atmospheric response to this El Niño will persist — and whether Southern California will start to make up for lost time. It’s certainly possible, and it’s easy to forget that a surprisingly large fraction of precipitation in the Southland occurs during a \u003ca href=\"http://ww2.kqed.org/science/2015/11/23/flying-into-the-heart-of-the-wests-biggest-storms/\">handful of intense storms\u003c/a> each year (even in strong El Niño years). From a statewide perspective, some substantial drought relief has already occurred this year, but there remain large regions in the southern part of the state that are still extremely dry. The refrain from earlier in the autumn is now more relevant than ever: while El Niño is likely to bring some degree of drought relief, California will likely still be facing long-term drought conditions by the coming summer.\u003c/p>\n\u003cp>\u003cstrong>The Big Picture\u003c/strong>\u003c/p>\n\u003cp>Finally, there has been considerable discussion lately regarding why the atmospheric response to El Niño this year has been different than historically observed (and also than foreseen by some of the flagship seasonal forecast models). It’s impossible to ignore the fact that global temperatures in late 2015 and early 2016 have reached their \u003ca href=\"http://ww2.kqed.org/science/2016/01/20/2015-was-the-warmest-year-on-record-globally-but-not-in-california/\">highest levels in recorded human history\u003c/a>. Part of this very recent warming is likely a product of our record El Niño event, but the rest is pretty clearly attributable to the long-term warming trend associated the with human emission of greenhouse gases. While global mean temperature doesn’t directly affect El Niño teleconnections, per se, the Earth hasn’t been warming in a spatially uniform way. This year in particular, the subtropics and the polar regions have been especially warm relative to other parts of the world. It is possible that this spatial pattern of warming may be playing a role in the particular atmospheric configuration that has resulted from the 2015-2016 El Niño event.\u003c/p>\n\u003cp>Unfortunately, it is virtually impossible to say more than that right now. The pace of climate change attribution science is much slower than that of the atmosphere itself, and it’s hard to make causal inferences from observations alone. Climate models are often the best tool available for climate scientists to test the counterfactual: what would this year have looked like without global warming? Such experiments take a considerable amount of time, so we’ll probably have to wait a while to find out. Stay tuned.\u003c/p>\n\u003cp>[ad floatright]\u003c/p>\n\u003cp>\u003cem>Daniel Swain is an atmospheric scientist at Stanford’s School of Earth, Energy & Environmental Sciences. A version of this post also appears on his \u003ca href=\"http://www.weatherwest.com/\">California Weather\u003c/a> blog.\u003c/em>\u003c/p>\n\n",
"stats": {
"hasVideo": false,
"hasChartOrMap": false,
"hasAudio": false,
"hasPolis": false,
"wordCount": 1543,
"hasGoogleForm": false,
"hasGallery": false,
"hasHearkenModule": false,
"iframeSrcs": [],
"paragraphCount": 18
},
"modified": 1704930697,
"excerpt": "When it comes to El Niño, strength matters, but there's a lot more going on in the ocean and atmosphere.",
"headData": {
"twImgId": "",
"twTitle": "",
"ogTitle": "",
"ogImgId": "",
"twDescription": "",
"description": "When it comes to El Niño, strength matters, but there's a lot more going on in the ocean and atmosphere.",
"title": "El Niño: It's One For the Books -- But Not Behaving As Expected | KQED",
"ogDescription": "",
"schema": {
"@context": "https://schema.org",
"@type": "Article",
"headline": "El Niño: It's One For the Books -- But Not Behaving As Expected",
"datePublished": "2016-02-01T09:30:36-08:00",
"dateModified": "2024-01-10T15:51:37-08:00",
"image": "https://cdn.kqed.org/wp-content/uploads/2020/02/KQED-OG-Image@1x.png"
}
},
"guestAuthors": [],
"slug": "why-this-el-nino-is-one-for-the-books",
"status": "publish",
"nprByline": "\u003cstrong>\u003ca href=\"https://earth.stanford.edu/daniel-swain\">Daniel Swain\u003c/a>, Stanford University\u003c/strong>",
"sticky": false,
"path": "/science/502283/why-this-el-nino-is-one-for-the-books",
"audioTrackLength": null,
"parsedContent": [
{
"type": "contentString",
"content": "\u003cdiv class=\"post-body\">\u003cp>\u003cp>The prospect of an El Niño event in the Pacific Ocean always generates a stew of excitement, dread, and speculation in California. This largely stems from the fact that two of California’s wettest winters on record — 1982-1983 and 1997-1998 — occurred during the strongest El Niño years in living memory. The popular perception that El Niño always brings a lot of water to the Golden State, though, is not particularly accurate.\u003c/p>\n\u003cp>The key message here: \u003ca href=\"http://ww2.kqed.org/science/2014/09/01/drought-myth-busting-why-el-nino-wont-save-california/\">strong El Niño events are the ones to watch\u003c/a> out for from a California weather perspective, and it’s reasonable to expect that such events greatly increase the odds of wet conditions throughout the state.\u003c/p>\n\u003cfigure id=\"attachment_502362\" class=\"wp-caption alignright\" style=\"max-width: 565px\">\u003cimg loading=\"lazy\" decoding=\"async\" class=\"size-full wp-image-502362\" src=\"http://ww2.kqed.org/science/wp-content/uploads/sites/35/2016/01/fig1.gif\" alt=\"Subtropical ridging between Hawaii and California has been more prominent so far during 2015-2016 than during the 82/83 or 97/98 events.\" width=\"565\" height=\"437\">\u003cfigcaption class=\"wp-caption-text\">Subtropical “ridging” between Hawaii and California has been more prominent so far during 2015-2016 than during the 82/83 or 97/98 events. \u003ccite>(NCEP via ESRL)\u003c/cite>\u003c/figcaption>\u003c/figure>\n\u003cp>\u003cstrong>How is this El Niño different from other ‘Big Ones?’\u003cbr>\n\u003c/strong>\u003c/p>\n\u003cp>Depending on how you measure it, the present El Niño is either the strongest or among the strongest events in the observed record going back to at least 1950. Ocean temperatures in the eastern equatorial Pacific Ocean — the most traditional measure of El Niño’s amplitude — have been at or above record-high values for at least several months now. So despite assertions to the contrary, the 2015-2016 El Niño is not “a bust” by any means.\u003c/p>\n\u003cp>But absolute sea surface temperatures don’t always tell the whole story. While the present El Niño is indeed among the strongest ever recorded, the atmospheric response to the warm ocean temperatures this year has been a bit different than we have observed during other big historical events. Over the northeastern Pacific, El Niño acts to deepen the \u003ca href=\"http://earthobservatory.nasa.gov/NaturalHazards/view.php?id=13718\">semi-permanent Gulf of Alaska low-pressure\u003c/a> zone while simultaneously strengthening (and, literally, straightening) the \u003ca href=\"http://www.livescience.com/27825-jet-stream.html\">jet stream\u003c/a> over the eastern Pacific Ocean. This enhanced and “more zonal” (i.e. more west-to-east) jet stream is what tends to bring increased winter precipitation to California (and, sometimes, as we’re seeing now, even the Pacific Northwest) during strong El Niño years.\u003c/p>\n\u003cfigure id=\"attachment_502363\" class=\"wp-caption alignright\" style=\"max-width: 565px\">\u003cimg loading=\"lazy\" decoding=\"async\" class=\"size-full wp-image-502363\" src=\"http://ww2.kqed.org/science/wp-content/uploads/sites/35/2016/01/fig2.gif\" alt=\"Tropical convection associated with the 2015-2016 El Niño has been centered further north than in previous big events, with subsidence (downward motion) occurring closer to California on its northern flank.\" width=\"565\" height=\"437\">\u003cfigcaption class=\"wp-caption-text\">Tropical convection associated with the 2015-2016 El Niño has been centered farther north than in previous big events, with subsidence (downward motion) occurring closer to California on its northern flank. \u003ccite>(NCEP via ESRL)\u003c/cite>\u003c/figcaption>\u003c/figure>\n\u003cp>Tropical convection associated with the 2015-2016 El Niño has been centered further north than in previous big events, with subsidence (downward motion; yellow/red colors) occurring closer to California on its northern flank\u003c/p>\n\u003cp>\u003c/p>\u003c/div>",
"attributes": {
"named": {},
"numeric": []
}
},
{
"type": "component",
"content": "",
"name": "ad",
"attributes": {
"named": {
"label": "fullwidth"
},
"numeric": [
"fullwidth"
]
}
},
{
"type": "contentString",
"content": "\u003cdiv class=\"post-body\">\u003cp>\u003c/p>\n\u003cp>These atmospheric effects are the product of a fairly complex chain of events that link the tropical to the mid-latitude atmosphere. Warmer-than-usual ocean temperatures in the eastern tropical Pacific increase thunderstorm activity there, which pumps vast quantities of heat into the upper atmosphere. This tropically warm air at upper levels eventually flows northward and drops back toward the surface of the Earth in the subtropics (at a latitude roughly equivalent to that of Hawaii). This enhanced “\u003ca href=\"https://www.seas.harvard.edu/climate/eli/research/equable/hadley.html\">Hadley circulation\u003c/a>” during El Niño years increases the temperature differential between the warm tropics and cool Gulf of Alaska, which is what causes the jet stream to strengthen.\u003c/p>\n\u003cp>\u003cstrong>Skipping the Southland\u003c/strong>\u003c/p>\n\u003cp>In late 2015 and early 2016, the atmosphere has responded to the ongoing powerful El Niño much in the way that meteorologists have come to expect. The Pacific warmed; tropical thunderstorms increased; the Hadley cell strengthened; the Pacific jet began to roar. But this year, the Hadley cell has actually strengthened a bit more than expected. The descending air on its northern side has occurred closer to California, which means that enhanced temperature differential is occurring farther to the north than during previous big El Niño events. Subtropical ridging between Hawaii and California has been more pronounced, and the El Niño-strengthened jet stream has set up shop primarily across Northern California and \u003ca href=\"http://www.nbcnews.com/news/us-news/flooding-landslides-after-record-rainfall-pounds-pacific-northwest-n475966\">even the Pacific Northwest\u003c/a>, rather than Southern California. From a global climate perspective, this is a relatively minor detail; if you happen to live in Los Angeles, though, it makes all the difference in the world.\u003c/p>\n\u003cp>The net effect so far in 2015-2016: Northern California and the Pacific Northwest have gotten soaked, while Southern California has been left pretty dry (with a few notable exceptions). While a veritable “parade of storms” has indeed inundated the northern reaches of the state with very heavy precipitation, bringing the best \u003ca href=\"http://ww2.kqed.org/news/2015/12/30/sierra-snowpack-survey-drought\">Sierra Nevada snowpack\u003c/a> in years, leading to huge \u003ca href=\"http://ww2.kqed.org/lowdown/2015/09/21/now-that-summers-over-what-do-californias-reservoirs-look-like-a-real-time-visualization/\">inflows to large reservoirs\u003c/a> in critical watersheds, and even leading to some minor flooding at times, many of California’s most populous cities haven’t witnessed an especially remarkable winter to date. The San Francisco Bay Area and Sacramento region have seen “Water Year” precipitation to date that is pretty close to the long-term average (which seems like a lot relative to the extremely dry years witnessed as of late). The densely populated greater Los Angeles region, on the other hand, is well below average for the season to date (though with significant precipitation this past weekend, its January total may well end up near or above average). From a long-term drought relief perspective, the \u003ca href=\"http://www.cnrfc.noaa.gov/awipsProducts/RNOWRKCLI.php\">season to date\u003c/a> looks pretty good—precipitation is near or above average in most of California’s largest watersheds, and the water stored in the \u003ca href=\"http://cdec.water.ca.gov/cdecapp/snowapp/sweq.action\">critical Sierra Nevada snowpack\u003c/a> is uniformly above average. So far, though, this isn’t quite the blockbuster year that many had hoped for (especially in the south).\u003c/p>\n\u003cfigure id=\"attachment_502364\" class=\"wp-caption alignleft\" style=\"max-width: 531px\">\u003cimg loading=\"lazy\" decoding=\"async\" class=\"size-full wp-image-502364\" src=\"http://ww2.kqed.org/science/wp-content/uploads/sites/35/2016/01/fig3.gif\" alt=\"While nearly all of California is expected to be above average in terms of season-to-date precipitation after this weekend’s Southern California storm, only the northern 2/3 of the state is above average for the full season to date.\" width=\"531\" height=\"688\">\u003cfigcaption class=\"wp-caption-text\">While nearly all of California is expected to be above average in terms of season-to-date precipitation after this weekend’s Southern California storm, only the northern 2/3 of the state is above average for the full season to date.? \u003ccite>(NOAA via WRCC)\u003c/cite>\u003c/figcaption>\u003c/figure>\n\u003cp>\u003cstrong>So, What Now?\u003c/strong>\u003c/p>\n\u003cp>El Niño is certainly still with us, and it’s still a top-tier event. For that reason, the smart money’s still on a wetter-than-average season for California on balance. This is especially true since the precipitation during strong El Niño years is often heavily “back-weighted,” with an unusually large fraction of seasonal totals occurring during the second half of the rainy season from February to April. What is less clear, at this point, is whether the northerly-shifted atmospheric response to this El Niño will persist — and whether Southern California will start to make up for lost time. It’s certainly possible, and it’s easy to forget that a surprisingly large fraction of precipitation in the Southland occurs during a \u003ca href=\"http://ww2.kqed.org/science/2015/11/23/flying-into-the-heart-of-the-wests-biggest-storms/\">handful of intense storms\u003c/a> each year (even in strong El Niño years). From a statewide perspective, some substantial drought relief has already occurred this year, but there remain large regions in the southern part of the state that are still extremely dry. The refrain from earlier in the autumn is now more relevant than ever: while El Niño is likely to bring some degree of drought relief, California will likely still be facing long-term drought conditions by the coming summer.\u003c/p>\n\u003cp>\u003cstrong>The Big Picture\u003c/strong>\u003c/p>\n\u003cp>Finally, there has been considerable discussion lately regarding why the atmospheric response to El Niño this year has been different than historically observed (and also than foreseen by some of the flagship seasonal forecast models). It’s impossible to ignore the fact that global temperatures in late 2015 and early 2016 have reached their \u003ca href=\"http://ww2.kqed.org/science/2016/01/20/2015-was-the-warmest-year-on-record-globally-but-not-in-california/\">highest levels in recorded human history\u003c/a>. Part of this very recent warming is likely a product of our record El Niño event, but the rest is pretty clearly attributable to the long-term warming trend associated the with human emission of greenhouse gases. While global mean temperature doesn’t directly affect El Niño teleconnections, per se, the Earth hasn’t been warming in a spatially uniform way. This year in particular, the subtropics and the polar regions have been especially warm relative to other parts of the world. It is possible that this spatial pattern of warming may be playing a role in the particular atmospheric configuration that has resulted from the 2015-2016 El Niño event.\u003c/p>\n\u003cp>Unfortunately, it is virtually impossible to say more than that right now. The pace of climate change attribution science is much slower than that of the atmosphere itself, and it’s hard to make causal inferences from observations alone. Climate models are often the best tool available for climate scientists to test the counterfactual: what would this year have looked like without global warming? Such experiments take a considerable amount of time, so we’ll probably have to wait a while to find out. Stay tuned.\u003c/p>\n\u003cp>\u003c/p>\u003c/div>",
"attributes": {
"named": {},
"numeric": []
}
},
{
"type": "component",
"content": "",
"name": "ad",
"attributes": {
"named": {
"label": "floatright"
},
"numeric": [
"floatright"
]
}
},
{
"type": "contentString",
"content": "\u003cdiv class=\"post-body\">\u003cp>\u003c/p>\n\u003cp>\u003cem>Daniel Swain is an atmospheric scientist at Stanford’s School of Earth, Energy & Environmental Sciences. A version of this post also appears on his \u003ca href=\"http://www.weatherwest.com/\">California Weather\u003c/a> blog.\u003c/em>\u003c/p>\n\n\u003c/div>\u003c/p>",
"attributes": {
"named": {},
"numeric": []
}
}
],
"link": "/science/502283/why-this-el-nino-is-one-for-the-books",
"authors": [
"byline_science_502283"
],
"series": [
"science_1151"
],
"categories": [
"science_31",
"science_40",
"science_98"
],
"tags": [
"science_572",
"science_371",
"science_1004"
],
"featImg": "science_502284",
"label": "science_1151"
},
"science_499218": {
"type": "posts",
"id": "science_499218",
"meta": {
"index": "posts_1716263798",
"site": "science",
"id": "499218",
"score": null,
"sort": [
1454337917000
]
},
"parent": 0,
"labelTerm": {},
"blocks": [],
"publishDate": 1454337917,
"format": "standard",
"title": "Bay Area Landslide Risk Goes Up as Rains Pour Down",
"headTitle": "Bay Area Landslide Risk Goes Up as Rains Pour Down | KQED",
"content": "\u003cp>\u003cstrong>Listen to the Story:\u003c/strong>\u003cbr>\nhttp://www.kqed.org/.stream/anon/radio//2016/01/WEBLandslideRiskVenton.mp3\u003c/p>\n\u003cp>The winter rains have brought sweet relief to California after four years of punishing drought. But as one El Nino-fueled storm follows another, the heavy precipitation can cause its own set of hazards. That includes the potential for landslides. \u003c/p>\n\u003cp>“How bad this year will be for landslides all depends upon how intense the rains will be,” says Brian Collins, a researcher at the U. S. Geological Survey in Menlo Park. “The water has been pretty constant so there is a danger.” \u003c/p>\n\u003cp>During most years, many small landslides affect the Bay Area. Catastrophic slides, causing loss of property and life, aren’t common, but they do happen. \u003c/p>\n\u003cp>\u003cstrong>The Night the Mountain Fell at Love Creek \u003c/strong>\u003c/p>\n\u003cp>[ad fullwidth]\u003c/p>\n\u003cp>In early January of 1982, a \u003ca href=\"http://www.santacruzsentinel.com/article/ZZ/20120106/NEWS/120108207\" target=\"_blank\" rel=\"noopener\">heavy storm slammed\u003c/a> into the Santa Cruz mountains. Though it was not an El Niño year, the storm dropped 20 inches of rain in just 32 hours—nearly half the area’s annual rainfall.\u003c/p>\n\u003cp>At the time, Stephen Sanders was a fire captain for the Ben Lomond Volunteer Fire Department. On January 5, the morning after the storm, Sanders was at the fire station when an elderly couple walked in. They’d had to pick their way through debris to get there and were worried about their neighbors living further up the mountain along Love Creek.\u003c/p>\n\u003cp>“So the Chief sent myself and my brother and another gentlemen up here, ‘Hey, go up there, find out what’s going on.’”\u003c/p>\n\u003cp>Recently, Sanders and I revisited the gully where, shortly after midnight on Jan. 5, a huge swath of hillside, about a quarter of a mile across, had broken away. A punishing river of mud, rocks and debris smothered the trees, houses and land below.\u003c/p>\n\u003cp>“We got here about 8 o’clock in the morning, after the sun came out, just like this,” Sanders recalls, standing at the site. “And it was just all—just boulders and clay, mud, and you’re sliding all over. It was terrible.”\u003c/p>\n\u003cp>Hundreds of people volunteered to search the rubble by hand for bodies. The National Guard came out to help. In the end, 10 people died. Longtime Ben Lomond residents don’t talk about it much.\u003c/p>\n\u003cp>“It’s very tough for us. These were our friends and neighbors,” Sanders says. “I knew everybody up here. We all did.”\u003c/p>\n\u003cp>The county designated it a hazardous area, and other homes there were torn down. There’s not much left but rubble and twisted metal.\u003c/p>\n\u003cp>\u003cstrong>Landslides Are Hard to Predict\u003c/strong>\u003c/p>\n\u003cp>Unlike other catastrophes–like floods or fires–people hardly ever evacuate for landslides. That’s because they are very difficult to predict. Scientists don’t have the tools to know where they’ll strike. \u003c/p>\n\u003cfigure id=\"attachment_499381\" class=\"wp-caption aligncenter\" style=\"max-width: 1730px\">\u003ca href=\"http://ww2.kqed.org/science/wp-content/uploads/sites/35/2016/01/LandslideMap_V06_160129.jpg\" rel=\"attachment wp-att-499381\">\u003cimg loading=\"lazy\" decoding=\"async\" src=\"http://ww2.kqed.org/science/wp-content/uploads/sites/35/2016/01/LandslideMap_V06_160129.jpg\" alt=\"Mountainous areas, even though they have steep slopes, require more rain to trigger a landslide risk because they've got a soil structure that's been absorbing rain effectively for centuries.\" width=\"1730\" height=\"1780\" class=\"size-full wp-image-499381\" srcset=\"https://cdn.kqed.org/wp-content/uploads/sites/35/2016/01/LandslideMap_V06_160129.jpg 1730w, https://cdn.kqed.org/wp-content/uploads/sites/35/2016/01/LandslideMap_V06_160129-400x412.jpg 400w, https://cdn.kqed.org/wp-content/uploads/sites/35/2016/01/LandslideMap_V06_160129-800x823.jpg 800w, https://cdn.kqed.org/wp-content/uploads/sites/35/2016/01/LandslideMap_V06_160129-768x790.jpg 768w, https://cdn.kqed.org/wp-content/uploads/sites/35/2016/01/LandslideMap_V06_160129-1440x1482.jpg 1440w, https://cdn.kqed.org/wp-content/uploads/sites/35/2016/01/LandslideMap_V06_160129-1180x1214.jpg 1180w, https://cdn.kqed.org/wp-content/uploads/sites/35/2016/01/LandslideMap_V06_160129-960x988.jpg 960w, https://cdn.kqed.org/wp-content/uploads/sites/35/2016/01/LandslideMap_V06_160129-32x32.jpg 32w\" sizes=\"(max-width: 1730px) 100vw, 1730px\">\u003c/a>\u003cfigcaption class=\"wp-caption-text\">Mountainous areas, even though they have steep slopes, require more rain to trigger a landslide risk because they’ve got a soil structure that’s been absorbing rain effectively for centuries. \u003ccite>(Teodros Hailye/KQED)\u003c/cite>\u003c/figcaption>\u003c/figure>\n\u003cp>A lot of factors contribute to the potential for a landslide, things like the steepness of the slope, the construction of the soil, how wet it is, and how loose or tightly packed. These conditions change dramatically from one location to another and from one day to another. \u003c/p>\n\u003cp>But there is one thing scientists know for certain raises the risk a landslide will happen: intense rainfall on saturated ground.\u003c/p>\n\u003cp>“That’s why we’re measuring the soil moisture,” says Collins of the USGS.\u003c/p>\n\u003cp>The agency monitors soil moisture in the Bay Area to get a sense of how saturated the region is, but it’s a new area of research and they only have sensors at four sites. If the project goes well, more could be installed in the future, but for now it’s a broad look.\u003c/p>\n\u003cp>“We’ll probably be able to predict the timing a little bit better than the exact location,” says Collins, “You can’t step on a location and say, ‘This is the next one to go,’ mainly because of variability in the soil.”\u003c/p>\n\u003cp>Variability not just in the type of soil, but in whether it’s had a chance to dry out between storms. If it has, a heavy rainfall isn’t as hazardous. \u003c/p>\n\u003cp>Right now, Collins says their sensors show soil moisture levels that are high and staying high.\u003c/p>\n\u003cp>“There hasn’t really been too many drying out periods in between storms; we’re getting storms every couple of days,” he says. “The next part of the equation is, will there be a storm with high enough rainfall intensities to actually do something?” \u003c/p>\n\u003cp>\u003c/p>\n\u003cp>Since the risk of landslides is related to how much rain falls in a 24-hour period, people wanting to prepare can check the National Weather Service \u003ca href=\"http://www.wrh.noaa.gov/mtr/\" target=\"_blank\" rel=\"noopener\">hazard warnings\u003c/a> for detailed information on major storms and other weather events. Experts also recommend having an emergency plan for yourself and your family. \u003c/p>\n\n",
"stats": {
"hasVideo": false,
"hasChartOrMap": false,
"hasAudio": true,
"hasPolis": false,
"wordCount": 878,
"hasGoogleForm": false,
"hasGallery": false,
"hasHearkenModule": false,
"iframeSrcs": [],
"paragraphCount": 26
},
"modified": 1704930700,
"excerpt": "Many conditions affect whether a landslide happens, but the most significant risk factor is heavy rain on saturated ground.",
"headData": {
"twImgId": "",
"twTitle": "",
"ogTitle": "",
"ogImgId": "",
"twDescription": "",
"description": "Many conditions affect whether a landslide happens, but the most significant risk factor is heavy rain on saturated ground.",
"title": "Bay Area Landslide Risk Goes Up as Rains Pour Down | KQED",
"ogDescription": "",
"schema": {
"@context": "https://schema.org",
"@type": "Article",
"headline": "Bay Area Landslide Risk Goes Up as Rains Pour Down",
"datePublished": "2016-02-01T06:45:17-08:00",
"dateModified": "2024-01-10T15:51:40-08:00",
"image": "https://cdn.kqed.org/wp-content/uploads/2020/02/KQED-OG-Image@1x.png"
}
},
"guestAuthors": [],
"slug": "bay-area-landslide-risk-goes-up-as-rains-pour-down",
"status": "publish",
"nprByline": "Danielle Venton",
"sticky": false,
"source": "Geology",
"path": "/science/499218/bay-area-landslide-risk-goes-up-as-rains-pour-down",
"audioUrl": "http://www.kqed.org/.stream/anon/radio//2016/01/WEBLandslideRiskVenton.mp3",
"audioDuration": null,
"audioTrackLength": null,
"parsedContent": [
{
"type": "contentString",
"content": "\u003cdiv class=\"post-body\">\u003cp>\u003cp>\u003cstrong>Listen to the Story:\u003c/strong>\u003cbr>\u003c/p>\u003c/div>",
"attributes": {
"named": {},
"numeric": []
}
},
{
"type": "component",
"content": "",
"name": "audioLink",
"attributes": {
"named": {
"src": "http://www.kqed.org/.stream/anon/radio//2016/01/WEBLandslideRiskVenton.mp3"
},
"numeric": []
}
},
{
"type": "contentString",
"content": "\u003cdiv class=\"post-body\">\u003cp>\u003cp>The winter rains have brought sweet relief to California after four years of punishing drought. But as one El Nino-fueled storm follows another, the heavy precipitation can cause its own set of hazards. That includes the potential for landslides. \u003c/p>\n\u003cp>“How bad this year will be for landslides all depends upon how intense the rains will be,” says Brian Collins, a researcher at the U. S. Geological Survey in Menlo Park. “The water has been pretty constant so there is a danger.” \u003c/p>\n\u003cp>During most years, many small landslides affect the Bay Area. Catastrophic slides, causing loss of property and life, aren’t common, but they do happen. \u003c/p>\n\u003cp>\u003cstrong>The Night the Mountain Fell at Love Creek \u003c/strong>\u003c/p>\n\u003cp>\u003c/p>\u003c/div>",
"attributes": {
"named": {},
"numeric": []
}
},
{
"type": "component",
"content": "",
"name": "ad",
"attributes": {
"named": {
"label": "fullwidth"
},
"numeric": [
"fullwidth"
]
}
},
{
"type": "contentString",
"content": "\u003cdiv class=\"post-body\">\u003cp>\u003c/p>\n\u003cp>In early January of 1982, a \u003ca href=\"http://www.santacruzsentinel.com/article/ZZ/20120106/NEWS/120108207\" target=\"_blank\" rel=\"noopener\">heavy storm slammed\u003c/a> into the Santa Cruz mountains. Though it was not an El Niño year, the storm dropped 20 inches of rain in just 32 hours—nearly half the area’s annual rainfall.\u003c/p>\n\u003cp>At the time, Stephen Sanders was a fire captain for the Ben Lomond Volunteer Fire Department. On January 5, the morning after the storm, Sanders was at the fire station when an elderly couple walked in. They’d had to pick their way through debris to get there and were worried about their neighbors living further up the mountain along Love Creek.\u003c/p>\n\u003cp>“So the Chief sent myself and my brother and another gentlemen up here, ‘Hey, go up there, find out what’s going on.’”\u003c/p>\n\u003cp>Recently, Sanders and I revisited the gully where, shortly after midnight on Jan. 5, a huge swath of hillside, about a quarter of a mile across, had broken away. A punishing river of mud, rocks and debris smothered the trees, houses and land below.\u003c/p>\n\u003cp>“We got here about 8 o’clock in the morning, after the sun came out, just like this,” Sanders recalls, standing at the site. “And it was just all—just boulders and clay, mud, and you’re sliding all over. It was terrible.”\u003c/p>\n\u003cp>Hundreds of people volunteered to search the rubble by hand for bodies. The National Guard came out to help. In the end, 10 people died. Longtime Ben Lomond residents don’t talk about it much.\u003c/p>\n\u003cp>“It’s very tough for us. These were our friends and neighbors,” Sanders says. “I knew everybody up here. We all did.”\u003c/p>\n\u003cp>The county designated it a hazardous area, and other homes there were torn down. There’s not much left but rubble and twisted metal.\u003c/p>\n\u003cp>\u003cstrong>Landslides Are Hard to Predict\u003c/strong>\u003c/p>\n\u003cp>Unlike other catastrophes–like floods or fires–people hardly ever evacuate for landslides. That’s because they are very difficult to predict. Scientists don’t have the tools to know where they’ll strike. \u003c/p>\n\u003cfigure id=\"attachment_499381\" class=\"wp-caption aligncenter\" style=\"max-width: 1730px\">\u003ca href=\"http://ww2.kqed.org/science/wp-content/uploads/sites/35/2016/01/LandslideMap_V06_160129.jpg\" rel=\"attachment wp-att-499381\">\u003cimg loading=\"lazy\" decoding=\"async\" src=\"http://ww2.kqed.org/science/wp-content/uploads/sites/35/2016/01/LandslideMap_V06_160129.jpg\" alt=\"Mountainous areas, even though they have steep slopes, require more rain to trigger a landslide risk because they've got a soil structure that's been absorbing rain effectively for centuries.\" width=\"1730\" height=\"1780\" class=\"size-full wp-image-499381\" srcset=\"https://cdn.kqed.org/wp-content/uploads/sites/35/2016/01/LandslideMap_V06_160129.jpg 1730w, https://cdn.kqed.org/wp-content/uploads/sites/35/2016/01/LandslideMap_V06_160129-400x412.jpg 400w, https://cdn.kqed.org/wp-content/uploads/sites/35/2016/01/LandslideMap_V06_160129-800x823.jpg 800w, https://cdn.kqed.org/wp-content/uploads/sites/35/2016/01/LandslideMap_V06_160129-768x790.jpg 768w, https://cdn.kqed.org/wp-content/uploads/sites/35/2016/01/LandslideMap_V06_160129-1440x1482.jpg 1440w, https://cdn.kqed.org/wp-content/uploads/sites/35/2016/01/LandslideMap_V06_160129-1180x1214.jpg 1180w, https://cdn.kqed.org/wp-content/uploads/sites/35/2016/01/LandslideMap_V06_160129-960x988.jpg 960w, https://cdn.kqed.org/wp-content/uploads/sites/35/2016/01/LandslideMap_V06_160129-32x32.jpg 32w\" sizes=\"(max-width: 1730px) 100vw, 1730px\">\u003c/a>\u003cfigcaption class=\"wp-caption-text\">Mountainous areas, even though they have steep slopes, require more rain to trigger a landslide risk because they’ve got a soil structure that’s been absorbing rain effectively for centuries. \u003ccite>(Teodros Hailye/KQED)\u003c/cite>\u003c/figcaption>\u003c/figure>\n\u003cp>A lot of factors contribute to the potential for a landslide, things like the steepness of the slope, the construction of the soil, how wet it is, and how loose or tightly packed. These conditions change dramatically from one location to another and from one day to another. \u003c/p>\n\u003cp>But there is one thing scientists know for certain raises the risk a landslide will happen: intense rainfall on saturated ground.\u003c/p>\n\u003cp>“That’s why we’re measuring the soil moisture,” says Collins of the USGS.\u003c/p>\n\u003cp>The agency monitors soil moisture in the Bay Area to get a sense of how saturated the region is, but it’s a new area of research and they only have sensors at four sites. If the project goes well, more could be installed in the future, but for now it’s a broad look.\u003c/p>\n\u003cp>“We’ll probably be able to predict the timing a little bit better than the exact location,” says Collins, “You can’t step on a location and say, ‘This is the next one to go,’ mainly because of variability in the soil.”\u003c/p>\n\u003cp>Variability not just in the type of soil, but in whether it’s had a chance to dry out between storms. If it has, a heavy rainfall isn’t as hazardous. \u003c/p>\n\u003cp>Right now, Collins says their sensors show soil moisture levels that are high and staying high.\u003c/p>\n\u003cp>“There hasn’t really been too many drying out periods in between storms; we’re getting storms every couple of days,” he says. “The next part of the equation is, will there be a storm with high enough rainfall intensities to actually do something?” \u003c/p>\n\u003cp>\u003c/p>\n\u003cp>Since the risk of landslides is related to how much rain falls in a 24-hour period, people wanting to prepare can check the National Weather Service \u003ca href=\"http://www.wrh.noaa.gov/mtr/\" target=\"_blank\" rel=\"noopener\">hazard warnings\u003c/a> for detailed information on major storms and other weather events. Experts also recommend having an emergency plan for yourself and your family. \u003c/p>\n\n\u003c/div>\u003c/p>",
"attributes": {
"named": {},
"numeric": []
}
}
],
"link": "/science/499218/bay-area-landslide-risk-goes-up-as-rains-pour-down",
"authors": [
"byline_science_499218"
],
"categories": [
"science_46",
"science_31",
"science_38",
"science_43"
],
"tags": [
"science_371"
],
"featImg": "science_503977",
"label": "source_science_499218"
},
"science_458878": {
"type": "posts",
"id": "science_458878",
"meta": {
"index": "posts_1716263798",
"site": "science",
"id": "458878",
"score": null,
"sort": [
1452524456000
]
},
"parent": 0,
"labelTerm": {
"site": "science"
},
"blocks": [],
"publishDate": 1452524456,
"format": "standard",
"title": "When Will California's Drought End?",
"headTitle": "When Will California’s Drought End? | KQED",
"content": "\u003cp>This winter’s first big storms, fueled by El Niño, soaked much of the Bay Area in recent weeks.\u003c/p>\n\u003cp>And there’s been a flurry of attention to the gradually rebuilding Sierra snowpack, the “frozen reservoir” that meets about a third of the state’s water needs.\u003c/p>\n\u003cp>[soundcloud url=”https://api.soundcloud.com/tracks/241071442″ params=”color=ff5500&auto_play=false&hide_related=false&show_comments=true&show_user=true&show_reposts=false” width=”100%” height=’166′ iframe=”true” /]\u003c/p>\n\u003cp>But depleted reservoirs are still catching up. December rains added \u003ca href=\"http://www.mercurynews.com/drought/ci_29343070/first-big-el-nino-storms-hit-california-bring\">293 billion gallons\u003c/a> to the 154 major state and federal reservoirs in California, which sounds substantial. But by December’s end, that was still only 31 percent of capacity.\u003c/p>\n\u003cp>And rain totals have been both literally and figuratively all over the map.\u003c/p>\n\u003cp>[ad fullwidth]\u003c/p>\n\u003cp>Many parts of Northwestern California have been soaked—Eureka is at \u003ca href=\"http://www.cnrfc.noaa.gov/awipsProducts/RNOWRKCLI.php\">128 percent of normal\u003c/a> precipitation for this time of year. While sections of the Bay Area, like Oakland airport, are at \u003ca href=\"http://www.cnrfc.noaa.gov/awipsProducts/RNOWRKCLI.php\">74 percent of normal\u003c/a>.\u003c/p>\n\u003cfigure id=\"attachment_458971\" class=\"wp-caption aligncenter\" style=\"max-width: 800px\">\u003cimg loading=\"lazy\" decoding=\"async\" class=\"size-medium wp-image-458971\" src=\"http://ww2.kqed.org/science/wp-content/uploads/sites/35/2016/01/RS17955_IMG_2112-qut-800x600.jpg\" alt=\"Traffic plows through flood waters in San Francisco during early January rains.\" width=\"800\" height=\"600\" srcset=\"https://cdn.kqed.org/wp-content/uploads/sites/35/2016/01/RS17955_IMG_2112-qut-800x600.jpg 800w, https://cdn.kqed.org/wp-content/uploads/sites/35/2016/01/RS17955_IMG_2112-qut-400x300.jpg 400w, https://cdn.kqed.org/wp-content/uploads/sites/35/2016/01/RS17955_IMG_2112-qut-768x576.jpg 768w, https://cdn.kqed.org/wp-content/uploads/sites/35/2016/01/RS17955_IMG_2112-qut-1440x1080.jpg 1440w, https://cdn.kqed.org/wp-content/uploads/sites/35/2016/01/RS17955_IMG_2112-qut.jpg 1920w, https://cdn.kqed.org/wp-content/uploads/sites/35/2016/01/RS17955_IMG_2112-qut-1180x885.jpg 1180w, https://cdn.kqed.org/wp-content/uploads/sites/35/2016/01/RS17955_IMG_2112-qut-960x720.jpg 960w\" sizes=\"(max-width: 800px) 100vw, 800px\">\u003cfigcaption class=\"wp-caption-text\">Traffic plows through flood waters in San Francisco during early January rains. \u003ccite>(Olivia Allen-Price)\u003c/cite>\u003c/figcaption>\u003c/figure>\n\u003cp>With more rain expected this week, one question looms: when will California be out of a drought?\u003c/p>\n\u003cp>\u003cstrong>Three Things That Would End the Drought\u003c/strong>\u003c/p>\n\u003cp>Legally, it’s when Governor Jerry Brown declares it over. However, scientific experts say three things would signify the drought’s end.\u003c/p>\n\u003cul>\n\u003cli>A replenished groundwater supply (but that could take 50 years)\u003c/li>\n\u003cli>Making up for our rainfall deficit (that’d likely take over a year)\u003c/li>\n\u003cli>Full reservoirs\u003c/li>\n\u003c/ul>\n\u003cp>The last scenario would really indicate the end of a drought, according to many experts.\u003c/p>\n\u003cp>Based on past drought-busting years, the \u003ca href=\"http://www.water.ca.gov/waterconditions/background.cfm\">state Department of Water Resources estimates\u003c/a> that precipitation would need to reach about 150 percent of average — about 75 inches — in key Northern California watersheds.\u003c/p>\n\u003cp>California’s largest reservoir, Lake Shasta, is currently only 33 percent full.\u003c/p>\n\u003cp>\u003c/p>\n\u003cp>For more detail on El Niño, the drought and what to expect in the weeks ahead, KQED news anchor Danielle Venton spoke with Paul Rogers, KQED’s managing editor for science. You can listen to their audio interview at the top of the story.\u003c/p>\n\n",
"stats": {
"hasVideo": false,
"hasChartOrMap": false,
"hasAudio": false,
"hasPolis": false,
"wordCount": 396,
"hasGoogleForm": false,
"hasGallery": false,
"hasHearkenModule": false,
"iframeSrcs": [],
"paragraphCount": 15
},
"modified": 1704930805,
"excerpt": "After heavy rain, the Sierra snowpack is finally above average and reservoirs are gaining water, so when will the drought be over?",
"headData": {
"twImgId": "",
"twTitle": "",
"ogTitle": "",
"ogImgId": "",
"twDescription": "",
"description": "After heavy rain, the Sierra snowpack is finally above average and reservoirs are gaining water, so when will the drought be over?",
"title": "When Will California's Drought End? | KQED",
"ogDescription": "",
"schema": {
"@context": "https://schema.org",
"@type": "Article",
"headline": "When Will California's Drought End?",
"datePublished": "2016-01-11T07:00:56-08:00",
"dateModified": "2024-01-10T15:53:25-08:00",
"image": "https://cdn.kqed.org/wp-content/uploads/2020/02/KQED-OG-Image@1x.png"
}
},
"guestAuthors": [],
"slug": "when-will-californias-drought-end",
"status": "publish",
"sticky": false,
"path": "/science/458878/when-will-californias-drought-end",
"audioTrackLength": null,
"parsedContent": [
{
"type": "contentString",
"content": "\u003cdiv class=\"post-body\">\u003cp>\u003cp>This winter’s first big storms, fueled by El Niño, soaked much of the Bay Area in recent weeks.\u003c/p>\n\u003cp>And there’s been a flurry of attention to the gradually rebuilding Sierra snowpack, the “frozen reservoir” that meets about a third of the state’s water needs.\u003c/p>\n\u003cp>\u003c/p>\u003cp>\u003cdiv class='utils-parseShortcode-shortcodes-__shortcodes__shortcodeWrapper'>\n \u003ciframe width='”100%”' height='’166′'\n scrolling='no' frameborder='no'\n src='https://w.soundcloud.com/player/?url=”https://api.soundcloud.com/tracks/241071442″&visual=true&”color=ff5500&auto_play=false&hide_related=false&show_comments=true&show_user=true&show_reposts=false”'\n title='”https://api.soundcloud.com/tracks/241071442″'>\n \u003c/iframe>\n \u003c/div>\u003c/p>\u003cp>\u003c/p>\n\u003cp>But depleted reservoirs are still catching up. December rains added \u003ca href=\"http://www.mercurynews.com/drought/ci_29343070/first-big-el-nino-storms-hit-california-bring\">293 billion gallons\u003c/a> to the 154 major state and federal reservoirs in California, which sounds substantial. But by December’s end, that was still only 31 percent of capacity.\u003c/p>\n\u003cp>And rain totals have been both literally and figuratively all over the map.\u003c/p>\n\u003cp>\u003c/p>\u003c/div>",
"attributes": {
"named": {},
"numeric": []
}
},
{
"type": "component",
"content": "",
"name": "ad",
"attributes": {
"named": {
"label": "fullwidth"
},
"numeric": [
"fullwidth"
]
}
},
{
"type": "contentString",
"content": "\u003cdiv class=\"post-body\">\u003cp>\u003c/p>\n\u003cp>Many parts of Northwestern California have been soaked—Eureka is at \u003ca href=\"http://www.cnrfc.noaa.gov/awipsProducts/RNOWRKCLI.php\">128 percent of normal\u003c/a> precipitation for this time of year. While sections of the Bay Area, like Oakland airport, are at \u003ca href=\"http://www.cnrfc.noaa.gov/awipsProducts/RNOWRKCLI.php\">74 percent of normal\u003c/a>.\u003c/p>\n\u003cfigure id=\"attachment_458971\" class=\"wp-caption aligncenter\" style=\"max-width: 800px\">\u003cimg loading=\"lazy\" decoding=\"async\" class=\"size-medium wp-image-458971\" src=\"http://ww2.kqed.org/science/wp-content/uploads/sites/35/2016/01/RS17955_IMG_2112-qut-800x600.jpg\" alt=\"Traffic plows through flood waters in San Francisco during early January rains.\" width=\"800\" height=\"600\" srcset=\"https://cdn.kqed.org/wp-content/uploads/sites/35/2016/01/RS17955_IMG_2112-qut-800x600.jpg 800w, https://cdn.kqed.org/wp-content/uploads/sites/35/2016/01/RS17955_IMG_2112-qut-400x300.jpg 400w, https://cdn.kqed.org/wp-content/uploads/sites/35/2016/01/RS17955_IMG_2112-qut-768x576.jpg 768w, https://cdn.kqed.org/wp-content/uploads/sites/35/2016/01/RS17955_IMG_2112-qut-1440x1080.jpg 1440w, https://cdn.kqed.org/wp-content/uploads/sites/35/2016/01/RS17955_IMG_2112-qut.jpg 1920w, https://cdn.kqed.org/wp-content/uploads/sites/35/2016/01/RS17955_IMG_2112-qut-1180x885.jpg 1180w, https://cdn.kqed.org/wp-content/uploads/sites/35/2016/01/RS17955_IMG_2112-qut-960x720.jpg 960w\" sizes=\"(max-width: 800px) 100vw, 800px\">\u003cfigcaption class=\"wp-caption-text\">Traffic plows through flood waters in San Francisco during early January rains. \u003ccite>(Olivia Allen-Price)\u003c/cite>\u003c/figcaption>\u003c/figure>\n\u003cp>With more rain expected this week, one question looms: when will California be out of a drought?\u003c/p>\n\u003cp>\u003cstrong>Three Things That Would End the Drought\u003c/strong>\u003c/p>\n\u003cp>Legally, it’s when Governor Jerry Brown declares it over. However, scientific experts say three things would signify the drought’s end.\u003c/p>\n\u003cul>\n\u003cli>A replenished groundwater supply (but that could take 50 years)\u003c/li>\n\u003cli>Making up for our rainfall deficit (that’d likely take over a year)\u003c/li>\n\u003cli>Full reservoirs\u003c/li>\n\u003c/ul>\n\u003cp>The last scenario would really indicate the end of a drought, according to many experts.\u003c/p>\n\u003cp>Based on past drought-busting years, the \u003ca href=\"http://www.water.ca.gov/waterconditions/background.cfm\">state Department of Water Resources estimates\u003c/a> that precipitation would need to reach about 150 percent of average — about 75 inches — in key Northern California watersheds.\u003c/p>\n\u003cp>California’s largest reservoir, Lake Shasta, is currently only 33 percent full.\u003c/p>\n\u003cp>\u003c/p>\n\u003cp>For more detail on El Niño, the drought and what to expect in the weeks ahead, KQED news anchor Danielle Venton spoke with Paul Rogers, KQED’s managing editor for science. You can listen to their audio interview at the top of the story.\u003c/p>\n\n\u003c/div>\u003c/p>",
"attributes": {
"named": {},
"numeric": []
}
}
],
"link": "/science/458878/when-will-californias-drought-end",
"authors": [
"5432",
"8673"
],
"categories": [
"science_31",
"science_40",
"science_98"
],
"tags": [
"science_371",
"science_1213",
"science_1462",
"science_107"
],
"featImg": "science_458966",
"label": "science"
},
"science_403806": {
"type": "posts",
"id": "science_403806",
"meta": {
"index": "posts_1716263798",
"site": "science",
"id": "403806",
"score": null,
"sort": [
1449705625000
]
},
"parent": 0,
"labelTerm": {
"site": "science"
},
"blocks": [],
"publishDate": 1449705625,
"format": "standard",
"title": "FEMA Unveils El Niño Disaster Response Plan",
"headTitle": "FEMA Unveils El Niño Disaster Response Plan | KQED",
"content": "\u003cp>Federal and state officials unveiled a disaster plan today for dealing with flooding, landslides and power outages this winter.\u003c/p>\n\u003cp>El Niño-related storms are expected to hit California, Nevada and Arizona this month and continue through early spring. California, especially southern California, is expected to receive above-average rainfall from December through March.\u003c/p>\n\u003caside class=\"pullquote alignright\">‘We’re very, very concerned about flash flooding.’\u003ccite> Mark Ghilarducci, California Office of Emergency Services \u003c/cite>\u003c/aside>\n\u003cp>Emergency planners say Californians will likely be battling a range of disasters, including mudslides, floods, rising tides and downed trees that cause power outages. \u003c/p>\n\u003cp>And the drought has packed the soil, which could make conditions even more more difficult, says Mark Ghilarducci, director of the state Office of Emergency Services.\u003c/p>\n\u003cp>“The land is very, very hard,” Ghilarducci says, “and so we’re very, very concerned about flash flooding.”\u003c/p>\n\u003cp>[ad fullwidth]\u003c/p>\n\u003cp>Areas like Lake County, where wildfires decimated trees that normally hold soil in place, are susceptible to mudslides.\u003c/p>\n\u003cp>“In the burn scar areas — we had some catastrophic fires this summer — we’re very concerned what this heavy water will do to those areas,” he says.\u003c/p>\n\u003cp>Along the coast, above average sea surface temperatures related to El Niño mean higher sea levels. And the El Niño conditions, coupled with King Tides, create even higher tides dubbed Tall Kings, \u003ca href=\"http://www.opc.ca.gov/webmaster/_media_library/2015/12/RecordBreakingSeaLevelsMemo.pdf\">according to the National Oceanic and Atmospheric Administration\u003c/a>.\u003c/p>\n\u003cp>Tidal highs are already breaking records. During Thanksgiving week, tide stations at San Diego, La Jolla and Santa Barbara recorded the highest tide levels ever.\u003c/p>\n\u003cfigure id=\"attachment_403989\" class=\"wp-caption aligncenter\" style=\"max-width: 800px\">\u003ca href=\"http://ww2.kqed.org/science/wp-content/uploads/sites/35/2015/12/El-Nino_response.jpg\">\u003cimg loading=\"lazy\" decoding=\"async\" class=\"size-medium wp-image-403989\" src=\"http://ww2.kqed.org/science/wp-content/uploads/sites/35/2015/12/El-Nino_response-800x600.jpg\" alt=\"Government officials gather at the California Office of Emergency Response during an El Nino disaster response planning session.\" width=\"800\" height=\"600\" srcset=\"https://cdn.kqed.org/wp-content/uploads/sites/35/2015/12/El-Nino_response-800x600.jpg 800w, https://cdn.kqed.org/wp-content/uploads/sites/35/2015/12/El-Nino_response-400x300.jpg 400w, https://cdn.kqed.org/wp-content/uploads/sites/35/2015/12/El-Nino_response-1180x885.jpg 1180w, https://cdn.kqed.org/wp-content/uploads/sites/35/2015/12/El-Nino_response-960x720.jpg 960w, https://cdn.kqed.org/wp-content/uploads/sites/35/2015/12/El-Nino_response.jpg 1280w\" sizes=\"(max-width: 800px) 100vw, 800px\">\u003c/a>\u003cfigcaption class=\"wp-caption-text\">Government officials gather at the California Office of Emergency Response during an El Niño disaster response planning session. \u003ccite>(Craig Miller/KQED)\u003c/cite>\u003c/figcaption>\u003c/figure>\n\u003cp>Because Arizona and Nevada are deserts they are less vulnerable than California. Arizona is susceptible to flash flooding, however, which it often experiences during its summer monsoon season.\u003c/p>\n\u003cp>The impact on Nevada will depend on how much water flows down Eastern Sierra rivers and drainages from melting snow.\u003c/p>\n\u003cp>El Niño is a series of ocean conditions defined by above-average sea surface temperatures in the equatorial Pacific. NOAA forecasters say this year’s El Niño is stronger than usual, and has a 95 percent chance of continuing through the winter.\u003c/p>\n\u003cp>The last time San Francisco experienced an El Niño of this magnitude, in the winter of ’97-98, the city received double the normal amount of rain.\u003c/p>\n\u003cp>During The Federal Emergency Management Agency and California’s Office of Emergency Management drill in Sacramento today, the agencies offered tips to the public, and urged people to prepare.\u003c/p>\n\u003cp>\u003c/p>\n\u003cp>\u003cstrong>El Niño Disaster Planning Tips\u003c/strong>\u003c/p>\n\u003cul>\n\u003cli>Visit \u003ca href=\"https://www.floodsmart.gov/floodsmart/\">floodsmart.gov\u003c/a> to see if you live in a flood zone (one in five Californians live in a flood prone area).\u003c/li>\n\u003cli>Make sure you have a plan in place before, during and after heavy rains. Visit \u003ca href=\"http://www.ready.gov/\">ready.gov \u003c/a>for tips.\u003c/li>\n\u003cli>Consider buying \u003ca href=\"https://www.fema.gov/national-flood-insurance-program\">flood insurance\u003c/a>. It’s not included in most insurance plans.\u003c/li>\n\u003cli>Help out. FEMA is \u003ca href=\"https://careers.fema.gov/temporary-local-hires\">looking to hire\u003c/a> 500 people in California, Nevada and Arizona to help with response efforts. The agency is especially interested in engineers, construction or social workers.\u003c/li>\n\u003cli>If you live in a low-lying area, ask your \u003ca href=\"http://www.firedepartment.net/directory/california\">local fire department\u003c/a> where you can buy sandbags.\u003c/li>\n\u003c/ul>\n\n",
"stats": {
"hasVideo": false,
"hasChartOrMap": false,
"hasAudio": false,
"hasPolis": false,
"wordCount": 564,
"hasGoogleForm": false,
"hasGallery": false,
"hasHearkenModule": false,
"iframeSrcs": [],
"paragraphCount": 17
},
"modified": 1704930949,
"excerpt": "On Wednesday, federal and state officials released an emergency plan for heavy winter storms, severe flooding, power outages and mudslides this winter.",
"headData": {
"twImgId": "",
"twTitle": "",
"ogTitle": "",
"ogImgId": "",
"twDescription": "",
"description": "On Wednesday, federal and state officials released an emergency plan for heavy winter storms, severe flooding, power outages and mudslides this winter.",
"title": "FEMA Unveils El Niño Disaster Response Plan | KQED",
"ogDescription": "",
"schema": {
"@context": "https://schema.org",
"@type": "Article",
"headline": "FEMA Unveils El Niño Disaster Response Plan",
"datePublished": "2015-12-09T16:00:25-08:00",
"dateModified": "2024-01-10T15:55:49-08:00",
"image": "https://cdn.kqed.org/wp-content/uploads/2020/02/KQED-OG-Image@1x.png"
}
},
"guestAuthors": [],
"slug": "fema-unveils-el-nino-disaster-response-plan",
"status": "publish",
"sticky": false,
"path": "/science/403806/fema-unveils-el-nino-disaster-response-plan",
"audioTrackLength": null,
"parsedContent": [
{
"type": "contentString",
"content": "\u003cdiv class=\"post-body\">\u003cp>\u003cp>Federal and state officials unveiled a disaster plan today for dealing with flooding, landslides and power outages this winter.\u003c/p>\n\u003cp>El Niño-related storms are expected to hit California, Nevada and Arizona this month and continue through early spring. California, especially southern California, is expected to receive above-average rainfall from December through March.\u003c/p>\n\u003caside class=\"pullquote alignright\">‘We’re very, very concerned about flash flooding.’\u003ccite> Mark Ghilarducci, California Office of Emergency Services \u003c/cite>\u003c/aside>\n\u003cp>Emergency planners say Californians will likely be battling a range of disasters, including mudslides, floods, rising tides and downed trees that cause power outages. \u003c/p>\n\u003cp>And the drought has packed the soil, which could make conditions even more more difficult, says Mark Ghilarducci, director of the state Office of Emergency Services.\u003c/p>\n\u003cp>“The land is very, very hard,” Ghilarducci says, “and so we’re very, very concerned about flash flooding.”\u003c/p>\n\u003cp>\u003c/p>\u003c/div>",
"attributes": {
"named": {},
"numeric": []
}
},
{
"type": "component",
"content": "",
"name": "ad",
"attributes": {
"named": {
"label": "fullwidth"
},
"numeric": [
"fullwidth"
]
}
},
{
"type": "contentString",
"content": "\u003cdiv class=\"post-body\">\u003cp>\u003c/p>\n\u003cp>Areas like Lake County, where wildfires decimated trees that normally hold soil in place, are susceptible to mudslides.\u003c/p>\n\u003cp>“In the burn scar areas — we had some catastrophic fires this summer — we’re very concerned what this heavy water will do to those areas,” he says.\u003c/p>\n\u003cp>Along the coast, above average sea surface temperatures related to El Niño mean higher sea levels. And the El Niño conditions, coupled with King Tides, create even higher tides dubbed Tall Kings, \u003ca href=\"http://www.opc.ca.gov/webmaster/_media_library/2015/12/RecordBreakingSeaLevelsMemo.pdf\">according to the National Oceanic and Atmospheric Administration\u003c/a>.\u003c/p>\n\u003cp>Tidal highs are already breaking records. During Thanksgiving week, tide stations at San Diego, La Jolla and Santa Barbara recorded the highest tide levels ever.\u003c/p>\n\u003cfigure id=\"attachment_403989\" class=\"wp-caption aligncenter\" style=\"max-width: 800px\">\u003ca href=\"http://ww2.kqed.org/science/wp-content/uploads/sites/35/2015/12/El-Nino_response.jpg\">\u003cimg loading=\"lazy\" decoding=\"async\" class=\"size-medium wp-image-403989\" src=\"http://ww2.kqed.org/science/wp-content/uploads/sites/35/2015/12/El-Nino_response-800x600.jpg\" alt=\"Government officials gather at the California Office of Emergency Response during an El Nino disaster response planning session.\" width=\"800\" height=\"600\" srcset=\"https://cdn.kqed.org/wp-content/uploads/sites/35/2015/12/El-Nino_response-800x600.jpg 800w, https://cdn.kqed.org/wp-content/uploads/sites/35/2015/12/El-Nino_response-400x300.jpg 400w, https://cdn.kqed.org/wp-content/uploads/sites/35/2015/12/El-Nino_response-1180x885.jpg 1180w, https://cdn.kqed.org/wp-content/uploads/sites/35/2015/12/El-Nino_response-960x720.jpg 960w, https://cdn.kqed.org/wp-content/uploads/sites/35/2015/12/El-Nino_response.jpg 1280w\" sizes=\"(max-width: 800px) 100vw, 800px\">\u003c/a>\u003cfigcaption class=\"wp-caption-text\">Government officials gather at the California Office of Emergency Response during an El Niño disaster response planning session. \u003ccite>(Craig Miller/KQED)\u003c/cite>\u003c/figcaption>\u003c/figure>\n\u003cp>Because Arizona and Nevada are deserts they are less vulnerable than California. Arizona is susceptible to flash flooding, however, which it often experiences during its summer monsoon season.\u003c/p>\n\u003cp>The impact on Nevada will depend on how much water flows down Eastern Sierra rivers and drainages from melting snow.\u003c/p>\n\u003cp>El Niño is a series of ocean conditions defined by above-average sea surface temperatures in the equatorial Pacific. NOAA forecasters say this year’s El Niño is stronger than usual, and has a 95 percent chance of continuing through the winter.\u003c/p>\n\u003cp>The last time San Francisco experienced an El Niño of this magnitude, in the winter of ’97-98, the city received double the normal amount of rain.\u003c/p>\n\u003cp>During The Federal Emergency Management Agency and California’s Office of Emergency Management drill in Sacramento today, the agencies offered tips to the public, and urged people to prepare.\u003c/p>\n\u003cp>\u003c/p>\n\u003cp>\u003cstrong>El Niño Disaster Planning Tips\u003c/strong>\u003c/p>\n\u003cul>\n\u003cli>Visit \u003ca href=\"https://www.floodsmart.gov/floodsmart/\">floodsmart.gov\u003c/a> to see if you live in a flood zone (one in five Californians live in a flood prone area).\u003c/li>\n\u003cli>Make sure you have a plan in place before, during and after heavy rains. Visit \u003ca href=\"http://www.ready.gov/\">ready.gov \u003c/a>for tips.\u003c/li>\n\u003cli>Consider buying \u003ca href=\"https://www.fema.gov/national-flood-insurance-program\">flood insurance\u003c/a>. It’s not included in most insurance plans.\u003c/li>\n\u003cli>Help out. FEMA is \u003ca href=\"https://careers.fema.gov/temporary-local-hires\">looking to hire\u003c/a> 500 people in California, Nevada and Arizona to help with response efforts. The agency is especially interested in engineers, construction or social workers.\u003c/li>\n\u003cli>If you live in a low-lying area, ask your \u003ca href=\"http://www.firedepartment.net/directory/california\">local fire department\u003c/a> where you can buy sandbags.\u003c/li>\n\u003c/ul>\n\n\u003c/div>\u003c/p>",
"attributes": {
"named": {},
"numeric": []
}
}
],
"link": "/science/403806/fema-unveils-el-nino-disaster-response-plan",
"authors": [
"5432"
],
"categories": [
"science_31",
"science_35",
"science_40"
],
"tags": [
"science_182",
"science_371",
"science_316",
"science_365"
],
"featImg": "science_404261",
"label": "science"
},
"science_368478": {
"type": "posts",
"id": "science_368478",
"meta": {
"index": "posts_1716263798",
"site": "science",
"id": "368478",
"score": null,
"sort": [
1448265662000
]
},
"parent": 0,
"labelTerm": {
"site": "science",
"term": 1151
},
"blocks": [],
"publishDate": 1448265662,
"format": "standard",
"title": "Flying Into the Heart of the West's Biggest Storms",
"headTitle": "Flying Into the Heart of the West’s Biggest Storms | KQED",
"content": "\u003cp>\u003cstrong>Listen to the story:\u003c/strong> \u003c/p>\n\u003cp>http://www.kqed.org/.stream/anon/radio//2015/11/AtmosphericRiver.mp3\u003c/p>\n\u003cp>It’s a noisy, rocky ride. I’m flying through the thick of a rainstorm on a research plane operated by the \u003ca href=\"http://www.noaa.gov/\" target=\"_blank\" rel=\"noopener\">National Oceanic and Atmospheric Administration\u003c/a>. It’s crewed by a group of pilots and technicians known as the NOAA “\u003ca href=\"http://flightscience.noaa.gov/\" target=\"_blank\" rel=\"noopener\">Hurricane Hunters\u003c/a>.” Their specialty is flying into the thick of storms, so they can relay data to weather forecasters.\u003c/p>\n\u003cp>On this flight last winter, though, we’re on a special mission. The flight is gathering data for an ambitious project known as \u003ca href=\"http://www.esrl.noaa.gov/psd/calwater/pdf/calwater-2pager-final.pdf\" target=\"_blank\" rel=\"noopener\">CalWater 2015\u003c/a>. The researchers’ ultimate goal is nothing less than to learn how the West Coast gets its water. Theirs is a story of rivers in the sky, motes of dust and sturdy aircraft.\u003c/p>\n\u003cfigure id=\"attachment_368722\" class=\"wp-caption aligncenter\" style=\"max-width: 1280px\">\u003ca href=\"http://ww2.kqed.org/science/wp-content/uploads/sites/35/2015/11/RS17505_2015-02-05-12-qut.jpg\">\u003cimg loading=\"lazy\" decoding=\"async\" class=\"size-full wp-image-368722\" src=\"http://ww2.kqed.org/science/wp-content/uploads/sites/35/2015/11/RS17505_2015-02-05-12-qut.jpg\" alt=\"This buoy will drop from the plane into the ocean to take temperature readings.\" width=\"1280\" height=\"960\" srcset=\"https://cdn.kqed.org/wp-content/uploads/sites/35/2015/11/RS17505_2015-02-05-12-qut.jpg 1280w, https://cdn.kqed.org/wp-content/uploads/sites/35/2015/11/RS17505_2015-02-05-12-qut-400x300.jpg 400w, https://cdn.kqed.org/wp-content/uploads/sites/35/2015/11/RS17505_2015-02-05-12-qut-800x600.jpg 800w, https://cdn.kqed.org/wp-content/uploads/sites/35/2015/11/RS17505_2015-02-05-12-qut-1180x885.jpg 1180w, https://cdn.kqed.org/wp-content/uploads/sites/35/2015/11/RS17505_2015-02-05-12-qut-960x720.jpg 960w\" sizes=\"(max-width: 1280px) 100vw, 1280px\">\u003c/a>\u003cfigcaption class=\"wp-caption-text\">This buoy will drop from the plane into the ocean to take temperature readings. \u003ccite>(Danielle Venton/KQED)\u003c/cite>\u003c/figcaption>\u003c/figure>\n\u003cp>Sitting near me, electronics technician Todd Richards is dropping buoys at regular intervals through a trap door in the cabin floor. The buoys take the temperature of the ocean from the time they hit the water’s surface to a depth of 130 feet.\u003c/p>\n\u003cp>[ad fullwidth]\u003c/p>\n\u003cp>At the moment, researchers have a much better understanding of hurricanes—the most powerful, important storms of the East and South—than they do of the West’s most important storms, known as “atmospheric rivers.” These conveyor belts of moisture, which can be thousands of miles long, pelt the West Coast for days at a time and are responsible for up to half of total precipitation in California.\u003c/p>\n\u003cp>The problem is, our forecasting of these storms isn’t very good.\u003c/p>\n\u003cfigure id=\"attachment_368725\" class=\"wp-caption alignright\" style=\"max-width: 800px\">\u003ca href=\"http://ww2.kqed.org/science/wp-content/uploads/sites/35/2015/11/2015-02-05-12.46.15.jpg\">\u003cimg loading=\"lazy\" decoding=\"async\" class=\"size-medium wp-image-368725\" src=\"http://ww2.kqed.org/science/wp-content/uploads/sites/35/2015/11/2015-02-05-12.46.15-800x600.jpg\" alt=\"Research cubicles line the length of the plane, where scientists monitor variables like water vapor, wind direction and air pressure.\" width=\"800\" height=\"600\" srcset=\"https://cdn.kqed.org/wp-content/uploads/sites/35/2015/11/2015-02-05-12.46.15-800x600.jpg 800w, https://cdn.kqed.org/wp-content/uploads/sites/35/2015/11/2015-02-05-12.46.15-400x300.jpg 400w, https://cdn.kqed.org/wp-content/uploads/sites/35/2015/11/2015-02-05-12.46.15-1180x885.jpg 1180w, https://cdn.kqed.org/wp-content/uploads/sites/35/2015/11/2015-02-05-12.46.15-960x720.jpg 960w, https://cdn.kqed.org/wp-content/uploads/sites/35/2015/11/2015-02-05-12.46.15.jpg 1280w\" sizes=\"(max-width: 800px) 100vw, 800px\">\u003c/a>\u003cfigcaption class=\"wp-caption-text\">Research cubicles line the length of the plane, allowing scientists to monitor variables like water vapor, wind direction and air pressure. \u003ccite>(Danielle Venton/KQED)\u003c/cite>\u003c/figcaption>\u003c/figure>\n\u003cp>“It’s just a very hard thing to get right,” says \u003ca href=\"http://scrippsscholars.ucsd.edu/mralph\" target=\"_blank\" rel=\"noopener\">Marty Ralph\u003c/a>, a research meteorologist at the Scripps Institution of Oceanography and one of the CalWater scientists. “On average the heavy rainfall events are predicted to be about half as strong as they actually end up being.”\u003c/p>\n\u003cp>Most weather models, he says, leave out too many details; they don’t represent the clouds, the particles in the air, or how the air is moving. “They have to parameterize all that indirectly for the most part.”\u003c/p>\n\u003cp>This is where CalWater will help. By gathering data directly from these storms, by flying over, flying through and sailing under them, the collaboration is gathering the information they’ll need to create better weather models. In the future we’ll know more accurately, and with a longer lead time, where storms will make landfall, how much precipitation they’ll bring and how long they’ll last.\u003c/p>\n\u003cp>That’s all useful for emergency planners watching for flood risk, and water managers planning releases from reservoirs.\u003c/p>\n\u003cp>While many might balk at the thought of flying directly into a tempest, for this crew it is part of showing up for work. To stay safe, only the sturdiest planes, the four-engine turboprop \u003ca href=\"http://flightscience.noaa.gov/about_p3s.html\" target=\"_blank\" rel=\"noopener\">NOAA P-3s\u003c/a>, head for the core of the storm. Flying above, the NOAA \u003ca href=\"http://flightscience.noaa.gov/about_g4.html\" target=\"_blank\" rel=\"noopener\">Gulfstream IV-SP\u003c/a> and the \u003ca href=\"https://www.nasa.gov/centers/armstrong/aircraft/ER-2/\" target=\"_blank\" rel=\"noopener\">NASA ER-2\u003c/a> measure clouds, ozone and aerosols from on high. On the ground, a\u003ca href=\"http://hmt.noaa.gov/\" target=\"_blank\" rel=\"noopener\"> network of land-based sensors\u003c/a> profile the storm, while on the water, the NOAA research ship \u003ca href=\"http://www.moc.noaa.gov/rb/\" target=\"_blank\" rel=\"noopener\">Ron Brown\u003c/a> cruises the waves.\u003c/p>\n\u003cfigure id=\"attachment_368720\" class=\"wp-caption alignright\" style=\"max-width: 800px\">\u003ca href=\"http://ww2.kqed.org/science/wp-content/uploads/sites/35/2015/11/RS17504_Flight-debrief-qut.jpg\">\u003cimg loading=\"lazy\" decoding=\"async\" class=\"size-medium wp-image-368720\" src=\"http://ww2.kqed.org/science/wp-content/uploads/sites/35/2015/11/RS17504_Flight-debrief-qut-800x600.jpg\" alt=\"The Hurricane Hunter crew debriefs after a research flight.\" width=\"800\" height=\"600\" srcset=\"https://cdn.kqed.org/wp-content/uploads/sites/35/2015/11/RS17504_Flight-debrief-qut-800x600.jpg 800w, https://cdn.kqed.org/wp-content/uploads/sites/35/2015/11/RS17504_Flight-debrief-qut-400x300.jpg 400w, https://cdn.kqed.org/wp-content/uploads/sites/35/2015/11/RS17504_Flight-debrief-qut-1180x885.jpg 1180w, https://cdn.kqed.org/wp-content/uploads/sites/35/2015/11/RS17504_Flight-debrief-qut-960x720.jpg 960w, https://cdn.kqed.org/wp-content/uploads/sites/35/2015/11/RS17504_Flight-debrief-qut.jpg 1280w\" sizes=\"(max-width: 800px) 100vw, 800px\">\u003c/a>\u003cfigcaption class=\"wp-caption-text\">The NOAA Hurricane Hunters debrief after a research flight. \u003ccite>(Danielle Venton/KQED)\u003c/cite>\u003c/figcaption>\u003c/figure>\n\u003cp>As an interesting aside, the four-engine turboprop P-3 Orion aircraft were originally designed to fly over the ocean, hunting Soviet submarines. Today, NOAA operates two P-3s (charmingly named Kermit and Miss Piggy) as part of its storm studying operations. \u003c/p>\n\u003cp>Since last winter’s flights, the CalWater team has been busy crunching numbers in the lab, and the researchers are starting to release results. With just these flights, the researchers were able to triple the number of atmospheric rivers studied in detail.\u003c/p>\n\u003cp>Though CalWater is focused on understanding the West Coast, the improved models developed by the team could be useful around the globe. Atmospheric rivers are also responsible for some of the most extreme flooding events in Western Europe and South America.\u003c/p>\n\u003cp>In fact, one of the team’s most surprising findings so far is the estimate of just how much water these storms usually carry. On average, at any given moment, an atmospheric river is carrying 27 times the amount of water flowing down the Mississippi River. That’s roughly double the team’s previous best estimate.\u003c/p>\n\u003cp>\u003c/p>\n\u003cp>“It’s made us realize they’re even stronger than we thought,” Ralph says.\u003c/p>\n\n",
"stats": {
"hasVideo": false,
"hasChartOrMap": false,
"hasAudio": true,
"hasPolis": false,
"wordCount": 812,
"hasGoogleForm": false,
"hasGallery": false,
"hasHearkenModule": false,
"iframeSrcs": [],
"paragraphCount": 18
},
"modified": 1704931027,
"excerpt": "Scientists take to the air to find out more about atmospheric rivers, the rich plumes of Pacific moisture that feed California's winter storms. ",
"headData": {
"twImgId": "",
"twTitle": "",
"ogTitle": "",
"ogImgId": "",
"twDescription": "",
"description": "Scientists take to the air to find out more about atmospheric rivers, the rich plumes of Pacific moisture that feed California's winter storms. ",
"title": "Flying Into the Heart of the West's Biggest Storms | KQED",
"ogDescription": "",
"schema": {
"@context": "https://schema.org",
"@type": "Article",
"headline": "Flying Into the Heart of the West's Biggest Storms",
"datePublished": "2015-11-23T00:01:02-08:00",
"dateModified": "2024-01-10T15:57:07-08:00",
"image": "https://cdn.kqed.org/wp-content/uploads/2020/02/KQED-OG-Image@1x.png"
}
},
"guestAuthors": [],
"slug": "flying-into-the-heart-of-the-wests-biggest-storms",
"status": "publish",
"sticky": false,
"path": "/science/368478/flying-into-the-heart-of-the-wests-biggest-storms",
"audioUrl": "http://www.kqed.org/.stream/anon/radio//2015/11/AtmosphericRiver.mp3",
"audioDuration": null,
"audioTrackLength": null,
"parsedContent": [
{
"type": "contentString",
"content": "\u003cdiv class=\"post-body\">\u003cp>\u003cp>\u003cstrong>Listen to the story:\u003c/strong> \u003c/p>\u003c/p>\u003c/div>",
"attributes": {
"named": {},
"numeric": []
}
},
{
"type": "component",
"content": "",
"name": "audioLink",
"attributes": {
"named": {
"src": "http://www.kqed.org/.stream/anon/radio//2015/11/AtmosphericRiver.mp3"
},
"numeric": []
}
},
{
"type": "contentString",
"content": "\u003cdiv class=\"post-body\">\u003cp>\u003cp>It’s a noisy, rocky ride. I’m flying through the thick of a rainstorm on a research plane operated by the \u003ca href=\"http://www.noaa.gov/\" target=\"_blank\" rel=\"noopener\">National Oceanic and Atmospheric Administration\u003c/a>. It’s crewed by a group of pilots and technicians known as the NOAA “\u003ca href=\"http://flightscience.noaa.gov/\" target=\"_blank\" rel=\"noopener\">Hurricane Hunters\u003c/a>.” Their specialty is flying into the thick of storms, so they can relay data to weather forecasters.\u003c/p>\n\u003cp>On this flight last winter, though, we’re on a special mission. The flight is gathering data for an ambitious project known as \u003ca href=\"http://www.esrl.noaa.gov/psd/calwater/pdf/calwater-2pager-final.pdf\" target=\"_blank\" rel=\"noopener\">CalWater 2015\u003c/a>. The researchers’ ultimate goal is nothing less than to learn how the West Coast gets its water. Theirs is a story of rivers in the sky, motes of dust and sturdy aircraft.\u003c/p>\n\u003cfigure id=\"attachment_368722\" class=\"wp-caption aligncenter\" style=\"max-width: 1280px\">\u003ca href=\"http://ww2.kqed.org/science/wp-content/uploads/sites/35/2015/11/RS17505_2015-02-05-12-qut.jpg\">\u003cimg loading=\"lazy\" decoding=\"async\" class=\"size-full wp-image-368722\" src=\"http://ww2.kqed.org/science/wp-content/uploads/sites/35/2015/11/RS17505_2015-02-05-12-qut.jpg\" alt=\"This buoy will drop from the plane into the ocean to take temperature readings.\" width=\"1280\" height=\"960\" srcset=\"https://cdn.kqed.org/wp-content/uploads/sites/35/2015/11/RS17505_2015-02-05-12-qut.jpg 1280w, https://cdn.kqed.org/wp-content/uploads/sites/35/2015/11/RS17505_2015-02-05-12-qut-400x300.jpg 400w, https://cdn.kqed.org/wp-content/uploads/sites/35/2015/11/RS17505_2015-02-05-12-qut-800x600.jpg 800w, https://cdn.kqed.org/wp-content/uploads/sites/35/2015/11/RS17505_2015-02-05-12-qut-1180x885.jpg 1180w, https://cdn.kqed.org/wp-content/uploads/sites/35/2015/11/RS17505_2015-02-05-12-qut-960x720.jpg 960w\" sizes=\"(max-width: 1280px) 100vw, 1280px\">\u003c/a>\u003cfigcaption class=\"wp-caption-text\">This buoy will drop from the plane into the ocean to take temperature readings. \u003ccite>(Danielle Venton/KQED)\u003c/cite>\u003c/figcaption>\u003c/figure>\n\u003cp>Sitting near me, electronics technician Todd Richards is dropping buoys at regular intervals through a trap door in the cabin floor. The buoys take the temperature of the ocean from the time they hit the water’s surface to a depth of 130 feet.\u003c/p>\n\u003cp>\u003c/p>\u003c/div>",
"attributes": {
"named": {},
"numeric": []
}
},
{
"type": "component",
"content": "",
"name": "ad",
"attributes": {
"named": {
"label": "fullwidth"
},
"numeric": [
"fullwidth"
]
}
},
{
"type": "contentString",
"content": "\u003cdiv class=\"post-body\">\u003cp>\u003c/p>\n\u003cp>At the moment, researchers have a much better understanding of hurricanes—the most powerful, important storms of the East and South—than they do of the West’s most important storms, known as “atmospheric rivers.” These conveyor belts of moisture, which can be thousands of miles long, pelt the West Coast for days at a time and are responsible for up to half of total precipitation in California.\u003c/p>\n\u003cp>The problem is, our forecasting of these storms isn’t very good.\u003c/p>\n\u003cfigure id=\"attachment_368725\" class=\"wp-caption alignright\" style=\"max-width: 800px\">\u003ca href=\"http://ww2.kqed.org/science/wp-content/uploads/sites/35/2015/11/2015-02-05-12.46.15.jpg\">\u003cimg loading=\"lazy\" decoding=\"async\" class=\"size-medium wp-image-368725\" src=\"http://ww2.kqed.org/science/wp-content/uploads/sites/35/2015/11/2015-02-05-12.46.15-800x600.jpg\" alt=\"Research cubicles line the length of the plane, where scientists monitor variables like water vapor, wind direction and air pressure.\" width=\"800\" height=\"600\" srcset=\"https://cdn.kqed.org/wp-content/uploads/sites/35/2015/11/2015-02-05-12.46.15-800x600.jpg 800w, https://cdn.kqed.org/wp-content/uploads/sites/35/2015/11/2015-02-05-12.46.15-400x300.jpg 400w, https://cdn.kqed.org/wp-content/uploads/sites/35/2015/11/2015-02-05-12.46.15-1180x885.jpg 1180w, https://cdn.kqed.org/wp-content/uploads/sites/35/2015/11/2015-02-05-12.46.15-960x720.jpg 960w, https://cdn.kqed.org/wp-content/uploads/sites/35/2015/11/2015-02-05-12.46.15.jpg 1280w\" sizes=\"(max-width: 800px) 100vw, 800px\">\u003c/a>\u003cfigcaption class=\"wp-caption-text\">Research cubicles line the length of the plane, allowing scientists to monitor variables like water vapor, wind direction and air pressure. \u003ccite>(Danielle Venton/KQED)\u003c/cite>\u003c/figcaption>\u003c/figure>\n\u003cp>“It’s just a very hard thing to get right,” says \u003ca href=\"http://scrippsscholars.ucsd.edu/mralph\" target=\"_blank\" rel=\"noopener\">Marty Ralph\u003c/a>, a research meteorologist at the Scripps Institution of Oceanography and one of the CalWater scientists. “On average the heavy rainfall events are predicted to be about half as strong as they actually end up being.”\u003c/p>\n\u003cp>Most weather models, he says, leave out too many details; they don’t represent the clouds, the particles in the air, or how the air is moving. “They have to parameterize all that indirectly for the most part.”\u003c/p>\n\u003cp>This is where CalWater will help. By gathering data directly from these storms, by flying over, flying through and sailing under them, the collaboration is gathering the information they’ll need to create better weather models. In the future we’ll know more accurately, and with a longer lead time, where storms will make landfall, how much precipitation they’ll bring and how long they’ll last.\u003c/p>\n\u003cp>That’s all useful for emergency planners watching for flood risk, and water managers planning releases from reservoirs.\u003c/p>\n\u003cp>While many might balk at the thought of flying directly into a tempest, for this crew it is part of showing up for work. To stay safe, only the sturdiest planes, the four-engine turboprop \u003ca href=\"http://flightscience.noaa.gov/about_p3s.html\" target=\"_blank\" rel=\"noopener\">NOAA P-3s\u003c/a>, head for the core of the storm. Flying above, the NOAA \u003ca href=\"http://flightscience.noaa.gov/about_g4.html\" target=\"_blank\" rel=\"noopener\">Gulfstream IV-SP\u003c/a> and the \u003ca href=\"https://www.nasa.gov/centers/armstrong/aircraft/ER-2/\" target=\"_blank\" rel=\"noopener\">NASA ER-2\u003c/a> measure clouds, ozone and aerosols from on high. On the ground, a\u003ca href=\"http://hmt.noaa.gov/\" target=\"_blank\" rel=\"noopener\"> network of land-based sensors\u003c/a> profile the storm, while on the water, the NOAA research ship \u003ca href=\"http://www.moc.noaa.gov/rb/\" target=\"_blank\" rel=\"noopener\">Ron Brown\u003c/a> cruises the waves.\u003c/p>\n\u003cfigure id=\"attachment_368720\" class=\"wp-caption alignright\" style=\"max-width: 800px\">\u003ca href=\"http://ww2.kqed.org/science/wp-content/uploads/sites/35/2015/11/RS17504_Flight-debrief-qut.jpg\">\u003cimg loading=\"lazy\" decoding=\"async\" class=\"size-medium wp-image-368720\" src=\"http://ww2.kqed.org/science/wp-content/uploads/sites/35/2015/11/RS17504_Flight-debrief-qut-800x600.jpg\" alt=\"The Hurricane Hunter crew debriefs after a research flight.\" width=\"800\" height=\"600\" srcset=\"https://cdn.kqed.org/wp-content/uploads/sites/35/2015/11/RS17504_Flight-debrief-qut-800x600.jpg 800w, https://cdn.kqed.org/wp-content/uploads/sites/35/2015/11/RS17504_Flight-debrief-qut-400x300.jpg 400w, https://cdn.kqed.org/wp-content/uploads/sites/35/2015/11/RS17504_Flight-debrief-qut-1180x885.jpg 1180w, https://cdn.kqed.org/wp-content/uploads/sites/35/2015/11/RS17504_Flight-debrief-qut-960x720.jpg 960w, https://cdn.kqed.org/wp-content/uploads/sites/35/2015/11/RS17504_Flight-debrief-qut.jpg 1280w\" sizes=\"(max-width: 800px) 100vw, 800px\">\u003c/a>\u003cfigcaption class=\"wp-caption-text\">The NOAA Hurricane Hunters debrief after a research flight. \u003ccite>(Danielle Venton/KQED)\u003c/cite>\u003c/figcaption>\u003c/figure>\n\u003cp>As an interesting aside, the four-engine turboprop P-3 Orion aircraft were originally designed to fly over the ocean, hunting Soviet submarines. Today, NOAA operates two P-3s (charmingly named Kermit and Miss Piggy) as part of its storm studying operations. \u003c/p>\n\u003cp>Since last winter’s flights, the CalWater team has been busy crunching numbers in the lab, and the researchers are starting to release results. With just these flights, the researchers were able to triple the number of atmospheric rivers studied in detail.\u003c/p>\n\u003cp>Though CalWater is focused on understanding the West Coast, the improved models developed by the team could be useful around the globe. Atmospheric rivers are also responsible for some of the most extreme flooding events in Western Europe and South America.\u003c/p>\n\u003cp>In fact, one of the team’s most surprising findings so far is the estimate of just how much water these storms usually carry. On average, at any given moment, an atmospheric river is carrying 27 times the amount of water flowing down the Mississippi River. That’s roughly double the team’s previous best estimate.\u003c/p>\n\u003cp>\u003c/p>\n\u003cp>“It’s made us realize they’re even stronger than we thought,” Ralph says.\u003c/p>\n\n\u003c/div>\u003c/p>",
"attributes": {
"named": {},
"numeric": []
}
}
],
"link": "/science/368478/flying-into-the-heart-of-the-wests-biggest-storms",
"authors": [
"11088"
],
"series": [
"science_1151"
],
"categories": [
"science_46",
"science_31",
"science_35",
"science_40",
"science_43",
"science_98"
],
"tags": [
"science_2227",
"science_371"
],
"featImg": "science_368802",
"label": "science_1151"
},
"science_367043": {
"type": "posts",
"id": "science_367043",
"meta": {
"index": "posts_1716263798",
"site": "science",
"id": "367043",
"score": null,
"sort": [
1448048339000
]
},
"parent": 0,
"labelTerm": {},
"blocks": [],
"publishDate": 1448048339,
"format": "standard",
"title": "El Nino Forecast for California: Batten Down the Hatches",
"headTitle": "El Nino Forecast for California: Batten Down the Hatches | KQED",
"content": "\u003cp>Should we be worried that California has yet to experience an epic deluge so far this fall? What happened to the ostensible “parade of storms” that is so often talked about in the context of major El Niño events?\u003c/p>\n\u003cp>After four consecutive years characterized by a remarkable lack of storms in California at any time of year, it’s easy to forget that autumn is always capricious in California. Transitional seasons tend to be highly volatile throughout the Earth’s middle latitudes as polar and tropical air masses interact often. But California is unique in the sense that it lies near the southern margin of the Pacific jet stream, and is therefore quite susceptible to relatively subtle shifts in the storm track. California can experience major storminess during September-November with temporary shifts in the jet, but in general sustained wet periods are the exception rather than the rule.\u003c/p>\n\u003cp>\u003cstrong>El Niño: The Rain Connection\u003c/strong>\u003c/p>\n\u003cp>Since the eastward-flowing jet stream is fundamentally driven by the large temperature differences that exist between the warm equatorial region and cold polar region, its location, strength, and trajectory depend on the orientation and magnitude of temperature variations across the Earth’s surface.\u003c/p>\n\u003cfigure id=\"attachment_368395\" class=\"wp-caption aligncenter\" style=\"max-width: 800px\">\u003ca href=\"http://ww2.kqed.org/science/wp-content/uploads/sites/35/2015/11/fig1.jpg\">\u003cimg loading=\"lazy\" decoding=\"async\" class=\"size-medium wp-image-368395\" src=\"http://ww2.kqed.org/science/wp-content/uploads/sites/35/2015/11/fig1-800x393.jpg\" alt=\"Tropical Pacific warming during El Niño increases the north-south temperature differential, strengthening/shifting the jet stream southward and bringing increased California winter precipitation. \" width=\"800\" height=\"393\" srcset=\"https://cdn.kqed.org/wp-content/uploads/sites/35/2015/11/fig1-800x393.jpg 800w, https://cdn.kqed.org/wp-content/uploads/sites/35/2015/11/fig1-400x196.jpg 400w, https://cdn.kqed.org/wp-content/uploads/sites/35/2015/11/fig1-1440x707.jpg 1440w, https://cdn.kqed.org/wp-content/uploads/sites/35/2015/11/fig1-1920x943.jpg 1920w, https://cdn.kqed.org/wp-content/uploads/sites/35/2015/11/fig1-1180x579.jpg 1180w, https://cdn.kqed.org/wp-content/uploads/sites/35/2015/11/fig1-960x471.jpg 960w\" sizes=\"(max-width: 800px) 100vw, 800px\">\u003c/a>\u003cfigcaption class=\"wp-caption-text\">Tropical Pacific warming during El Niño increases the north-south temperature differential, strengthening/shifting the jet stream southward and bringing increased California winter precipitation. \u003ccite>(Emily Underwood)\u003c/cite>\u003c/figcaption>\u003c/figure>\n\u003cp>With the approach of winter, temperatures begin to cool and the region of maximum north-south temperature differential over the Pacific Ocean starts to shift southward. The net result: the jet stream’s typical latitude from December through March tends to be farther south — and closer to California — than during the autumn.\u003c/p>\n\u003cp>[ad fullwidth]\u003c/p>\n\u003cp>The primary means by which El Niño affects California precipitation is by enhancing the low-latitude (subtropical) branch of the jet stream. The subtropical jet stream isn’t always a totally distinct feature in the weather charts; it tends to be weaker and more discontinuous than its more robust northern cousin (the subpolar jet). But during major El Niño years, the subtropical jet over the northern Pacific Ocean tends to be stronger, better defined, and further to the south than it usual.\u003c/p>\n\u003cp>\u003cstrong>El Niño Now Appears Strongest in the Modern Record\u003c/strong>\u003c/p>\n\u003cp>Earlier this week ocean surface temperatures in the closely-watched Niño 3.4 region reached 3 degrees (Celsius) above average for the first time in recorded history. This weekly value exceeds the maximum weekly value recorded even during the so-called “super El Niño” events of 1982-1983 and 1997-1998.\u003c/p>\n\u003cp>While El Niño impacts do not correlate directly with the magnitude of SST anomalies in any particular section of ocean (and we’re still a ways off from an all-time record 3-monthly peak), this is still a major geophysical milestone — and one that has significant implications for the coming winter in California.\u003c/p>\n\u003cfigure id=\"attachment_368394\" class=\"wp-caption aligncenter\" style=\"max-width: 1024px\">\u003ca href=\"http://ww2.kqed.org/science/wp-content/uploads/sites/35/2015/11/anim2.gif\">\u003cimg loading=\"lazy\" decoding=\"async\" class=\"size-full wp-image-368394\" src=\"http://ww2.kqed.org/science/wp-content/uploads/sites/35/2015/11/anim2.gif\" alt=\"Animation of seasonal precipitation forecast by CFS. All of California is likely to be very wet during December-March. \" width=\"1024\" height=\"719\">\u003c/a>\u003cfigcaption class=\"wp-caption-text\">Animation of seasonal precipitation forecast by CFS. All of California is likely to be very wet during December-March. \u003ccite>(NCEP via \u003ca href=\"http://www.tropicaltidbits.com/\">Tropical Tidbits\u003c/a>)\u003c/cite>\u003c/figcaption>\u003c/figure>\n\u003cp>\u003cstrong>Outlook for California Winter 2015-2016\u003c/strong>\u003c/p>\n\u003cp>So, with that in mind, how does the upcoming winter look?\u003c/p>\n\u003cp>In a word: wet. The latest dynamical model forecasts are calling for well above average precipitation throughout California during the January-March period, and the recent forecasts from the more frequently updated CFS model have shifted toward a wet December as well. These same models are suggesting a large-scale atmospheric pressure pattern that is strikingly similar to that which occurred during California’s wettest historical winters (including the 1982-1983 and 1997-1998 El Niño events).\u003c/p>\n\u003cp>Heavy seasonal precipitation totals don’t always mean major flooding if there are substantial breaks between incoming storms. In fact, some of California’s most widespread and most damaging individual flood events did not occur during El Niño years. But in general, high seasonal totals mean that heavy storms are more likely to coincide with already wet/saturated soil conditions, and El Niño-induced increases in storm frequency make it more likely for several intense events to occur in rapid succession. Thus, flood (and mudslide) risk will likely be much greater this winter, and certainly will be higher than has been seen in the past five years.\u003c/p>\n\u003cp>This year, though, another major shift is afoot in the Pacific. The eastern tropical part of the ocean basin is extremely warm due to El Niño, but oceanic warmth farther to the north has been even more pronounced in recent months. The unusually super-warm North Pacific has the potential to add extra moisture to the atmosphere this winter. While this more generalized warming is unlikely to affect the frequency of storms, it may well act to add “extra juice” to incoming systems this winter. When we consider this effect in combination with the likely increase in storm frequency due to El Niño, it’s clear the potential exists for a very active winter overall.\u003c/p>\n\u003cfigure id=\"attachment_368393\" class=\"wp-caption aligncenter\" style=\"max-width: 1174px\">\u003ca href=\"http://ww2.kqed.org/science/wp-content/uploads/sites/35/2015/11/fig3.gif\">\u003cimg loading=\"lazy\" decoding=\"async\" class=\"size-full wp-image-368393\" src=\"http://ww2.kqed.org/science/wp-content/uploads/sites/35/2015/11/fig3.gif\" alt=\"One heckuva lot of warm water. \" width=\"1174\" height=\"640\">\u003c/a>\u003cfigcaption class=\"wp-caption-text\">One heckuva lot of warm water. \u003ccite>(NOAA Coral Reef Watch)\u003c/cite>\u003c/figcaption>\u003c/figure>\n\u003cp>\u003cstrong>Add a Warming Climate to the Mix\u003cbr>\n\u003c/strong>\u003c/p>\n\u003cp>Finally, it’s important to point out that the planet has experienced nearly 20 years’ worth of global warming since the last big El Niño event in 1997-1998, and nearly 35 years’ worth of warming since the 1982-1983 event before it. In general, this means that there’s more moisture over the world’s major ocean basins than there used to be — which can increase the potential intensity of precipitation when it does occur. But other more complex changes have occurred in the coupled ocean-ice-atmosphere system over the past four decades that are harder to quantify, and may have less obvious (and less predictable) impacts on overall Pacific climate. These influences could muddle the overall impact of El Niño in California in the future.\u003c/p>\n\u003cp>Despite these added uncertainties, however, it appears quite likely that the present El Niño will exert a powerful (and likely dominant) influence upon California weather this coming winter. Yet—as California’s state government and water agencies have gone to great lengths to emphasize—even a very wet winter in California is unlikely to completely erase the profound effects of California’s multi-year drought. In many ways, the present situation resembles a conundrum that the Golden State is likely to face more often in the future: how to manage a greatly increased risk of extreme precipitation and flooding despite the presence of long-term water deficits.\u003c/p>\n\u003cp>\u003cem>Daniel Swain is a climate scientist at Stanford University. A longer version of this post appears on the \u003ca href=\"http://www.weatherwest.com/\">California Weather Blog\u003c/a>, where you’ll find all of his previous posts. Artist and naturalist \u003ca href=\"http://underwoodillustration.com/home.html\">Emily Underwood\u003c/a> distilled several complex geophysical concepts into the scientific illustration for this post.\u003c/em>\u003c/p>\n\u003cp>[ad floatright]\u003c/p>\n\u003cp> \u003c/p>\n\n",
"stats": {
"hasVideo": false,
"hasChartOrMap": false,
"hasAudio": false,
"hasPolis": false,
"wordCount": 1179,
"hasGoogleForm": false,
"hasGallery": false,
"hasHearkenModule": false,
"iframeSrcs": [],
"paragraphCount": 20
},
"modified": 1704931029,
"excerpt": "One of the strongest El Niño events on record will very likely bring a wetter-than-usual winter to California, along with substantial risks of heavy precipitation and flooding.",
"headData": {
"twImgId": "",
"twTitle": "",
"ogTitle": "",
"ogImgId": "",
"twDescription": "",
"description": "One of the strongest El Niño events on record will very likely bring a wetter-than-usual winter to California, along with substantial risks of heavy precipitation and flooding.",
"title": "El Nino Forecast for California: Batten Down the Hatches | KQED",
"ogDescription": "",
"schema": {
"@context": "https://schema.org",
"@type": "Article",
"headline": "El Nino Forecast for California: Batten Down the Hatches",
"datePublished": "2015-11-20T11:38:59-08:00",
"dateModified": "2024-01-10T15:57:09-08:00",
"image": "https://cdn.kqed.org/wp-content/uploads/2020/02/KQED-OG-Image@1x.png"
}
},
"guestAuthors": [],
"slug": "el-nino-forecast-for-california-batten-down-the-hatches",
"status": "publish",
"sourceUrl": "https://ww2.kqed.org/science/",
"nprByline": "\u003cstrong>\u003ca href=\"https://earth.stanford.edu/daniel-swain\">Daniel Swain\u003c/a>, Stanford University\u003c/strong>",
"sticky": false,
"source": "KQED Science",
"path": "/science/367043/el-nino-forecast-for-california-batten-down-the-hatches",
"audioTrackLength": null,
"parsedContent": [
{
"type": "contentString",
"content": "\u003cdiv class=\"post-body\">\u003cp>\u003cp>Should we be worried that California has yet to experience an epic deluge so far this fall? What happened to the ostensible “parade of storms” that is so often talked about in the context of major El Niño events?\u003c/p>\n\u003cp>After four consecutive years characterized by a remarkable lack of storms in California at any time of year, it’s easy to forget that autumn is always capricious in California. Transitional seasons tend to be highly volatile throughout the Earth’s middle latitudes as polar and tropical air masses interact often. But California is unique in the sense that it lies near the southern margin of the Pacific jet stream, and is therefore quite susceptible to relatively subtle shifts in the storm track. California can experience major storminess during September-November with temporary shifts in the jet, but in general sustained wet periods are the exception rather than the rule.\u003c/p>\n\u003cp>\u003cstrong>El Niño: The Rain Connection\u003c/strong>\u003c/p>\n\u003cp>Since the eastward-flowing jet stream is fundamentally driven by the large temperature differences that exist between the warm equatorial region and cold polar region, its location, strength, and trajectory depend on the orientation and magnitude of temperature variations across the Earth’s surface.\u003c/p>\n\u003cfigure id=\"attachment_368395\" class=\"wp-caption aligncenter\" style=\"max-width: 800px\">\u003ca href=\"http://ww2.kqed.org/science/wp-content/uploads/sites/35/2015/11/fig1.jpg\">\u003cimg loading=\"lazy\" decoding=\"async\" class=\"size-medium wp-image-368395\" src=\"http://ww2.kqed.org/science/wp-content/uploads/sites/35/2015/11/fig1-800x393.jpg\" alt=\"Tropical Pacific warming during El Niño increases the north-south temperature differential, strengthening/shifting the jet stream southward and bringing increased California winter precipitation. \" width=\"800\" height=\"393\" srcset=\"https://cdn.kqed.org/wp-content/uploads/sites/35/2015/11/fig1-800x393.jpg 800w, https://cdn.kqed.org/wp-content/uploads/sites/35/2015/11/fig1-400x196.jpg 400w, https://cdn.kqed.org/wp-content/uploads/sites/35/2015/11/fig1-1440x707.jpg 1440w, https://cdn.kqed.org/wp-content/uploads/sites/35/2015/11/fig1-1920x943.jpg 1920w, https://cdn.kqed.org/wp-content/uploads/sites/35/2015/11/fig1-1180x579.jpg 1180w, https://cdn.kqed.org/wp-content/uploads/sites/35/2015/11/fig1-960x471.jpg 960w\" sizes=\"(max-width: 800px) 100vw, 800px\">\u003c/a>\u003cfigcaption class=\"wp-caption-text\">Tropical Pacific warming during El Niño increases the north-south temperature differential, strengthening/shifting the jet stream southward and bringing increased California winter precipitation. \u003ccite>(Emily Underwood)\u003c/cite>\u003c/figcaption>\u003c/figure>\n\u003cp>With the approach of winter, temperatures begin to cool and the region of maximum north-south temperature differential over the Pacific Ocean starts to shift southward. The net result: the jet stream’s typical latitude from December through March tends to be farther south — and closer to California — than during the autumn.\u003c/p>\n\u003cp>\u003c/p>\u003c/div>",
"attributes": {
"named": {},
"numeric": []
}
},
{
"type": "component",
"content": "",
"name": "ad",
"attributes": {
"named": {
"label": "fullwidth"
},
"numeric": [
"fullwidth"
]
}
},
{
"type": "contentString",
"content": "\u003cdiv class=\"post-body\">\u003cp>\u003c/p>\n\u003cp>The primary means by which El Niño affects California precipitation is by enhancing the low-latitude (subtropical) branch of the jet stream. The subtropical jet stream isn’t always a totally distinct feature in the weather charts; it tends to be weaker and more discontinuous than its more robust northern cousin (the subpolar jet). But during major El Niño years, the subtropical jet over the northern Pacific Ocean tends to be stronger, better defined, and further to the south than it usual.\u003c/p>\n\u003cp>\u003cstrong>El Niño Now Appears Strongest in the Modern Record\u003c/strong>\u003c/p>\n\u003cp>Earlier this week ocean surface temperatures in the closely-watched Niño 3.4 region reached 3 degrees (Celsius) above average for the first time in recorded history. This weekly value exceeds the maximum weekly value recorded even during the so-called “super El Niño” events of 1982-1983 and 1997-1998.\u003c/p>\n\u003cp>While El Niño impacts do not correlate directly with the magnitude of SST anomalies in any particular section of ocean (and we’re still a ways off from an all-time record 3-monthly peak), this is still a major geophysical milestone — and one that has significant implications for the coming winter in California.\u003c/p>\n\u003cfigure id=\"attachment_368394\" class=\"wp-caption aligncenter\" style=\"max-width: 1024px\">\u003ca href=\"http://ww2.kqed.org/science/wp-content/uploads/sites/35/2015/11/anim2.gif\">\u003cimg loading=\"lazy\" decoding=\"async\" class=\"size-full wp-image-368394\" src=\"http://ww2.kqed.org/science/wp-content/uploads/sites/35/2015/11/anim2.gif\" alt=\"Animation of seasonal precipitation forecast by CFS. All of California is likely to be very wet during December-March. \" width=\"1024\" height=\"719\">\u003c/a>\u003cfigcaption class=\"wp-caption-text\">Animation of seasonal precipitation forecast by CFS. All of California is likely to be very wet during December-March. \u003ccite>(NCEP via \u003ca href=\"http://www.tropicaltidbits.com/\">Tropical Tidbits\u003c/a>)\u003c/cite>\u003c/figcaption>\u003c/figure>\n\u003cp>\u003cstrong>Outlook for California Winter 2015-2016\u003c/strong>\u003c/p>\n\u003cp>So, with that in mind, how does the upcoming winter look?\u003c/p>\n\u003cp>In a word: wet. The latest dynamical model forecasts are calling for well above average precipitation throughout California during the January-March period, and the recent forecasts from the more frequently updated CFS model have shifted toward a wet December as well. These same models are suggesting a large-scale atmospheric pressure pattern that is strikingly similar to that which occurred during California’s wettest historical winters (including the 1982-1983 and 1997-1998 El Niño events).\u003c/p>\n\u003cp>Heavy seasonal precipitation totals don’t always mean major flooding if there are substantial breaks between incoming storms. In fact, some of California’s most widespread and most damaging individual flood events did not occur during El Niño years. But in general, high seasonal totals mean that heavy storms are more likely to coincide with already wet/saturated soil conditions, and El Niño-induced increases in storm frequency make it more likely for several intense events to occur in rapid succession. Thus, flood (and mudslide) risk will likely be much greater this winter, and certainly will be higher than has been seen in the past five years.\u003c/p>\n\u003cp>This year, though, another major shift is afoot in the Pacific. The eastern tropical part of the ocean basin is extremely warm due to El Niño, but oceanic warmth farther to the north has been even more pronounced in recent months. The unusually super-warm North Pacific has the potential to add extra moisture to the atmosphere this winter. While this more generalized warming is unlikely to affect the frequency of storms, it may well act to add “extra juice” to incoming systems this winter. When we consider this effect in combination with the likely increase in storm frequency due to El Niño, it’s clear the potential exists for a very active winter overall.\u003c/p>\n\u003cfigure id=\"attachment_368393\" class=\"wp-caption aligncenter\" style=\"max-width: 1174px\">\u003ca href=\"http://ww2.kqed.org/science/wp-content/uploads/sites/35/2015/11/fig3.gif\">\u003cimg loading=\"lazy\" decoding=\"async\" class=\"size-full wp-image-368393\" src=\"http://ww2.kqed.org/science/wp-content/uploads/sites/35/2015/11/fig3.gif\" alt=\"One heckuva lot of warm water. \" width=\"1174\" height=\"640\">\u003c/a>\u003cfigcaption class=\"wp-caption-text\">One heckuva lot of warm water. \u003ccite>(NOAA Coral Reef Watch)\u003c/cite>\u003c/figcaption>\u003c/figure>\n\u003cp>\u003cstrong>Add a Warming Climate to the Mix\u003cbr>\n\u003c/strong>\u003c/p>\n\u003cp>Finally, it’s important to point out that the planet has experienced nearly 20 years’ worth of global warming since the last big El Niño event in 1997-1998, and nearly 35 years’ worth of warming since the 1982-1983 event before it. In general, this means that there’s more moisture over the world’s major ocean basins than there used to be — which can increase the potential intensity of precipitation when it does occur. But other more complex changes have occurred in the coupled ocean-ice-atmosphere system over the past four decades that are harder to quantify, and may have less obvious (and less predictable) impacts on overall Pacific climate. These influences could muddle the overall impact of El Niño in California in the future.\u003c/p>\n\u003cp>Despite these added uncertainties, however, it appears quite likely that the present El Niño will exert a powerful (and likely dominant) influence upon California weather this coming winter. Yet—as California’s state government and water agencies have gone to great lengths to emphasize—even a very wet winter in California is unlikely to completely erase the profound effects of California’s multi-year drought. In many ways, the present situation resembles a conundrum that the Golden State is likely to face more often in the future: how to manage a greatly increased risk of extreme precipitation and flooding despite the presence of long-term water deficits.\u003c/p>\n\u003cp>\u003cem>Daniel Swain is a climate scientist at Stanford University. A longer version of this post appears on the \u003ca href=\"http://www.weatherwest.com/\">California Weather Blog\u003c/a>, where you’ll find all of his previous posts. Artist and naturalist \u003ca href=\"http://underwoodillustration.com/home.html\">Emily Underwood\u003c/a> distilled several complex geophysical concepts into the scientific illustration for this post.\u003c/em>\u003c/p>\n\u003cp>\u003c/p>\u003c/div>",
"attributes": {
"named": {},
"numeric": []
}
},
{
"type": "component",
"content": "",
"name": "ad",
"attributes": {
"named": {
"label": "floatright"
},
"numeric": [
"floatright"
]
}
},
{
"type": "contentString",
"content": "\u003cdiv class=\"post-body\">\u003cp>\u003c/p>\n\u003cp> \u003c/p>\n\n\u003c/div>\u003c/p>",
"attributes": {
"named": {},
"numeric": []
}
}
],
"link": "/science/367043/el-nino-forecast-for-california-batten-down-the-hatches",
"authors": [
"byline_science_367043"
],
"series": [
"science_1151",
"science_2807"
],
"categories": [
"science_31",
"science_40",
"science_98"
],
"tags": [
"science_371"
],
"featImg": "science_373699",
"label": "source_science_367043"
},
"science_317772": {
"type": "posts",
"id": "science_317772",
"meta": {
"index": "posts_1716263798",
"site": "science",
"id": "317772",
"score": null,
"sort": [
1445518819000
]
},
"parent": 0,
"labelTerm": {
"site": "science"
},
"blocks": [],
"publishDate": 1445518819,
"format": "standard",
"title": "Strong El Niño May Bring Extreme Weather Events",
"headTitle": "Strong El Niño May Bring Extreme Weather Events | KQED",
"content": "\u003cp>Last week’s \u003ca href=\"http://www.latimes.com/local/lanow/la-me-ln-rain-mudslides-los-angeles-20151015-story.html\">devastating mudslides\u003c/a> in Southern California may foreshadow the kind of winter we’re in for this year, with a very strong El Niño warming the Pacific Ocean.\u003c/p>\n\u003cp>The last severe El Niño winter in 1997-’98 produced some 18,000 landslides in the Bay Area. Maps and computer models made then are paying dividends today as emergency planners use them to forecast what a similar winter in the next few months could do.\u003c/p>\n\u003cp>Already trees are being trimmed, streambeds cleared and stormwater drains cleaned out in response to the threat of rare, extreme rainfall.\u003c/p>\n\u003cp>\u003cstrong>Strong Rains Mean Geologic Dangers\u003c/strong>\u003c/p>\n\u003cp>Before the last strong El Niño, the U.S. Geological Survey in Menlo Park studied how it might affect the Bay Area. The resulting \u003ca href=\"http://pubs.usgs.gov/of/1997/of97-745/\">San Francisco Bay Region Landslide Folio\u003c/a> of 1997 was used by emergency planners that stormy winter as they managed thousands of landslides.\u003c/p>\n\u003cp>[ad fullwidth]\u003c/p>\n\u003cp>That hard-won knowledge will serve us again this winter, \u003ca href=\"http://www.noaanews.noaa.gov/stories2015/101515-noaa-strong-el-nino-sets-the-stage-for-2015-2016-winter-weather.html\">which promises to be a wet one\u003c/a>.\u003c/p>\n\u003cfigure id=\"attachment_318396\" class=\"wp-caption alignright\" style=\"max-width: 540px\">\u003ca href=\"http://ww2.kqed.org/science/wp-content/uploads/sites/35/2015/10/7943567466_5c7fe16e6a_k.jpg\">\u003cimg loading=\"lazy\" decoding=\"async\" class=\" wp-image-318396\" src=\"http://ww2.kqed.org/science/wp-content/uploads/sites/35/2015/10/7943567466_5c7fe16e6a_k-800x532.jpg\" alt=\"Torrential rains from El Niño created mudslides that destroyed homes along the Southern California coast on January 23, 1995. \" width=\"540\" height=\"359\" srcset=\"https://cdn.kqed.org/wp-content/uploads/sites/35/2015/10/7943567466_5c7fe16e6a_k-800x532.jpg 800w, https://cdn.kqed.org/wp-content/uploads/sites/35/2015/10/7943567466_5c7fe16e6a_k-400x266.jpg 400w, https://cdn.kqed.org/wp-content/uploads/sites/35/2015/10/7943567466_5c7fe16e6a_k-1440x957.jpg 1440w, https://cdn.kqed.org/wp-content/uploads/sites/35/2015/10/7943567466_5c7fe16e6a_k-1920x1276.jpg 1920w, https://cdn.kqed.org/wp-content/uploads/sites/35/2015/10/7943567466_5c7fe16e6a_k-1180x784.jpg 1180w, https://cdn.kqed.org/wp-content/uploads/sites/35/2015/10/7943567466_5c7fe16e6a_k-960x638.jpg 960w, https://cdn.kqed.org/wp-content/uploads/sites/35/2015/10/7943567466_5c7fe16e6a_k.jpg 2048w\" sizes=\"(max-width: 540px) 100vw, 540px\">\u003c/a>\u003cfigcaption class=\"wp-caption-text\">Torrential rains from El Niño created mudslides that destroyed homes along the Southern California coast on January 23, 1995. \u003ccite>(Bob Nichols/USDA)\u003c/cite>\u003c/figcaption>\u003c/figure>\n\u003cp>In the Bay Area, great rainstorms make geological trouble in two ways. First, they wash loose dirt and rocks downhill and create mudflows.\u003c/p>\n\u003cp>Second, after weeks of heavy rain the ground becomes saturated until \u003ca href=\"http://ww2.kqed.org/quest/2011/03/31/landslide-season/\">whole hillsides give way in landslides\u003c/a>. When geologists inspected the hillsides above Southern California highways last week and said they were okay, this kind of slope failure is what they were checking for.\u003c/p>\n\u003cp>Together, these land movements move large amounts of rock and soil downhill toward the stream valleys, where the floodwaters can take over and wash it away.\u003c/p>\n\u003cp>This year’s El Niño is one of the strongest on record, and NOAA scientists say the Bay Area is likely to get more rain than normal this winter. Add to that the odds of an \u003ca href=\"http://ww2.kqed.org/quest/2012/11/01/watching-the-atmospheric-rivers-flow/\">atmospheric river event\u003c/a>, and we might see some 1,000-year events this winter in individual watersheds.\u003c/p>\n\u003cp>\u003cstrong>What Is a 1,000-Year Event?\u003c/strong>\u003c/p>\n\u003cp>Weather scientists are calling the epic rainfall events that hit Los Angeles last week, and \u003ca href=\"http://water.usgs.gov/floods/events/2015/Joaquin/HolmesQA.html\">flooded South Carolina\u003c/a> earlier this month, “1,000-year events.”\u003c/p>\n\u003cp>The term “1,000-year event” is often misunderstood. Scientists understand it as shorthand for an event with a 1-in-1,000 chance of happening in any given year. So it’s a statement about odds, not a length of time.\u003c/p>\n\u003caside class=\"pullquote alignleft\">‘The 1,000-year probability assumes the future will be like the past. That assumption is no longer true.’\u003c/aside>\n\u003cp>Think of a gambling game with a set of three 10-sided dice. A “1,000-year event” is the same as the odds of rolling a triple-10 — you’d never expect one but you know it could always happen, even twice in a row.\u003c/p>\n\u003cp>The event might be limited to a specific locality or a span of time, such as a 1-hour or 24-hour rainfall total. Last week in Southern California, 3.38 inches of rain fell on a rain gauge in Leona Valley within the span of an hour. The National Weather Service called it a 1,000-year event, one that was limited to one rain gauge and one hour.\u003c/p>\n\u003cp>And yet a 1,000-year event, large or small, is momentous and historic. Geologists are interested in these events because that’s when streams and rivers turn into the Incredible Hulk and do some of their most important work. That’s when geology comes to life.\u003c/p>\n\u003cp>Large flows of dense, mud-charged stormwater can bulldoze anything in their path. They can burst dams. It is 1,000-year floods that dig out and renew riverbeds after many years of silting up. Over a million years of geologic time, it’s a thousand 1,000-year events — not ordinary rains — that sculpt our landscape into its basic shape.\u003c/p>\n\u003cp>If your local streambed \u003ca href=\"https://oaklandgeology.wordpress.com/2015/10/19/two-lessons-about-floods/\">has supersize boulders in it\u003c/a>, 1,000-year events wake them up for a rare roll downstream. If you can listen beneath the roar of the river, you might hear the \u003ca href=\"http://ww2.kqed.org/quest/2013/02/07/geological-sounds/\">geological sound\u003c/a> they make as they tumble underneath the water like giant marbles.\u003c/p>\n\u003cp>\u003cstrong>The Odds Are High\u003c/strong>\u003c/p>\n\u003cp>Nothing makes 1,000-year events a sure thing. But the historically strong El Niño and the ever-present threat of a “Pineapple Express” atmospheric river event will make them much more likely this winter.\u003c/p>\n\u003cp>If an earthquake happens to add significant ground shaking to those things, the effects may truly be biblical. Earthquakes not only produce \u003ca href=\"http://ww2.kqed.org/quest/2012/11/08/earthquake-landslides-a-widespread-hazard/\">widespread landslides\u003c/a> on their own, but also \u003ca href=\"https://oaklandgeology.wordpress.com/2014/09/08/after-oaklands-big-one-expect-a-rush-of-water/\">shake groundwater out of the hills into streams\u003c/a> for weeks afterward.\u003c/p>\n\u003cp>Finally, we have the the complex effects of global warming. The “1,000-year” probability assumes things don’t change, and the future will be like the past. That assumption is no longer true — the future will be warmer and probably more unstable than the past. Climate change is slowly loading those 10-sided dice.\u003c/p>\n\u003cp>\u003c/p>\n\u003cp>In brief, keep your eyes and ears open this coming winter. The authorities will have up-to-the-minute advice as the El Niño storms loom and the rain falls.\u003c/p>\n\n",
"stats": {
"hasVideo": false,
"hasChartOrMap": false,
"hasAudio": false,
"hasPolis": false,
"wordCount": 904,
"hasGoogleForm": false,
"hasGallery": false,
"hasHearkenModule": false,
"iframeSrcs": [],
"paragraphCount": 25
},
"modified": 1704931155,
"excerpt": "The strong El Niño this winter may create extreme events that flood our streams and rivers.",
"headData": {
"twImgId": "",
"twTitle": "",
"ogTitle": "",
"ogImgId": "",
"twDescription": "",
"description": "The strong El Niño this winter may create extreme events that flood our streams and rivers.",
"title": "Strong El Niño May Bring Extreme Weather Events | KQED",
"ogDescription": "",
"schema": {
"@context": "https://schema.org",
"@type": "Article",
"headline": "Strong El Niño May Bring Extreme Weather Events",
"datePublished": "2015-10-22T06:00:19-07:00",
"dateModified": "2024-01-10T15:59:15-08:00",
"image": "https://cdn.kqed.org/wp-content/uploads/2020/02/KQED-OG-Image@1x.png"
}
},
"guestAuthors": [],
"slug": "strong-el-nino-may-bring-extreme-weather-events",
"status": "publish",
"sticky": false,
"path": "/science/317772/strong-el-nino-may-bring-extreme-weather-events",
"audioTrackLength": null,
"parsedContent": [
{
"type": "contentString",
"content": "\u003cdiv class=\"post-body\">\u003cp>\u003cp>Last week’s \u003ca href=\"http://www.latimes.com/local/lanow/la-me-ln-rain-mudslides-los-angeles-20151015-story.html\">devastating mudslides\u003c/a> in Southern California may foreshadow the kind of winter we’re in for this year, with a very strong El Niño warming the Pacific Ocean.\u003c/p>\n\u003cp>The last severe El Niño winter in 1997-’98 produced some 18,000 landslides in the Bay Area. Maps and computer models made then are paying dividends today as emergency planners use them to forecast what a similar winter in the next few months could do.\u003c/p>\n\u003cp>Already trees are being trimmed, streambeds cleared and stormwater drains cleaned out in response to the threat of rare, extreme rainfall.\u003c/p>\n\u003cp>\u003cstrong>Strong Rains Mean Geologic Dangers\u003c/strong>\u003c/p>\n\u003cp>Before the last strong El Niño, the U.S. Geological Survey in Menlo Park studied how it might affect the Bay Area. The resulting \u003ca href=\"http://pubs.usgs.gov/of/1997/of97-745/\">San Francisco Bay Region Landslide Folio\u003c/a> of 1997 was used by emergency planners that stormy winter as they managed thousands of landslides.\u003c/p>\n\u003cp>\u003c/p>\u003c/div>",
"attributes": {
"named": {},
"numeric": []
}
},
{
"type": "component",
"content": "",
"name": "ad",
"attributes": {
"named": {
"label": "fullwidth"
},
"numeric": [
"fullwidth"
]
}
},
{
"type": "contentString",
"content": "\u003cdiv class=\"post-body\">\u003cp>\u003c/p>\n\u003cp>That hard-won knowledge will serve us again this winter, \u003ca href=\"http://www.noaanews.noaa.gov/stories2015/101515-noaa-strong-el-nino-sets-the-stage-for-2015-2016-winter-weather.html\">which promises to be a wet one\u003c/a>.\u003c/p>\n\u003cfigure id=\"attachment_318396\" class=\"wp-caption alignright\" style=\"max-width: 540px\">\u003ca href=\"http://ww2.kqed.org/science/wp-content/uploads/sites/35/2015/10/7943567466_5c7fe16e6a_k.jpg\">\u003cimg loading=\"lazy\" decoding=\"async\" class=\" wp-image-318396\" src=\"http://ww2.kqed.org/science/wp-content/uploads/sites/35/2015/10/7943567466_5c7fe16e6a_k-800x532.jpg\" alt=\"Torrential rains from El Niño created mudslides that destroyed homes along the Southern California coast on January 23, 1995. \" width=\"540\" height=\"359\" srcset=\"https://cdn.kqed.org/wp-content/uploads/sites/35/2015/10/7943567466_5c7fe16e6a_k-800x532.jpg 800w, https://cdn.kqed.org/wp-content/uploads/sites/35/2015/10/7943567466_5c7fe16e6a_k-400x266.jpg 400w, https://cdn.kqed.org/wp-content/uploads/sites/35/2015/10/7943567466_5c7fe16e6a_k-1440x957.jpg 1440w, https://cdn.kqed.org/wp-content/uploads/sites/35/2015/10/7943567466_5c7fe16e6a_k-1920x1276.jpg 1920w, https://cdn.kqed.org/wp-content/uploads/sites/35/2015/10/7943567466_5c7fe16e6a_k-1180x784.jpg 1180w, https://cdn.kqed.org/wp-content/uploads/sites/35/2015/10/7943567466_5c7fe16e6a_k-960x638.jpg 960w, https://cdn.kqed.org/wp-content/uploads/sites/35/2015/10/7943567466_5c7fe16e6a_k.jpg 2048w\" sizes=\"(max-width: 540px) 100vw, 540px\">\u003c/a>\u003cfigcaption class=\"wp-caption-text\">Torrential rains from El Niño created mudslides that destroyed homes along the Southern California coast on January 23, 1995. \u003ccite>(Bob Nichols/USDA)\u003c/cite>\u003c/figcaption>\u003c/figure>\n\u003cp>In the Bay Area, great rainstorms make geological trouble in two ways. First, they wash loose dirt and rocks downhill and create mudflows.\u003c/p>\n\u003cp>Second, after weeks of heavy rain the ground becomes saturated until \u003ca href=\"http://ww2.kqed.org/quest/2011/03/31/landslide-season/\">whole hillsides give way in landslides\u003c/a>. When geologists inspected the hillsides above Southern California highways last week and said they were okay, this kind of slope failure is what they were checking for.\u003c/p>\n\u003cp>Together, these land movements move large amounts of rock and soil downhill toward the stream valleys, where the floodwaters can take over and wash it away.\u003c/p>\n\u003cp>This year’s El Niño is one of the strongest on record, and NOAA scientists say the Bay Area is likely to get more rain than normal this winter. Add to that the odds of an \u003ca href=\"http://ww2.kqed.org/quest/2012/11/01/watching-the-atmospheric-rivers-flow/\">atmospheric river event\u003c/a>, and we might see some 1,000-year events this winter in individual watersheds.\u003c/p>\n\u003cp>\u003cstrong>What Is a 1,000-Year Event?\u003c/strong>\u003c/p>\n\u003cp>Weather scientists are calling the epic rainfall events that hit Los Angeles last week, and \u003ca href=\"http://water.usgs.gov/floods/events/2015/Joaquin/HolmesQA.html\">flooded South Carolina\u003c/a> earlier this month, “1,000-year events.”\u003c/p>\n\u003cp>The term “1,000-year event” is often misunderstood. Scientists understand it as shorthand for an event with a 1-in-1,000 chance of happening in any given year. So it’s a statement about odds, not a length of time.\u003c/p>\n\u003caside class=\"pullquote alignleft\">‘The 1,000-year probability assumes the future will be like the past. That assumption is no longer true.’\u003c/aside>\n\u003cp>Think of a gambling game with a set of three 10-sided dice. A “1,000-year event” is the same as the odds of rolling a triple-10 — you’d never expect one but you know it could always happen, even twice in a row.\u003c/p>\n\u003cp>The event might be limited to a specific locality or a span of time, such as a 1-hour or 24-hour rainfall total. Last week in Southern California, 3.38 inches of rain fell on a rain gauge in Leona Valley within the span of an hour. The National Weather Service called it a 1,000-year event, one that was limited to one rain gauge and one hour.\u003c/p>\n\u003cp>And yet a 1,000-year event, large or small, is momentous and historic. Geologists are interested in these events because that’s when streams and rivers turn into the Incredible Hulk and do some of their most important work. That’s when geology comes to life.\u003c/p>\n\u003cp>Large flows of dense, mud-charged stormwater can bulldoze anything in their path. They can burst dams. It is 1,000-year floods that dig out and renew riverbeds after many years of silting up. Over a million years of geologic time, it’s a thousand 1,000-year events — not ordinary rains — that sculpt our landscape into its basic shape.\u003c/p>\n\u003cp>If your local streambed \u003ca href=\"https://oaklandgeology.wordpress.com/2015/10/19/two-lessons-about-floods/\">has supersize boulders in it\u003c/a>, 1,000-year events wake them up for a rare roll downstream. If you can listen beneath the roar of the river, you might hear the \u003ca href=\"http://ww2.kqed.org/quest/2013/02/07/geological-sounds/\">geological sound\u003c/a> they make as they tumble underneath the water like giant marbles.\u003c/p>\n\u003cp>\u003cstrong>The Odds Are High\u003c/strong>\u003c/p>\n\u003cp>Nothing makes 1,000-year events a sure thing. But the historically strong El Niño and the ever-present threat of a “Pineapple Express” atmospheric river event will make them much more likely this winter.\u003c/p>\n\u003cp>If an earthquake happens to add significant ground shaking to those things, the effects may truly be biblical. Earthquakes not only produce \u003ca href=\"http://ww2.kqed.org/quest/2012/11/08/earthquake-landslides-a-widespread-hazard/\">widespread landslides\u003c/a> on their own, but also \u003ca href=\"https://oaklandgeology.wordpress.com/2014/09/08/after-oaklands-big-one-expect-a-rush-of-water/\">shake groundwater out of the hills into streams\u003c/a> for weeks afterward.\u003c/p>\n\u003cp>Finally, we have the the complex effects of global warming. The “1,000-year” probability assumes things don’t change, and the future will be like the past. That assumption is no longer true — the future will be warmer and probably more unstable than the past. Climate change is slowly loading those 10-sided dice.\u003c/p>\n\u003cp>\u003c/p>\n\u003cp>In brief, keep your eyes and ears open this coming winter. The authorities will have up-to-the-minute advice as the El Niño storms loom and the rain falls.\u003c/p>\n\n\u003c/div>\u003c/p>",
"attributes": {
"named": {},
"numeric": []
}
}
],
"link": "/science/317772/strong-el-nino-may-bring-extreme-weather-events",
"authors": [
"6228"
],
"categories": [
"science_31",
"science_38",
"science_98"
],
"tags": [
"science_2227",
"science_371",
"science_2114"
],
"featImg": "science_317773",
"label": "science"
},
"science_255377": {
"type": "posts",
"id": "science_255377",
"meta": {
"index": "posts_1716263798",
"site": "science",
"id": "255377",
"score": null,
"sort": [
1443473565000
]
},
"parent": 0,
"labelTerm": {
"site": "science",
"term": 1151
},
"blocks": [],
"publishDate": 1443473565,
"format": "standard",
"title": "Drought-Weakened Trees Could Pose Danger This Winter",
"headTitle": "Drought-Weakened Trees Could Pose Danger This Winter | KQED",
"content": "\u003cp>\u003cstrong>Listen to the story:\u003c/strong>\u003c/p>\n\u003cp>http://www.kqed.org/.stream/anon/radio//2015/09/WebDroughtTrees.mp3\u003c/p>\n\u003cp>After four years of drought, California has a huge number of dead and dying trees.\u003c/p>\n\u003cp>After a U.S. Forest Service aerial survey last spring, researchers estimated there were 12.5 million dead trees on national forest lands alone.\u003c/p>\n\u003cp>That doesn’t count dead and dying trees in open spaces and urban parks, or on private property like your backyard or your neighbor’s.\u003c/p>\n\u003cp>[ad fullwidth]\u003c/p>\n\u003cp>With climatologists predicting that \u003ca href=\"http://ww2.kqed.org/science/2015/09/02/floods-in-a-drought-how-a-monster-el-nino-could-bring-relief-and-misery-to-california/\" target=\"_blank\" rel=\"noopener\">this year’s El Niño \u003c/a>will usher in strong winds and torrential rains, weakened trees pose dangers to people and property across the state.\u003c/p>\n\u003caside class=\"pullquote alignright\">‘If we’re going to incur any sort of storm, there’s going be a lot of trees in jeopardy.’\u003ccite>Remy Hummer, Arborist\u003c/cite>\u003c/aside>\n\u003cp>In the Bay Area, arborists are working overtime to prune or remove trees on private property. And many homeowners aren’t receiving any assistance with the cost; San Francisco, Oakland and Berkeley don’t have funds designated for this. In San Francisco, even street trees — normally a municipal responsibility — are being turned over to residents because the city doesn’t have the money to manage them.\u003c/p>\n\u003cp>\u003cstrong>Protecting Power Lines\u003c/strong>\u003c/p>\n\u003cp>PG&E inspects millions of trees each year and is responsible for removing limbs and trees that pose a threat to power lines in urban and rural areas.\u003c/p>\n\u003cp>On a work site in Santa Cruz recently, program manager Joel Smith points out the signs of a dead tree, a Douglas fir that crews are trimming.\u003c/p>\n\u003cp>“There’s just a small portion of green up toward the top,” he says, “and the rest of the crown is basically dead.”\u003c/p>\n\u003cp>Clumps of pine needles at the top of this Douglas fir have started to turn brown, and lichen hangs from the lower branches. Smith says this tree is too close to power lines.\u003c/p>\n\u003cdiv>\n\u003c!-- iframe plugin v.4.3 wordpress.org/plugins/iframe/ -->\u003cbr>\n\u003ciframe loading=\"lazy\" src=\"http://gifs.com/embed/KkPDkb\" frameborder=\"0\" scrolling=\"no\" width=\"800\" height=\"450\" style=\"-webkit-backface-visibility: hidden;-webkit-transform: scale(1);\" class=\"iframe-class\">\u003c/iframe>\n\u003c/div>\n\u003cp>\u003cem>To get a sense of the size of this tree, look for the PG&E crew member who’s barely visible, just under the branch that’s being trimmed off.\u003c/em>\u003c/p>\n\u003cp>“It is very serious,” he says. “Trees that are dead or are otherwise compromised can fail, and if they are close to our high voltage lines they can cause those lines to come down, which can create a very dangerous public safety hazard, as well as taking out the power and potentially causing a wildfire.”\u003c/p>\n\u003cp>Cal Fire officials are currently investigating whether this month’s devastating Butte Fire was ignited when a tree came into contact with a power line.\u003c/p>\n\u003cp>This year, says PG&E, crews are taking out 30 percent more dead trees and twice as many hazardous trees as in a non-drought year. And when customers call for a tree inspection, crews are doing less pruning and more removal.\u003c/p>\n\u003cp>\u003cstrong>What Should Homeowners Do?\u003c/strong>\u003c/p>\n\u003cp>If you see a drought-stressed tree near a power line, call PG&E; if it’s a street tree, call 311 to schedule a city inspection. But if you’re worried about a tree on your property, call a certified arborist.\u003c/p>\n\u003cp>Remy Hummer with Arborist Now says he’s been working overtime since the beginning of the year, trimming and removing trees or supporting them with cables. He says a lot of calls this fall are from homeowners worried about storms.\u003c/p>\n\u003cfigure id=\"attachment_268059\" class=\"wp-caption alignright\" style=\"max-width: 800px\">\u003ca href=\"http://ww2.kqed.org/science/wp-content/uploads/sites/35/2015/09/Fallen-tree-in-Vallejo.jpg\">\u003cimg loading=\"lazy\" decoding=\"async\" class=\"size-medium wp-image-268059\" src=\"http://ww2.kqed.org/science/wp-content/uploads/sites/35/2015/09/Fallen-tree-in-Vallejo-800x600.jpg\" alt=\"A weakened tree is uprooted in Vallejo by winds from one of last winter's rare atmospheric river storms.\" width=\"800\" height=\"600\" srcset=\"https://cdn.kqed.org/wp-content/uploads/sites/35/2015/09/Fallen-tree-in-Vallejo-800x600.jpg 800w, https://cdn.kqed.org/wp-content/uploads/sites/35/2015/09/Fallen-tree-in-Vallejo-400x300.jpg 400w, https://cdn.kqed.org/wp-content/uploads/sites/35/2015/09/Fallen-tree-in-Vallejo-1180x885.jpg 1180w, https://cdn.kqed.org/wp-content/uploads/sites/35/2015/09/Fallen-tree-in-Vallejo-960x720.jpg 960w, https://cdn.kqed.org/wp-content/uploads/sites/35/2015/09/Fallen-tree-in-Vallejo.jpg 1280w\" sizes=\"(max-width: 800px) 100vw, 800px\">\u003c/a>\u003cfigcaption class=\"wp-caption-text\">A weakened tree in Vallejo was uprooted by winds from one of last winter’s atmospheric river storms. \u003ccite>(Craig Miller/KQED)\u003c/cite>\u003c/figcaption>\u003c/figure>\n\u003cp>“If we’re going to incur any sort of storm, there’s going to be a lot of trees in jeopardy,” he says, “even the ones that are very sound.”\u003c/p>\n\u003cp>San Francisco officials say even in an ordinary year, between one and three tree branches fall every week in the city.\u003c/p>\n\u003cp>But U.C. Berkeley forest ecologist Joe McBride says this winter, hundreds of branches could fall every week.\u003c/p>\n\u003cp>Climatologists now say there’s a 95 percent chance El Niño will last through the winter. And they’re saying the storms could be as big as the El Niño of 1997-98, when San Francisco received double its normal amount of rain.\u003c/p>\n\u003cp>One clue that you may have a drought-stressed tree is a brown crown, says McBride. He says the crown is often the first place to go dry, because the tree simply can’t send enough water up to the taller branches.\u003c/p>\n\u003cp>\u003cstrong>A Bad Storm\u003c/strong>\u003c/p>\n\u003cp>In his four decades studying trees, McBride says one of the worst winter storms he remembers was in 1991.\u003c/p>\n\u003cp>“There were record wind velocities following about a week of rainfall in San Francisco,” he says, “and an estimated 6,000 trees at the Presidio and in Golden Gate Park were blown over as a result of that.”\u003c/p>\n\u003cp>And it didn’t take long.\u003c/p>\n\u003cp>“It all occurred in about a period of six hours, this one really heavy windstorm,” he says. “Blocked streets, a number of structures were hit by falling trees, cars were hit. It was a major disaster.”\u003c/p>\n\u003cp>It was a somewhat rare combination of prolonged rainfall with record winds, McBride says. And as to whether something similar is possible this winter?\u003c/p>\n\u003cp>\u003c/p>\n\u003cp>“Oh, I think it’s possible,” he says, “yeah.”\u003c/p>\n\n",
"stats": {
"hasVideo": false,
"hasChartOrMap": true,
"hasAudio": true,
"hasPolis": false,
"wordCount": 926,
"hasGoogleForm": false,
"hasGallery": false,
"hasHearkenModule": false,
"iframeSrcs": [
"http://gifs.com/embed/KkPDkb"
],
"paragraphCount": 32
},
"modified": 1704931264,
"excerpt": "If El Niño brings heavy wind and rain, California's dead and dying trees could topple, threatening homes and people.",
"headData": {
"twImgId": "",
"twTitle": "",
"ogTitle": "",
"ogImgId": "",
"twDescription": "",
"description": "If El Niño brings heavy wind and rain, California's dead and dying trees could topple, threatening homes and people.",
"title": "Drought-Weakened Trees Could Pose Danger This Winter | KQED",
"ogDescription": "",
"schema": {
"@context": "https://schema.org",
"@type": "Article",
"headline": "Drought-Weakened Trees Could Pose Danger This Winter",
"datePublished": "2015-09-28T13:52:45-07:00",
"dateModified": "2024-01-10T16:01:04-08:00",
"image": "https://cdn.kqed.org/wp-content/uploads/2020/02/KQED-OG-Image@1x.png"
}
},
"guestAuthors": [],
"slug": "drought-weakened-trees-pose-danger-in-winter-storms",
"status": "publish",
"sticky": false,
"path": "/science/255377/drought-weakened-trees-pose-danger-in-winter-storms",
"audioUrl": "http://www.kqed.org/.stream/anon/radio//2015/09/WebDroughtTrees.mp3",
"audioDuration": null,
"audioTrackLength": null,
"parsedContent": [
{
"type": "contentString",
"content": "\u003cdiv class=\"post-body\">\u003cp>\u003cp>\u003cstrong>Listen to the story:\u003c/strong>\u003c/p>\u003c/p>\u003c/div>",
"attributes": {
"named": {},
"numeric": []
}
},
{
"type": "component",
"content": "",
"name": "audioLink",
"attributes": {
"named": {
"src": "http://www.kqed.org/.stream/anon/radio//2015/09/WebDroughtTrees.mp3"
},
"numeric": []
}
},
{
"type": "contentString",
"content": "\u003cdiv class=\"post-body\">\u003cp>\u003cp>After four years of drought, California has a huge number of dead and dying trees.\u003c/p>\n\u003cp>After a U.S. Forest Service aerial survey last spring, researchers estimated there were 12.5 million dead trees on national forest lands alone.\u003c/p>\n\u003cp>That doesn’t count dead and dying trees in open spaces and urban parks, or on private property like your backyard or your neighbor’s.\u003c/p>\n\u003cp>\u003c/p>\u003c/div>",
"attributes": {
"named": {},
"numeric": []
}
},
{
"type": "component",
"content": "",
"name": "ad",
"attributes": {
"named": {
"label": "fullwidth"
},
"numeric": [
"fullwidth"
]
}
},
{
"type": "contentString",
"content": "\u003cdiv class=\"post-body\">\u003cp>\u003c/p>\n\u003cp>With climatologists predicting that \u003ca href=\"http://ww2.kqed.org/science/2015/09/02/floods-in-a-drought-how-a-monster-el-nino-could-bring-relief-and-misery-to-california/\" target=\"_blank\" rel=\"noopener\">this year’s El Niño \u003c/a>will usher in strong winds and torrential rains, weakened trees pose dangers to people and property across the state.\u003c/p>\n\u003caside class=\"pullquote alignright\">‘If we’re going to incur any sort of storm, there’s going be a lot of trees in jeopardy.’\u003ccite>Remy Hummer, Arborist\u003c/cite>\u003c/aside>\n\u003cp>In the Bay Area, arborists are working overtime to prune or remove trees on private property. And many homeowners aren’t receiving any assistance with the cost; San Francisco, Oakland and Berkeley don’t have funds designated for this. In San Francisco, even street trees — normally a municipal responsibility — are being turned over to residents because the city doesn’t have the money to manage them.\u003c/p>\n\u003cp>\u003cstrong>Protecting Power Lines\u003c/strong>\u003c/p>\n\u003cp>PG&E inspects millions of trees each year and is responsible for removing limbs and trees that pose a threat to power lines in urban and rural areas.\u003c/p>\n\u003cp>On a work site in Santa Cruz recently, program manager Joel Smith points out the signs of a dead tree, a Douglas fir that crews are trimming.\u003c/p>\n\u003cp>“There’s just a small portion of green up toward the top,” he says, “and the rest of the crown is basically dead.”\u003c/p>\n\u003cp>Clumps of pine needles at the top of this Douglas fir have started to turn brown, and lichen hangs from the lower branches. Smith says this tree is too close to power lines.\u003c/p>\n\u003cdiv>\n\u003c!-- iframe plugin v.4.3 wordpress.org/plugins/iframe/ -->\u003cbr>\n\u003ciframe loading=\"lazy\" src=\"http://gifs.com/embed/KkPDkb\" frameborder=\"0\" scrolling=\"no\" width=\"800\" height=\"450\" style=\"-webkit-backface-visibility: hidden;-webkit-transform: scale(1);\" class=\"iframe-class\">\u003c/iframe>\n\u003c/div>\n\u003cp>\u003cem>To get a sense of the size of this tree, look for the PG&E crew member who’s barely visible, just under the branch that’s being trimmed off.\u003c/em>\u003c/p>\n\u003cp>“It is very serious,” he says. “Trees that are dead or are otherwise compromised can fail, and if they are close to our high voltage lines they can cause those lines to come down, which can create a very dangerous public safety hazard, as well as taking out the power and potentially causing a wildfire.”\u003c/p>\n\u003cp>Cal Fire officials are currently investigating whether this month’s devastating Butte Fire was ignited when a tree came into contact with a power line.\u003c/p>\n\u003cp>This year, says PG&E, crews are taking out 30 percent more dead trees and twice as many hazardous trees as in a non-drought year. And when customers call for a tree inspection, crews are doing less pruning and more removal.\u003c/p>\n\u003cp>\u003cstrong>What Should Homeowners Do?\u003c/strong>\u003c/p>\n\u003cp>If you see a drought-stressed tree near a power line, call PG&E; if it’s a street tree, call 311 to schedule a city inspection. But if you’re worried about a tree on your property, call a certified arborist.\u003c/p>\n\u003cp>Remy Hummer with Arborist Now says he’s been working overtime since the beginning of the year, trimming and removing trees or supporting them with cables. He says a lot of calls this fall are from homeowners worried about storms.\u003c/p>\n\u003cfigure id=\"attachment_268059\" class=\"wp-caption alignright\" style=\"max-width: 800px\">\u003ca href=\"http://ww2.kqed.org/science/wp-content/uploads/sites/35/2015/09/Fallen-tree-in-Vallejo.jpg\">\u003cimg loading=\"lazy\" decoding=\"async\" class=\"size-medium wp-image-268059\" src=\"http://ww2.kqed.org/science/wp-content/uploads/sites/35/2015/09/Fallen-tree-in-Vallejo-800x600.jpg\" alt=\"A weakened tree is uprooted in Vallejo by winds from one of last winter's rare atmospheric river storms.\" width=\"800\" height=\"600\" srcset=\"https://cdn.kqed.org/wp-content/uploads/sites/35/2015/09/Fallen-tree-in-Vallejo-800x600.jpg 800w, https://cdn.kqed.org/wp-content/uploads/sites/35/2015/09/Fallen-tree-in-Vallejo-400x300.jpg 400w, https://cdn.kqed.org/wp-content/uploads/sites/35/2015/09/Fallen-tree-in-Vallejo-1180x885.jpg 1180w, https://cdn.kqed.org/wp-content/uploads/sites/35/2015/09/Fallen-tree-in-Vallejo-960x720.jpg 960w, https://cdn.kqed.org/wp-content/uploads/sites/35/2015/09/Fallen-tree-in-Vallejo.jpg 1280w\" sizes=\"(max-width: 800px) 100vw, 800px\">\u003c/a>\u003cfigcaption class=\"wp-caption-text\">A weakened tree in Vallejo was uprooted by winds from one of last winter’s atmospheric river storms. \u003ccite>(Craig Miller/KQED)\u003c/cite>\u003c/figcaption>\u003c/figure>\n\u003cp>“If we’re going to incur any sort of storm, there’s going to be a lot of trees in jeopardy,” he says, “even the ones that are very sound.”\u003c/p>\n\u003cp>San Francisco officials say even in an ordinary year, between one and three tree branches fall every week in the city.\u003c/p>\n\u003cp>But U.C. Berkeley forest ecologist Joe McBride says this winter, hundreds of branches could fall every week.\u003c/p>\n\u003cp>Climatologists now say there’s a 95 percent chance El Niño will last through the winter. And they’re saying the storms could be as big as the El Niño of 1997-98, when San Francisco received double its normal amount of rain.\u003c/p>\n\u003cp>One clue that you may have a drought-stressed tree is a brown crown, says McBride. He says the crown is often the first place to go dry, because the tree simply can’t send enough water up to the taller branches.\u003c/p>\n\u003cp>\u003cstrong>A Bad Storm\u003c/strong>\u003c/p>\n\u003cp>In his four decades studying trees, McBride says one of the worst winter storms he remembers was in 1991.\u003c/p>\n\u003cp>“There were record wind velocities following about a week of rainfall in San Francisco,” he says, “and an estimated 6,000 trees at the Presidio and in Golden Gate Park were blown over as a result of that.”\u003c/p>\n\u003cp>And it didn’t take long.\u003c/p>\n\u003cp>“It all occurred in about a period of six hours, this one really heavy windstorm,” he says. “Blocked streets, a number of structures were hit by falling trees, cars were hit. It was a major disaster.”\u003c/p>\n\u003cp>It was a somewhat rare combination of prolonged rainfall with record winds, McBride says. And as to whether something similar is possible this winter?\u003c/p>\n\u003cp>\u003c/p>\n\u003cp>“Oh, I think it’s possible,” he says, “yeah.”\u003c/p>\n\n\u003c/div>\u003c/p>",
"attributes": {
"named": {},
"numeric": []
}
}
],
"link": "/science/255377/drought-weakened-trees-pose-danger-in-winter-storms",
"authors": [
"5432"
],
"series": [
"science_1151"
],
"categories": [
"science_31",
"science_35",
"science_40",
"science_43"
],
"tags": [
"science_572",
"science_371",
"science_787"
],
"featImg": "science_267718",
"label": "science_1151"
},
"science_270178": {
"type": "posts",
"id": "science_270178",
"meta": {
"index": "posts_1716263798",
"site": "science",
"id": "270178",
"score": null,
"sort": [
1442968580000
]
},
"parent": 0,
"labelTerm": {
"site": "science"
},
"blocks": [],
"publishDate": 1442968580,
"format": "standard",
"title": "How El Niño Might Have Fed the Valley Fire's Strange Ferocity",
"headTitle": "How El Niño Might Have Fed the Valley Fire’s Strange Ferocity | KQED",
"content": "\u003cp>Researchers at San Jose State have a theory that could explain the wind-driven explosive growth of the \u003ca href=\"http://ww2.kqed.org/news/2015/09/13/valley-fire-forcing-residents-to-evacuate-injures-firefighters-in-lake-county\">Valley Fire\u003c/a>, and as strange as it sounds it’s … a hurricane.\u003c/p>\n\u003cp>Strengthening El Niño conditions have spawned an active Pacific hurricane season. Just as the Valley Fire was getting started, a dying hurricane named Linda was still pumping moist air into the upper atmosphere, well north along the California coast.\u003c/p>\n\u003cp>“And it’s really the mixture of those two air masses — the moist air aloft and the really dry air near the surface — that led to the development of these winds,” says Neil Lareau, a researcher at the university’s Fire Weather Research Lab and \u003ca href=\"http://www.fireweather.org/blog/2015/9/15/did-tropical-moisture-contribute-to-the-valley-fire-blow-up\">co-author of the article\u003c/a> appearing on the lab’s website.\u003c/p>\n\u003cp>“Cooler air is actually denser than warmer air,” he explains. “So when you cool the air, it tends to sink towards the surface, and it also tends to develop higher pressure.”\u003c/p>\n\u003cp>That high pressure building just off the coast created a “burst of northwest winds” that bedeviled firefighters with 35 mph gusts.\u003c/p>\n\u003cp>[ad fullwidth]\u003c/p>\n\u003cp>\u003cstrong>When Wetter Isn’t Better\u003cbr>\n\u003c/strong>\u003c/p>\n\u003cp>The rain that never made it to the ground (known as virga) in the fire zone actually made matters worse, in Lareau’s analysis. Evaporating raindrops rapidly cooled the upper-level air, which created a downdraft that increased winds locally.\u003c/p>\n\u003cp>While Lareau’s article is not based on any formal peer-reviewed study, he writes that there is “clear evidence that tropical moisture contributed to enhanced northwest winds that propelled the fire.”\u003c/p>\n\u003cp>When the fire was in its most explosive growth phase, fire officials marveled at how the blaze seemed to leapfrog attempts to subdue it.\u003c/p>\n\u003cp>“The fire would throw embers a half-mile beyond where firefighters were working,” said Cal Fire spokesman Daniel Berlant.\u003c/p>\n\u003cp>“This is the kind of fire we \u003ca href=\"http://ww2.kqed.org/science/2015/09/17/why-the-worst-of-fire-season-may-lie-ahead/\">would see with Santa Ana winds\u003c/a> but in our area, this is unprecedented.”\u003c/p>\n\u003cp>Lareau has an explanation for that, too. He says the same bizarre set of meteorological conditions caused the usual upward column of hot air to tilt.\u003c/p>\n\u003cp>“And then all of those embers that would’ve been going straight up in the plume get ejected out in front of the initial fire,” explains Lareau, “causing new fires to form in this kind of hopscotch fire growth across the landscape.”\u003c/p>\n\u003cp>\u003c/p>\n\u003cp>Lareau says it’s hard to tell what implications this has for the remaining fire season. The likelihood of similar events might depend on what other storms are spun out of the tropical Pacific by El Niño.\u003c/p>\n\n",
"stats": {
"hasVideo": false,
"hasChartOrMap": false,
"hasAudio": false,
"hasPolis": false,
"wordCount": 459,
"hasGoogleForm": false,
"hasGallery": false,
"hasHearkenModule": false,
"iframeSrcs": [],
"paragraphCount": 16
},
"modified": 1704931289,
"excerpt": "Strengthening El Niño conditions have spawned an active Pacific hurricane season, one long tendril of which could have stoked flames in Lake County.",
"headData": {
"twImgId": "",
"twTitle": "",
"ogTitle": "",
"ogImgId": "",
"twDescription": "",
"description": "Strengthening El Niño conditions have spawned an active Pacific hurricane season, one long tendril of which could have stoked flames in Lake County.",
"title": "How El Niño Might Have Fed the Valley Fire's Strange Ferocity | KQED",
"ogDescription": "",
"schema": {
"@context": "https://schema.org",
"@type": "Article",
"headline": "How El Niño Might Have Fed the Valley Fire's Strange Ferocity",
"datePublished": "2015-09-22T17:36:20-07:00",
"dateModified": "2024-01-10T16:01:29-08:00",
"image": "https://cdn.kqed.org/wp-content/uploads/2020/02/KQED-OG-Image@1x.png"
}
},
"guestAuthors": [],
"slug": "how-el-nino-might-have-fed-the-valley-fires-strange-ferocity",
"status": "publish",
"sticky": false,
"path": "/science/270178/how-el-nino-might-have-fed-the-valley-fires-strange-ferocity",
"audioTrackLength": null,
"parsedContent": [
{
"type": "contentString",
"content": "\u003cdiv class=\"post-body\">\u003cp>\u003cp>Researchers at San Jose State have a theory that could explain the wind-driven explosive growth of the \u003ca href=\"http://ww2.kqed.org/news/2015/09/13/valley-fire-forcing-residents-to-evacuate-injures-firefighters-in-lake-county\">Valley Fire\u003c/a>, and as strange as it sounds it’s … a hurricane.\u003c/p>\n\u003cp>Strengthening El Niño conditions have spawned an active Pacific hurricane season. Just as the Valley Fire was getting started, a dying hurricane named Linda was still pumping moist air into the upper atmosphere, well north along the California coast.\u003c/p>\n\u003cp>“And it’s really the mixture of those two air masses — the moist air aloft and the really dry air near the surface — that led to the development of these winds,” says Neil Lareau, a researcher at the university’s Fire Weather Research Lab and \u003ca href=\"http://www.fireweather.org/blog/2015/9/15/did-tropical-moisture-contribute-to-the-valley-fire-blow-up\">co-author of the article\u003c/a> appearing on the lab’s website.\u003c/p>\n\u003cp>“Cooler air is actually denser than warmer air,” he explains. “So when you cool the air, it tends to sink towards the surface, and it also tends to develop higher pressure.”\u003c/p>\n\u003cp>That high pressure building just off the coast created a “burst of northwest winds” that bedeviled firefighters with 35 mph gusts.\u003c/p>\n\u003cp>\u003c/p>\u003c/div>",
"attributes": {
"named": {},
"numeric": []
}
},
{
"type": "component",
"content": "",
"name": "ad",
"attributes": {
"named": {
"label": "fullwidth"
},
"numeric": [
"fullwidth"
]
}
},
{
"type": "contentString",
"content": "\u003cdiv class=\"post-body\">\u003cp>\u003c/p>\n\u003cp>\u003cstrong>When Wetter Isn’t Better\u003cbr>\n\u003c/strong>\u003c/p>\n\u003cp>The rain that never made it to the ground (known as virga) in the fire zone actually made matters worse, in Lareau’s analysis. Evaporating raindrops rapidly cooled the upper-level air, which created a downdraft that increased winds locally.\u003c/p>\n\u003cp>While Lareau’s article is not based on any formal peer-reviewed study, he writes that there is “clear evidence that tropical moisture contributed to enhanced northwest winds that propelled the fire.”\u003c/p>\n\u003cp>When the fire was in its most explosive growth phase, fire officials marveled at how the blaze seemed to leapfrog attempts to subdue it.\u003c/p>\n\u003cp>“The fire would throw embers a half-mile beyond where firefighters were working,” said Cal Fire spokesman Daniel Berlant.\u003c/p>\n\u003cp>“This is the kind of fire we \u003ca href=\"http://ww2.kqed.org/science/2015/09/17/why-the-worst-of-fire-season-may-lie-ahead/\">would see with Santa Ana winds\u003c/a> but in our area, this is unprecedented.”\u003c/p>\n\u003cp>Lareau has an explanation for that, too. He says the same bizarre set of meteorological conditions caused the usual upward column of hot air to tilt.\u003c/p>\n\u003cp>“And then all of those embers that would’ve been going straight up in the plume get ejected out in front of the initial fire,” explains Lareau, “causing new fires to form in this kind of hopscotch fire growth across the landscape.”\u003c/p>\n\u003cp>\u003c/p>\n\u003cp>Lareau says it’s hard to tell what implications this has for the remaining fire season. The likelihood of similar events might depend on what other storms are spun out of the tropical Pacific by El Niño.\u003c/p>\n\n\u003c/div>\u003c/p>",
"attributes": {
"named": {},
"numeric": []
}
}
],
"link": "/science/270178/how-el-nino-might-have-fed-the-valley-fires-strange-ferocity",
"authors": [
"221"
],
"categories": [
"science_31",
"science_40",
"science_42"
],
"tags": [
"science_371",
"science_1596",
"science_113"
],
"featImg": "science_270240",
"label": "science"
}
},
"podcastsReducer": {
"isFetching": false,
"fetchFailed": false,
"hasFetched": false,
"podcasts": {}
},
"radioProgramsReducer": {
"isFetching": false,
"fetchFailed": false,
"hasFetched": false,
"radioPrograms": {}
},
"radioSearchSegmentsReducer": {},
"programsReducer": {
"all-things-considered": {
"id": "all-things-considered",
"title": "All Things Considered",
"info": "Every weekday, \u003cem>All Things Considered\u003c/em> hosts Robert Siegel, Audie Cornish, Ari Shapiro, and Kelly McEvers present the program's trademark mix of news, interviews, commentaries, reviews, and offbeat features. Michel Martin hosts on the weekends.",
"airtime": "MON-FRI 1pm-2pm, 4:30pm-6:30pm\u003cbr />SAT-SUN 5pm-6pm",
"imageSrc": "https://cdn.kqed.org/wp-content/uploads/2024/04/All-Things-Considered-Podcast-Tile-360x360-1.jpg",
"officialWebsiteLink": "https://www.npr.org/programs/all-things-considered/",
"meta": {
"site": "news",
"source": "npr"
},
"link": "/radio/program/all-things-considered"
},
"american-suburb-podcast": {
"id": "american-suburb-podcast",
"title": "American Suburb: The Podcast",
"tagline": "The flip side of gentrification, told through one town",
"info": "Gentrification is changing cities across America, forcing people from neighborhoods they have long called home. Call them the displaced. Now those priced out of the Bay Area are looking for a better life in an unlikely place. American Suburb follows this migration to one California town along the Delta, 45 miles from San Francisco. But is this once sleepy suburb ready for them?",
"imageSrc": "https://cdn.kqed.org/wp-content/uploads/2024/04/American-Suburb-Podcast-Tile-703x703-1.jpg",
"officialWebsiteLink": "/news/series/american-suburb-podcast",
"meta": {
"site": "news",
"source": "kqed",
"order": 19
},
"link": "/news/series/american-suburb-podcast/",
"subscribe": {
"npr": "https://rpb3r.app.goo.gl/RBrW",
"apple": "https://itunes.apple.com/WebObjects/MZStore.woa/wa/viewPodcast?mt=2&id=1287748328",
"tuneIn": "https://tunein.com/radio/American-Suburb-p1086805/",
"rss": "https://ww2.kqed.org/news/series/american-suburb-podcast/feed/podcast",
"google": "https://podcasts.google.com/feed/aHR0cHM6Ly9mZWVkcy5tZWdhcGhvbmUuZm0vS1FJTkMzMDExODgxNjA5"
}
},
"baycurious": {
"id": "baycurious",
"title": "Bay Curious",
"tagline": "Exploring the Bay Area, one question at a time",
"info": "KQED’s new podcast, Bay Curious, gets to the bottom of the mysteries — both profound and peculiar — that give the Bay Area its unique identity. And we’ll do it with your help! You ask the questions. You decide what Bay Curious investigates. And you join us on the journey to find the answers.",
"imageSrc": "https://cdn.kqed.org/wp-content/uploads/2024/04/Bay-Curious-Podcast-Tile-703x703-1.jpg",
"imageAlt": "KQED Bay Curious",
"officialWebsiteLink": "/news/series/baycurious",
"meta": {
"site": "news",
"source": "kqed",
"order": 3
},
"link": "/podcasts/baycurious",
"subscribe": {
"apple": "https://podcasts.apple.com/us/podcast/bay-curious/id1172473406",
"npr": "https://www.npr.org/podcasts/500557090/bay-curious",
"rss": "https://ww2.kqed.org/news/category/bay-curious-podcast/feed/podcast",
"amazon": "https://music.amazon.com/podcasts/9a90d476-aa04-455d-9a4c-0871ed6216d4/bay-curious",
"stitcher": "https://www.stitcher.com/podcast/kqed/bay-curious",
"spotify": "https://open.spotify.com/show/6O76IdmhixfijmhTZLIJ8k"
}
},
"bbc-world-service": {
"id": "bbc-world-service",
"title": "BBC World Service",
"info": "The day's top stories from BBC News compiled twice daily in the week, once at weekends.",
"airtime": "MON-FRI 9pm-10pm, TUE-FRI 1am-2am",
"imageSrc": "https://cdn.kqed.org/wp-content/uploads/2024/04/BBC-World-Service-Podcast-Tile-360x360-1.jpg",
"officialWebsiteLink": "https://www.bbc.co.uk/sounds/play/live:bbc_world_service",
"meta": {
"site": "news",
"source": "BBC World Service"
},
"link": "/radio/program/bbc-world-service",
"subscribe": {
"apple": "https://itunes.apple.com/us/podcast/global-news-podcast/id135067274?mt=2",
"tuneIn": "https://tunein.com/radio/BBC-World-Service-p455581/",
"rss": "https://podcasts.files.bbci.co.uk/p02nq0gn.rss"
}
},
"californiareport": {
"id": "californiareport",
"title": "The California Report",
"tagline": "California, day by day",
"info": "KQED’s statewide radio news program providing daily coverage of issues, trends and public policy decisions.",
"imageSrc": "https://cdn.kqed.org/wp-content/uploads/2024/04/The-California-Report-Podcast-Tile-703x703-1.jpg",
"imageAlt": "KQED The California Report",
"officialWebsiteLink": "/californiareport",
"meta": {
"site": "news",
"source": "kqed",
"order": 8
},
"link": "/californiareport",
"subscribe": {
"apple": "https://podcasts.apple.com/us/podcast/kqeds-the-california-report/id79681292",
"amazon": "https://music.amazon.com/podcasts/26099305-72af-4542-9dde-ac1807fe36d5/kqed-s-the-california-report",
"npr": "https://www.npr.org/podcasts/432285393/the-california-report",
"stitcher": "https://www.stitcher.com/podcast/kqedfm-kqeds-the-california-report-podcast-8838",
"rss": "https://ww2.kqed.org/news/tag/tcram/feed/podcast"
}
},
"californiareportmagazine": {
"id": "californiareportmagazine",
"title": "The California Report Magazine",
"tagline": "Your state, your stories",
"info": "Every week, The California Report Magazine takes you on a road trip for the ears: to visit the places and meet the people who make California unique. The in-depth storytelling podcast from the California Report.",
"airtime": "FRI 4:30pm-5pm, 6:30pm-7pm, 11pm-11:30pm",
"imageSrc": "https://cdn.kqed.org/wp-content/uploads/2024/04/The-California-Report-Magazine-Podcast-Tile-703x703-1.jpg",
"imageAlt": "KQED The California Report Magazine",
"officialWebsiteLink": "/californiareportmagazine",
"meta": {
"site": "news",
"source": "kqed",
"order": 10
},
"link": "/californiareportmagazine",
"subscribe": {
"apple": "https://podcasts.apple.com/us/podcast/the-california-report-magazine/id1314750545",
"google": "https://podcasts.google.com/feed/aHR0cHM6Ly9mZWVkcy5tZWdhcGhvbmUuZm0vS1FJTkM3NjkwNjk1OTAz",
"npr": "https://www.npr.org/podcasts/564733126/the-california-report-magazine",
"stitcher": "https://www.stitcher.com/podcast/kqed/the-california-report-magazine",
"rss": "https://ww2.kqed.org/news/tag/tcrmag/feed/podcast"
}
},
"city-arts": {
"id": "city-arts",
"title": "City Arts & Lectures",
"info": "A one-hour radio program to hear celebrated writers, artists and thinkers address contemporary ideas and values, often discussing the creative process. Please note: tapes or transcripts are not available",
"imageSrc": "https://ww2.kqed.org/radio/wp-content/uploads/sites/50/2018/05/cityartsandlecture-300x300.jpg",
"officialWebsiteLink": "https://www.cityarts.net/",
"airtime": "SUN 1pm-2pm, TUE 10pm, WED 1am",
"meta": {
"site": "news",
"source": "City Arts & Lectures"
},
"link": "https://www.cityarts.net",
"subscribe": {
"tuneIn": "https://tunein.com/radio/City-Arts-and-Lectures-p692/",
"rss": "https://www.cityarts.net/feed/"
}
},
"closealltabs": {
"id": "closealltabs",
"title": "Close All Tabs",
"tagline": "Your irreverent guide to the trends redefining our world",
"info": "Close All Tabs breaks down how digital culture shapes our world through thoughtful insights and irreverent humor.",
"imageSrc": "https://cdn.kqed.org/wp-content/uploads/2025/02/CAT_2_Tile-scaled.jpg",
"imageAlt": "KQED Close All Tabs",
"officialWebsiteLink": "/podcasts/closealltabs",
"meta": {
"site": "news",
"source": "kqed",
"order": 1
},
"link": "/podcasts/closealltabs",
"subscribe": {
"apple": "https://podcasts.apple.com/us/podcast/close-all-tabs/id214663465",
"rss": "https://feeds.megaphone.fm/KQINC6993880386",
"amazon": "https://music.amazon.com/podcasts/92d9d4ac-67a3-4eed-b10a-fb45d45b1ef2/close-all-tabs",
"spotify": "https://open.spotify.com/show/6LAJFHnGK1pYXYzv6SIol6?si=deb0cae19813417c"
}
},
"code-switch-life-kit": {
"id": "code-switch-life-kit",
"title": "Code Switch / Life Kit",
"info": "\u003cem>Code Switch\u003c/em>, which listeners will hear in the first part of the hour, has fearless and much-needed conversations about race. Hosted by journalists of color, the show tackles the subject of race head-on, exploring how it impacts every part of society — from politics and pop culture to history, sports and more.\u003cbr />\u003cbr />\u003cem>Life Kit\u003c/em>, which will be in the second part of the hour, guides you through spaces and feelings no one prepares you for — from finances to mental health, from workplace microaggressions to imposter syndrome, from relationships to parenting. The show features experts with real world experience and shares their knowledge. Because everyone needs a little help being human.\u003cbr />\u003cbr />\u003ca href=\"https://www.npr.org/podcasts/510312/codeswitch\">\u003cem>Code Switch\u003c/em> offical site and podcast\u003c/a>\u003cbr />\u003ca href=\"https://www.npr.org/lifekit\">\u003cem>Life Kit\u003c/em> offical site and podcast\u003c/a>\u003cbr />",
"airtime": "SUN 9pm-10pm",
"imageSrc": "https://cdn.kqed.org/wp-content/uploads/2024/04/Code-Switch-Life-Kit-Podcast-Tile-360x360-1.jpg",
"meta": {
"site": "radio",
"source": "npr"
},
"link": "/radio/program/code-switch-life-kit",
"subscribe": {
"apple": "https://podcasts.apple.com/podcast/1112190608?mt=2&at=11l79Y&ct=nprdirectory",
"google": "https://podcasts.google.com/feed/aHR0cHM6Ly93d3cubnByLm9yZy9yc3MvcG9kY2FzdC5waHA_aWQ9NTEwMzEy",
"spotify": "https://open.spotify.com/show/3bExJ9JQpkwNhoHvaIIuyV",
"rss": "https://feeds.npr.org/510312/podcast.xml"
}
},
"commonwealth-club": {
"id": "commonwealth-club",
"title": "Commonwealth Club of California Podcast",
"info": "The Commonwealth Club of California is the nation's oldest and largest public affairs forum. As a non-partisan forum, The Club brings to the public airwaves diverse viewpoints on important topics. The Club's weekly radio broadcast - the oldest in the U.S., dating back to 1924 - is carried across the nation on public radio stations and is now podcasting. Our website archive features audio of our recent programs, as well as selected speeches from our long and distinguished history. This podcast feed is usually updated twice a week and is always un-edited.",
"airtime": "THU 10pm, FRI 1am",
"imageSrc": "https://cdn.kqed.org/wp-content/uploads/2024/04/Commonwealth-Club-Podcast-Tile-360x360-1.jpg",
"officialWebsiteLink": "https://www.commonwealthclub.org/podcasts",
"meta": {
"site": "news",
"source": "Commonwealth Club of California"
},
"link": "/radio/program/commonwealth-club",
"subscribe": {
"apple": "https://itunes.apple.com/us/podcast/commonwealth-club-of-california-podcast/id976334034?mt=2",
"google": "https://podcasts.google.com/feed/aHR0cDovL3d3dy5jb21tb253ZWFsdGhjbHViLm9yZy9hdWRpby9wb2RjYXN0L3dlZWtseS54bWw",
"tuneIn": "https://tunein.com/radio/Commonwealth-Club-of-California-p1060/"
}
},
"forum": {
"id": "forum",
"title": "Forum",
"tagline": "The conversation starts here",
"info": "KQED’s live call-in program discussing local, state, national and international issues, as well as in-depth interviews.",
"airtime": "MON-FRI 9am-11am, 10pm-11pm",
"imageSrc": "https://cdn.kqed.org/wp-content/uploads/2024/04/Forum-Podcast-Tile-703x703-1.jpg",
"imageAlt": "KQED Forum with Mina Kim and Alexis Madrigal",
"officialWebsiteLink": "/forum",
"meta": {
"site": "news",
"source": "kqed",
"order": 9
},
"link": "/forum",
"subscribe": {
"apple": "https://podcasts.apple.com/us/podcast/kqeds-forum/id73329719",
"google": "https://podcasts.google.com/feed/aHR0cHM6Ly9mZWVkcy5tZWdhcGhvbmUuZm0vS1FJTkM5NTU3MzgxNjMz",
"npr": "https://www.npr.org/podcasts/432307980/forum",
"stitcher": "https://www.stitcher.com/podcast/kqedfm-kqeds-forum-podcast",
"rss": "https://feeds.megaphone.fm/KQINC9557381633"
}
},
"freakonomics-radio": {
"id": "freakonomics-radio",
"title": "Freakonomics Radio",
"info": "Freakonomics Radio is a one-hour award-winning podcast and public-radio project hosted by Stephen Dubner, with co-author Steve Levitt as a regular guest. It is produced in partnership with WNYC.",
"imageSrc": "https://ww2.kqed.org/news/wp-content/uploads/sites/10/2018/05/freakonomicsRadio.png",
"officialWebsiteLink": "http://freakonomics.com/",
"airtime": "SUN 1am-2am, SAT 3pm-4pm",
"meta": {
"site": "radio",
"source": "WNYC"
},
"link": "/radio/program/freakonomics-radio",
"subscribe": {
"npr": "https://rpb3r.app.goo.gl/4s8b",
"apple": "https://itunes.apple.com/us/podcast/freakonomics-radio/id354668519",
"tuneIn": "https://tunein.com/podcasts/WNYC-Podcasts/Freakonomics-Radio-p272293/",
"rss": "https://feeds.feedburner.com/freakonomicsradio"
}
},
"fresh-air": {
"id": "fresh-air",
"title": "Fresh Air",
"info": "Hosted by Terry Gross, \u003cem>Fresh Air from WHYY\u003c/em> is the Peabody Award-winning weekday magazine of contemporary arts and issues. One of public radio's most popular programs, Fresh Air features intimate conversations with today's biggest luminaries.",
"airtime": "MON-FRI 7pm-8pm",
"imageSrc": "https://cdn.kqed.org/wp-content/uploads/2024/04/Fresh-Air-Podcast-Tile-360x360-1.jpg",
"officialWebsiteLink": "https://www.npr.org/programs/fresh-air/",
"meta": {
"site": "radio",
"source": "npr"
},
"link": "/radio/program/fresh-air",
"subscribe": {
"npr": "https://rpb3r.app.goo.gl/4s8b",
"apple": "https://itunes.apple.com/WebObjects/MZStore.woa/wa/viewPodcast?s=143441&mt=2&id=214089682&at=11l79Y&ct=nprdirectory",
"tuneIn": "https://tunein.com/radio/Fresh-Air-p17/",
"rss": "https://feeds.npr.org/381444908/podcast.xml"
}
},
"here-and-now": {
"id": "here-and-now",
"title": "Here & Now",
"info": "A live production of NPR and WBUR Boston, in collaboration with stations across the country, Here & Now reflects the fluid world of news as it's happening in the middle of the day, with timely, in-depth news, interviews and conversation. Hosted by Robin Young, Jeremy Hobson and Tonya Mosley.",
"airtime": "MON-THU 11am-12pm",
"imageSrc": "https://cdn.kqed.org/wp-content/uploads/2024/04/Here-And-Now-Podcast-Tile-360x360-1.jpg",
"officialWebsiteLink": "http://www.wbur.org/hereandnow",
"meta": {
"site": "news",
"source": "npr"
},
"link": "/radio/program/here-and-now",
"subsdcribe": {
"apple": "https://itunes.apple.com/WebObjects/MZStore.woa/wa/viewPodcast?mt=2&id=426698661",
"tuneIn": "https://tunein.com/radio/Here--Now-p211/",
"rss": "https://feeds.npr.org/510051/podcast.xml"
}
},
"hidden-brain": {
"id": "hidden-brain",
"title": "Hidden Brain",
"info": "Shankar Vedantam uses science and storytelling to reveal the unconscious patterns that drive human behavior, shape our choices and direct our relationships.",
"imageSrc": "https://ww2.kqed.org/radio/wp-content/uploads/sites/50/2018/05/hiddenbrain.jpg",
"officialWebsiteLink": "https://www.npr.org/series/423302056/hidden-brain",
"airtime": "SUN 7pm-8pm",
"meta": {
"site": "news",
"source": "NPR"
},
"link": "/radio/program/hidden-brain",
"subscribe": {
"apple": "https://itunes.apple.com/us/podcast/hidden-brain/id1028908750?mt=2",
"tuneIn": "https://tunein.com/podcasts/Science-Podcasts/Hidden-Brain-p787503/",
"rss": "https://feeds.npr.org/510308/podcast.xml"
}
},
"how-i-built-this": {
"id": "how-i-built-this",
"title": "How I Built This with Guy Raz",
"info": "Guy Raz dives into the stories behind some of the world's best known companies. How I Built This weaves a narrative journey about innovators, entrepreneurs and idealists—and the movements they built.",
"imageSrc": "https://ww2.kqed.org/news/wp-content/uploads/sites/10/2018/05/howIBuiltThis.png",
"officialWebsiteLink": "https://www.npr.org/podcasts/510313/how-i-built-this",
"airtime": "SUN 7:30pm-8pm",
"meta": {
"site": "news",
"source": "npr"
},
"link": "/radio/program/how-i-built-this",
"subscribe": {
"npr": "https://rpb3r.app.goo.gl/3zxy",
"apple": "https://itunes.apple.com/us/podcast/how-i-built-this-with-guy-raz/id1150510297?mt=2",
"tuneIn": "https://tunein.com/podcasts/Arts--Culture-Podcasts/How-I-Built-This-p910896/",
"rss": "https://feeds.npr.org/510313/podcast.xml"
}
},
"hyphenacion": {
"id": "hyphenacion",
"title": "Hyphenación",
"tagline": "Where conversation and cultura meet",
"info": "What kind of no sabo word is Hyphenación? For us, it’s about living within a hyphenation. Like being a third-gen Mexican-American from the Texas border now living that Bay Area Chicano life. Like Xorje! Each week we bring together a couple of hyphenated Latinos to talk all about personal life choices: family, careers, relationships, belonging … everything is on the table. ",
"imageSrc": "https://cdn.kqed.org/wp-content/uploads/2025/03/Hyphenacion_FinalAssets_PodcastTile.png",
"imageAlt": "KQED Hyphenación",
"officialWebsiteLink": "/podcasts/hyphenacion",
"meta": {
"site": "news",
"source": "kqed",
"order": 15
},
"link": "/podcasts/hyphenacion",
"subscribe": {
"apple": "https://podcasts.apple.com/us/podcast/hyphenaci%C3%B3n/id1191591838",
"spotify": "https://open.spotify.com/show/2p3Fifq96nw9BPcmFdIq0o?si=39209f7b25774f38",
"youtube": "https://www.youtube.com/c/kqedarts",
"amazon": "https://music.amazon.com/podcasts/6c3dd23c-93fb-4aab-97ba-1725fa6315f1/hyphenaci%C3%B3n",
"rss": "https://feeds.megaphone.fm/KQINC2275451163"
}
},
"jerrybrown": {
"id": "jerrybrown",
"title": "The Political Mind of Jerry Brown",
"tagline": "Lessons from a lifetime in politics",
"info": "The Political Mind of Jerry Brown brings listeners the wisdom of the former Governor, Mayor, and presidential candidate. Scott Shafer interviewed Brown for more than 40 hours, covering the former governor's life and half-century in the political game – and Brown has some lessons he'd like to share. ",
"imageSrc": "https://cdn.kqed.org/wp-content/uploads/2024/04/The-Political-Mind-of-Jerry-Brown-Podcast-Tile-703x703-1.jpg",
"imageAlt": "KQED The Political Mind of Jerry Brown",
"officialWebsiteLink": "/podcasts/jerrybrown",
"meta": {
"site": "news",
"source": "kqed",
"order": 18
},
"link": "/podcasts/jerrybrown",
"subscribe": {
"npr": "https://www.npr.org/podcasts/790253322/the-political-mind-of-jerry-brown",
"apple": "https://itunes.apple.com/us/podcast/id1492194549",
"rss": "https://ww2.kqed.org/news/series/jerrybrown/feed/podcast/",
"tuneIn": "http://tun.in/pjGcK",
"stitcher": "https://www.stitcher.com/podcast/kqed/the-political-mind-of-jerry-brown",
"spotify": "https://open.spotify.com/show/54C1dmuyFyKMFttY6X2j6r?si=K8SgRCoISNK6ZbjpXrX5-w",
"amazon": "https://music.amazon.com/podcasts/44420f75-3b0e-4301-ab3b-16da6b09e543/the-political-mind-of-jerry-brown"
}
},
"latino-usa": {
"id": "latino-usa",
"title": "Latino USA",
"airtime": "MON 1am-2am, SUN 6pm-7pm",
"info": "Latino USA, the radio journal of news and culture, is the only national, English-language radio program produced from a Latino perspective.",
"imageSrc": "https://ww2.kqed.org/radio/wp-content/uploads/sites/50/2018/04/latinoUsa.jpg",
"officialWebsiteLink": "http://latinousa.org/",
"meta": {
"site": "news",
"source": "npr"
},
"link": "/radio/program/latino-usa",
"subscribe": {
"npr": "https://rpb3r.app.goo.gl/xtTd",
"apple": "https://itunes.apple.com/WebObjects/MZStore.woa/wa/viewPodcast?s=143441&mt=2&id=79681317&at=11l79Y&ct=nprdirectory",
"tuneIn": "https://tunein.com/radio/Latino-USA-p621/",
"rss": "https://feeds.npr.org/510016/podcast.xml"
}
},
"marketplace": {
"id": "marketplace",
"title": "Marketplace",
"info": "Our flagship program, helmed by Kai Ryssdal, examines what the day in money delivered, through stories, conversations, newsworthy numbers and more. Updated Monday through Friday at about 3:30 p.m. PT.",
"airtime": "MON-FRI 4pm-4:30pm, MON-WED 6:30pm-7pm",
"imageSrc": "https://cdn.kqed.org/wp-content/uploads/2024/04/Marketplace-Podcast-Tile-360x360-1.jpg",
"officialWebsiteLink": "https://www.marketplace.org/",
"meta": {
"site": "news",
"source": "American Public Media"
},
"link": "/radio/program/marketplace",
"subscribe": {
"apple": "https://itunes.apple.com/WebObjects/MZStore.woa/wa/viewPodcast?s=143441&mt=2&id=201853034&at=11l79Y&ct=nprdirectory",
"tuneIn": "https://tunein.com/radio/APM-Marketplace-p88/",
"rss": "https://feeds.publicradio.org/public_feeds/marketplace-pm/rss/rss"
}
},
"masters-of-scale": {
"id": "masters-of-scale",
"title": "Masters of Scale",
"info": "Masters of Scale is an original podcast in which LinkedIn co-founder and Greylock Partner Reid Hoffman sets out to describe and prove theories that explain how great entrepreneurs take their companies from zero to a gazillion in ingenious fashion.",
"airtime": "Every other Wednesday June 12 through October 16 at 8pm (repeats Thursdays at 2am)",
"imageSrc": "https://cdn.kqed.org/wp-content/uploads/2024/04/Masters-of-Scale-Podcast-Tile-360x360-1.jpg",
"officialWebsiteLink": "https://mastersofscale.com/",
"meta": {
"site": "radio",
"source": "WaitWhat"
},
"link": "/radio/program/masters-of-scale",
"subscribe": {
"apple": "http://mastersofscale.app.link/",
"rss": "https://rss.art19.com/masters-of-scale"
}
},
"mindshift": {
"id": "mindshift",
"title": "MindShift",
"tagline": "A podcast about the future of learning and how we raise our kids",
"info": "The MindShift podcast explores the innovations in education that are shaping how kids learn. Hosts Ki Sung and Katrina Schwartz introduce listeners to educators, researchers, parents and students who are developing effective ways to improve how kids learn. We cover topics like how fed-up administrators are developing surprising tactics to deal with classroom disruptions; how listening to podcasts are helping kids develop reading skills; the consequences of overparenting; and why interdisciplinary learning can engage students on all ends of the traditional achievement spectrum. This podcast is part of the MindShift education site, a division of KQED News. KQED is an NPR/PBS member station based in San Francisco. You can also visit the MindShift website for episodes and supplemental blog posts or tweet us \u003ca href=\"https://twitter.com/MindShiftKQED\">@MindShiftKQED\u003c/a> or visit us at \u003ca href=\"/mindshift\">MindShift.KQED.org\u003c/a>",
"imageSrc": "https://cdn.kqed.org/wp-content/uploads/2024/04/Mindshift-Podcast-Tile-703x703-1.jpg",
"imageAlt": "KQED MindShift: How We Will Learn",
"officialWebsiteLink": "/mindshift/",
"meta": {
"site": "news",
"source": "kqed",
"order": 12
},
"link": "/podcasts/mindshift",
"subscribe": {
"apple": "https://podcasts.apple.com/us/podcast/mindshift-podcast/id1078765985",
"google": "https://podcasts.google.com/feed/aHR0cHM6Ly9mZWVkcy5tZWdhcGhvbmUuZm0vS1FJTkM1NzY0NjAwNDI5",
"npr": "https://www.npr.org/podcasts/464615685/mind-shift-podcast",
"stitcher": "https://www.stitcher.com/podcast/kqed/stories-teachers-share",
"spotify": "https://open.spotify.com/show/0MxSpNYZKNprFLCl7eEtyx"
}
},
"morning-edition": {
"id": "morning-edition",
"title": "Morning Edition",
"info": "\u003cem>Morning Edition\u003c/em> takes listeners around the country and the world with multi-faceted stories and commentaries every weekday. Hosts Steve Inskeep, David Greene and Rachel Martin bring you the latest breaking news and features to prepare you for the day.",
"airtime": "MON-FRI 3am-9am",
"imageSrc": "https://cdn.kqed.org/wp-content/uploads/2024/04/Morning-Edition-Podcast-Tile-360x360-1.jpg",
"officialWebsiteLink": "https://www.npr.org/programs/morning-edition/",
"meta": {
"site": "news",
"source": "npr"
},
"link": "/radio/program/morning-edition"
},
"onourwatch": {
"id": "onourwatch",
"title": "On Our Watch",
"tagline": "Deeply-reported investigative journalism",
"info": "For decades, the process for how police police themselves has been inconsistent – if not opaque. In some states, like California, these proceedings were completely hidden. After a new police transparency law unsealed scores of internal affairs files, our reporters set out to examine these cases and the shadow world of police discipline. On Our Watch brings listeners into the rooms where officers are questioned and witnesses are interrogated to find out who this system is really protecting. Is it the officers, or the public they've sworn to serve?",
"imageSrc": "https://cdn.kqed.org/wp-content/uploads/2024/04/On-Our-Watch-Podcast-Tile-703x703-1.jpg",
"imageAlt": "On Our Watch from NPR and KQED",
"officialWebsiteLink": "/podcasts/onourwatch",
"meta": {
"site": "news",
"source": "kqed",
"order": 11
},
"link": "/podcasts/onourwatch",
"subscribe": {
"apple": "https://podcasts.apple.com/podcast/id1567098962",
"google": "https://podcasts.google.com/feed/aHR0cHM6Ly9mZWVkcy5ucHIub3JnLzUxMDM2MC9wb2RjYXN0LnhtbD9zYz1nb29nbGVwb2RjYXN0cw",
"npr": "https://rpb3r.app.goo.gl/onourwatch",
"spotify": "https://open.spotify.com/show/0OLWoyizopu6tY1XiuX70x",
"tuneIn": "https://tunein.com/radio/On-Our-Watch-p1436229/",
"stitcher": "https://www.stitcher.com/show/on-our-watch",
"rss": "https://feeds.npr.org/510360/podcast.xml"
}
},
"on-the-media": {
"id": "on-the-media",
"title": "On The Media",
"info": "Our weekly podcast explores how the media 'sausage' is made, casts an incisive eye on fluctuations in the marketplace of ideas, and examines threats to the freedom of information and expression in America and abroad. For one hour a week, the show tries to lift the veil from the process of \"making media,\" especially news media, because it's through that lens that we see the world and the world sees us",
"airtime": "SUN 2pm-3pm, MON 12am-1am",
"imageSrc": "https://ww2.kqed.org/radio/wp-content/uploads/sites/50/2018/04/onTheMedia.png",
"officialWebsiteLink": "https://www.wnycstudios.org/shows/otm",
"meta": {
"site": "news",
"source": "wnyc"
},
"link": "/radio/program/on-the-media",
"subscribe": {
"apple": "https://itunes.apple.com/us/podcast/on-the-media/id73330715?mt=2",
"tuneIn": "https://tunein.com/radio/On-the-Media-p69/",
"rss": "http://feeds.wnyc.org/onthemedia"
}
},
"pbs-newshour": {
"id": "pbs-newshour",
"title": "PBS NewsHour",
"info": "Analysis, background reports and updates from the PBS NewsHour putting today's news in context.",
"airtime": "MON-FRI 3pm-4pm",
"imageSrc": "https://cdn.kqed.org/wp-content/uploads/2024/04/PBS-News-Hour-Podcast-Tile-360x360-1.jpg",
"officialWebsiteLink": "https://www.pbs.org/newshour/",
"meta": {
"site": "news",
"source": "pbs"
},
"link": "/radio/program/pbs-newshour",
"subscribe": {
"apple": "https://itunes.apple.com/us/podcast/pbs-newshour-full-show/id394432287?mt=2",
"tuneIn": "https://tunein.com/radio/PBS-NewsHour---Full-Show-p425698/",
"rss": "https://www.pbs.org/newshour/feeds/rss/podcasts/show"
}
},
"perspectives": {
"id": "perspectives",
"title": "Perspectives",
"tagline": "KQED's series of daily listener commentaries since 1991",
"info": "KQED's series of daily listener commentaries since 1991.",
"imageSrc": "https://cdn.kqed.org/wp-content/uploads/2025/01/Perspectives_Tile_Final.jpg",
"imageAlt": "KQED Perspectives",
"officialWebsiteLink": "/perspectives/",
"meta": {
"site": "radio",
"source": "kqed",
"order": 14
},
"link": "/perspectives",
"subscribe": {
"apple": "https://podcasts.apple.com/us/podcast/id73801135",
"npr": "https://www.npr.org/podcasts/432309616/perspectives",
"rss": "https://ww2.kqed.org/perspectives/category/perspectives/feed/",
"google": "https://podcasts.google.com/feed/aHR0cHM6Ly93dzIua3FlZC5vcmcvcGVyc3BlY3RpdmVzL2NhdGVnb3J5L3BlcnNwZWN0aXZlcy9mZWVkLw"
}
},
"planet-money": {
"id": "planet-money",
"title": "Planet Money",
"info": "The economy explained. Imagine you could call up a friend and say, Meet me at the bar and tell me what's going on with the economy. Now imagine that's actually a fun evening.",
"airtime": "SUN 3pm-4pm",
"imageSrc": "https://ww2.kqed.org/radio/wp-content/uploads/sites/50/2018/04/planetmoney.jpg",
"officialWebsiteLink": "https://www.npr.org/sections/money/",
"meta": {
"site": "news",
"source": "npr"
},
"link": "/radio/program/planet-money",
"subscribe": {
"npr": "https://rpb3r.app.goo.gl/M4f5",
"apple": "https://itunes.apple.com/us/podcast/planet-money/id290783428?mt=2",
"tuneIn": "https://tunein.com/podcasts/Business--Economics-Podcasts/Planet-Money-p164680/",
"rss": "https://feeds.npr.org/510289/podcast.xml"
}
},
"politicalbreakdown": {
"id": "politicalbreakdown",
"title": "Political Breakdown",
"tagline": "Politics from a personal perspective",
"info": "Political Breakdown is a new series that explores the political intersection of California and the nation. Each week hosts Scott Shafer and Marisa Lagos are joined with a new special guest to unpack politics -- with personality — and offer an insider’s glimpse at how politics happens.",
"airtime": "THU 6:30pm-7pm",
"imageSrc": "https://cdn.kqed.org/wp-content/uploads/2024/04/Political-Breakdown-2024-Podcast-Tile-703x703-1.jpg",
"imageAlt": "KQED Political Breakdown",
"officialWebsiteLink": "/podcasts/politicalbreakdown",
"meta": {
"site": "radio",
"source": "kqed",
"order": 5
},
"link": "/podcasts/politicalbreakdown",
"subscribe": {
"apple": "https://podcasts.apple.com/us/podcast/political-breakdown/id1327641087",
"amazon": "https://music.amazon.com/podcasts/e0c2d153-ad36-4c8d-901d-f1da6a724824/political-breakdown",
"npr": "https://www.npr.org/podcasts/572155894/political-breakdown",
"stitcher": "https://www.stitcher.com/podcast/kqed/political-breakdown",
"spotify": "https://open.spotify.com/show/07RVyIjIdk2WDuVehvBMoN",
"rss": "https://ww2.kqed.org/news/tag/political-breakdown/feed/podcast"
}
},
"possible": {
"id": "possible",
"title": "Possible",
"info": "Possible is hosted by entrepreneur Reid Hoffman and writer Aria Finger. Together in Possible, Hoffman and Finger lead enlightening discussions about building a brighter collective future. The show features interviews with visionary guests like Trevor Noah, Sam Altman and Janette Sadik-Khan. Possible paints an optimistic portrait of the world we can create through science, policy, business, art and our shared humanity. It asks: What if everything goes right for once? How can we get there? Each episode also includes a short fiction story generated by advanced AI GPT-4, serving as a thought-provoking springboard to speculate how humanity could leverage technology for good.",
"airtime": "SUN 2pm",
"imageSrc": "https://cdn.kqed.org/wp-content/uploads/2024/04/Possible-Podcast-Tile-360x360-1.jpg",
"officialWebsiteLink": "https://www.possible.fm/",
"meta": {
"site": "news",
"source": "Possible"
},
"link": "/radio/program/possible",
"subscribe": {
"apple": "https://podcasts.apple.com/us/podcast/possible/id1677184070",
"spotify": "https://open.spotify.com/show/730YpdUSNlMyPQwNnyjp4k"
}
},
"pri-the-world": {
"id": "pri-the-world",
"title": "PRI's The World: Latest Edition",
"info": "Each weekday, host Marco Werman and his team of producers bring you the world's most interesting stories in an hour of radio that reminds us just how small our planet really is.",
"airtime": "MON-FRI 2pm-3pm",
"imageSrc": "https://cdn.kqed.org/wp-content/uploads/2024/04/The-World-Podcast-Tile-360x360-1.jpg",
"officialWebsiteLink": "https://www.pri.org/programs/the-world",
"meta": {
"site": "news",
"source": "PRI"
},
"link": "/radio/program/pri-the-world",
"subscribe": {
"apple": "https://itunes.apple.com/us/podcast/pris-the-world-latest-edition/id278196007?mt=2",
"tuneIn": "https://tunein.com/podcasts/News--Politics-Podcasts/PRIs-The-World-p24/",
"rss": "http://feeds.feedburner.com/pri/theworld"
}
},
"radiolab": {
"id": "radiolab",
"title": "Radiolab",
"info": "A two-time Peabody Award-winner, Radiolab is an investigation told through sounds and stories, and centered around one big idea. In the Radiolab world, information sounds like music and science and culture collide. Hosted by Jad Abumrad and Robert Krulwich, the show is designed for listeners who demand skepticism, but appreciate wonder. WNYC Studios is the producer of other leading podcasts including Freakonomics Radio, Death, Sex & Money, On the Media and many more.",
"airtime": "SUN 12am-1am, SAT 2pm-3pm",
"imageSrc": "https://ww2.kqed.org/radio/wp-content/uploads/sites/50/2018/04/radiolab1400.png",
"officialWebsiteLink": "https://www.wnycstudios.org/shows/radiolab/",
"meta": {
"site": "science",
"source": "WNYC"
},
"link": "/radio/program/radiolab",
"subscribe": {
"apple": "https://itunes.apple.com/us/podcast/radiolab/id152249110?mt=2",
"tuneIn": "https://tunein.com/radio/RadioLab-p68032/",
"rss": "https://feeds.wnyc.org/radiolab"
}
},
"reveal": {
"id": "reveal",
"title": "Reveal",
"info": "Created by The Center for Investigative Reporting and PRX, Reveal is public radios first one-hour weekly radio show and podcast dedicated to investigative reporting. Credible, fact based and without a partisan agenda, Reveal combines the power and artistry of driveway moment storytelling with data-rich reporting on critically important issues. The result is stories that inform and inspire, arming our listeners with information to right injustices, hold the powerful accountable and improve lives.Reveal is hosted by Al Letson and showcases the award-winning work of CIR and newsrooms large and small across the nation. In a radio and podcast market crowded with choices, Reveal focuses on important and often surprising stories that illuminate the world for our listeners.",
"airtime": "SAT 4pm-5pm",
"imageSrc": "https://ww2.kqed.org/radio/wp-content/uploads/sites/50/2018/04/reveal300px.png",
"officialWebsiteLink": "https://www.revealnews.org/episodes/",
"meta": {
"site": "news",
"source": "npr"
},
"link": "/radio/program/reveal",
"subscribe": {
"apple": "https://itunes.apple.com/us/podcast/reveal/id886009669",
"tuneIn": "https://tunein.com/radio/Reveal-p679597/",
"rss": "http://feeds.revealradio.org/revealpodcast"
}
},
"rightnowish": {
"id": "rightnowish",
"title": "Rightnowish",
"tagline": "Art is where you find it",
"info": "Rightnowish digs into life in the Bay Area right now… ish. Journalist Pendarvis Harshaw takes us to galleries painted on the sides of liquor stores in West Oakland. We'll dance in warehouses in the Bayview, make smoothies with kids in South Berkeley, and listen to classical music in a 1984 Cutlass Supreme in Richmond. Every week, Pen talks to movers and shakers about how the Bay Area shapes what they create, and how they shape the place we call home.",
"imageSrc": "https://cdn.kqed.org/wp-content/uploads/2024/04/Rightnowish-Podcast-Tile-500x500-1.jpg",
"imageAlt": "KQED Rightnowish with Pendarvis Harshaw",
"officialWebsiteLink": "/podcasts/rightnowish",
"meta": {
"site": "arts",
"source": "kqed",
"order": 16
},
"link": "/podcasts/rightnowish",
"subscribe": {
"npr": "https://www.npr.org/podcasts/721590300/rightnowish",
"rss": "https://ww2.kqed.org/arts/programs/rightnowish/feed/podcast",
"apple": "https://podcasts.apple.com/us/podcast/rightnowish/id1482187648",
"stitcher": "https://www.stitcher.com/podcast/kqed/rightnowish",
"google": "https://podcasts.google.com/feed/aHR0cHM6Ly9mZWVkcy5tZWdhcGhvbmUuZm0vS1FJTkMxMjU5MTY3NDc4",
"spotify": "https://open.spotify.com/show/7kEJuafTzTVan7B78ttz1I"
}
},
"science-friday": {
"id": "science-friday",
"title": "Science Friday",
"info": "Science Friday is a weekly science talk show, broadcast live over public radio stations nationwide. Each week, the show focuses on science topics that are in the news and tries to bring an educated, balanced discussion to bear on the scientific issues at hand. Panels of expert guests join host Ira Flatow, a veteran science journalist, to discuss science and to take questions from listeners during the call-in portion of the program.",
"airtime": "FRI 11am-1pm",
"imageSrc": "https://cdn.kqed.org/wp-content/uploads/2024/04/Science-Friday-Podcast-Tile-360x360-1.jpg",
"officialWebsiteLink": "https://www.wnycstudios.org/shows/science-friday",
"meta": {
"site": "news",
"source": "npr"
},
"link": "/radio/program/science-friday",
"subscribe": {
"apple": "https://itunes.apple.com/WebObjects/MZStore.woa/wa/viewPodcast?s=143441&mt=2&id=73329284&at=11l79Y&ct=nprdirectory",
"tuneIn": "https://tunein.com/radio/Science-Friday-p394/",
"rss": "http://feeds.wnyc.org/science-friday"
}
},
"snap-judgment": {
"id": "snap-judgment",
"title": "Snap Judgment",
"tagline": "Real stories with killer beats",
"info": "The Snap Judgment radio show and podcast mixes real stories with killer beats to produce cinematic, dramatic radio. Snap's musical brand of storytelling dares listeners to see the world through the eyes of another. This is storytelling... with a BEAT!! Snap first aired on public radio stations nationwide in July 2010. Today, Snap Judgment airs on over 450 public radio stations and is brought to the airwaves by KQED & PRX.",
"airtime": "SAT 1pm-2pm, 9pm-10pm",
"imageSrc": "https://cdn.kqed.org/wp-content/uploads/2024/05/Snap-Judgment-Podcast-Tile-703x703-1.jpg",
"imageAlt": "KQED Snap Judgment",
"officialWebsiteLink": "https://snapjudgment.org",
"meta": {
"site": "arts",
"source": "kqed",
"order": 4
},
"link": "https://snapjudgment.org",
"subscribe": {
"apple": "https://podcasts.apple.com/us/podcast/snap-judgment/id283657561",
"npr": "https://www.npr.org/podcasts/449018144/snap-judgment",
"stitcher": "https://www.pandora.com/podcast/snap-judgment/PC:241?source=stitcher-sunset",
"spotify": "https://open.spotify.com/show/3Cct7ZWmxHNAtLgBTqjC5v",
"rss": "https://snap.feed.snapjudgment.org/"
}
},
"soldout": {
"id": "soldout",
"title": "SOLD OUT: Rethinking Housing in America",
"tagline": "A new future for housing",
"info": "Sold Out: Rethinking Housing in America",
"imageSrc": "https://cdn.kqed.org/wp-content/uploads/2024/04/Sold-Out-Podcast-Tile-703x703-1.jpg",
"imageAlt": "KQED Sold Out: Rethinking Housing in America",
"officialWebsiteLink": "/podcasts/soldout",
"meta": {
"site": "news",
"source": "kqed",
"order": 13
},
"link": "/podcasts/soldout",
"subscribe": {
"npr": "https://www.npr.org/podcasts/911586047/s-o-l-d-o-u-t-a-new-future-for-housing",
"apple": "https://podcasts.apple.com/us/podcast/introducing-sold-out-rethinking-housing-in-america/id1531354937",
"rss": "https://feeds.megaphone.fm/soldout",
"spotify": "https://open.spotify.com/show/38dTBSk2ISFoPiyYNoKn1X",
"stitcher": "https://www.stitcher.com/podcast/kqed/sold-out-rethinking-housing-in-america",
"tunein": "https://tunein.com/radio/SOLD-OUT-Rethinking-Housing-in-America-p1365871/"
}
},
"spooked": {
"id": "spooked",
"title": "Spooked",
"tagline": "True-life supernatural stories",
"info": "",
"imageSrc": "https://cdn.kqed.org/wp-content/uploads/2024/10/Spooked-Podcast-Tile-703x703-1.jpg",
"imageAlt": "KQED Spooked",
"officialWebsiteLink": "https://spookedpodcast.org/",
"meta": {
"site": "news",
"source": "kqed",
"order": 7
},
"link": "https://spookedpodcast.org/",
"subscribe": {
"apple": "https://podcasts.apple.com/us/podcast/spooked/id1279361017",
"npr": "https://www.npr.org/podcasts/549547848/snap-judgment-presents-spooked",
"spotify": "https://open.spotify.com/show/76571Rfl3m7PLJQZKQIGCT",
"rss": "https://feeds.simplecast.com/TBotaapn"
}
},
"tech-nation": {
"id": "tech-nation",
"title": "Tech Nation Radio Podcast",
"info": "Tech Nation is a weekly public radio program, hosted by Dr. Moira Gunn. Founded in 1993, it has grown from a simple interview show to a multi-faceted production, featuring conversations with noted technology and science leaders, and a weekly science and technology-related commentary.",
"airtime": "FRI 10pm",
"imageSrc": "https://cdn.kqed.org/wp-content/uploads/2024/04/Tech-Nation-Radio-Podcast-Tile-360x360-1.jpg",
"officialWebsiteLink": "http://technation.podomatic.com/",
"meta": {
"site": "science",
"source": "Tech Nation Media"
},
"link": "/radio/program/tech-nation",
"subscribe": {
"rss": "https://technation.podomatic.com/rss2.xml"
}
},
"ted-radio-hour": {
"id": "ted-radio-hour",
"title": "TED Radio Hour",
"info": "The TED Radio Hour is a journey through fascinating ideas, astonishing inventions, fresh approaches to old problems, and new ways to think and create.",
"airtime": "SUN 3pm-4pm, SAT 10pm-11pm",
"imageSrc": "https://ww2.kqed.org/radio/wp-content/uploads/sites/50/2018/04/tedRadioHour.jpg",
"officialWebsiteLink": "https://www.npr.org/programs/ted-radio-hour/?showDate=2018-06-22",
"meta": {
"site": "news",
"source": "npr"
},
"link": "/radio/program/ted-radio-hour",
"subscribe": {
"npr": "https://rpb3r.app.goo.gl/8vsS",
"apple": "https://itunes.apple.com/WebObjects/MZStore.woa/wa/viewPodcast?s=143441&mt=2&id=523121474&at=11l79Y&ct=nprdirectory",
"tuneIn": "https://tunein.com/radio/TED-Radio-Hour-p418021/",
"rss": "https://feeds.npr.org/510298/podcast.xml"
}
},
"thebay": {
"id": "thebay",
"title": "The Bay",
"tagline": "Local news to keep you rooted",
"info": "Host Devin Katayama walks you through the biggest story of the day with reporters and newsmakers.",
"imageSrc": "https://cdn.kqed.org/wp-content/uploads/2024/04/The-Bay-Podcast-Tile-703x703-1.jpg",
"imageAlt": "KQED The Bay",
"officialWebsiteLink": "/podcasts/thebay",
"meta": {
"site": "radio",
"source": "kqed",
"order": 2
},
"link": "/podcasts/thebay",
"subscribe": {
"apple": "https://podcasts.apple.com/us/podcast/the-bay/id1350043452",
"amazon": "https://music.amazon.com/podcasts/d800ea4c-7a2c-42f2-b861-edaf78a5db0b/the-bay",
"npr": "https://www.npr.org/podcasts/586725995/the-bay",
"stitcher": "https://www.stitcher.com/podcast/kqed/the-bay",
"spotify": "https://open.spotify.com/show/4BIKBKIujizLHlIlBNaAqQ",
"rss": "https://feeds.megaphone.fm/KQINC8259786327"
}
},
"thelatest": {
"id": "thelatest",
"title": "The Latest",
"tagline": "Trusted local news in real time",
"info": "",
"imageSrc": "https://cdn.kqed.org/wp-content/uploads/2025/05/The-Latest-2025-Podcast-Tile-703x703-1.jpg",
"imageAlt": "KQED The Latest",
"officialWebsiteLink": "/thelatest",
"meta": {
"site": "news",
"source": "kqed",
"order": 6
},
"link": "/thelatest",
"subscribe": {
"apple": "https://podcasts.apple.com/us/podcast/the-latest-from-kqed/id1197721799",
"npr": "https://www.npr.org/podcasts/1257949365/the-latest-from-k-q-e-d",
"spotify": "https://open.spotify.com/show/5KIIXMgM9GTi5AepwOYvIZ?si=bd3053fec7244dba",
"rss": "https://feeds.megaphone.fm/KQINC9137121918"
}
},
"theleap": {
"id": "theleap",
"title": "The Leap",
"tagline": "What if you closed your eyes, and jumped?",
"info": "Stories about people making dramatic, risky changes, told by award-winning public radio reporter Judy Campbell.",
"imageSrc": "https://cdn.kqed.org/wp-content/uploads/2024/04/The-Leap-Podcast-Tile-703x703-1.jpg",
"imageAlt": "KQED The Leap",
"officialWebsiteLink": "/podcasts/theleap",
"meta": {
"site": "news",
"source": "kqed",
"order": 17
},
"link": "/podcasts/theleap",
"subscribe": {
"apple": "https://podcasts.apple.com/us/podcast/the-leap/id1046668171",
"npr": "https://www.npr.org/podcasts/447248267/the-leap",
"stitcher": "https://www.stitcher.com/podcast/kqed/the-leap",
"spotify": "https://open.spotify.com/show/3sSlVHHzU0ytLwuGs1SD1U",
"rss": "https://ww2.kqed.org/news/programs/the-leap/feed/podcast"
}
},
"the-moth-radio-hour": {
"id": "the-moth-radio-hour",
"title": "The Moth Radio Hour",
"info": "Since its launch in 1997, The Moth has presented thousands of true stories, told live and without notes, to standing-room-only crowds worldwide. Moth storytellers stand alone, under a spotlight, with only a microphone and a roomful of strangers. The storyteller and the audience embark on a high-wire act of shared experience which is both terrifying and exhilarating. Since 2008, The Moth podcast has featured many of our favorite stories told live on Moth stages around the country. For information on all of our programs and live events, visit themoth.org.",
"airtime": "SAT 8pm-9pm and SUN 11am-12pm",
"imageSrc": "https://ww2.kqed.org/radio/wp-content/uploads/sites/50/2018/04/theMoth.jpg",
"officialWebsiteLink": "https://themoth.org/",
"meta": {
"site": "arts",
"source": "prx"
},
"link": "/radio/program/the-moth-radio-hour",
"subscribe": {
"apple": "https://itunes.apple.com/us/podcast/the-moth-podcast/id275699983?mt=2",
"tuneIn": "https://tunein.com/radio/The-Moth-p273888/",
"rss": "http://feeds.themoth.org/themothpodcast"
}
},
"the-new-yorker-radio-hour": {
"id": "the-new-yorker-radio-hour",
"title": "The New Yorker Radio Hour",
"info": "The New Yorker Radio Hour is a weekly program presented by the magazine's editor, David Remnick, and produced by WNYC Studios and The New Yorker. Each episode features a diverse mix of interviews, profiles, storytelling, and an occasional burst of humor inspired by the magazine, and shaped by its writers, artists, and editors. This isn't a radio version of a magazine, but something all its own, reflecting the rich possibilities of audio storytelling and conversation. Theme music for the show was composed and performed by Merrill Garbus of tUnE-YArDs.",
"airtime": "SAT 10am-11am",
"imageSrc": "https://cdn.kqed.org/wp-content/uploads/2024/04/The-New-Yorker-Podcast-Tile-360x360-1.jpg",
"officialWebsiteLink": "https://www.wnycstudios.org/shows/tnyradiohour",
"meta": {
"site": "arts",
"source": "WNYC"
},
"link": "/radio/program/the-new-yorker-radio-hour",
"subscribe": {
"apple": "https://itunes.apple.com/us/podcast/id1050430296",
"tuneIn": "https://tunein.com/podcasts/WNYC-Podcasts/New-Yorker-Radio-Hour-p803804/",
"rss": "https://feeds.feedburner.com/newyorkerradiohour"
}
},
"the-sam-sanders-show": {
"id": "the-sam-sanders-show",
"title": "The Sam Sanders Show",
"info": "One of public radio's most dynamic voices, Sam Sanders helped launch The NPR Politics Podcast and hosted NPR's hit show It's Been A Minute. Now, the award-winning host returns with something brand new, The Sam Sanders Show. Every week, Sam Sanders and friends dig into the culture that shapes our lives: what's driving the biggest trends, how artists really think, and even the memes you can't stop scrolling past. Sam is beloved for his way of unpacking the world and bringing you up close to fresh currents and engaging conversations. The Sam Sanders Show is smart, funny and always a good time.",
"airtime": "FRI 12-1pm AND SAT 11am-12pm",
"imageSrc": "https://cdn.kqed.org/wp-content/uploads/2025/11/The-Sam-Sanders-Show-Podcast-Tile-400x400-1.jpg",
"officialWebsiteLink": "https://www.kcrw.com/shows/the-sam-sanders-show/latest",
"meta": {
"site": "arts",
"source": "KCRW"
},
"link": "https://www.kcrw.com/shows/the-sam-sanders-show/latest",
"subscribe": {
"rss": "https://feed.cdnstream1.com/zjb/feed/download/ac/28/59/ac28594c-e1d0-4231-8728-61865cdc80e8.xml"
}
},
"the-splendid-table": {
"id": "the-splendid-table",
"title": "The Splendid Table",
"info": "\u003cem>The Splendid Table\u003c/em> hosts our nation's conversations about cooking, sustainability and food culture.",
"imageSrc": "https://cdn.kqed.org/wp-content/uploads/2024/04/The-Splendid-Table-Podcast-Tile-360x360-1.jpg",
"officialWebsiteLink": "https://www.splendidtable.org/",
"airtime": "SUN 10-11 pm",
"meta": {
"site": "radio",
"source": "npr"
},
"link": "/radio/program/the-splendid-table"
},
"this-american-life": {
"id": "this-american-life",
"title": "This American Life",
"info": "This American Life is a weekly public radio show, heard by 2.2 million people on more than 500 stations. Another 2.5 million people download the weekly podcast. It is hosted by Ira Glass, produced in collaboration with Chicago Public Media, delivered to stations by PRX The Public Radio Exchange, and has won all of the major broadcasting awards.",
"airtime": "SAT 12pm-1pm, 7pm-8pm",
"imageSrc": "https://ww2.kqed.org/radio/wp-content/uploads/sites/50/2018/04/thisAmericanLife.png",
"officialWebsiteLink": "https://www.thisamericanlife.org/",
"meta": {
"site": "news",
"source": "wbez"
},
"link": "/radio/program/this-american-life",
"subscribe": {
"apple": "https://itunes.apple.com/WebObjects/MZStore.woa/wa/viewPodcast?s=143441&mt=2&id=201671138&at=11l79Y&ct=nprdirectory",
"rss": "https://www.thisamericanlife.org/podcast/rss.xml"
}
},
"tinydeskradio": {
"id": "tinydeskradio",
"title": "Tiny Desk Radio",
"info": "We're bringing the best of Tiny Desk to the airwaves, only on public radio.",
"airtime": "SUN 8pm and SAT 9pm",
"imageSrc": "https://cdn.kqed.org/wp-content/uploads/2025/04/300x300-For-Member-Station-Logo-Tiny-Desk-Radio-@2x.png",
"officialWebsiteLink": "https://www.npr.org/series/g-s1-52030/tiny-desk-radio",
"meta": {
"site": "news",
"source": "npr"
},
"link": "/radio/program/tinydeskradio",
"subscribe": {
"rss": "https://feeds.npr.org/g-s1-52030/rss.xml"
}
},
"wait-wait-dont-tell-me": {
"id": "wait-wait-dont-tell-me",
"title": "Wait Wait... Don't Tell Me!",
"info": "Peter Sagal and Bill Kurtis host the weekly NPR News quiz show alongside some of the best and brightest news and entertainment personalities.",
"airtime": "SUN 10am-11am, SAT 11am-12pm, SAT 6pm-7pm",
"imageSrc": "https://cdn.kqed.org/wp-content/uploads/2024/04/Wait-Wait-Podcast-Tile-300x300-1.jpg",
"officialWebsiteLink": "https://www.npr.org/programs/wait-wait-dont-tell-me/",
"meta": {
"site": "news",
"source": "npr"
},
"link": "/radio/program/wait-wait-dont-tell-me",
"subscribe": {
"npr": "https://rpb3r.app.goo.gl/Xogv",
"apple": "https://itunes.apple.com/WebObjects/MZStore.woa/wa/viewPodcast?s=143441&mt=2&id=121493804&at=11l79Y&ct=nprdirectory",
"tuneIn": "https://tunein.com/radio/Wait-Wait-Dont-Tell-Me-p46/",
"rss": "https://feeds.npr.org/344098539/podcast.xml"
}
},
"weekend-edition-saturday": {
"id": "weekend-edition-saturday",
"title": "Weekend Edition Saturday",
"info": "Weekend Edition Saturday wraps up the week's news and offers a mix of analysis and features on a wide range of topics, including arts, sports, entertainment, and human interest stories. The two-hour program is hosted by NPR's Peabody Award-winning Scott Simon.",
"airtime": "SAT 5am-10am",
"imageSrc": "https://cdn.kqed.org/wp-content/uploads/2024/04/Weekend-Edition-Podcast-Tile-360x360-1.jpg",
"officialWebsiteLink": "https://www.npr.org/programs/weekend-edition-saturday/",
"meta": {
"site": "news",
"source": "npr"
},
"link": "/radio/program/weekend-edition-saturday"
},
"weekend-edition-sunday": {
"id": "weekend-edition-sunday",
"title": "Weekend Edition Sunday",
"info": "Weekend Edition Sunday features interviews with newsmakers, artists, scientists, politicians, musicians, writers, theologians and historians. The program has covered news events from Nelson Mandela's 1990 release from a South African prison to the capture of Saddam Hussein.",
"airtime": "SUN 5am-10am",
"imageSrc": "https://cdn.kqed.org/wp-content/uploads/2024/04/Weekend-Edition-Podcast-Tile-360x360-1.jpg",
"officialWebsiteLink": "https://www.npr.org/programs/weekend-edition-sunday/",
"meta": {
"site": "news",
"source": "npr"
},
"link": "/radio/program/weekend-edition-sunday"
}
},
"racesReducer": {},
"racesGenElectionReducer": {},
"racesGenElection2026Reducer": {},
"racesGeneralEl2026Reducer": {},
"radioSchedulesReducer": {},
"listsReducer": {
"posts/science?tag=el-nino": {
"isFetching": false,
"latestQuery": {
"from": 12,
"size": 12
},
"vitalsOnly": false,
"totalRequested": 12,
"isLoading": false,
"isLoadingMore": true,
"total": {
"value": 37,
"relation": "eq"
},
"items": [
"science_581726",
"science_560497",
"science_536769",
"science_502283",
"science_499218",
"science_458878",
"science_403806",
"science_368478",
"science_367043",
"science_317772",
"science_255377",
"science_270178"
],
"complete": true
}
},
"recallGuideReducer": {
"intros": {},
"policy": {},
"candidates": {}
},
"savedArticleReducer": {
"articles": [],
"status": {}
},
"newslettersReducer": {
"isFetching": false,
"fetchFailed": false,
"hasFetched": false,
"newsletters": {},
"isSubscribing": false,
"isUnsubscribing": false,
"subscribedNewsletters": {}
},
"termsReducer": {
"about": {
"name": "About",
"type": "terms",
"id": "about",
"slug": "about",
"link": "/about",
"taxonomy": "site"
},
"arts": {
"name": "Arts & Culture",
"grouping": [
"arts",
"pop",
"trulyca"
],
"description": "KQED Arts provides daily in-depth coverage of the Bay Area's music, art, film, performing arts, literature and arts news, as well as cultural commentary and criticism.",
"type": "terms",
"id": "arts",
"slug": "arts",
"link": "/arts",
"taxonomy": "site"
},
"artschool": {
"name": "Art School",
"parent": "arts",
"type": "terms",
"id": "artschool",
"slug": "artschool",
"link": "/artschool",
"taxonomy": "site"
},
"bayareabites": {
"name": "KQED food",
"grouping": [
"food",
"bayareabites",
"checkplease"
],
"parent": "food",
"type": "terms",
"id": "bayareabites",
"slug": "bayareabites",
"link": "/food",
"taxonomy": "site"
},
"bayareahiphop": {
"name": "Bay Area Hiphop",
"type": "terms",
"id": "bayareahiphop",
"slug": "bayareahiphop",
"link": "/bayareahiphop",
"taxonomy": "site"
},
"campaign21": {
"name": "Campaign 21",
"type": "terms",
"id": "campaign21",
"slug": "campaign21",
"link": "/campaign21",
"taxonomy": "site"
},
"careers": {
"name": "Careers",
"type": "terms",
"id": "careers",
"slug": "careers",
"link": "/careers",
"taxonomy": "site"
},
"checkplease": {
"name": "KQED food",
"grouping": [
"food",
"bayareabites",
"checkplease"
],
"parent": "food",
"type": "terms",
"id": "checkplease",
"slug": "checkplease",
"link": "/food",
"taxonomy": "site"
},
"education": {
"name": "Education",
"grouping": [
"education"
],
"type": "terms",
"id": "education",
"slug": "education",
"link": "/education",
"taxonomy": "site"
},
"elections": {
"name": "Elections",
"type": "terms",
"id": "elections",
"slug": "elections",
"link": "/elections",
"taxonomy": "site"
},
"events": {
"name": "Events",
"type": "terms",
"id": "events",
"slug": "events",
"link": "/events",
"taxonomy": "site"
},
"event": {
"name": "Event",
"alias": "events",
"type": "terms",
"id": "event",
"slug": "event",
"link": "/event",
"taxonomy": "site"
},
"filmschoolshorts": {
"name": "Film School Shorts",
"type": "terms",
"id": "filmschoolshorts",
"slug": "filmschoolshorts",
"link": "/filmschoolshorts",
"taxonomy": "site"
},
"food": {
"name": "KQED food",
"grouping": [
"food",
"bayareabites",
"checkplease"
],
"type": "terms",
"id": "food",
"slug": "food",
"link": "/food",
"taxonomy": "site"
},
"forum": {
"name": "Forum",
"relatedContentQuery": "posts/forum?",
"parent": "news",
"type": "terms",
"id": "forum",
"slug": "forum",
"link": "/forum",
"taxonomy": "site"
},
"futureofyou": {
"name": "Future of You",
"grouping": [
"science",
"futureofyou"
],
"parent": "science",
"type": "terms",
"id": "futureofyou",
"slug": "futureofyou",
"link": "/futureofyou",
"taxonomy": "site"
},
"jpepinheart": {
"name": "KQED food",
"relatedContentQuery": "posts/food,bayareabites,checkplease",
"parent": "food",
"type": "terms",
"id": "jpepinheart",
"slug": "jpepinheart",
"link": "/food",
"taxonomy": "site"
},
"liveblog": {
"name": "Live Blog",
"type": "terms",
"id": "liveblog",
"slug": "liveblog",
"link": "/liveblog",
"taxonomy": "site"
},
"livetv": {
"name": "Live TV",
"parent": "tv",
"type": "terms",
"id": "livetv",
"slug": "livetv",
"link": "/livetv",
"taxonomy": "site"
},
"lowdown": {
"name": "The Lowdown",
"relatedContentQuery": "posts/lowdown?",
"parent": "news",
"type": "terms",
"id": "lowdown",
"slug": "lowdown",
"link": "/lowdown",
"taxonomy": "site"
},
"mindshift": {
"name": "Mindshift",
"parent": "news",
"description": "MindShift explores the future of education by highlighting the innovative – and sometimes counterintuitive – ways educators and parents are helping all children succeed.",
"type": "terms",
"id": "mindshift",
"slug": "mindshift",
"link": "/mindshift",
"taxonomy": "site"
},
"news": {
"name": "News",
"grouping": [
"news",
"forum"
],
"type": "terms",
"id": "news",
"slug": "news",
"link": "/news",
"taxonomy": "site"
},
"newsletters": {
"name": "newsletters",
"type": "terms",
"id": "newsletters",
"slug": "newsletters",
"link": "/newsletters",
"taxonomy": "site"
},
"perspectives": {
"name": "Perspectives",
"parent": "radio",
"type": "terms",
"id": "perspectives",
"slug": "perspectives",
"link": "/perspectives",
"taxonomy": "site"
},
"podcasts": {
"name": "Podcasts",
"type": "terms",
"id": "podcasts",
"slug": "podcasts",
"link": "/podcasts",
"taxonomy": "site"
},
"pop": {
"name": "Pop",
"parent": "arts",
"type": "terms",
"id": "pop",
"slug": "pop",
"link": "/pop",
"taxonomy": "site"
},
"pressroom": {
"name": "Pressroom",
"type": "terms",
"id": "pressroom",
"slug": "pressroom",
"link": "/pressroom",
"taxonomy": "site"
},
"quest": {
"name": "Quest",
"parent": "science",
"type": "terms",
"id": "quest",
"slug": "quest",
"link": "/quest",
"taxonomy": "site"
},
"radio": {
"name": "Radio",
"grouping": [
"forum",
"perspectives"
],
"description": "Listen to KQED Public Radio – home of Forum and The California Report – on 88.5 FM in San Francisco, 89.3 FM in Sacramento, 88.3 FM in Santa Rosa and 88.1 FM in Martinez.",
"type": "terms",
"id": "radio",
"slug": "radio",
"link": "/radio",
"taxonomy": "site"
},
"root": {
"name": "KQED",
"image": "https://ww2.kqed.org/app/uploads/2020/02/KQED-OG-Image@1x.png",
"imageWidth": 1200,
"imageHeight": 630,
"headData": {
"title": "KQED | News, Radio, Podcasts, TV | Public Media for Northern California",
"description": "KQED provides public radio, television, and independent reporting on issues that matter to the Bay Area. We’re the NPR and PBS member station for Northern California."
},
"type": "terms",
"id": "root",
"slug": "root",
"link": "/root",
"taxonomy": "site"
},
"science": {
"name": "Science",
"grouping": [
"science",
"futureofyou"
],
"description": "KQED Science brings you award-winning science and environment coverage from the Bay Area and beyond.",
"type": "terms",
"id": "science",
"slug": "science",
"link": "/science",
"taxonomy": "site"
},
"stateofhealth": {
"name": "State of Health",
"parent": "science",
"type": "terms",
"id": "stateofhealth",
"slug": "stateofhealth",
"link": "/stateofhealth",
"taxonomy": "site"
},
"support": {
"name": "Support",
"type": "terms",
"id": "support",
"slug": "support",
"link": "/support",
"taxonomy": "site"
},
"thedolist": {
"name": "The Do List",
"parent": "arts",
"type": "terms",
"id": "thedolist",
"slug": "thedolist",
"link": "/thedolist",
"taxonomy": "site"
},
"trulyca": {
"name": "Truly CA",
"grouping": [
"arts",
"pop",
"trulyca"
],
"parent": "arts",
"type": "terms",
"id": "trulyca",
"slug": "trulyca",
"link": "/trulyca",
"taxonomy": "site"
},
"tv": {
"name": "TV",
"type": "terms",
"id": "tv",
"slug": "tv",
"link": "/tv",
"taxonomy": "site"
},
"voterguide": {
"name": "Voter Guide",
"parent": "elections",
"alias": "elections",
"type": "terms",
"id": "voterguide",
"slug": "voterguide",
"link": "/voterguide",
"taxonomy": "site"
},
"guiaelectoral": {
"name": "Guia Electoral",
"parent": "elections",
"alias": "elections",
"type": "terms",
"id": "guiaelectoral",
"slug": "guiaelectoral",
"link": "/guiaelectoral",
"taxonomy": "site"
},
"science_tag_el-nino": {
"isLoading": true
},
"science_371": {
"type": "terms",
"id": "science_371",
"meta": {
"index": "terms_1716263798",
"site": "science",
"id": "371",
"found": true
},
"relationships": {},
"featImg": null,
"name": "el nino",
"description": null,
"taxonomy": "tag",
"headData": {
"twImgId": null,
"twTitle": null,
"ogTitle": null,
"ogImgId": null,
"twDescription": null,
"description": null,
"title": "el nino Archives | KQED Science",
"ogDescription": null
},
"ttid": 377,
"slug": "el-nino",
"isLoading": false,
"link": "/science/tag/el-nino"
},
"source_science_499218": {
"type": "terms",
"id": "source_science_499218",
"meta": {
"override": true
},
"name": "Geology",
"isLoading": false
},
"source_science_367043": {
"type": "terms",
"id": "source_science_367043",
"meta": {
"override": true
},
"name": "KQED Science",
"link": "https://ww2.kqed.org/science/",
"isLoading": false
},
"science_31": {
"type": "terms",
"id": "science_31",
"meta": {
"index": "terms_1716263798",
"site": "science",
"id": "31",
"found": true
},
"relationships": {},
"featImg": null,
"name": "Climate",
"description": null,
"taxonomy": "category",
"headData": {
"twImgId": null,
"twTitle": null,
"ogTitle": null,
"ogImgId": null,
"twDescription": null,
"description": null,
"title": "Climate Archives | KQED Science",
"ogDescription": null
},
"ttid": 33,
"slug": "climate",
"isLoading": false,
"link": "/science/category/climate"
},
"science_40": {
"type": "terms",
"id": "science_40",
"meta": {
"index": "terms_1716263798",
"site": "science",
"id": "40",
"found": true
},
"relationships": {},
"featImg": null,
"name": "News",
"description": null,
"taxonomy": "category",
"headData": {
"twImgId": null,
"twTitle": null,
"ogTitle": null,
"ogImgId": null,
"twDescription": null,
"description": null,
"title": "News Archives | KQED Science",
"ogDescription": null
},
"ttid": 42,
"slug": "news",
"isLoading": false,
"link": "/science/category/news"
},
"science_1678": {
"type": "terms",
"id": "science_1678",
"meta": {
"index": "terms_1716263798",
"site": "science",
"id": "1678",
"found": true
},
"relationships": {},
"featImg": null,
"name": "climate central",
"description": null,
"taxonomy": "tag",
"headData": {
"twImgId": null,
"twTitle": null,
"ogTitle": null,
"ogImgId": null,
"twDescription": null,
"description": null,
"title": "climate central Archives | KQED Science",
"ogDescription": null
},
"ttid": 1687,
"slug": "climate-central",
"isLoading": false,
"link": "/science/tag/climate-central"
},
"science_194": {
"type": "terms",
"id": "science_194",
"meta": {
"index": "terms_1716263798",
"site": "science",
"id": "194",
"found": true
},
"relationships": {},
"featImg": null,
"name": "climate change",
"description": null,
"taxonomy": "tag",
"headData": {
"twImgId": null,
"twTitle": null,
"ogTitle": null,
"ogImgId": null,
"twDescription": null,
"description": null,
"title": "climate change Archives | KQED Science",
"ogDescription": null
},
"ttid": 198,
"slug": "climate-change",
"isLoading": false,
"link": "/science/tag/climate-change"
},
"science_1151": {
"type": "terms",
"id": "science_1151",
"meta": {
"index": "terms_1716263798",
"site": "science",
"id": "1151",
"found": true
},
"relationships": {},
"featImg": null,
"name": "Drought Watch",
"description": "\u003cem>What California's reservoirs look like right now (From KQED's \u003ca href=\"http://ww2.kqed.org/lowdown/\">The Lowdown\u003c/a>)\u003c/em>\r\n\r\n[iframe src=\"http://kroodsma.com/KQED/water-supply-master/public/map.html\" width=\"640\" height=\"720\" frameborder=\"0\" scrolling=\"no\"]\r\n\r\n\u003cem>We’re collecting all of our California drought coverage here, starting with the current state of the drought, then providing the \u003ca href=\"#background\">background\u003c/a> and rounding up \u003ca href=\"#river\">all the stories\u003c/a> we’ve produced.\u003c/em>\r\n\r\n\u003cstrong>Relief at Last\r\n\u003c/strong>\r\n\r\nIn early April, after more than five years of the most withering drought on record, California Governor Jerry Brown finally lifted the emergency drought order he issued in January of 2014. By that time, the record-setting winter of 2016-17 had removed all doubt that the drought was over, though concerns over depleted groundwater levels still remain. According to the \u003ca href=\"http://droughtmonitor.unl.edu/\" target=\"_blank\">U.S. Drought Monitor\u003c/a>, less than 10 percent of California remains in “moderate drought” — compared to nearly 100 percent of the state a year ago.\r\n\r\n[http_redir]",
"taxonomy": "series",
"headData": {
"twImgId": null,
"twTitle": null,
"ogTitle": null,
"ogImgId": null,
"twDescription": null,
"description": "What California's reservoirs look like right now (From KQED's The Lowdown) [iframe src=\"http://kroodsma.com/KQED/water-supply-master/public/map.html\" width=\"640\" height=\"720\" frameborder=\"0\" scrolling=\"no\"] We’re collecting all of our California drought coverage here, starting with the current state of the drought, then providing the background and rounding up all the stories we’ve produced. Relief at Last In early April, after more than five years of the most withering drought on record, California Governor Jerry Brown finally lifted the emergency drought order he issued in January of 2014. By that time, the record-setting winter of 2016-17 had removed all doubt that the drought was over, though concerns over depleted groundwater levels still remain. According to the U.S. Drought Monitor, less than 10 percent of California remains in “moderate drought” — compared to nearly 100 percent of the state a year ago. [http_redir]",
"title": "Drought Watch Archives | KQED Science",
"ogDescription": null
},
"ttid": 1160,
"slug": "california-drought-watch",
"isLoading": false,
"link": "/science/series/california-drought-watch"
},
"science_98": {
"type": "terms",
"id": "science_98",
"meta": {
"index": "terms_1716263798",
"site": "science",
"id": "98",
"found": true
},
"relationships": {},
"featImg": null,
"name": "Water",
"description": null,
"taxonomy": "category",
"headData": {
"twImgId": null,
"twTitle": null,
"ogTitle": null,
"ogImgId": null,
"twDescription": null,
"description": null,
"title": "Water Archives | KQED Science",
"ogDescription": null
},
"ttid": 102,
"slug": "water",
"isLoading": false,
"link": "/science/category/water"
},
"science_1622": {
"type": "terms",
"id": "science_1622",
"meta": {
"index": "terms_1716263798",
"site": "science",
"id": "1622",
"found": true
},
"relationships": {},
"featImg": null,
"name": "California drought",
"description": null,
"taxonomy": "tag",
"headData": {
"twImgId": null,
"twTitle": null,
"ogTitle": null,
"ogImgId": null,
"twDescription": null,
"description": null,
"title": "California drought Archives | KQED Science",
"ogDescription": null
},
"ttid": 1631,
"slug": "california-drought",
"isLoading": false,
"link": "/science/tag/california-drought"
},
"science_2873": {
"type": "terms",
"id": "science_2873",
"meta": {
"index": "terms_1716263798",
"site": "science",
"id": "2873",
"found": true
},
"relationships": {},
"featImg": null,
"name": "Oceans",
"description": null,
"taxonomy": "category",
"headData": {
"twImgId": null,
"twTitle": null,
"ogTitle": null,
"ogImgId": null,
"twDescription": null,
"description": null,
"title": "Oceans Archives | KQED Science",
"ogDescription": null
},
"ttid": 2873,
"slug": "oceans",
"isLoading": false,
"link": "/science/category/oceans"
},
"science_1462": {
"type": "terms",
"id": "science_1462",
"meta": {
"index": "terms_1716263798",
"site": "science",
"id": "1462",
"found": true
},
"relationships": {},
"featImg": null,
"name": "Sierra snowpack",
"description": null,
"taxonomy": "tag",
"headData": {
"twImgId": null,
"twTitle": null,
"ogTitle": null,
"ogImgId": null,
"twDescription": null,
"description": null,
"title": "Sierra snowpack Archives | KQED Science",
"ogDescription": null
},
"ttid": 1471,
"slug": "sierra-snowpack",
"isLoading": false,
"link": "/science/tag/sierra-snowpack"
},
"science_572": {
"type": "terms",
"id": "science_572",
"meta": {
"index": "terms_1716263798",
"site": "science",
"id": "572",
"found": true
},
"relationships": {},
"featImg": null,
"name": "drought",
"description": null,
"taxonomy": "tag",
"headData": {
"twImgId": null,
"twTitle": null,
"ogTitle": null,
"ogImgId": null,
"twDescription": null,
"description": null,
"title": "drought Archives | KQED Science",
"ogDescription": null
},
"ttid": 578,
"slug": "drought",
"isLoading": false,
"link": "/science/tag/drought"
},
"science_1004": {
"type": "terms",
"id": "science_1004",
"meta": {
"index": "terms_1716263798",
"site": "science",
"id": "1004",
"found": true
},
"relationships": {},
"featImg": null,
"name": "precipitation",
"description": null,
"taxonomy": "tag",
"headData": {
"twImgId": null,
"twTitle": null,
"ogTitle": null,
"ogImgId": null,
"twDescription": null,
"description": null,
"title": "precipitation Archives | KQED Science",
"ogDescription": null
},
"ttid": 1012,
"slug": "precipitation",
"isLoading": false,
"link": "/science/tag/precipitation"
},
"science_46": {
"type": "terms",
"id": "science_46",
"meta": {
"index": "terms_1716263798",
"site": "science",
"id": "46",
"found": true
},
"relationships": {},
"featImg": null,
"name": "Audio",
"description": null,
"taxonomy": "category",
"headData": {
"twImgId": null,
"twTitle": null,
"ogTitle": null,
"ogImgId": null,
"twDescription": null,
"description": null,
"title": "Audio Archives | KQED Science",
"ogDescription": null
},
"ttid": 48,
"slug": "audio",
"isLoading": false,
"link": "/science/category/audio"
},
"science_38": {
"type": "terms",
"id": "science_38",
"meta": {
"index": "terms_1716263798",
"site": "science",
"id": "38",
"found": true
},
"relationships": {},
"featImg": null,
"name": "Geology",
"description": null,
"taxonomy": "category",
"headData": {
"twImgId": null,
"twTitle": null,
"ogTitle": null,
"ogImgId": null,
"twDescription": null,
"description": null,
"title": "Geology Archives | KQED Science",
"ogDescription": null
},
"ttid": 40,
"slug": "geology",
"isLoading": false,
"link": "/science/category/geology"
},
"science_43": {
"type": "terms",
"id": "science_43",
"meta": {
"index": "terms_1716263798",
"site": "science",
"id": "43",
"found": true
},
"relationships": {},
"featImg": null,
"name": "Radio",
"description": null,
"taxonomy": "category",
"headData": {
"twImgId": null,
"twTitle": null,
"ogTitle": null,
"ogImgId": null,
"twDescription": null,
"description": null,
"title": "Radio Archives | KQED Science",
"ogDescription": null
},
"ttid": 45,
"slug": "radio",
"isLoading": false,
"link": "/science/category/radio"
},
"science_1213": {
"type": "terms",
"id": "science_1213",
"meta": {
"index": "terms_1716263798",
"site": "science",
"id": "1213",
"found": true
},
"relationships": {},
"featImg": null,
"name": "rain",
"description": null,
"taxonomy": "tag",
"headData": {
"twImgId": null,
"twTitle": null,
"ogTitle": null,
"ogImgId": null,
"twDescription": null,
"description": null,
"title": "rain Archives | KQED Science",
"ogDescription": null
},
"ttid": 1222,
"slug": "rain",
"isLoading": false,
"link": "/science/tag/rain"
},
"science_107": {
"type": "terms",
"id": "science_107",
"meta": {
"index": "terms_1716263798",
"site": "science",
"id": "107",
"found": true
},
"relationships": {},
"featImg": null,
"name": "snow",
"description": null,
"taxonomy": "tag",
"headData": {
"twImgId": null,
"twTitle": null,
"ogTitle": null,
"ogImgId": null,
"twDescription": null,
"description": null,
"title": "snow Archives | KQED Science",
"ogDescription": null
},
"ttid": 111,
"slug": "snow",
"isLoading": false,
"link": "/science/tag/snow"
},
"science_35": {
"type": "terms",
"id": "science_35",
"meta": {
"index": "terms_1716263798",
"site": "science",
"id": "35",
"found": true
},
"relationships": {},
"featImg": null,
"name": "Environment",
"description": null,
"taxonomy": "category",
"headData": {
"twImgId": null,
"twTitle": null,
"ogTitle": null,
"ogImgId": null,
"twDescription": null,
"description": null,
"title": "Environment Archives | KQED Science",
"ogDescription": null
},
"ttid": 37,
"slug": "environment",
"isLoading": false,
"link": "/science/category/environment"
},
"science_182": {
"type": "terms",
"id": "science_182",
"meta": {
"index": "terms_1716263798",
"site": "science",
"id": "182",
"found": true
},
"relationships": {},
"featImg": null,
"name": "climate",
"description": null,
"taxonomy": "tag",
"headData": {
"twImgId": null,
"twTitle": null,
"ogTitle": null,
"ogImgId": null,
"twDescription": null,
"description": null,
"title": "climate Archives | KQED Science",
"ogDescription": null
},
"ttid": 186,
"slug": "climate-2",
"isLoading": false,
"link": "/science/tag/climate-2"
},
"science_316": {
"type": "terms",
"id": "science_316",
"meta": {
"index": "terms_1716263798",
"site": "science",
"id": "316",
"found": true
},
"relationships": {},
"featImg": null,
"name": "FEMA",
"description": null,
"taxonomy": "tag",
"headData": {
"twImgId": null,
"twTitle": null,
"ogTitle": null,
"ogImgId": null,
"twDescription": null,
"description": null,
"title": "FEMA Archives | KQED Science",
"ogDescription": null
},
"ttid": 322,
"slug": "fema",
"isLoading": false,
"link": "/science/tag/fema"
},
"science_365": {
"type": "terms",
"id": "science_365",
"meta": {
"index": "terms_1716263798",
"site": "science",
"id": "365",
"found": true
},
"relationships": {},
"featImg": null,
"name": "weather",
"description": null,
"taxonomy": "tag",
"headData": {
"twImgId": null,
"twTitle": null,
"ogTitle": null,
"ogImgId": null,
"twDescription": null,
"description": null,
"title": "weather Archives | KQED Science",
"ogDescription": null
},
"ttid": 371,
"slug": "weather",
"isLoading": false,
"link": "/science/tag/weather"
},
"science_2227": {
"type": "terms",
"id": "science_2227",
"meta": {
"index": "terms_1716263798",
"site": "science",
"id": "2227",
"found": true
},
"relationships": {},
"featImg": null,
"name": "atmospheric river",
"description": null,
"taxonomy": "tag",
"headData": {
"twImgId": null,
"twTitle": null,
"ogTitle": null,
"ogImgId": null,
"twDescription": null,
"description": null,
"title": "atmospheric river Archives | KQED Science",
"ogDescription": null
},
"ttid": 2239,
"slug": "atmospheric-river",
"isLoading": false,
"link": "/science/tag/atmospheric-river"
},
"science_2807": {
"type": "terms",
"id": "science_2807",
"meta": {
"index": "terms_1716263798",
"site": "science",
"id": "2807",
"found": true
},
"relationships": {},
"featImg": null,
"name": "Our Top 10 Stories of 2015",
"description": "[caption id=\"attachment_417388\" align=\"alignleft\" width=\"800\"]\u003cimg class=\"size-medium wp-image-417388\" src=\"https://ww2.kqed.org/science/wp-content/uploads/sites/35/2015/12/Chino-hills-storm-800x532.jpg\" alt=\"A storm approaching Chino Hills, California. \" width=\"800\" height=\"532\" /> A storm approaching Chino Hills, California.[/caption]\r\n\r\nA \u003ca href=\"https://ww2.kqed.org/science/2015/07/21/berkeley-corpse-flower-blooming-soon-in-all-its-disgusting-glory/\">stinking corpse flower\u003c/a>, \u003ca href=\"https://ww2.kqed.org/science/2015/11/27/ice-volcanoes-on-pluto-whats-next/\">ice volcanoes\u003c/a> and \u003ca href=\"https://ww2.kqed.org/science/2015/10/13/watch-flesh-eating-beetles-strip-bodies-to-the-bone/\">flesh-eating beetles\u003c/a> are a few of the natural phenomena we profiled this year. But El Niño, by far, topped our list of most popular coverage.\r\n\r\nFrom KQED Science's 200+ stories in 2015, we selected the 10 most viewed. Bookmark this page so you can return to them!",
"taxonomy": "series",
"headData": {
"twImgId": null,
"twTitle": null,
"ogTitle": null,
"ogImgId": null,
"twDescription": null,
"description": "[caption id=\"attachment_417388\" align=\"alignleft\" width=\"800\"] A storm approaching Chino Hills, California.[/caption] A stinking corpse flower, ice volcanoes and flesh-eating beetles are a few of the natural phenomena we profiled this year. But El Niño, by far, topped our list of most popular coverage. From KQED Science's 200+ stories in 2015, we selected the 10 most viewed. Bookmark this page so you can return to them!",
"title": "Our Top 10 Stories of 2015 Archives | KQED Science",
"ogDescription": null
},
"ttid": 2807,
"slug": "top-10",
"isLoading": false,
"link": "/science/series/top-10"
},
"science_2114": {
"type": "terms",
"id": "science_2114",
"meta": {
"index": "terms_1716263798",
"site": "science",
"id": "2114",
"found": true
},
"relationships": {},
"featImg": null,
"name": "flooding",
"description": null,
"taxonomy": "tag",
"headData": {
"twImgId": null,
"twTitle": null,
"ogTitle": null,
"ogImgId": null,
"twDescription": null,
"description": null,
"title": "flooding Archives | KQED Science",
"ogDescription": null
},
"ttid": 2125,
"slug": "flooding",
"isLoading": false,
"link": "/science/tag/flooding"
},
"science_787": {
"type": "terms",
"id": "science_787",
"meta": {
"index": "terms_1716263798",
"site": "science",
"id": "787",
"found": true
},
"relationships": {},
"featImg": null,
"name": "trees",
"description": null,
"taxonomy": "tag",
"headData": {
"twImgId": null,
"twTitle": null,
"ogTitle": null,
"ogImgId": null,
"twDescription": null,
"description": null,
"title": "trees Archives | KQED Science",
"ogDescription": null
},
"ttid": 794,
"slug": "trees",
"isLoading": false,
"link": "/science/tag/trees"
},
"science_42": {
"type": "terms",
"id": "science_42",
"meta": {
"index": "terms_1716263798",
"site": "science",
"id": "42",
"found": true
},
"relationships": {},
"featImg": null,
"name": "Physics",
"description": null,
"taxonomy": "category",
"headData": {
"twImgId": null,
"twTitle": null,
"ogTitle": null,
"ogImgId": null,
"twDescription": null,
"description": null,
"title": "Physics Archives | KQED Science",
"ogDescription": null
},
"ttid": 44,
"slug": "physics",
"isLoading": false,
"link": "/science/category/physics"
},
"science_1596": {
"type": "terms",
"id": "science_1596",
"meta": {
"index": "terms_1716263798",
"site": "science",
"id": "1596",
"found": true
},
"relationships": {},
"featImg": null,
"name": "fire season",
"description": null,
"taxonomy": "tag",
"headData": {
"twImgId": null,
"twTitle": null,
"ogTitle": null,
"ogImgId": null,
"twDescription": null,
"description": null,
"title": "fire season Archives | KQED Science",
"ogDescription": null
},
"ttid": 1605,
"slug": "fire-season",
"isLoading": false,
"link": "/science/tag/fire-season"
},
"science_113": {
"type": "terms",
"id": "science_113",
"meta": {
"index": "terms_1716263798",
"site": "science",
"id": "113",
"found": true
},
"relationships": {},
"featImg": null,
"name": "wildfire",
"description": null,
"taxonomy": "tag",
"headData": {
"twImgId": null,
"twTitle": null,
"ogTitle": null,
"ogImgId": null,
"twDescription": null,
"description": null,
"title": "wildfire Archives | KQED Science",
"ogDescription": null
},
"ttid": 117,
"slug": "wildfire",
"isLoading": false,
"link": "/science/tag/wildfire"
}
},
"userPermissionsReducer": {
"wpLoggedIn": false
},
"eventsReducer": {},
"fssReducer": {},
"tvDailyScheduleReducer": {},
"tvWeeklyScheduleReducer": {},
"tvPrimetimeScheduleReducer": {},
"tvMonthlyScheduleReducer": {},
"userAccountReducer": {
"user": {
"email": null,
"emailStatus": "EMAIL_UNVALIDATED",
"loggedStatus": "LOGGED_OUT",
"loggingChecked": false,
"articles": [],
"firstName": null,
"lastName": null,
"phoneNumber": null,
"fetchingMembership": false,
"membershipError": false,
"memberships": [
{
"id": null,
"startDate": null,
"firstName": null,
"lastName": null,
"familyNumber": null,
"memberNumber": null,
"memberSince": null,
"expirationDate": null,
"pfsEligible": false,
"isSustaining": false,
"membershipLevel": "Prospect",
"membershipStatus": "Non Member",
"lastGiftDate": null,
"renewalDate": null,
"lastDonationAmount": null
}
]
},
"authModal": {
"isOpen": false,
"view": "LANDING_VIEW"
},
"error": null
},
"youthMediaReducer": {},
"checkPleaseReducer": {
"filterData": {
"region": {
"key": "Restaurant Region",
"filters": [
"Any Region"
]
},
"cuisine": {
"key": "Restaurant Cuisine",
"filters": [
"Any Cuisine"
]
}
},
"restaurantDataById": {},
"restaurantIdsSorted": [],
"error": null
},
"userAgentReducer": {
"userAgent": "Mozilla/5.0 AppleWebKit/537.36 (KHTML, like Gecko; compatible; ClaudeBot/1.0; +claudebot@anthropic.com)",
"isBot": true
},
"requestOutcomesReducer": {
"notFound": []
},
"navPromosReducer": {
"isFetching": false,
"fetchFailed": false,
"hasFetched": true,
"promos": {
"news": {
"name": "2026 Voter Guide",
"link": "/voterguide",
"imageURL": "https://cdn.kqed.org/wp-content/uploads/2026/10/Nav-News-Nov2026ElectionCoverage@2x-7bd4aad4.png",
"description": "Get informed in minutes with our Voter Guide for California’s November 3 election."
},
"podcasts-radio": {},
"video-tv": {},
"events": {},
"support": {}
}
}
}