Heat kills people, even in the cool, coastal regions of California. Our investigation found that last year, two heat waves killed 14 people in the Bay Area, and sent hundreds more to the hospital. By our count, 79 percent of people who died started to experience heat illness at home.
This year, a team of reporters and producers, with consulting from scientists, placed sensors inside dozens of homes around the state. These measurements represent new information in California; no government agency has yet attempted to find out, as the climate warms, what levels of heat Californians actually experience in the place they spend most of their time – at home.
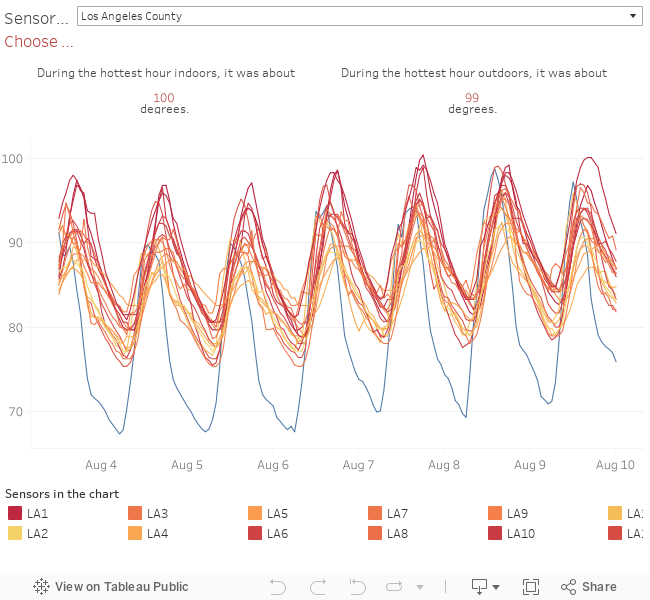
IT’S HOTTER INDOORS THAN OUT
Each red, yellow or orange line below represents one of the 31 homes where we measured heat in California. The blue line is outdoor temperature. You can hover over a curve to see the temperature and time, or click on a curve to show one home.
Sensors from Arizona State University/Mary Wright & David Hondula. Sensors placed by Molly Peterson, Osvaldo Pedroza and Miguel Vargas, and picked up by Peterson, Pedroza, Vargas, and Amel Ahmed. Data analysis by Peterson & Carolyn Thompson; visualization by Thompson with Peterson. Funded with a grant from the Resilience Journalism Fellowship at CUNY’s Graduate School of Journalism.
Why we placed sensors in homes
We know climate change is raising temperatures, especially at night. And we know some scientists spend a lot of time figuring out how much extra heat we get from all the concrete in urban areas – it’s called the heat island effect, and it makes a city core hotter than the surrounding area. But none of that shows exactly what people are experiencing in their homes, which is where they are likely to begin to feel sick from heat. We wanted to know what the heat was like at home, especially at night when people’s bodies need a chance to cool off.
How we found people who might be at risk
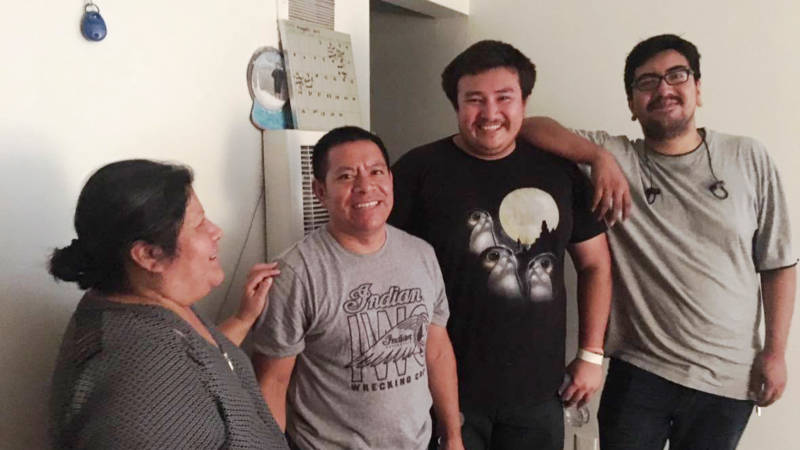
We did it with shoe leather and flyers. We looked for people who are medically vulnerable (elderly or with pre-existing conditions) and people who are socially vulnerable – who have no air conditioning, for example, and can’t afford to buy it. Some studies identify African-Americans, Latinos and immigrants as vulnerable. My brother-in-law translated a flyer into Korean; we did them in Spanish and Vietnamese, too. I became like a traveling salesman – emails, calls, flyers, senior centers, churches – no group too small to visit. Is there a name for driving all the way around the southern half of the bay in one day? That happened, too.
The result is thousands of points of data gathered over several months.
Our biggest finding
You can see in the graphic above that in every home, it’s hotter inside than outside, for a lot of the time.
We didn’t expect it would be that much hotter inside, and that frequently. It also surprised us that the heat was so stubborn, hanging on into the evening, as the sun dropped. Last, we didn’t expect it would be so much hotter in San Francisco SRO housing than it was outside: It was a very foggy summer in San Francisco, but it was very warm in there.
What we did to understand all the data
We did have a lot of it! Our little sensors took readings of temperature only, or temperature and humidity, inside 31 homes – 24 hours a day, over periods of 2 to 3½ weeks, in 10 cities and four counties. The blue iButton sensors we borrowed from Arizona State University recorded temperature and humidity every 10 minutes, and yellow ones recorded temperature every 20 minutes. Climatologists at ASU helped us retrieve the data from the sensors.
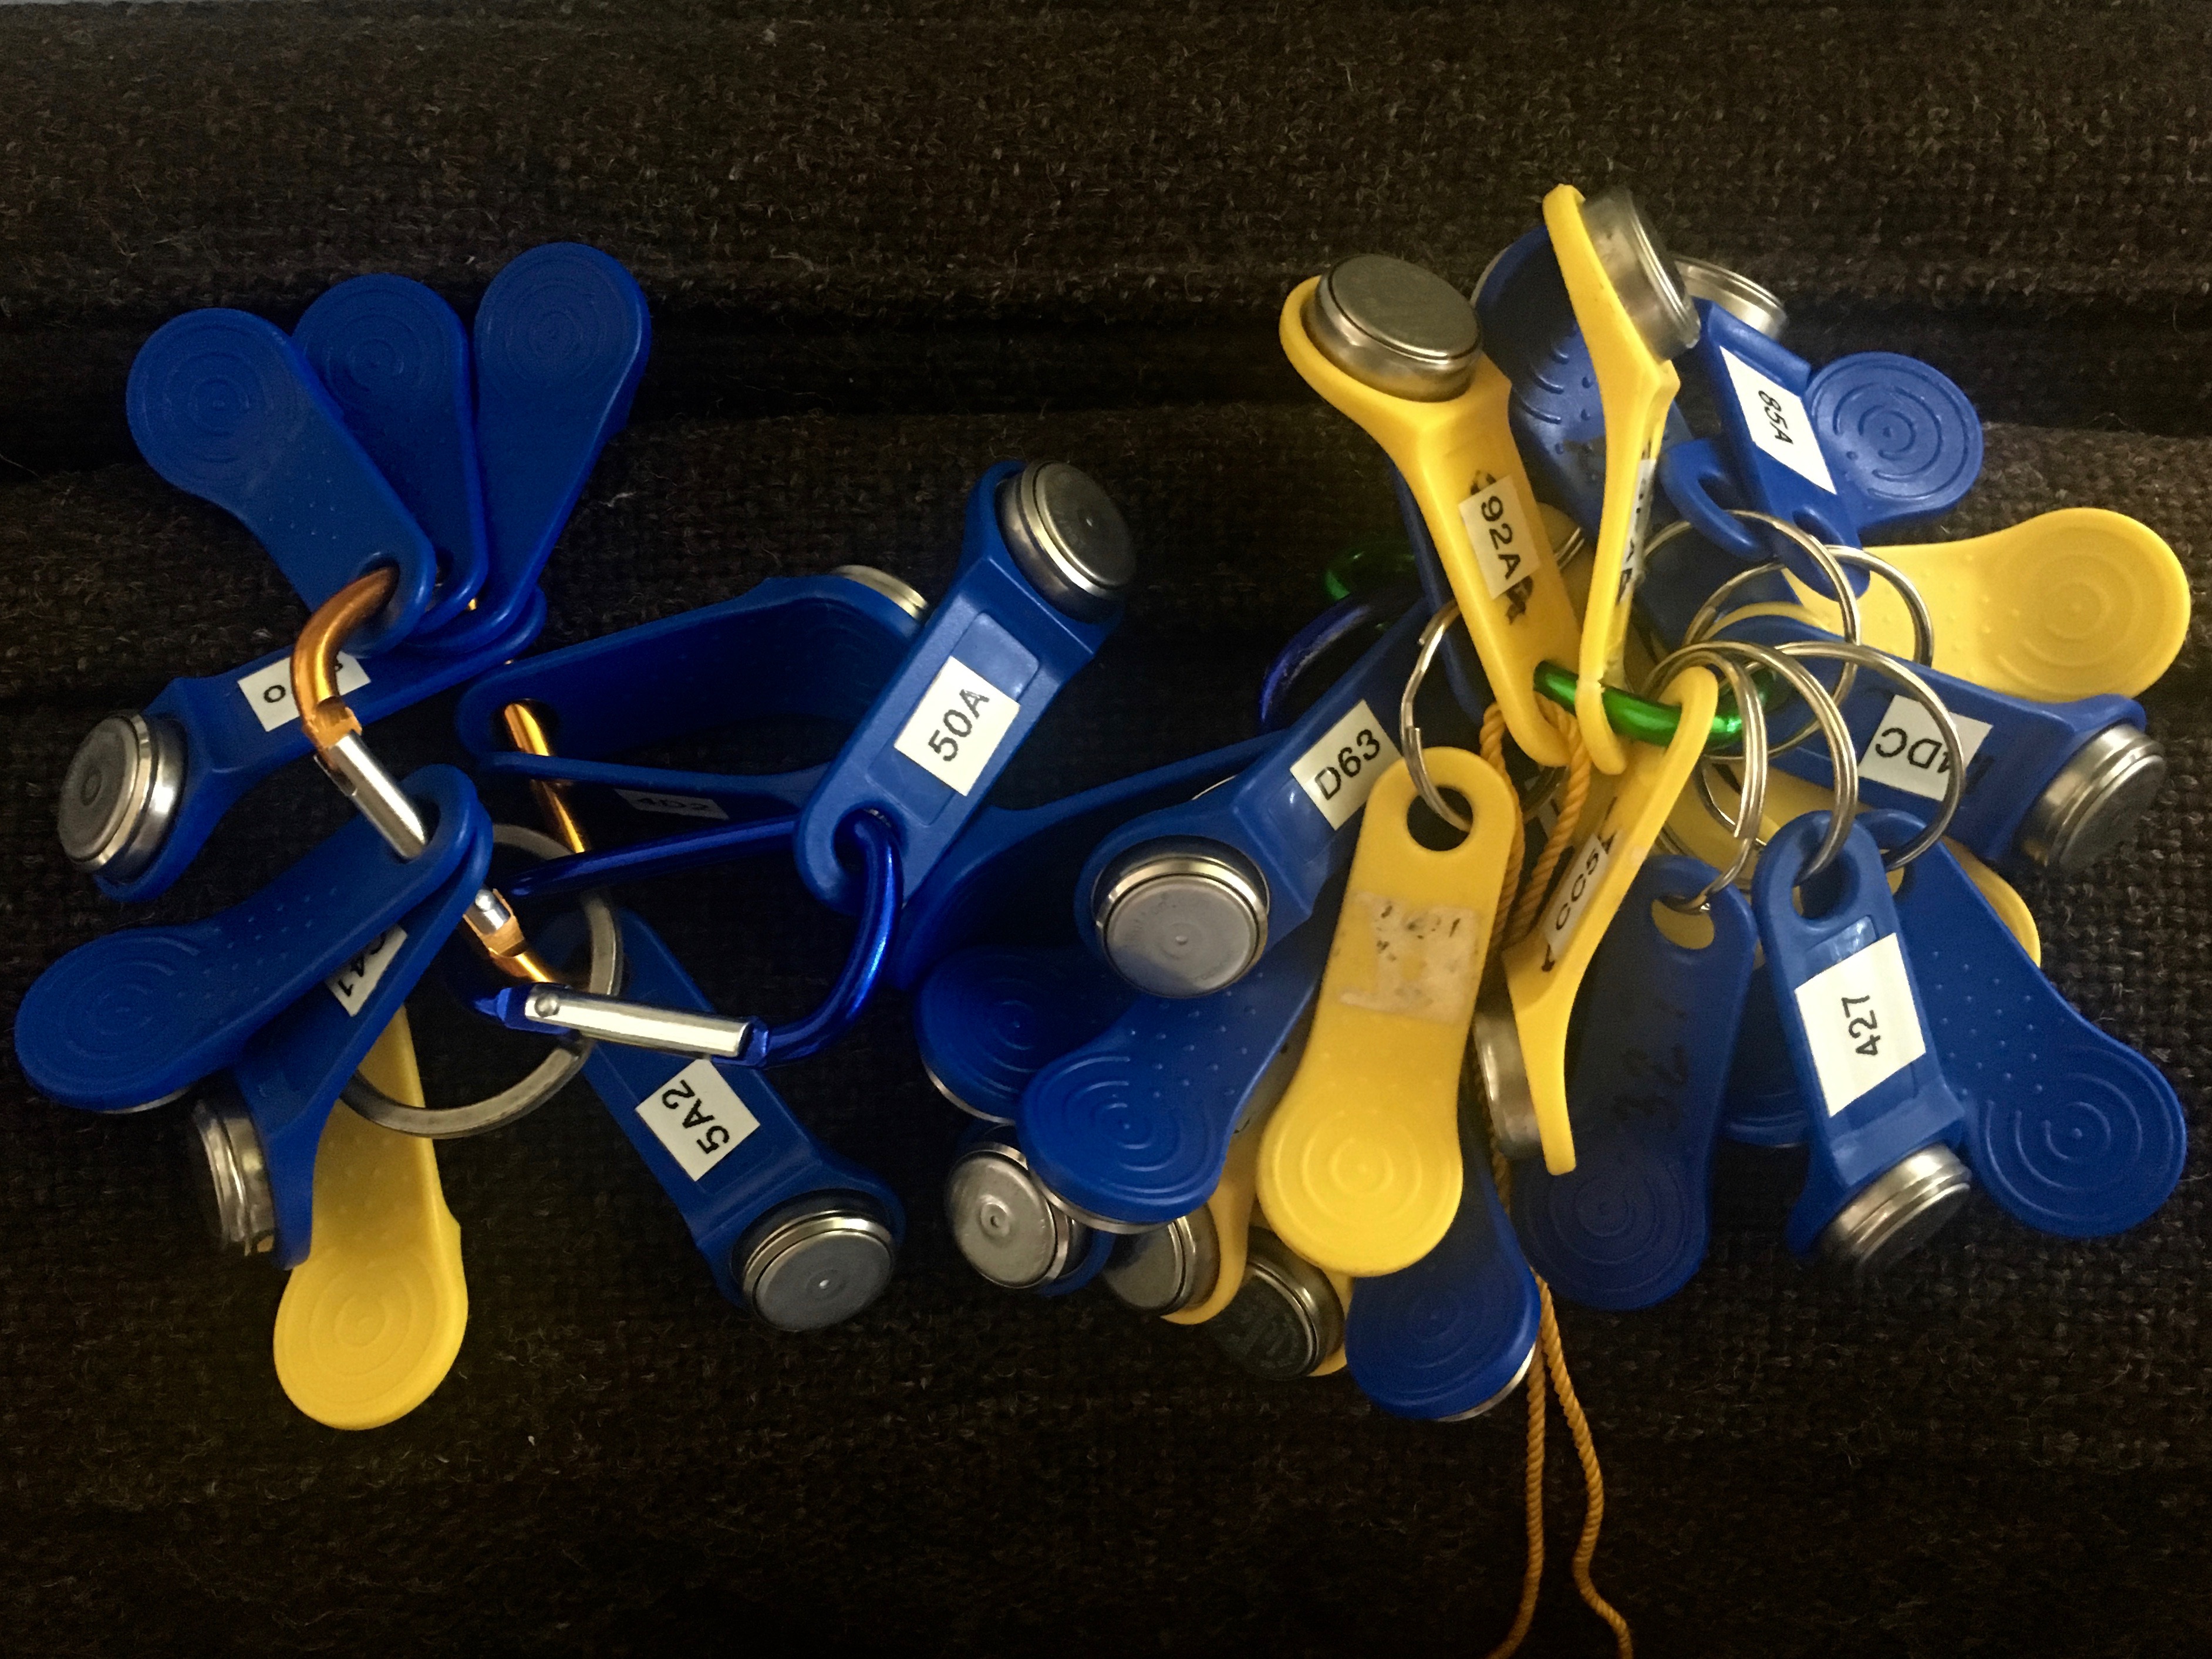
Then the data had to be edited, to reflect only the time inside homes and apartments, and not in transit, say, or in a car or airplane, or an overnight mail package. A Canadian data journalist named Carolyn Thompson helped analyze the measurements, and together we decided to calculate an average temperature for each hour, and then to visualize them.
What kinds of problems did you encounter?
It’s not news that people live in precarious housing circumstances in California. But we underestimated just how scared people might be if anything threatened the housing they have. After we put out flyers in various communities, particularly Santa Clara County, people would call, saying something along the lines of, “Heat is a real problem for me, but I can’t talk to you or even let you measure inside my home, because I don’t want my landlord to find out, and evict me.” A few people eventually agreed to let us know their names and measure in their apartments, but didn’t want to be identified in a story.
Why did you become interested in the threat of heat from climate change?
I want to think about climate problems people are feeling right now; I got tired of covering climate solutions that aren’t happening yet. When the 2006 heat wave killed people across the state, the state Office of Environmental Health Hazard Assessment released a study where they concluded that heat illness and death were undercounted, and it stuck with me. And, like most people in the Bay Area and a lot of people in Los Angeles, I don’t have central air conditioning. I love where I live, and I’ve been there for a while. But over the years, I’ve bought a window AC and installed a ceiling fan, and I noticed when my bills went up. I’ve got money to go to the movies, and a table under a tree where I can work when it’s too hot inside. But I wondered how other people were doing in the rising heat, and how it affected their health.
Editor’s Note: This reporting is supported by a grant from the USC Annenberg Center for Health Journalism Impact Fund.